


Características


¿Tienes alguna pregunta?
Recomendar


20 diapositivas
Nightshade Design Portfolio Presentation
The Design Portfolio Presentation Template offers 20 slides to showcase your creative work, including design briefs, elements, processes, and feedback. Perfect for professionals to highlight projects with a modern, vibrant layout. Fully editable and compatible with PowerPoint, Keynote, and Google Slides.


6 diapositivas
Trends and Forecast Through Data Analytics Presentation
Visualize growth trajectories and future performance with the Trends and Forecast Through Data Analytics Presentation. Featuring clean bar charts and segmented legends, this template is ideal for financial projections, sales trends, and business growth analysis. Fully editable in PowerPoint, Keynote, and Google Slides for seamless customization.


5 diapositivas
Experience-Based Smile Scorecard Presentation
Measure sentiment with ease using this Experience-Based Smile Scorecard slide. Designed with a vertical battery-style layout, each tier represents a distinct emotional level—from dissatisfied to happy. Ideal for visualizing user experiences, customer feedback, or service quality. Fully editable and compatible with PowerPoint, Canva, and Google Slides.


12 diapositivas
Quarterly Status Report Presentation
Crafted for clarity and impact, the Quarterly Status Report presentation template efficiently summarizes a period's achievements and insights. The opening slide immediately captivates the audience, clearly setting the stage for a comprehensive review. Subsequent slides meticulously organize critical data points, from financial forecasts to project milestones, allowing for a granular examination of past performance. The report not only reflects on the quarter's outcomes but also offers a well-defined path forward, with strategic recommendations and a thoughtful action plan. Concluding on a note of gratitude, the template acknowledges the audience's time and consideration, while the final credits slide ensures due recognition of all informational sources used throughout the presentation.


7 diapositivas
Budget Forecasting and Planning Infographic
The Budget Forecasting and Planning infographic template is designed to simplify financial planning and forecasting. It is compatible with PowerPoint, Google Slides, and Keynote. This set of slides offers a variety of charts, including bar graphs and dot matrices, to compare projected and actual budget figures over different periods. The template uses a color-coding system to differentiate between quarters or fiscal years, and it provides placeholders for detailed descriptions of budget items. It's an excellent tool for financial analysts, accountants, and business managers who need to present budget forecasts, variances, and financial strategies in a clear and visually engaging manner.


19 diapositivas
Eclipse Detailed Project Execution Plan Presentation
Get ready to wow your audience with this mesmerizing project plan template! With its captivating eclipse design, every slide exudes professionalism and creativity. Perfect for showcasing project objectives, timelines, and deliverables, this template will keep your viewers engaged from start to finish. Compatible with PowerPoint, Keynote, and Google Slides!


3 diapositivas
Triangle Diagram for Strategic Layers Presentation
Visualize interconnected processes or layered strategies with the Triangle Diagram for Strategic Layers Presentation. This slide features three dynamic triangle shapes arranged in a circular flow, perfect for representing cycles, frameworks, or pillars of a system. Each point includes space for a title, icon, and supporting text. Great for illustrating collaboration, dependencies, or strategic pillars. Compatible with PowerPoint, Keynote, and Google Slides.
25 diapositivas
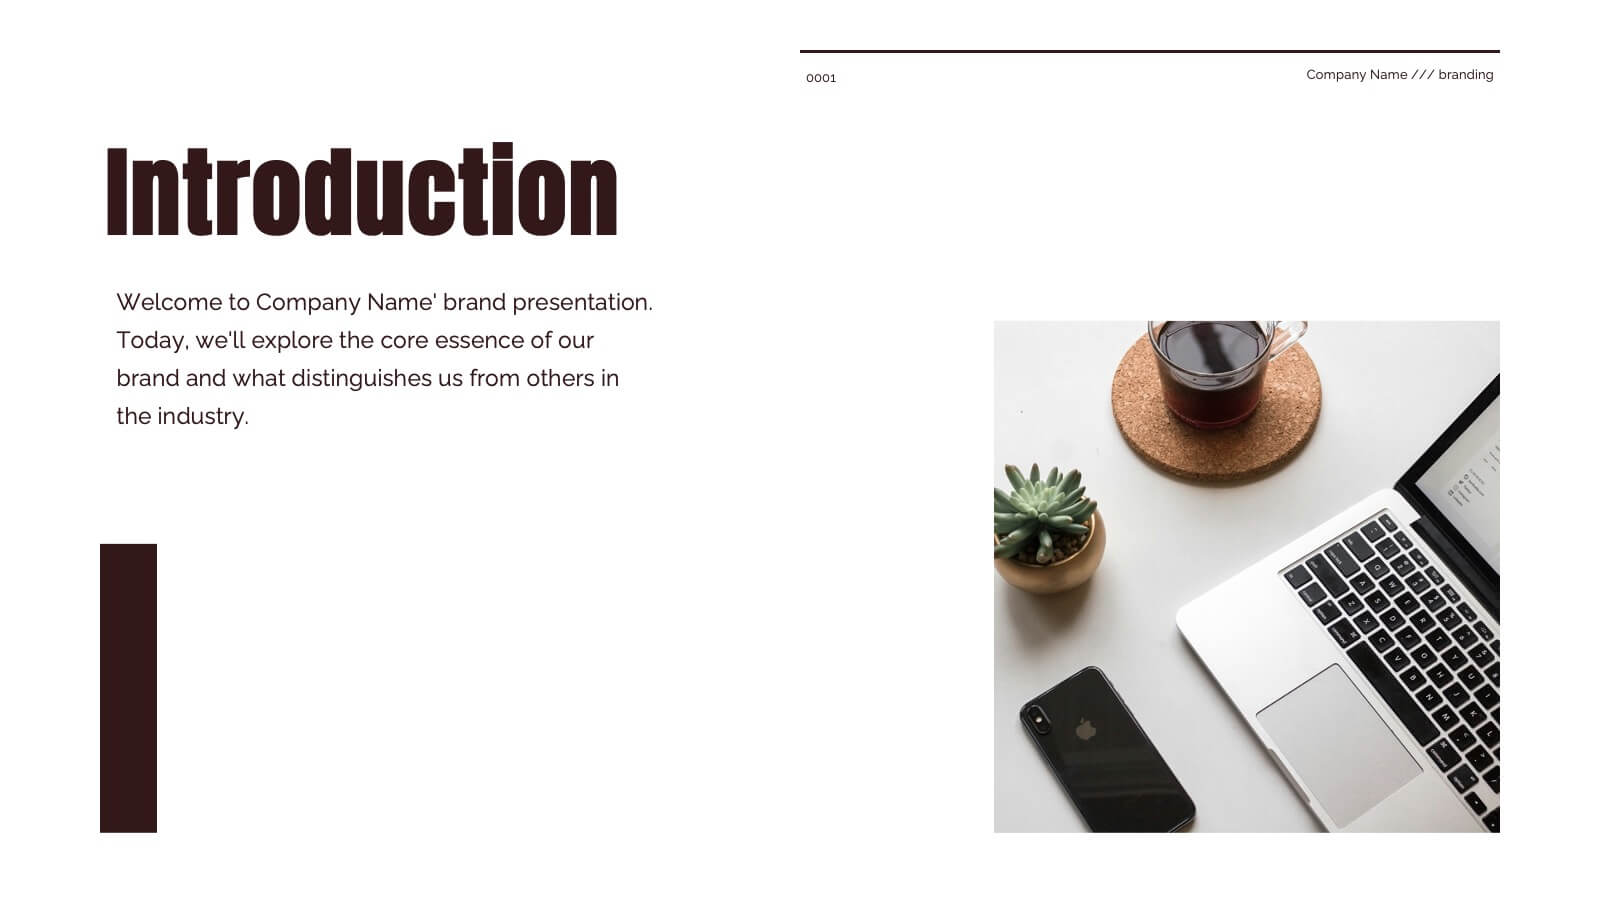
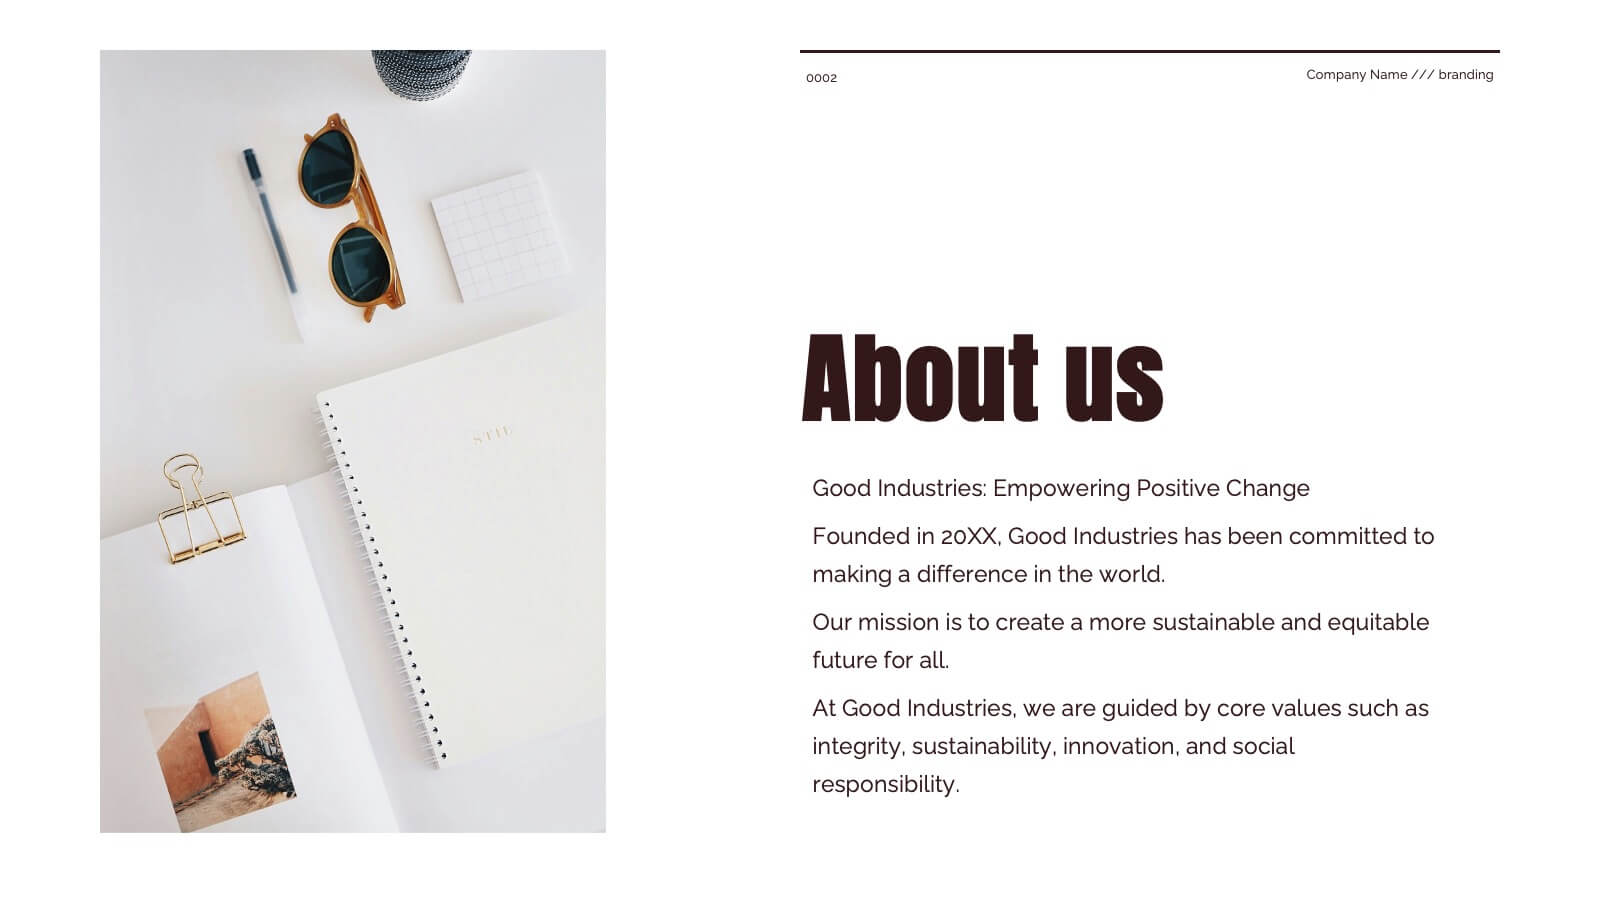
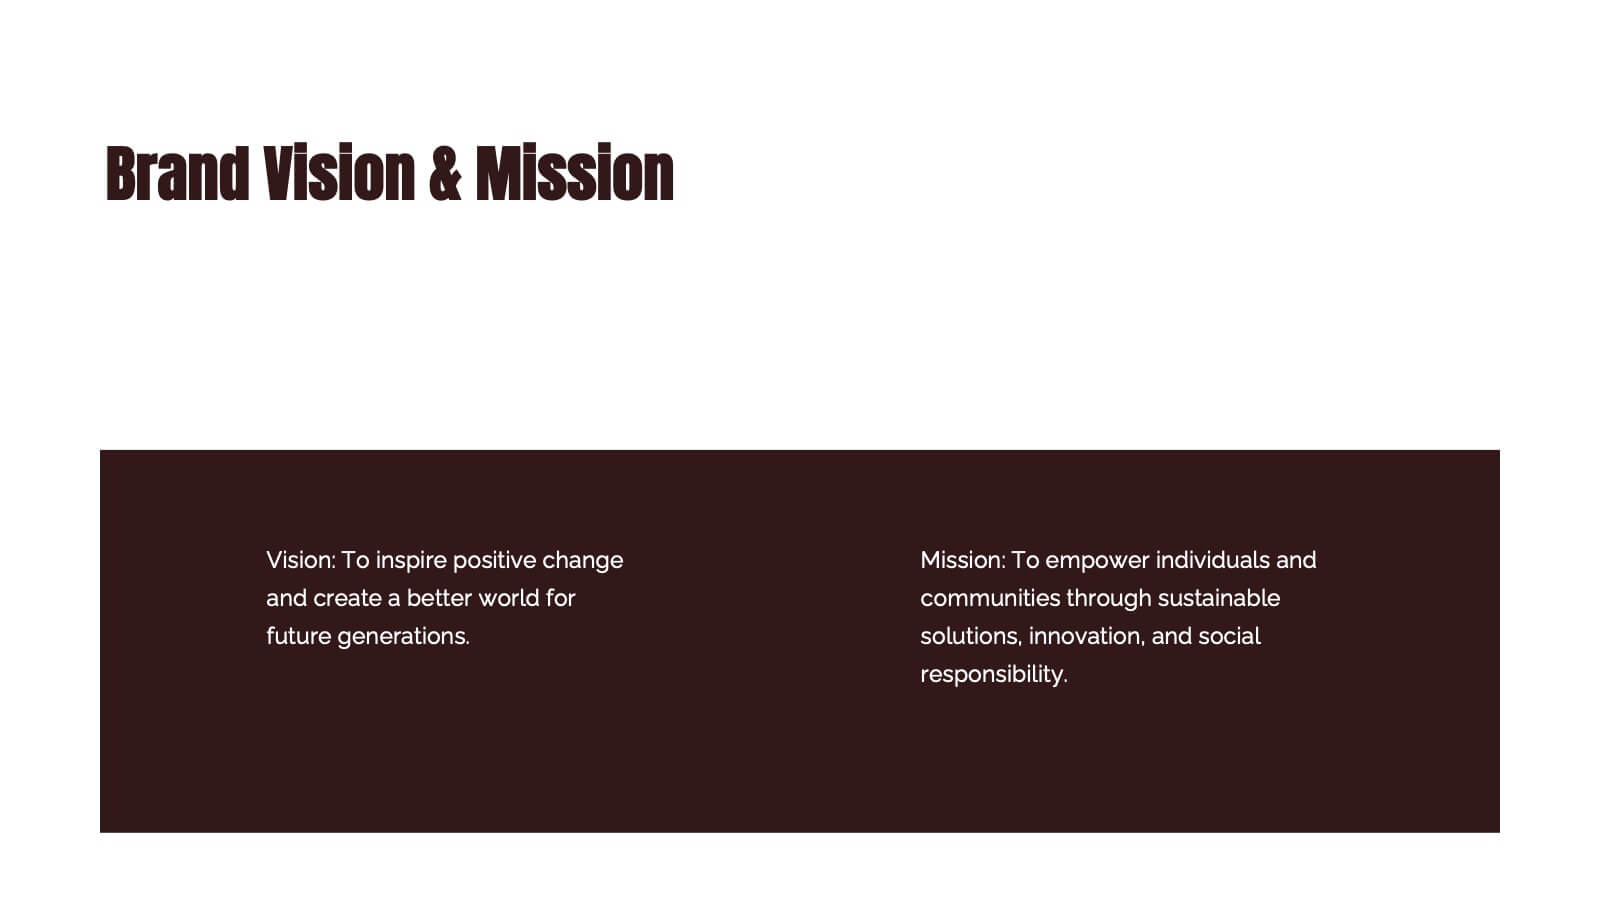
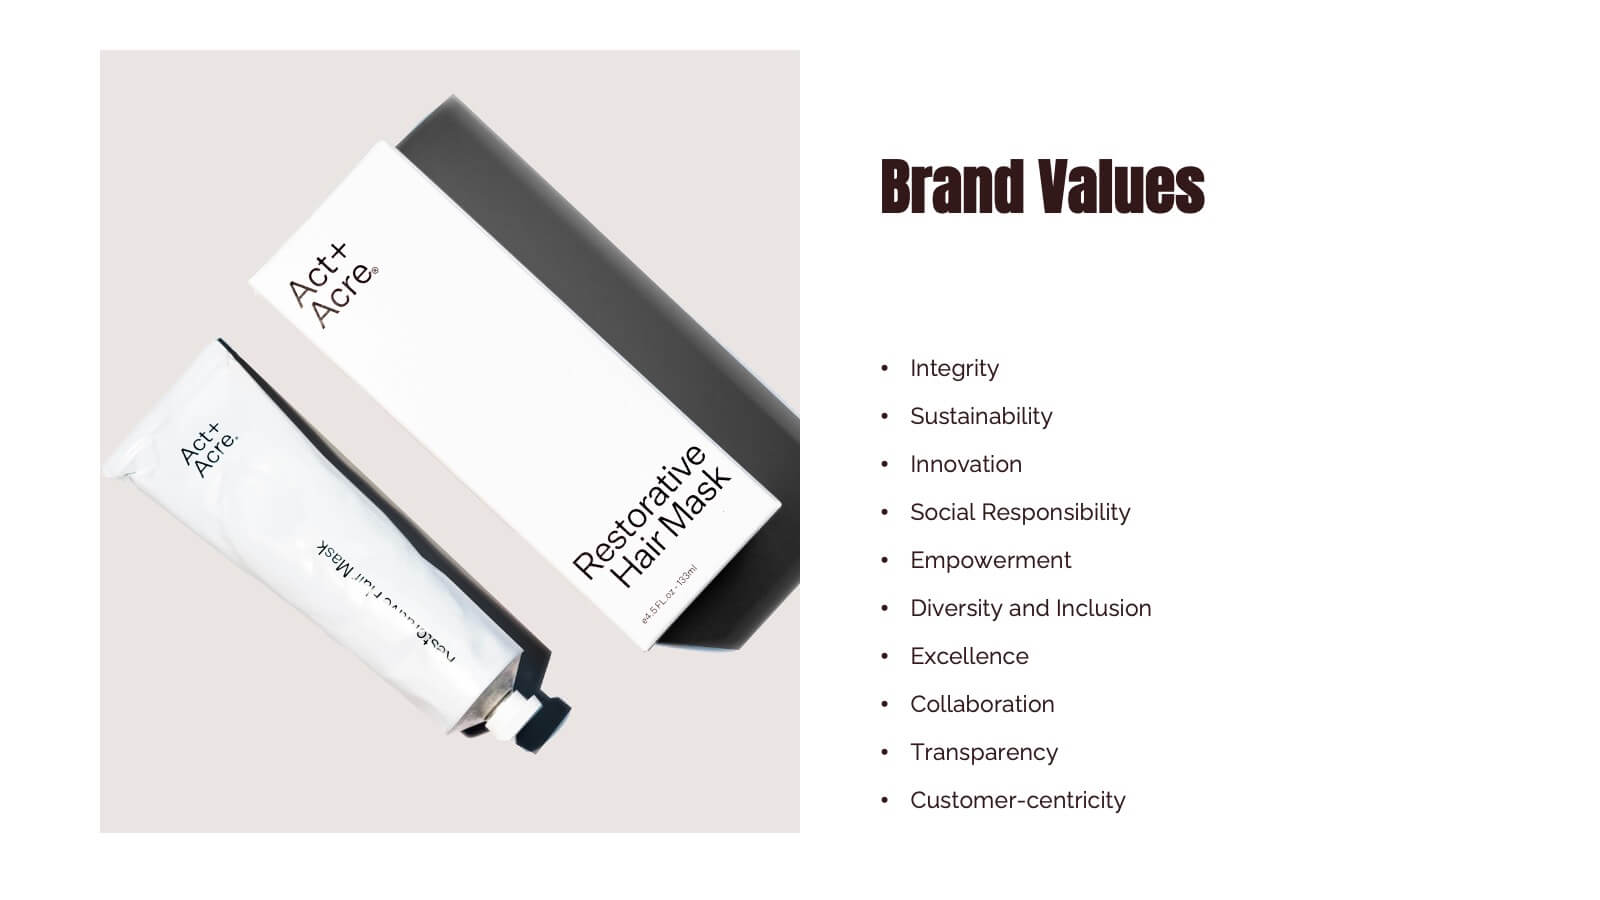
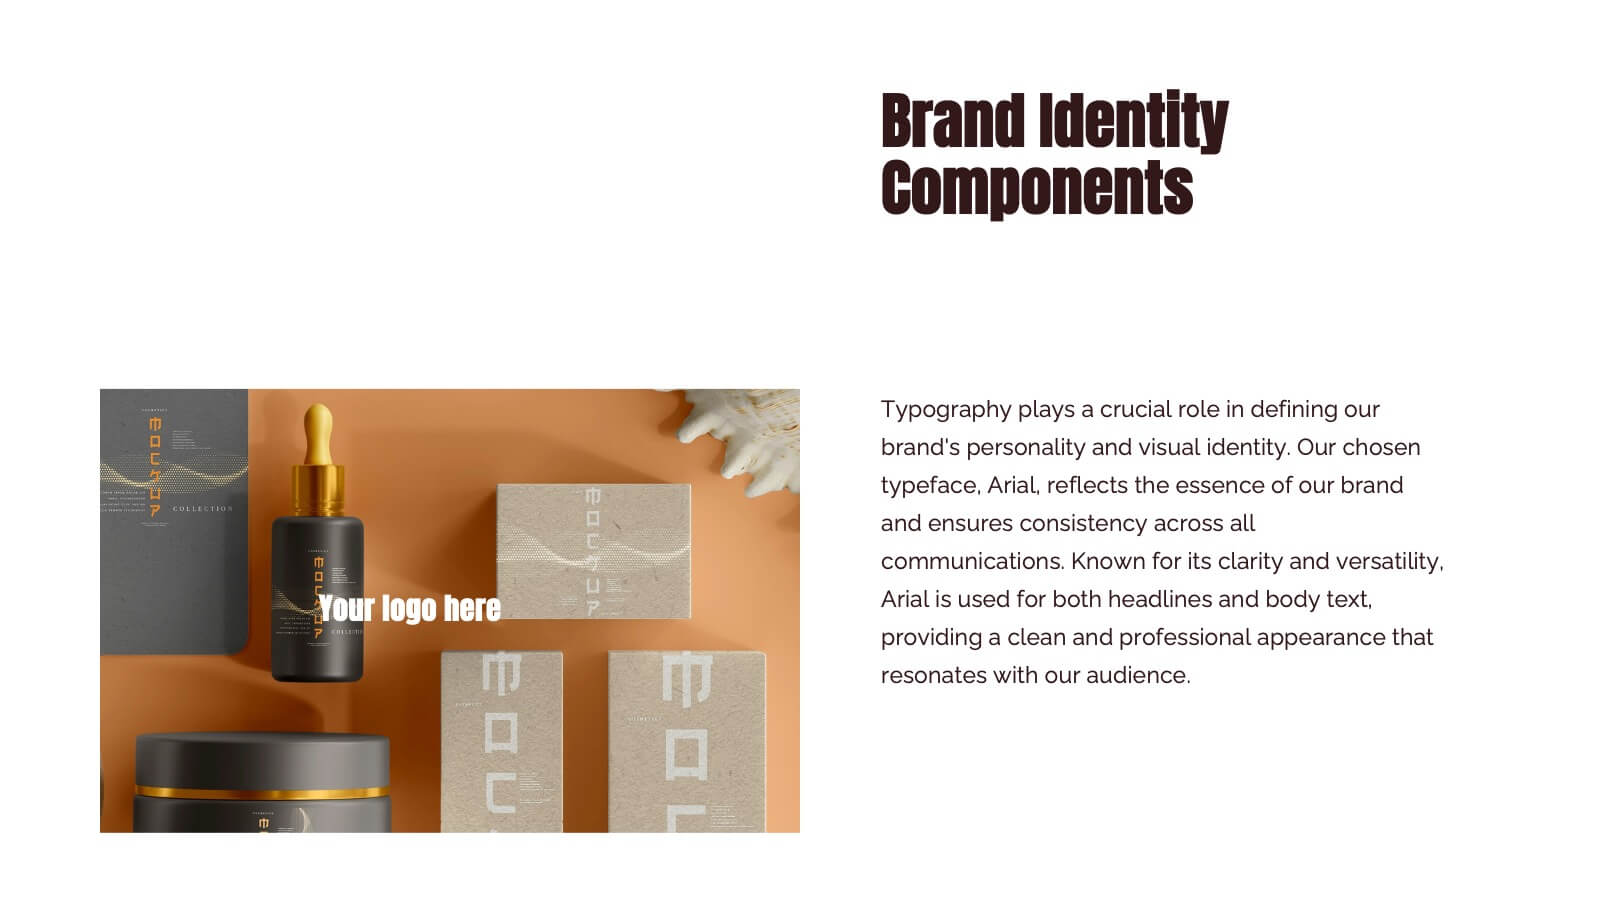
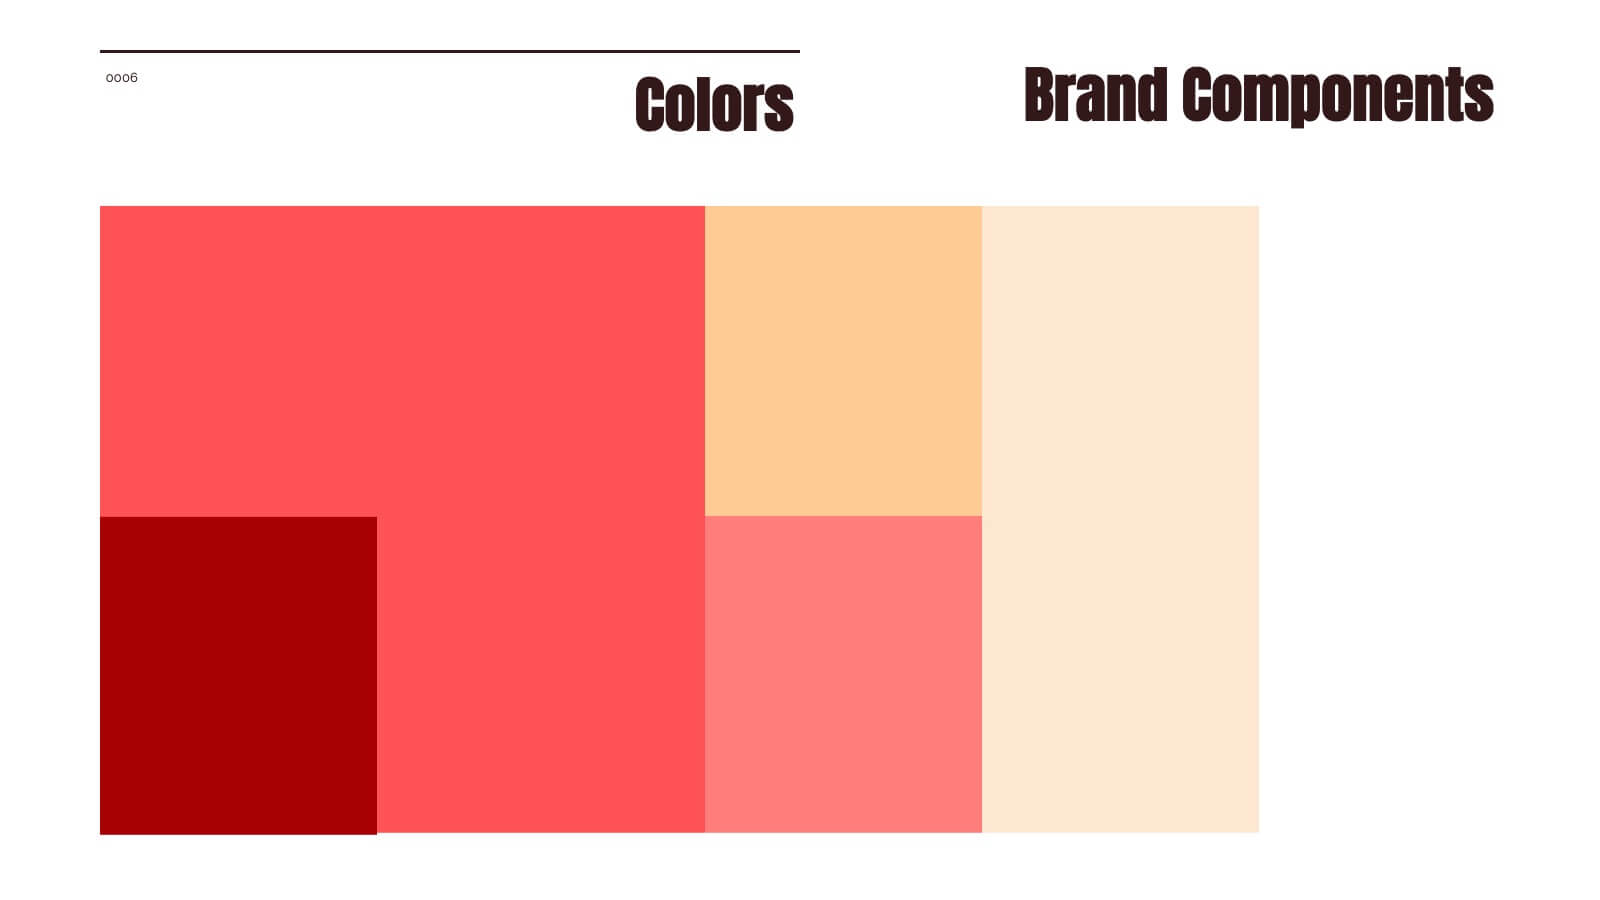
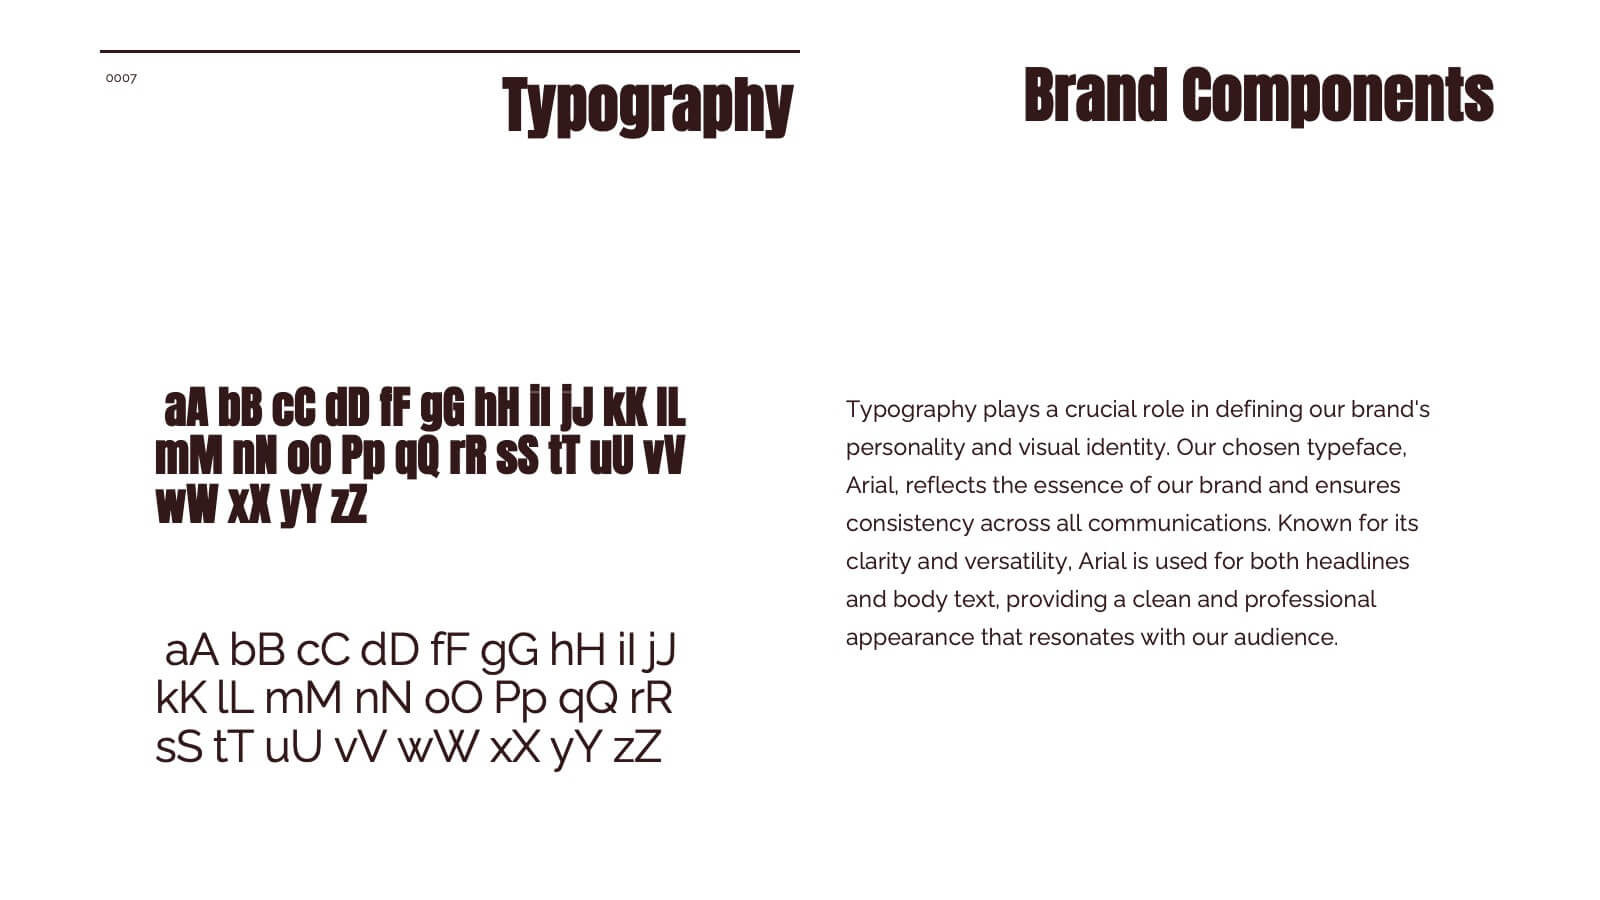
Blaze Brand Identity Presentation
Ignite your brand's potential with this vibrant, blaze-inspired presentation! Ideal for showcasing your brand identity, this template highlights key elements like logo design, color palette, and brand messaging with bold visuals and a modern layout. Perfect for making your brand stand out. Compatible with PowerPoint, Keynote, and Google Slides.


21 diapositivas
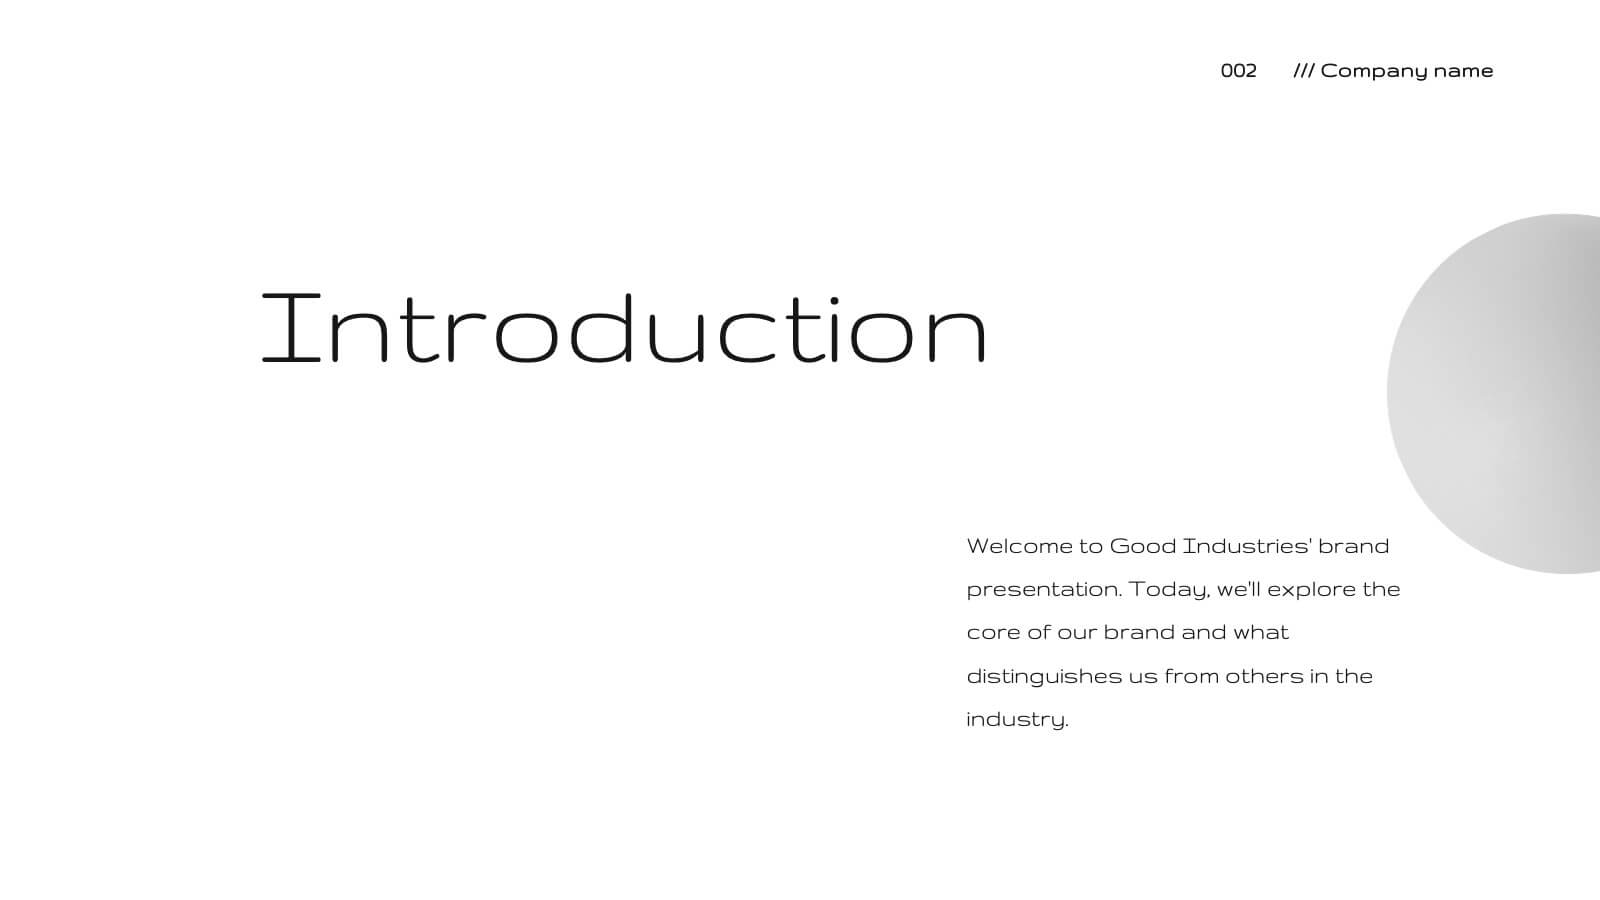
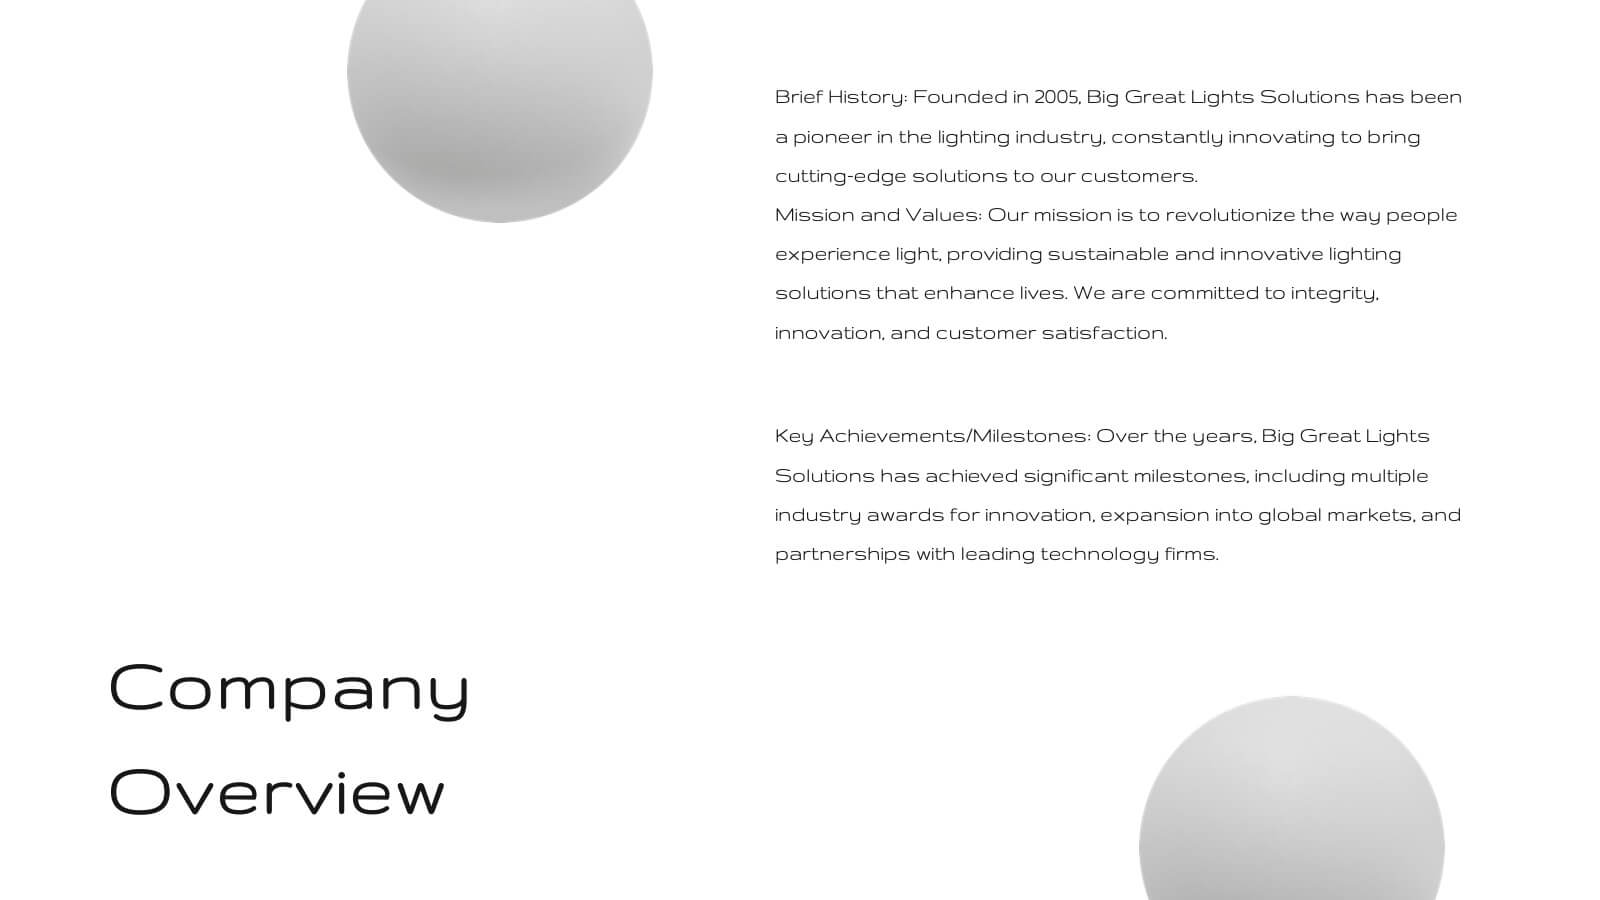
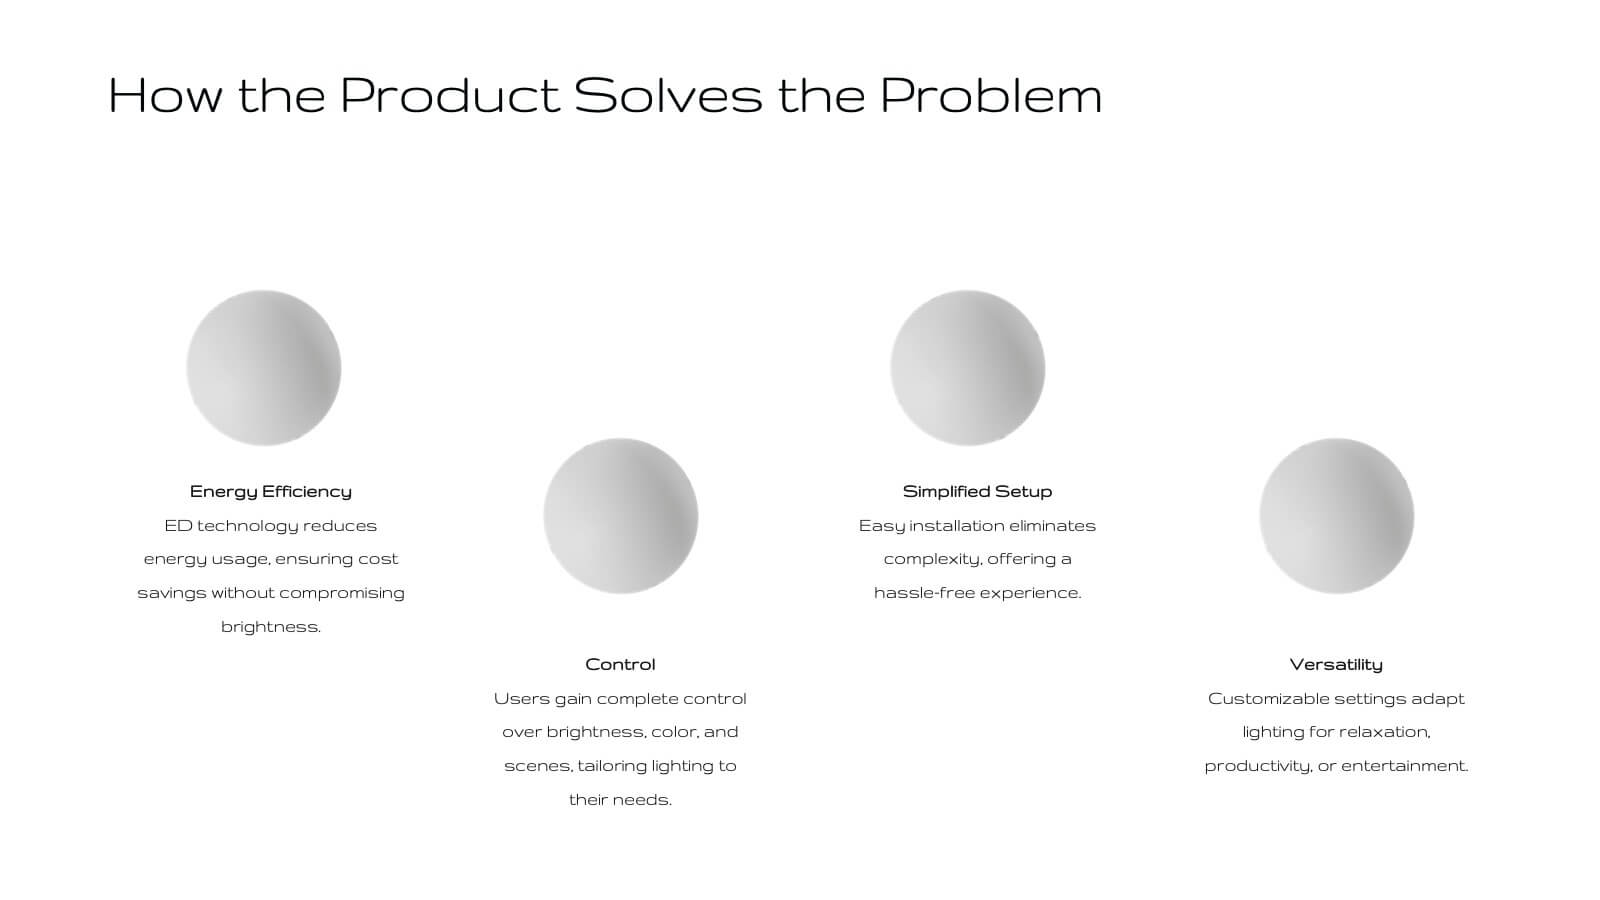
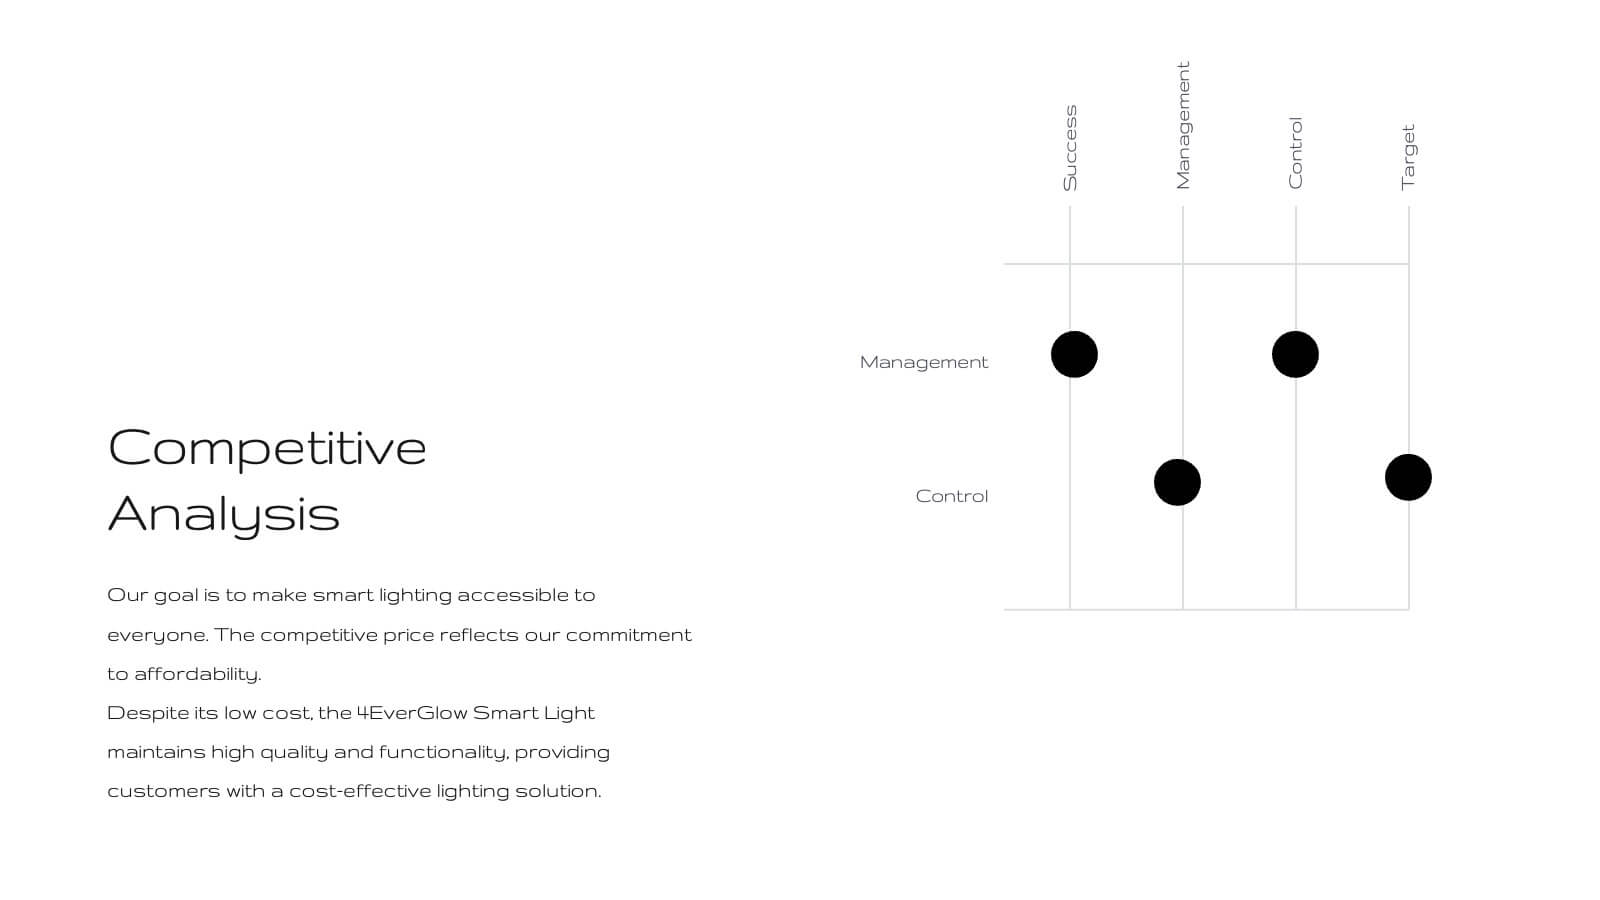
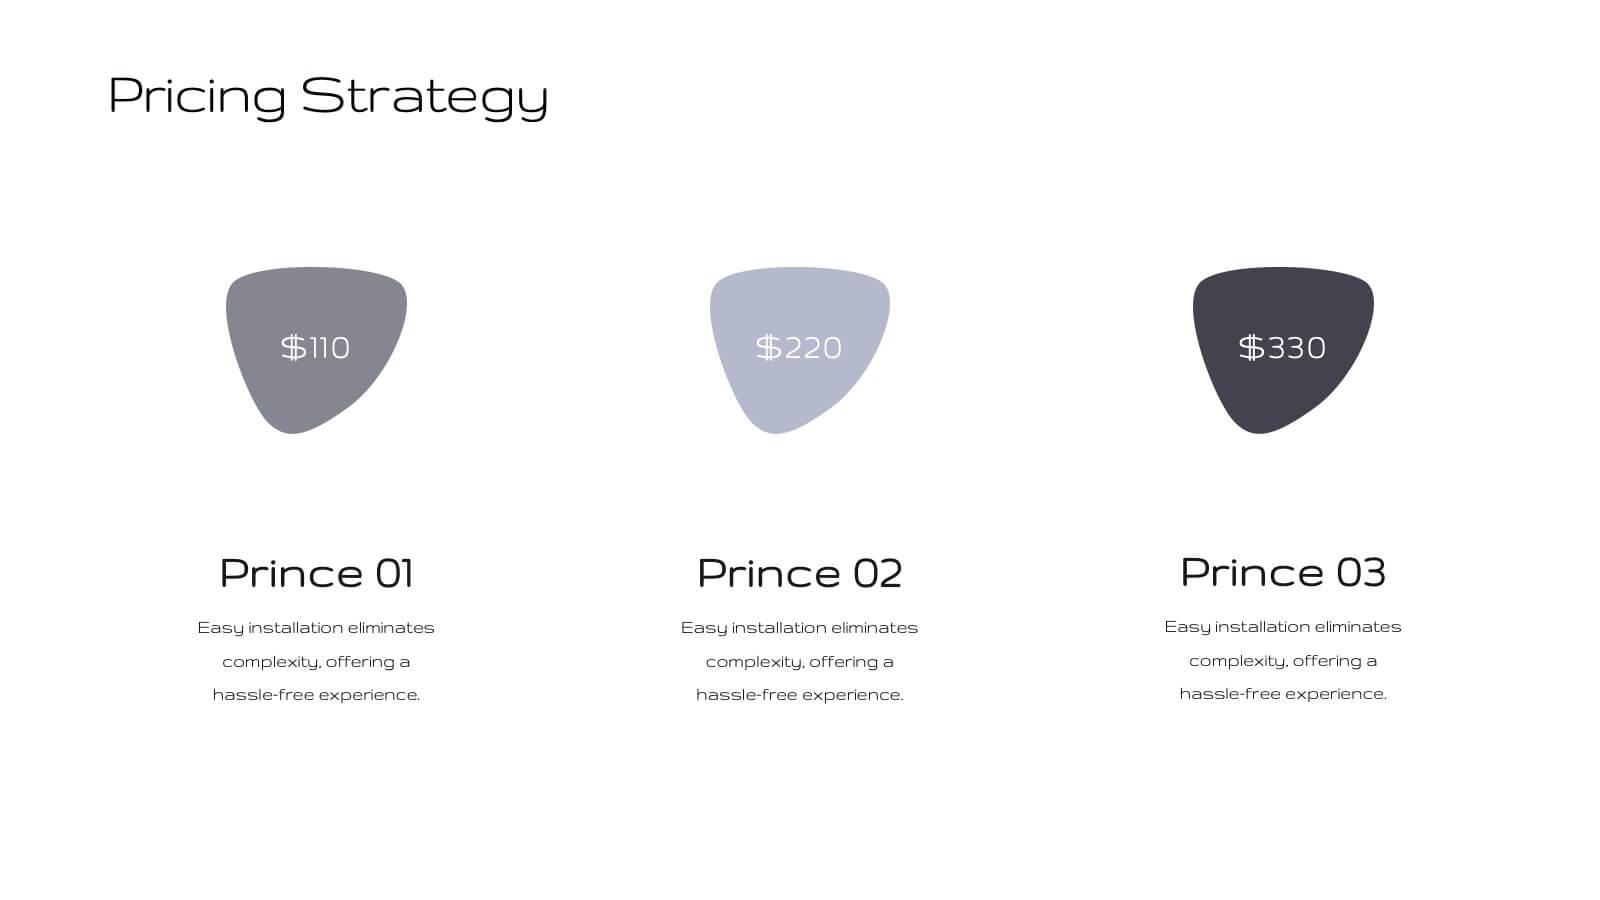
Fortuna Product Development Plan Presentation
Unveil your product's potential with this elegant, minimalist presentation template. Perfect for detailing product development, features, and market strategies, it features a clean design that emphasizes clarity and professionalism. Highlight key aspects like customer pain points, competitive analysis, and pricing strategies to captivate your audience. Compatible with PowerPoint, Keynote, and Google Slides, it ensures seamless presentations on any platform.


7 diapositivas
Medical Group Infographic
introducing our medical group infographic, a seamless blend of clinical precision and informative clarity. Designed predominantly in a calming palette of white and healing green, this infographic effectively encapsulates the diverse facets of a medical group. Through a series of graphics, specialized medical icons, and dedicated image placeholders, one can effortlessly convey intricate medical processes or healthcare strategies. This template is ideally suited for healthcare administrators, medical educators, hospital marketing teams, and anyone striving to present complex medical group data in a simplified, digestible manner.


5 diapositivas
Human Resource Functions Infographics
Illuminate the complexities of people management with our human resource functions infographics template. Cast in the professional yet warm palette of black, orange, pink, and red, this template is an essential tool for HR professionals, corporate trainers, and business leaders. It elegantly dissects various HR realms with its sleek graphics, intuitive icons, and dedicated image placeholders, making it perfect for showcasing recruitment processes, employee engagement strategies, or organizational culture principles. Its creative, vertical style is designed to hold the attention and fuel the imagination, turning any HR presentation into a compelling narrative.


6 diapositivas
Safety Department Infographics
Promote safety awareness with our Safety Department infographic template. This template is fully compatible with popular presentation software like PowerPoint, Keynote, and Google Slides, allowing you to easily customize it to illustrate and communicate the role and functions of a safety department within an organization. The Safety Department infographic template offers a visually engaging platform to highlight the responsibilities, goals, and initiatives of a safety department. Whether you're a safety officer, HR professional, business leader, or interested in workplace safety, this template provides a user-friendly canvas to create informative presentations and educational materials. Enhance safety practices and awareness with this SEO-optimized Safety Department infographic template, thoughtfully designed for clarity and ease of use. Customize it to showcase safety protocols, training programs, incident reporting, and the importance of a safety-focused culture, ensuring that your audience understands the critical role of the safety department. Start crafting your personalized infographic today to promote a safer work environment.


6 diapositivas
Project Governance Plan Presentation
Bring clarity and energy to your workflow with this engaging presentation that visually breaks down key steps, responsibilities, and milestones in a structured process. Its clean layout helps audiences quickly understand project priorities and decision paths. Perfect for strategy meetings and stakeholder updates. Fully compatible with PowerPoint, Keynote, and Google Slides.


5 diapositivas
Innovation with Design Thinking Framework
Boost creativity and problem-solving with the Innovation with Design Thinking Framework Presentation. This slide features a vertically stacked rocket diagram symbolizing the five key phases of design thinking—perfect for illustrating iterative innovation processes. Each level includes editable text and icons, helping you align stakeholders around empathy, ideation, and prototyping. Ideal for workshops, innovation teams, educators, or product development presentations. Fully customizable in PowerPoint, Keynote, and Google Slides.


5 diapositivas
Scrum Team Roles Presentation
A clear, engaging layout brings this presentation to life, making it easy to explain how each role contributes to a productive, collaborative workflow. Designed to simplify complex team structures, it helps you communicate responsibilities with confidence and clarity. Fully compatible with PowerPoint, Keynote, and Google Slides.


5 diapositivas
Water Sustainability & Resource Use Presentation
Visualize environmental impact with this unique cloud-and-rainfall diagram layout. Ideal for presenting five key points related to sustainability, resource management, or water usage. Each droplet icon guides attention across your content clearly. Fully editable and compatible with PowerPoint, Keynote, and Google Slides for effortless customization and impactful storytelling.


7 diapositivas
Environmental Planning Infographic Presentation
Environmental infographics are an essential tool in raising awareness about the state of the environment and the impact of human activities on the planet. This template presents a broad range of data text on the environment for you to input. Use this eye-catching infographic design to educate and raise awareness about the environment. This template is ideal to give an overview of the topic, its importance and the main issues. Stay on track using facts and figures, good visuals and data visualizations. This presentation is easy to use and can be edited in Powerpoint, Keynote or Google Slides.