


Características


¿Tienes alguna pregunta?
Recomendar


5 diapositivas
Types of Natural Disasters Infographics
Immerse in the dynamic realm of nature with our types of natural disasters infographics. Utilizing an earthy color scheme of blue, tan, and red, this template plunges viewers into the heart of environmental extremities. It's an invaluable resource for educators, students, and environmentalists. Compatible with Powerpoint, Keynote, and Google Slides. The design, brimming with creative vigor, incorporates striking graphics and icons, offering a vivid exploration of the various forces that shape our planet. This compilation doesn't just inform but captivates, turning statistics and data into compelling storytelling.


22 diapositivas
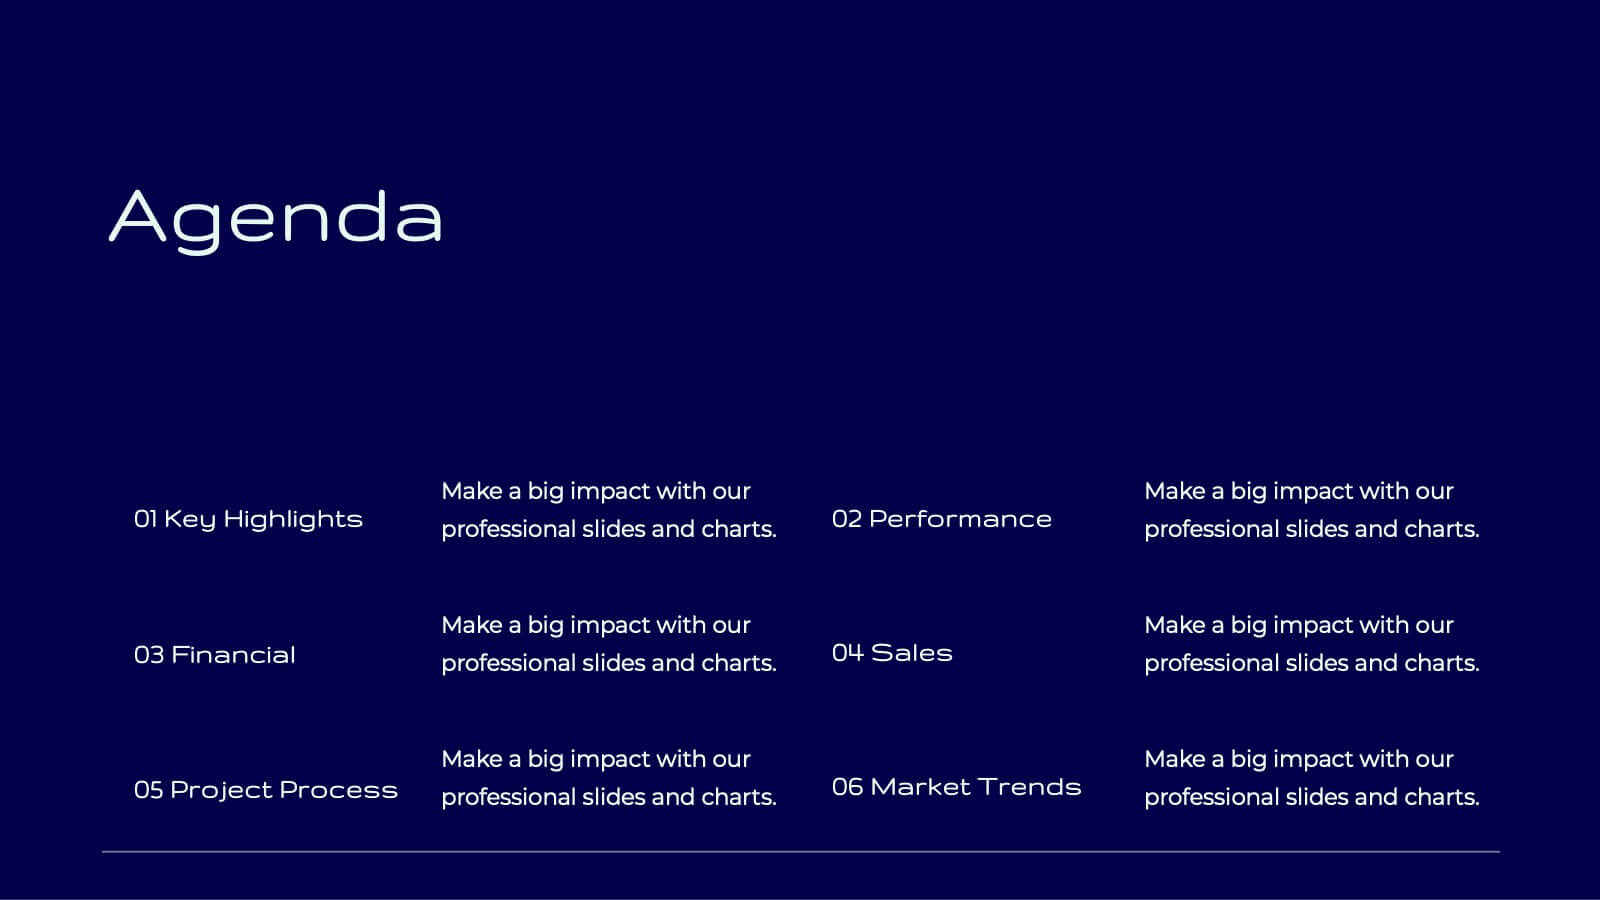
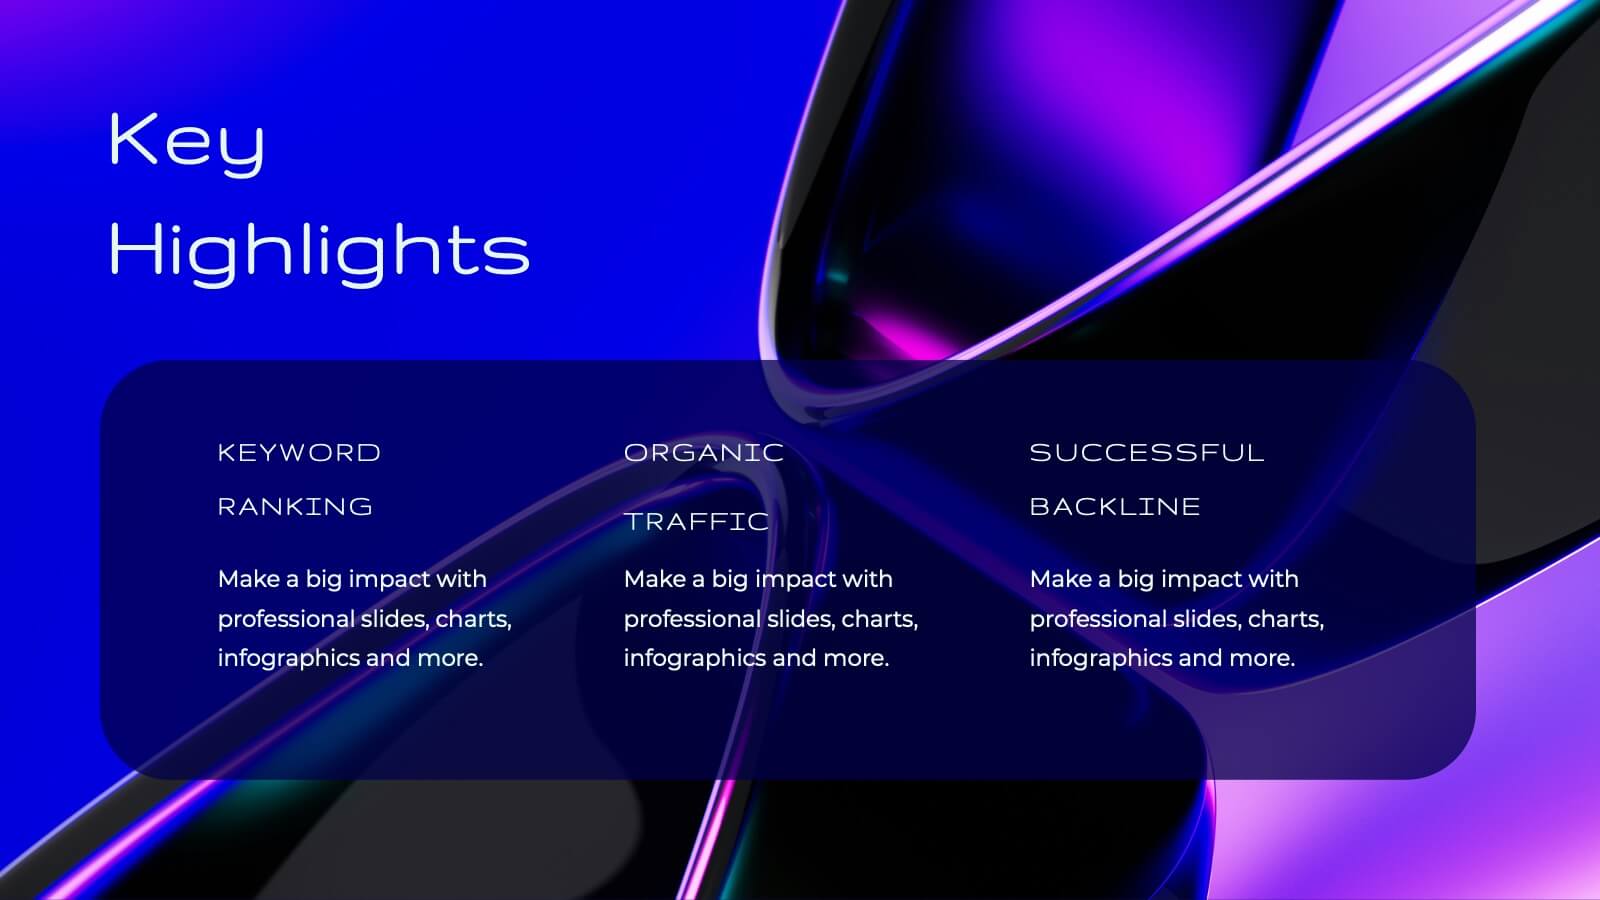
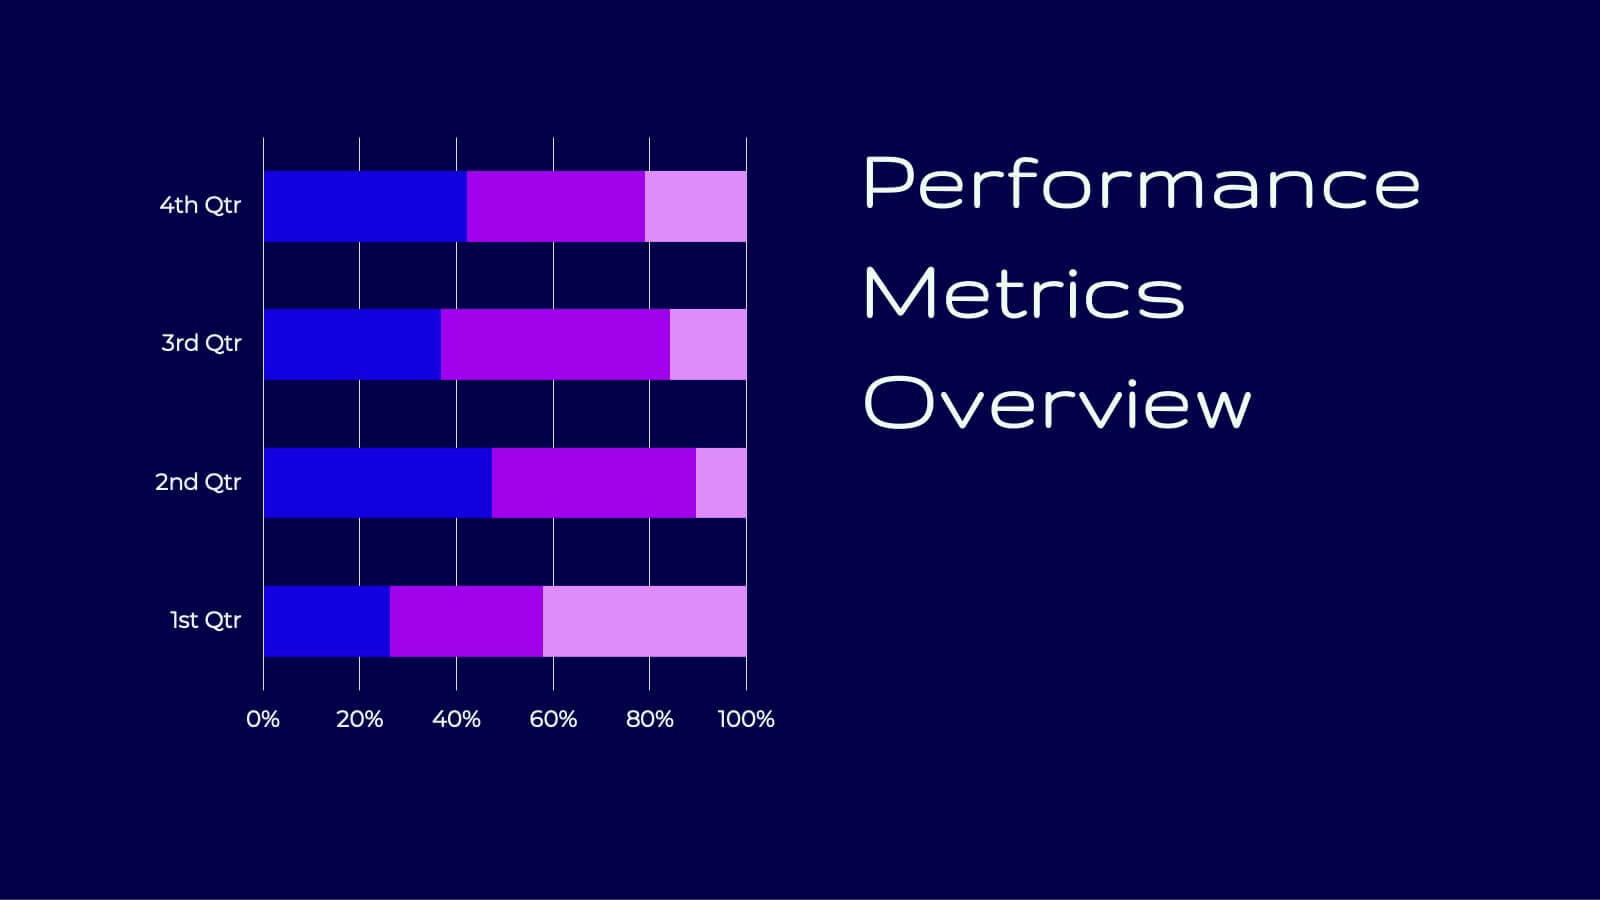
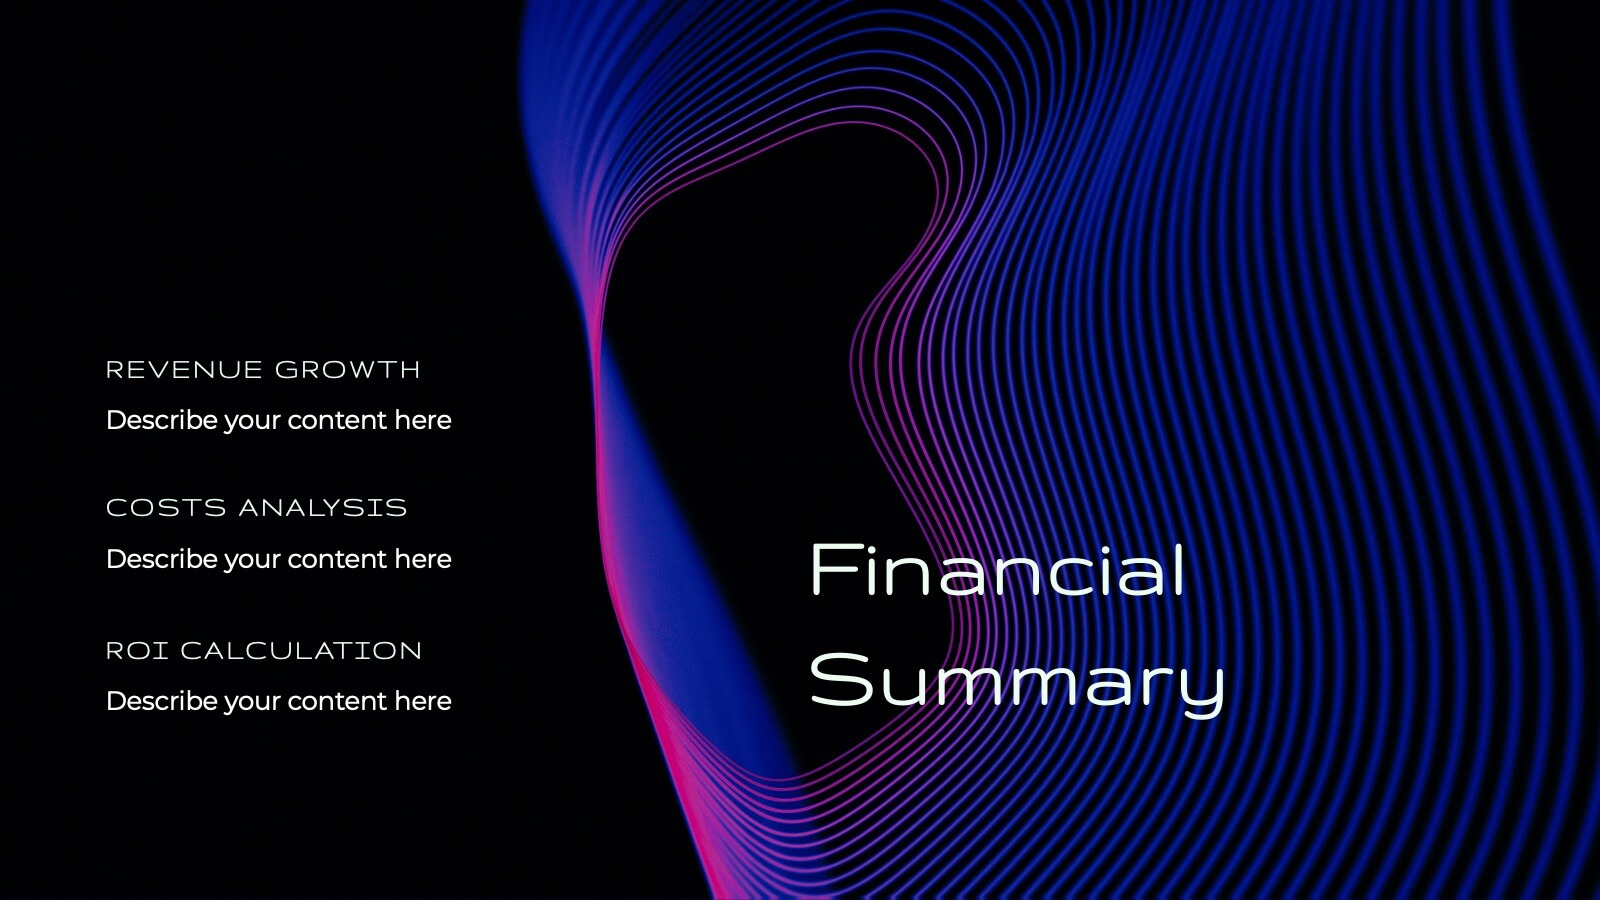
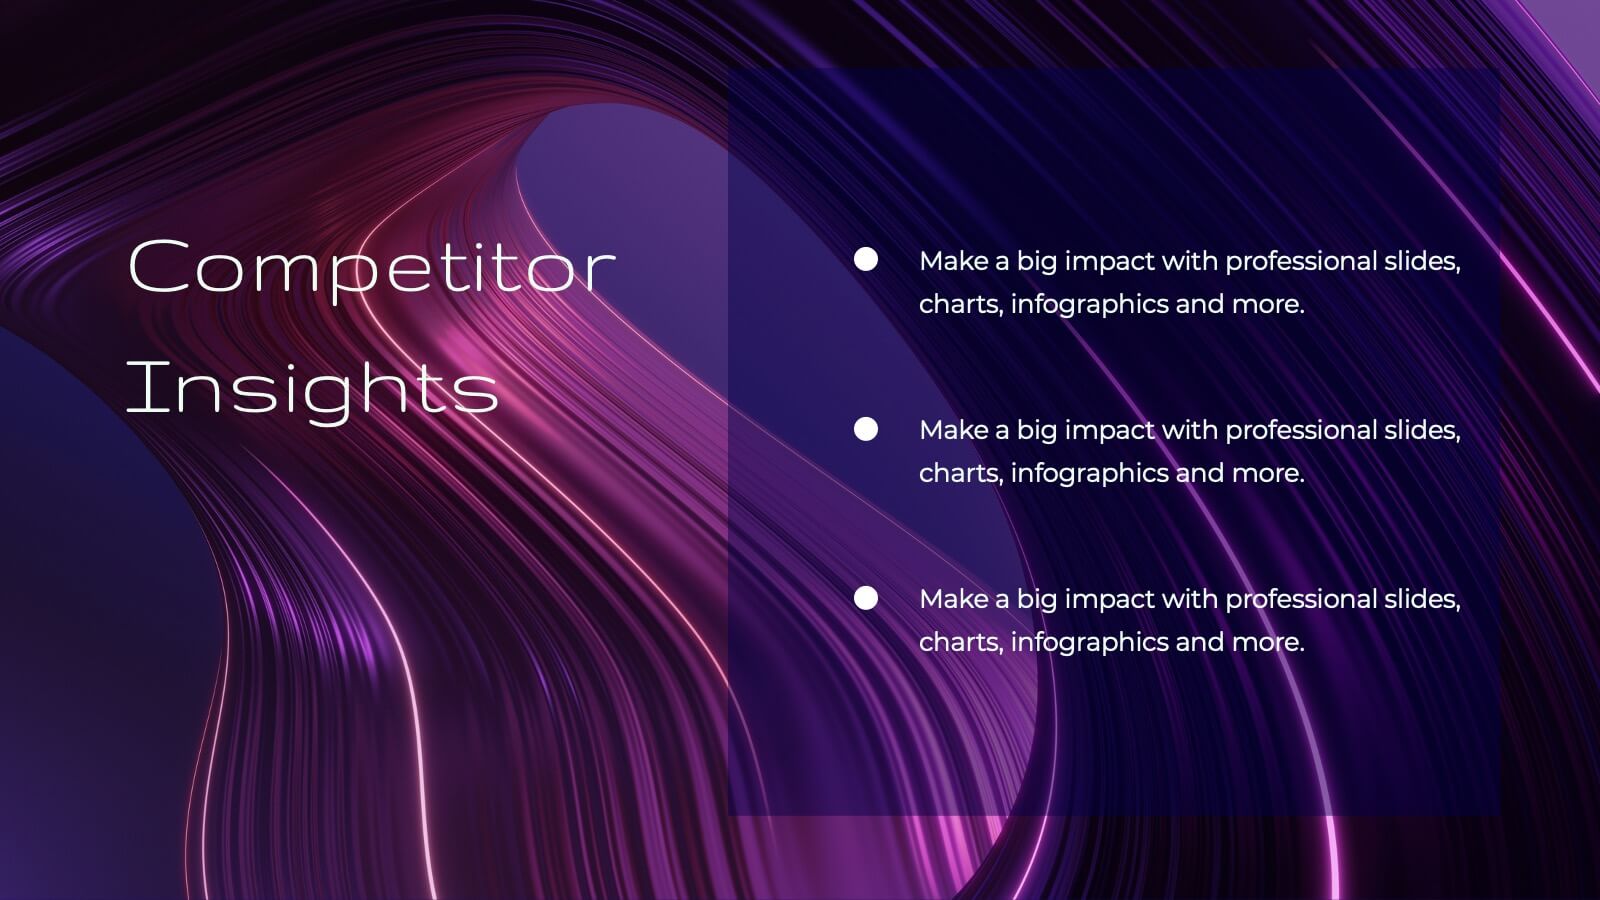
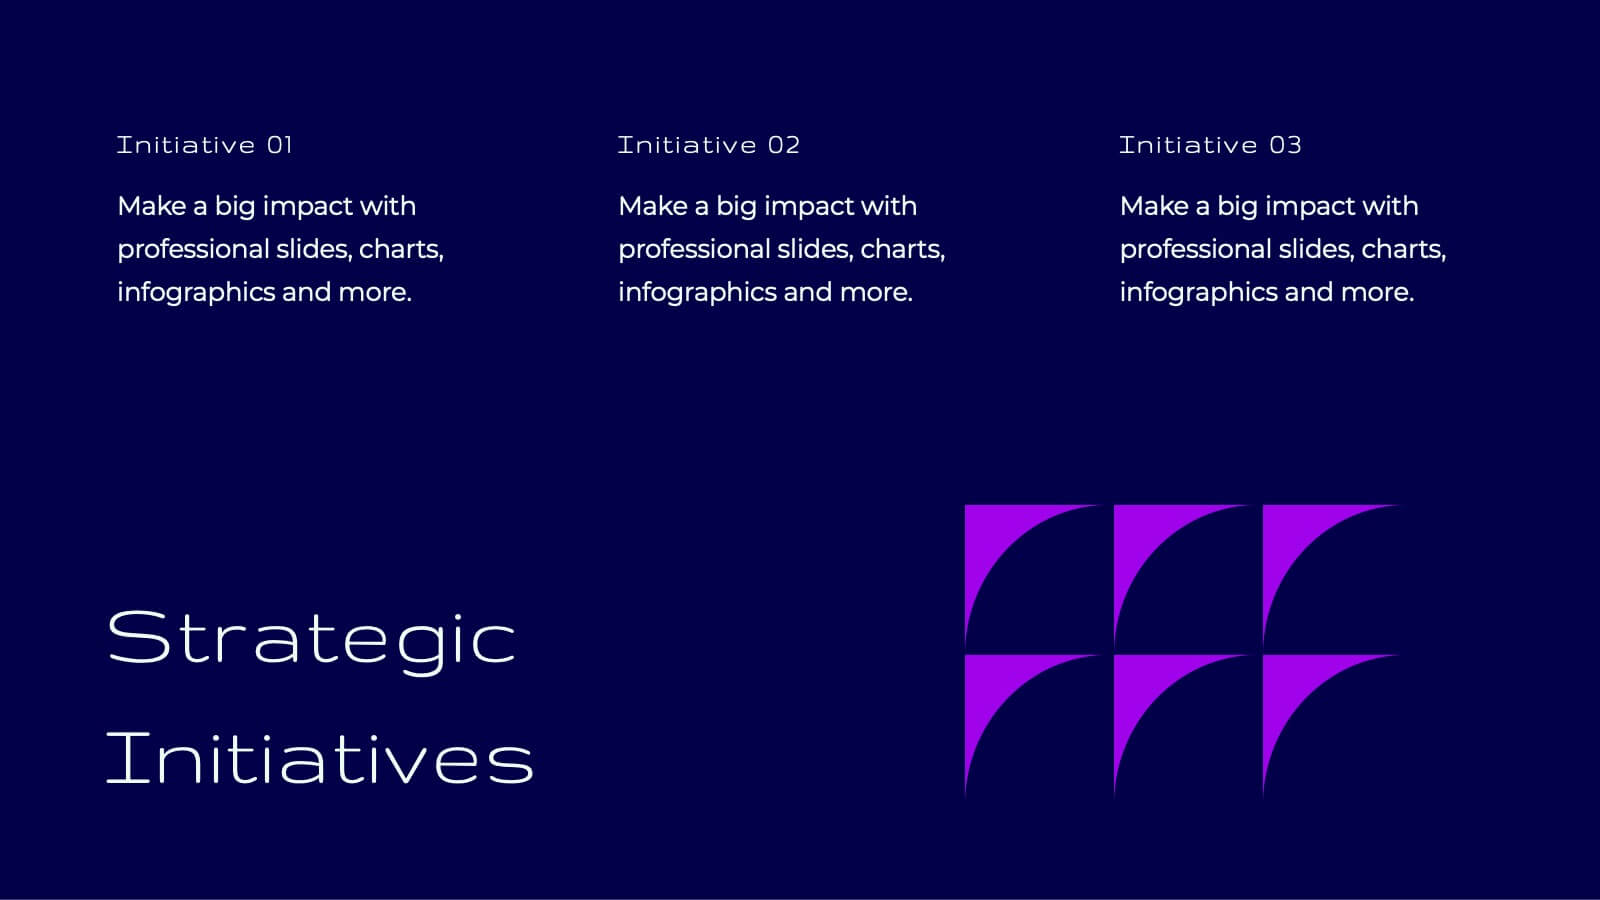
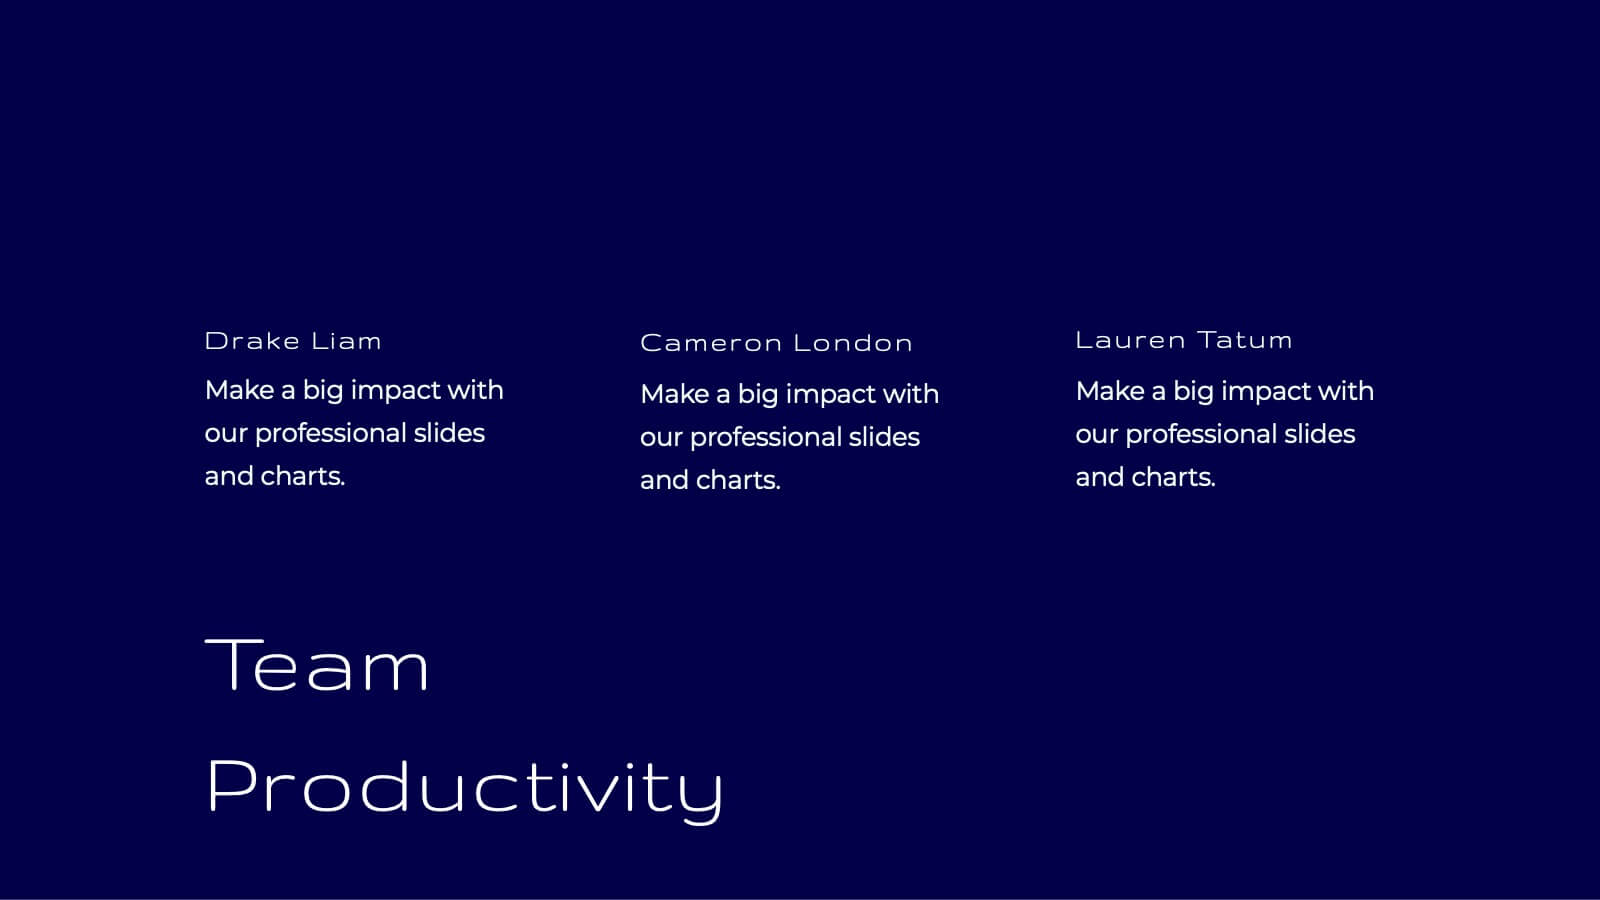
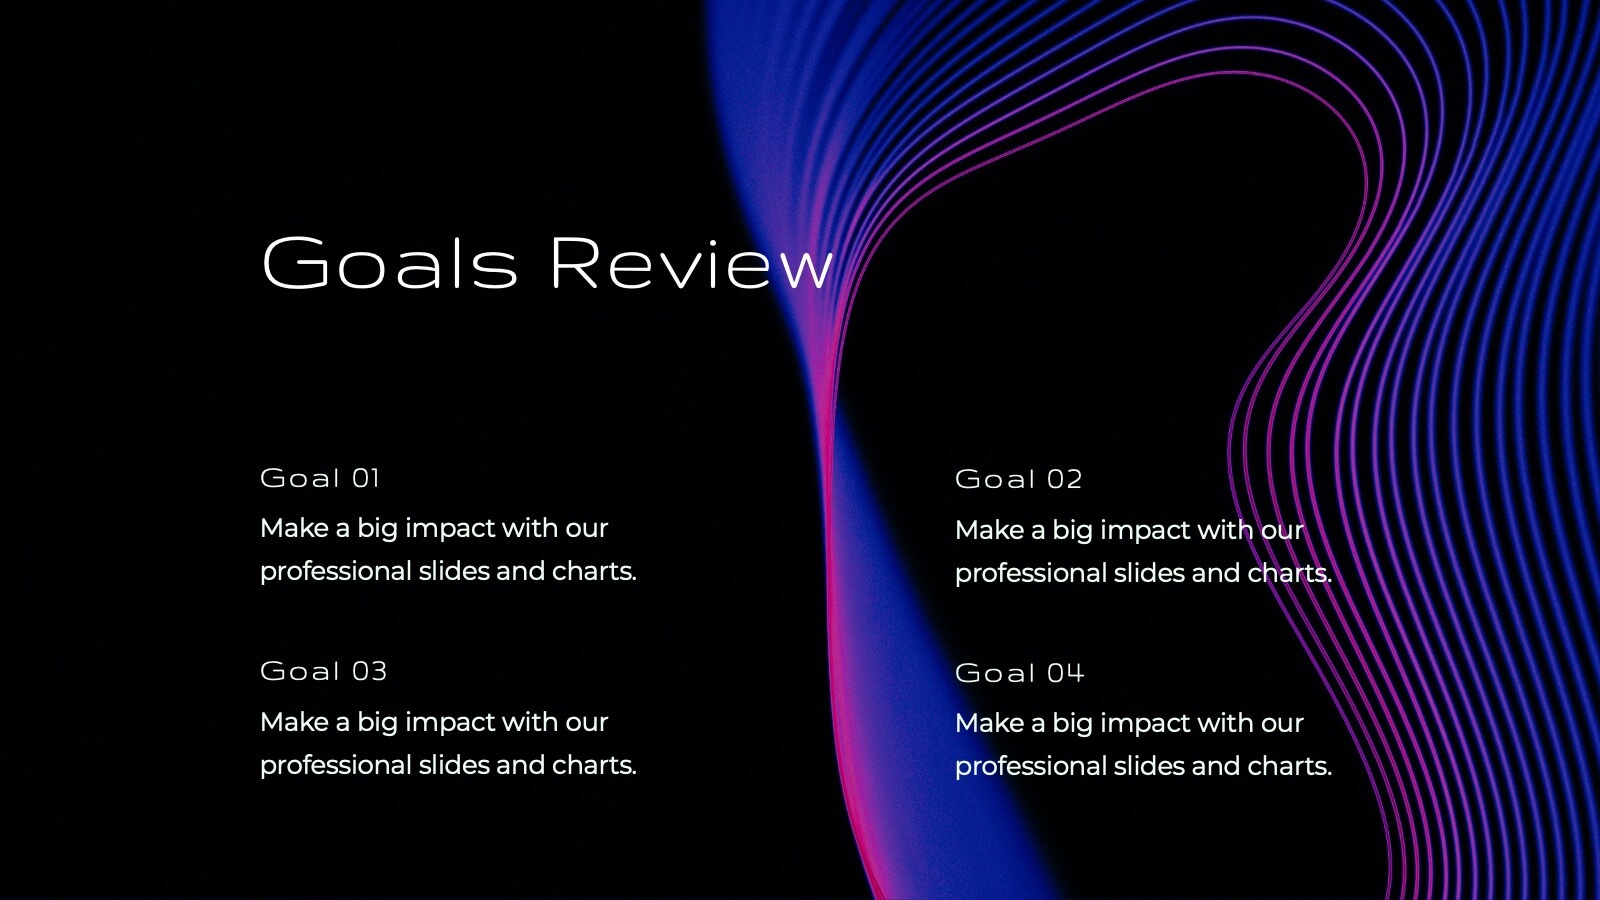
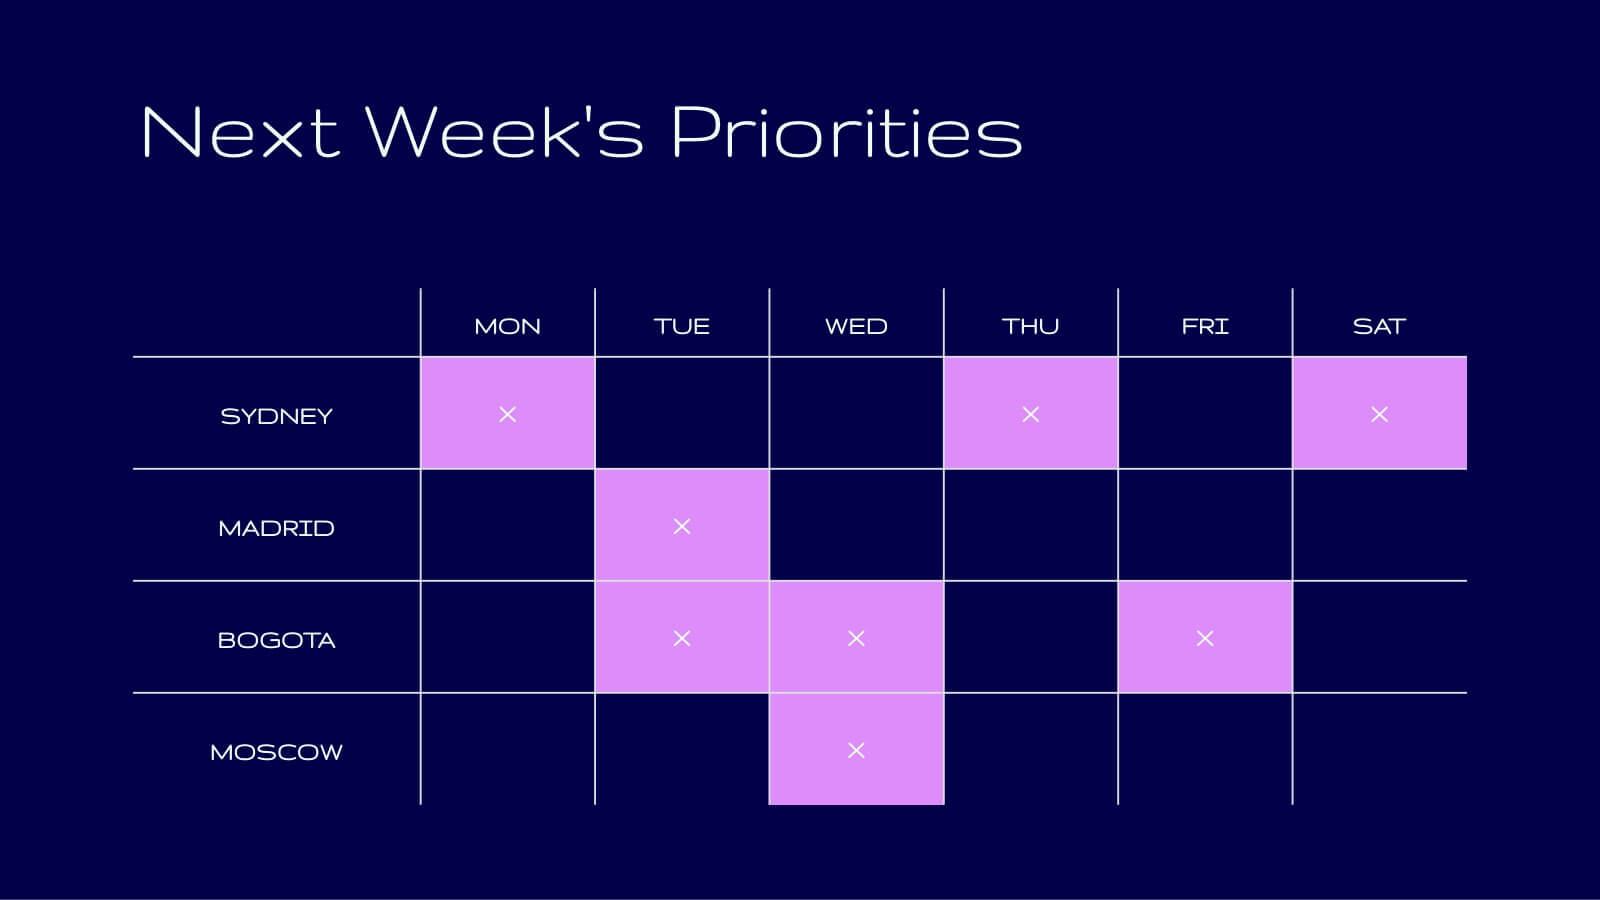
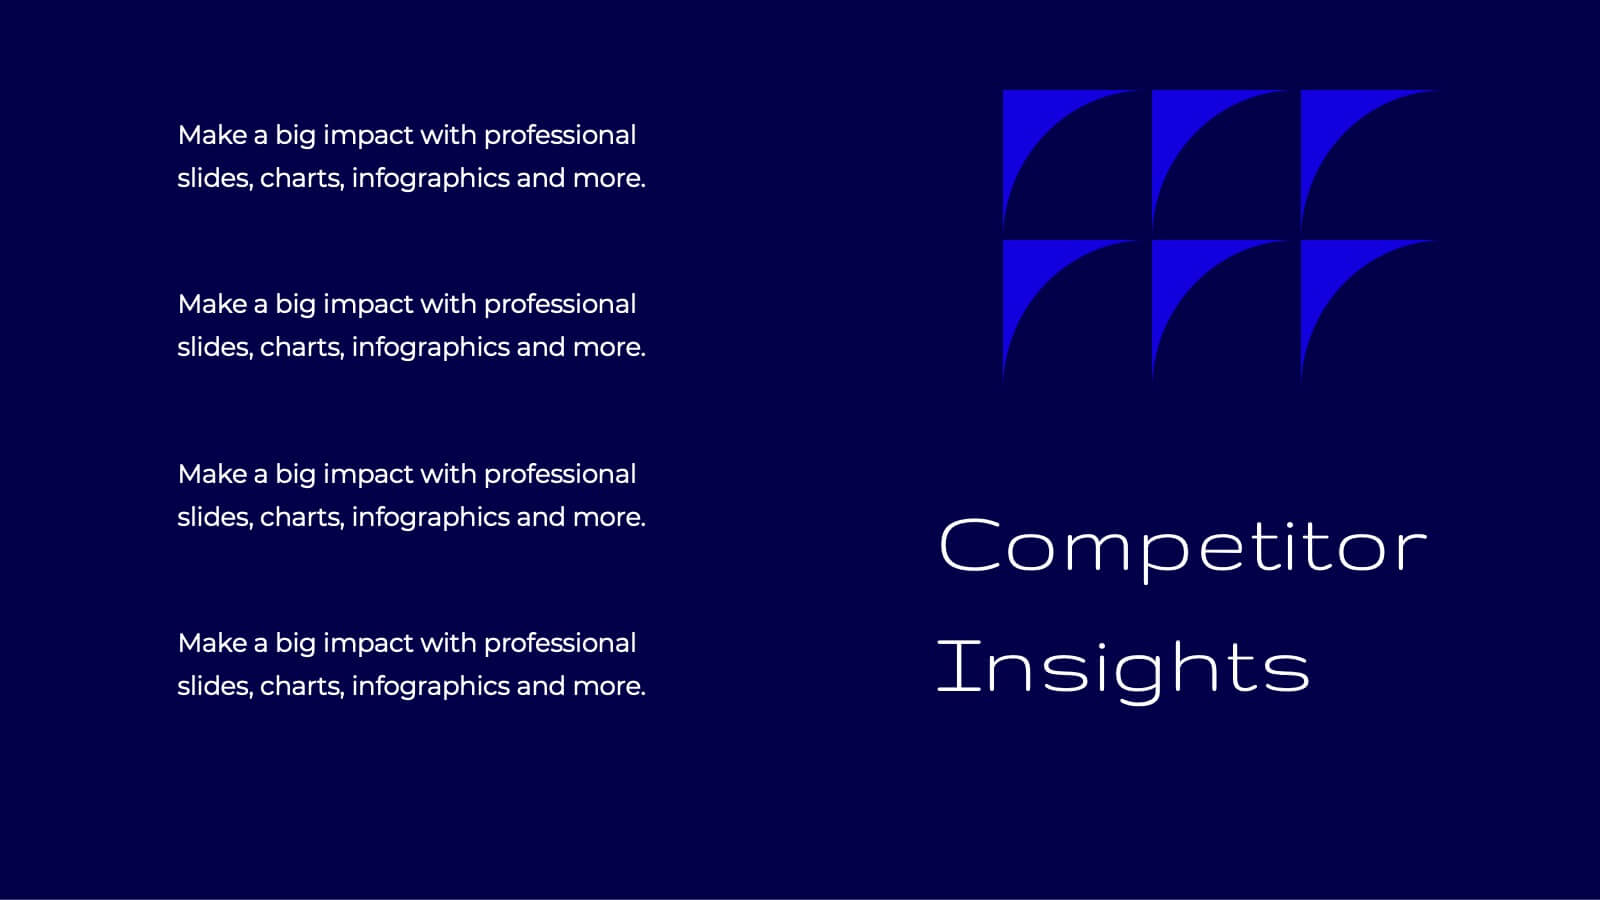
Tidal Research Findings Report Presentation
Deliver your research findings with impact using this sleek and modern report template! It covers key highlights, performance metrics, project progress, and competitor insights, making it ideal for clear, professional presentations. Perfect for summarizing challenges, solutions, and strategic initiatives. Compatible with PowerPoint, Keynote, and Google Slides for seamless reporting.


6 diapositivas
Cyber Security Jobs Infographics
The "Cyber Security Jobs" infographic template, designed for PowerPoint, Keynote, and Google Slides, is a vital tool for career counselors, educational institutions, and cyber security professionals. This modern and informative template is specifically crafted to highlight career opportunities and pathways in the field of cyber security. Featuring key elements such as various job roles in cyber security, skill requirements, and career growth opportunities, the template is structured to provide a comprehensive overview of the industry. Its layout is ideal for presenting the diverse range of careers available in cyber security, making it an invaluable resource for career guidance and professional development presentations. The design is tech-themed with a color scheme that includes shades of blue, black, and gray. This not only gives the template a professional and engaging look but also reflects the technological and security aspects of the field. Whether it's used in job fairs, educational seminars, or corporate training sessions, this template ensures that information about cyber security jobs is presented clearly, effectively, and attractively.


4 diapositivas
Investor Business Plan One-Pager Presentation
Present your startup vision with clarity using this Investor Business Plan One-Pager. Designed to outline key milestones, growth projections, and funding goals, it’s perfect for pitch decks and investor briefs. Visually dynamic and fully customizable, this one-slide format works seamlessly in PowerPoint, Keynote, and Google Slides—ideal for entrepreneurs and startups.


5 diapositivas
Scope Management and Planning
Deliver clear and structured project planning insights with this professional Scope Management slide. Featuring a step-by-step visual layout with icons and text placeholders, it's perfect for outlining deliverables, milestones, and strategic goals. Compatible with PowerPoint, Keynote, and Google Slides for easy customization.


26 diapositivas
The Rise of Smart Cities Presentation
This presentation template is dedicated to urban developers, technology enthusiasts, and policy makers interested in the advancement of smart cities. The template serves as a deep dive into the integration of technology within urban settings to boost sustainability, efficiency, and quality of life. It is designed with a sleek, modern aesthetic, using a color palette that reflects innovation and modernity, which makes it visually appealing and easy to navigate. The content is structured to demystify complex concepts about smart cities, featuring sections on IoT implementations, eco-friendly urban development, and smart public services. It includes varied slide types such as diagrams, infographics, and statistical displays to showcase data and case studies from cities that are pioneers in this domain. The template is compatible with multiple presentation platforms like PowerPoint, Google Slides, and Keynote, ensuring it can be utilized across different devices and settings. This makes it a versatile tool for presentations in educational, professional, and conference contexts, aiming to inspire and educate on the transformative power of smart urban planning.


7 diapositivas
Value Chain Infographic Presentation Template
The five primary activities of the value chain are: inbound logistics, operations, outbound logistics, marketing and sales, service. It is made up of four secondary activities: firm infrastructure, human resource management, technology development and procurement. The value chain is a tool for evaluating how a business operates. With this value chain template, you'll be able to identify various links in the value chain, and determine where an opportunity for product differentiation exists. This template helps lay out your actual value chain and identify where opportunities exist to improve.


6 diapositivas
Product Mockup Infographic
Showcase your products with unparalleled clarity using this collection of product mockup templates. Designed for versatility and impact, each template provides a vivid representation of your products on various digital devices, emphasizing detail and design with a polished, professional finish. These mockups are ideal for demonstrating the user interface and user experience aspects of digital products like apps, websites, and software. The templates feature intuitive layouts and a harmonious blend of colors that enhance the visual appeal while keeping the focus on your product's features. Customize each mockup with your own screenshots and descriptions to create a compelling presentation that speaks directly to your audience's needs. Ideal for tech startups, software developers, and digital marketers, this collection helps you communicate the value of your products in a straightforward yet captivating manner, whether for client presentations, marketing materials, or investor pitches.


6 diapositivas
Business Growth and Progress Metrics Presentation
Showcase milestones, trends, and business wins with this sleek bar chart and line graph combo. Designed to illustrate upward momentum, each slide highlights progress using a trophy peak icon, 5 key steps, and editable labels. Ideal for quarterly reviews, growth tracking, and strategic updates. Fully compatible with PowerPoint, Keynote, and Google Slides.


26 diapositivas
Water Pollution in the Pacific Presentation
Water Pollution in the Pacific refers to the contamination of water bodies in the Pacific Ocean, which can have severe consequences for marine life, ecosystems, and human health. This template is designed to raise awareness about the critical issue of water pollution in the Pacific Ocean. This template can effectively convey the urgency and significance of addressing water pollution in the Pacific Ocean. This serves as a powerful tool to educate and inspire individuals, organizations, and policymakers to take action and work towards sustainable solutions for the preservation of our precious marine ecosystems.


7 diapositivas
Cause and Consequence Bowtie Model Presentation
Turn complex risks into clear, visual logic with a balanced, intuitive diagram that connects causes to consequences. This presentation is perfect for showcasing preventive and corrective actions in business or project management. Fully customizable and compatible with PowerPoint, Keynote, and Google Slides for a professional, data-driven approach.
8 diapositivas
Key Project Milestone Tracker
Stay on top of progress with this streamlined Key Project Milestone Tracker. Designed to showcase up to eight critical milestones with corresponding years, this timeline helps visualize project phases and deadlines clearly. Fully editable in PowerPoint, Keynote, and Google Slides for easy customization.


6 diapositivas
5-Stage Circular Cycle Presentation
Energize your workflow with a clean, circular layout that turns five interconnected steps into a clear, engaging story. This presentation helps you explain any repeating process or continuous cycle with simplicity and flow, making complex ideas easier to follow. Compatible with PowerPoint, Keynote, and Google Slides.


5 diapositivas
Problem Statement Slide Presentation
Kick off your presentation with a bold, curiosity-driven slide that clearly defines the challenge your team aims to solve. This layout helps you outline key points, clarify project direction, and focus decision-making with clarity and impact. Fully compatible with PowerPoint, Keynote, and Google Slides.


7 diapositivas
Urban Ecology Illustrated Infographics
Ecology is the scientific study of the interactions between organisms and their environment. This ecology template will help you explain the science behind our world. This is great for anyone who is presenting information about ecology, environment, or sustainability. You can use this infographic as is or customize it by changing the colors and fonts of each slide. You can also add your own images, and text by downloading in Powerpoint, Keynote, or Google Slides. This Template comes with a wealth of key facts and figures on eco-friendly living and presents them in an infographic style.


5 diapositivas
Corporate Framework and Structure
Visualize governance, compliance, and assurance in a streamlined framework. This structured slide is ideal for outlining business functions, responsibilities, and reporting lines across departments. Fully editable in PowerPoint, Keynote, and Google Slides for seamless customization.


9 diapositivas
Statistics Dashboard Infographic
Dive into data with this comprehensive Statistics Dashboard Infographic, perfectly tailored for analysts, marketers, and business professionals. This dashboard provides a clear, visual representation of various statistical data through an assortment of charts, graphs, and metrics. The template features multiple panels, each dedicated to different aspects such as sales performance, customer behavior, financial health, and marketing results. Its design combines vibrant colors with a clean layout to highlight key information, making it easy to compare figures and track trends. Whether you need to present quarterly results, monitor project progress, or analyze marketing effectiveness, this infographic is an invaluable tool. It simplifies complex data into manageable visualizations, helping you convey critical insights effectively and make informed decisions based on solid statistical analysis.