


Características


¿Tienes alguna pregunta?
Recomendar


8 diapositivas
Meet the Team Presentation
Showcase your team effectively with our "Meet the Team Presentation" template. This sleek design features personalized cards for each team member, displaying their photo, name, and contact details on a visually appealing, color-coded background. Perfect for onboarding, company introductions, or team-building presentations, this template enhances recognition and cohesion. The distinct colors can be used to signify different roles or departments, making it easy to identify team dynamics at a glance. Compatible with PowerPoint, Keynote, and Google Slides, it’s an essential tool for any organization aiming to present their team in a professional and engaging manner.


6 diapositivas
Circular Motion Business Wheel Diagram Presentation
Showcase continuous processes or interconnected strategies with the Circular Motion Business Wheel Diagram Presentation. This visually engaging template features a six-part circular layout, ideal for illustrating business cycles, project workflows, or recurring tasks. Each segment includes customizable titles, icons, and content areas to support clarity and impact. Fully compatible with PowerPoint, Keynote, and Google Slides.


21 diapositivas
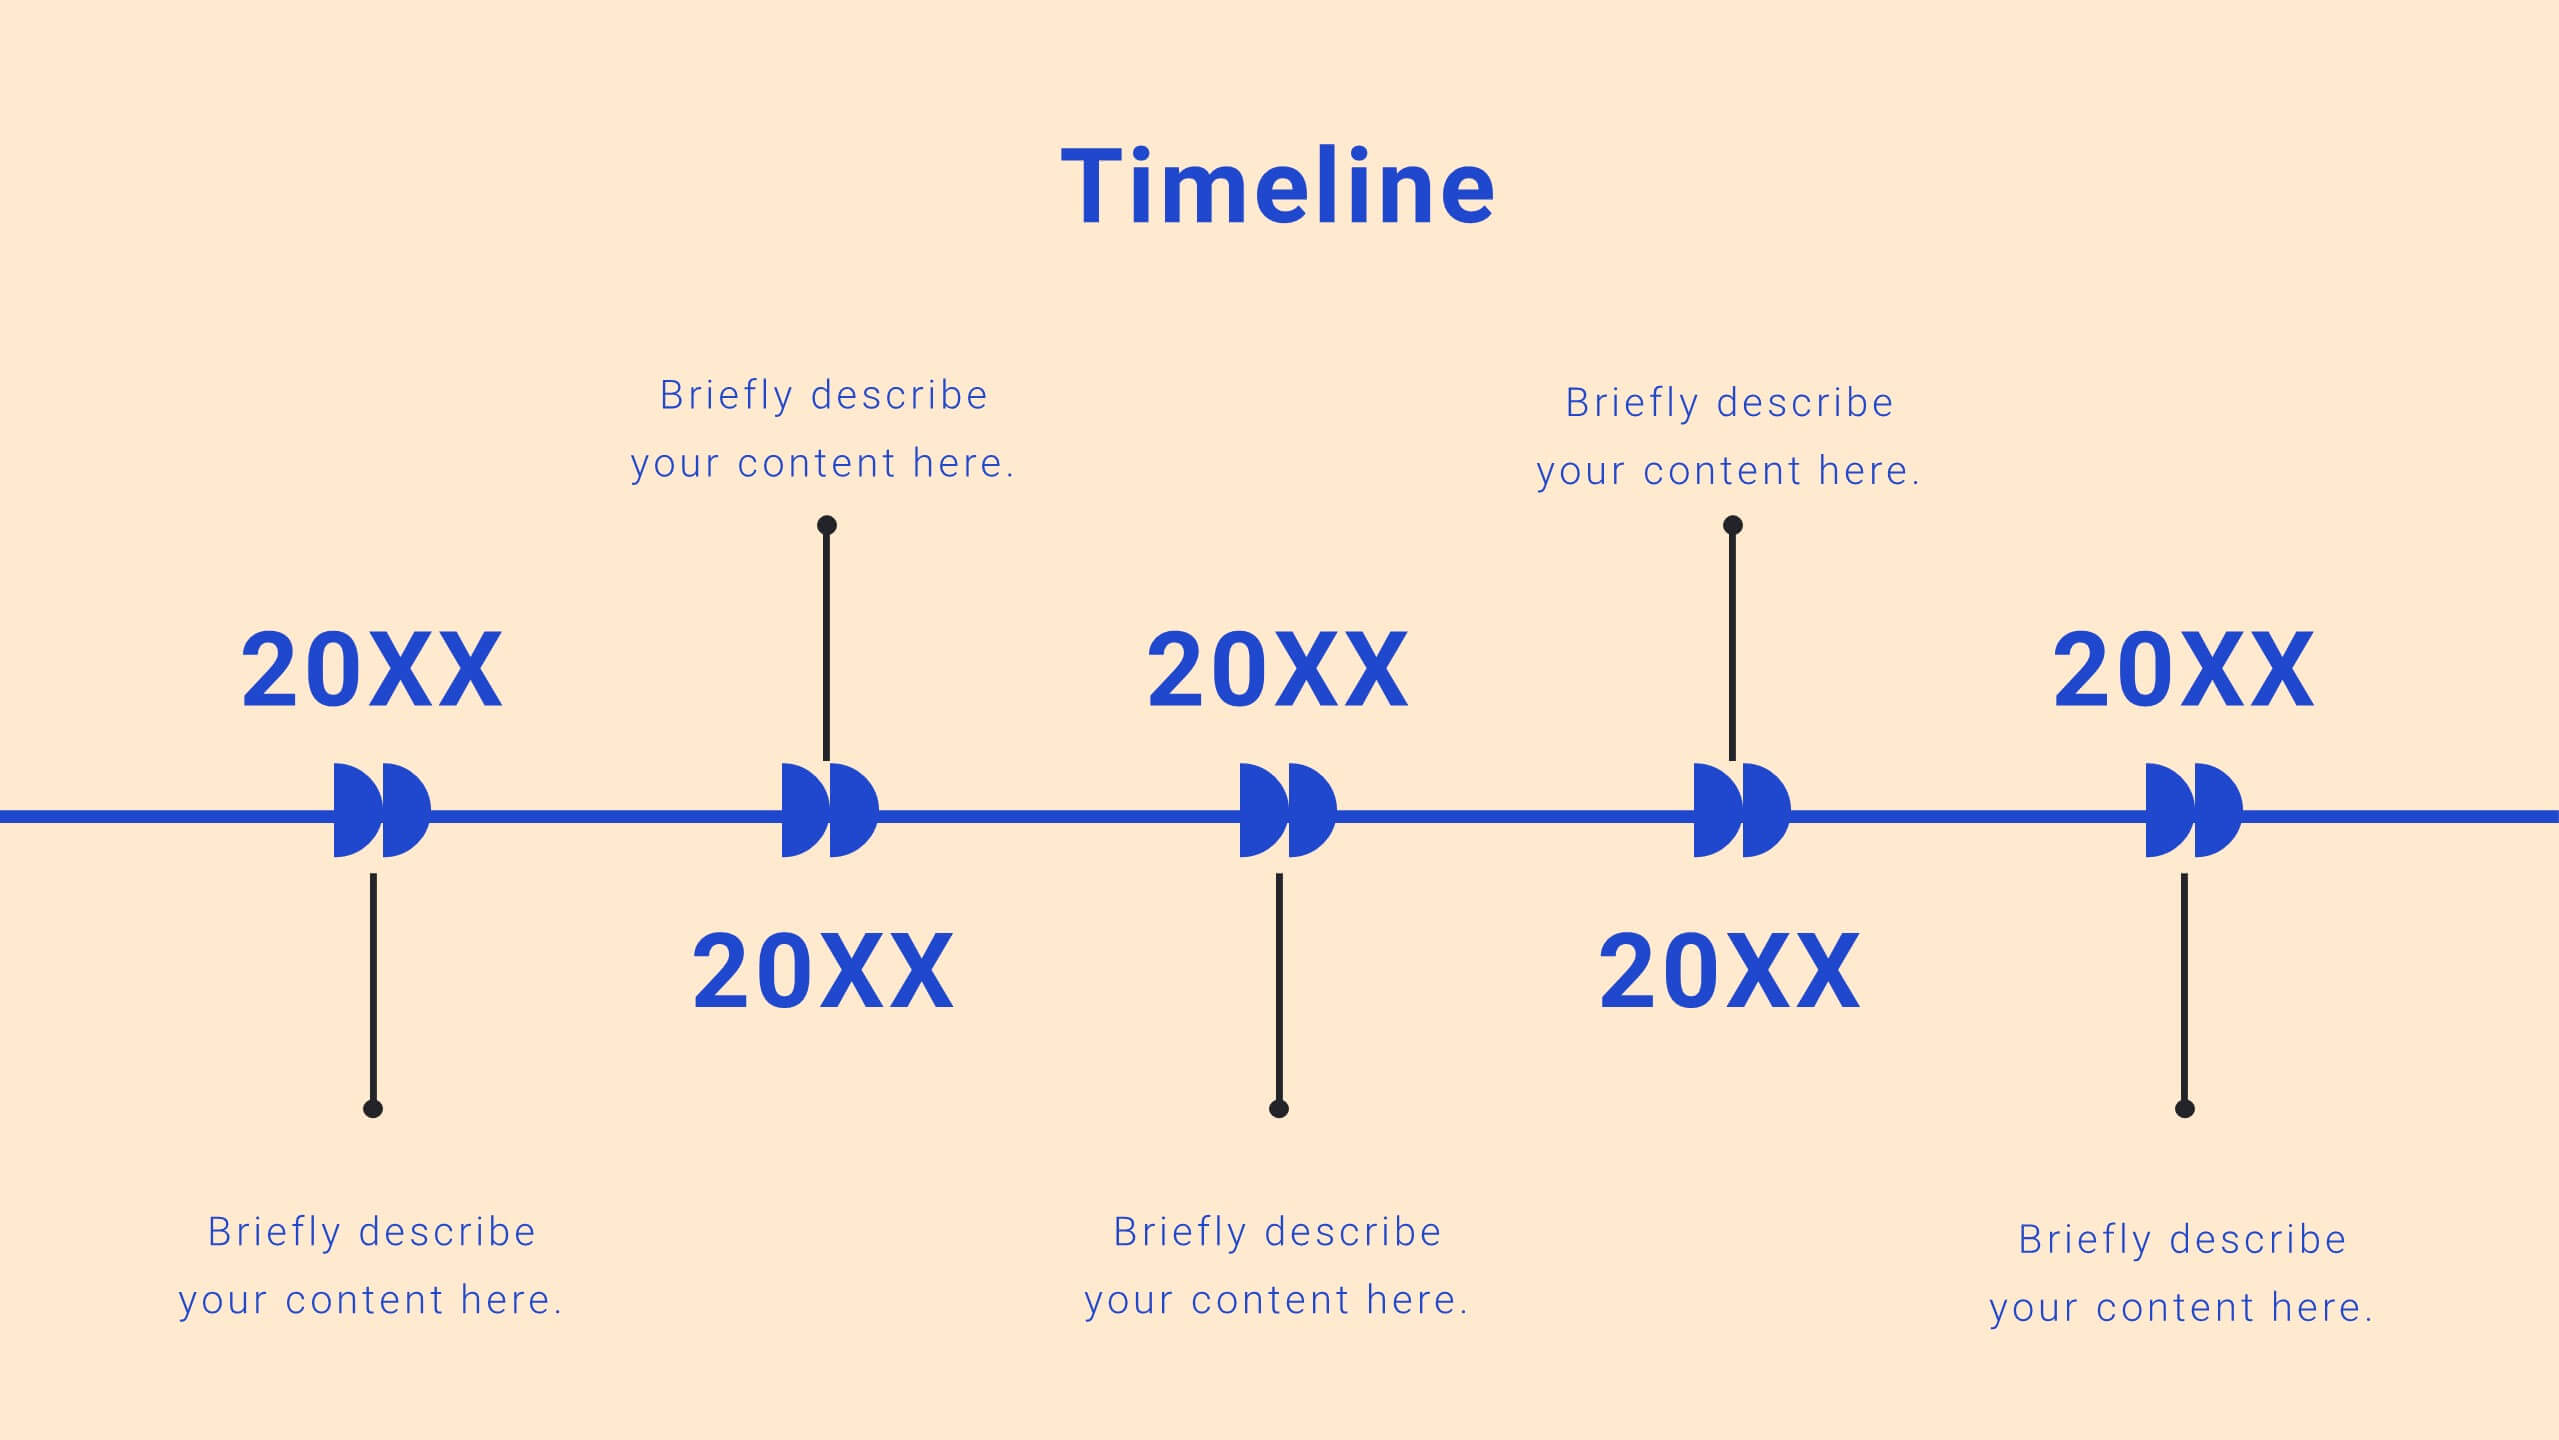
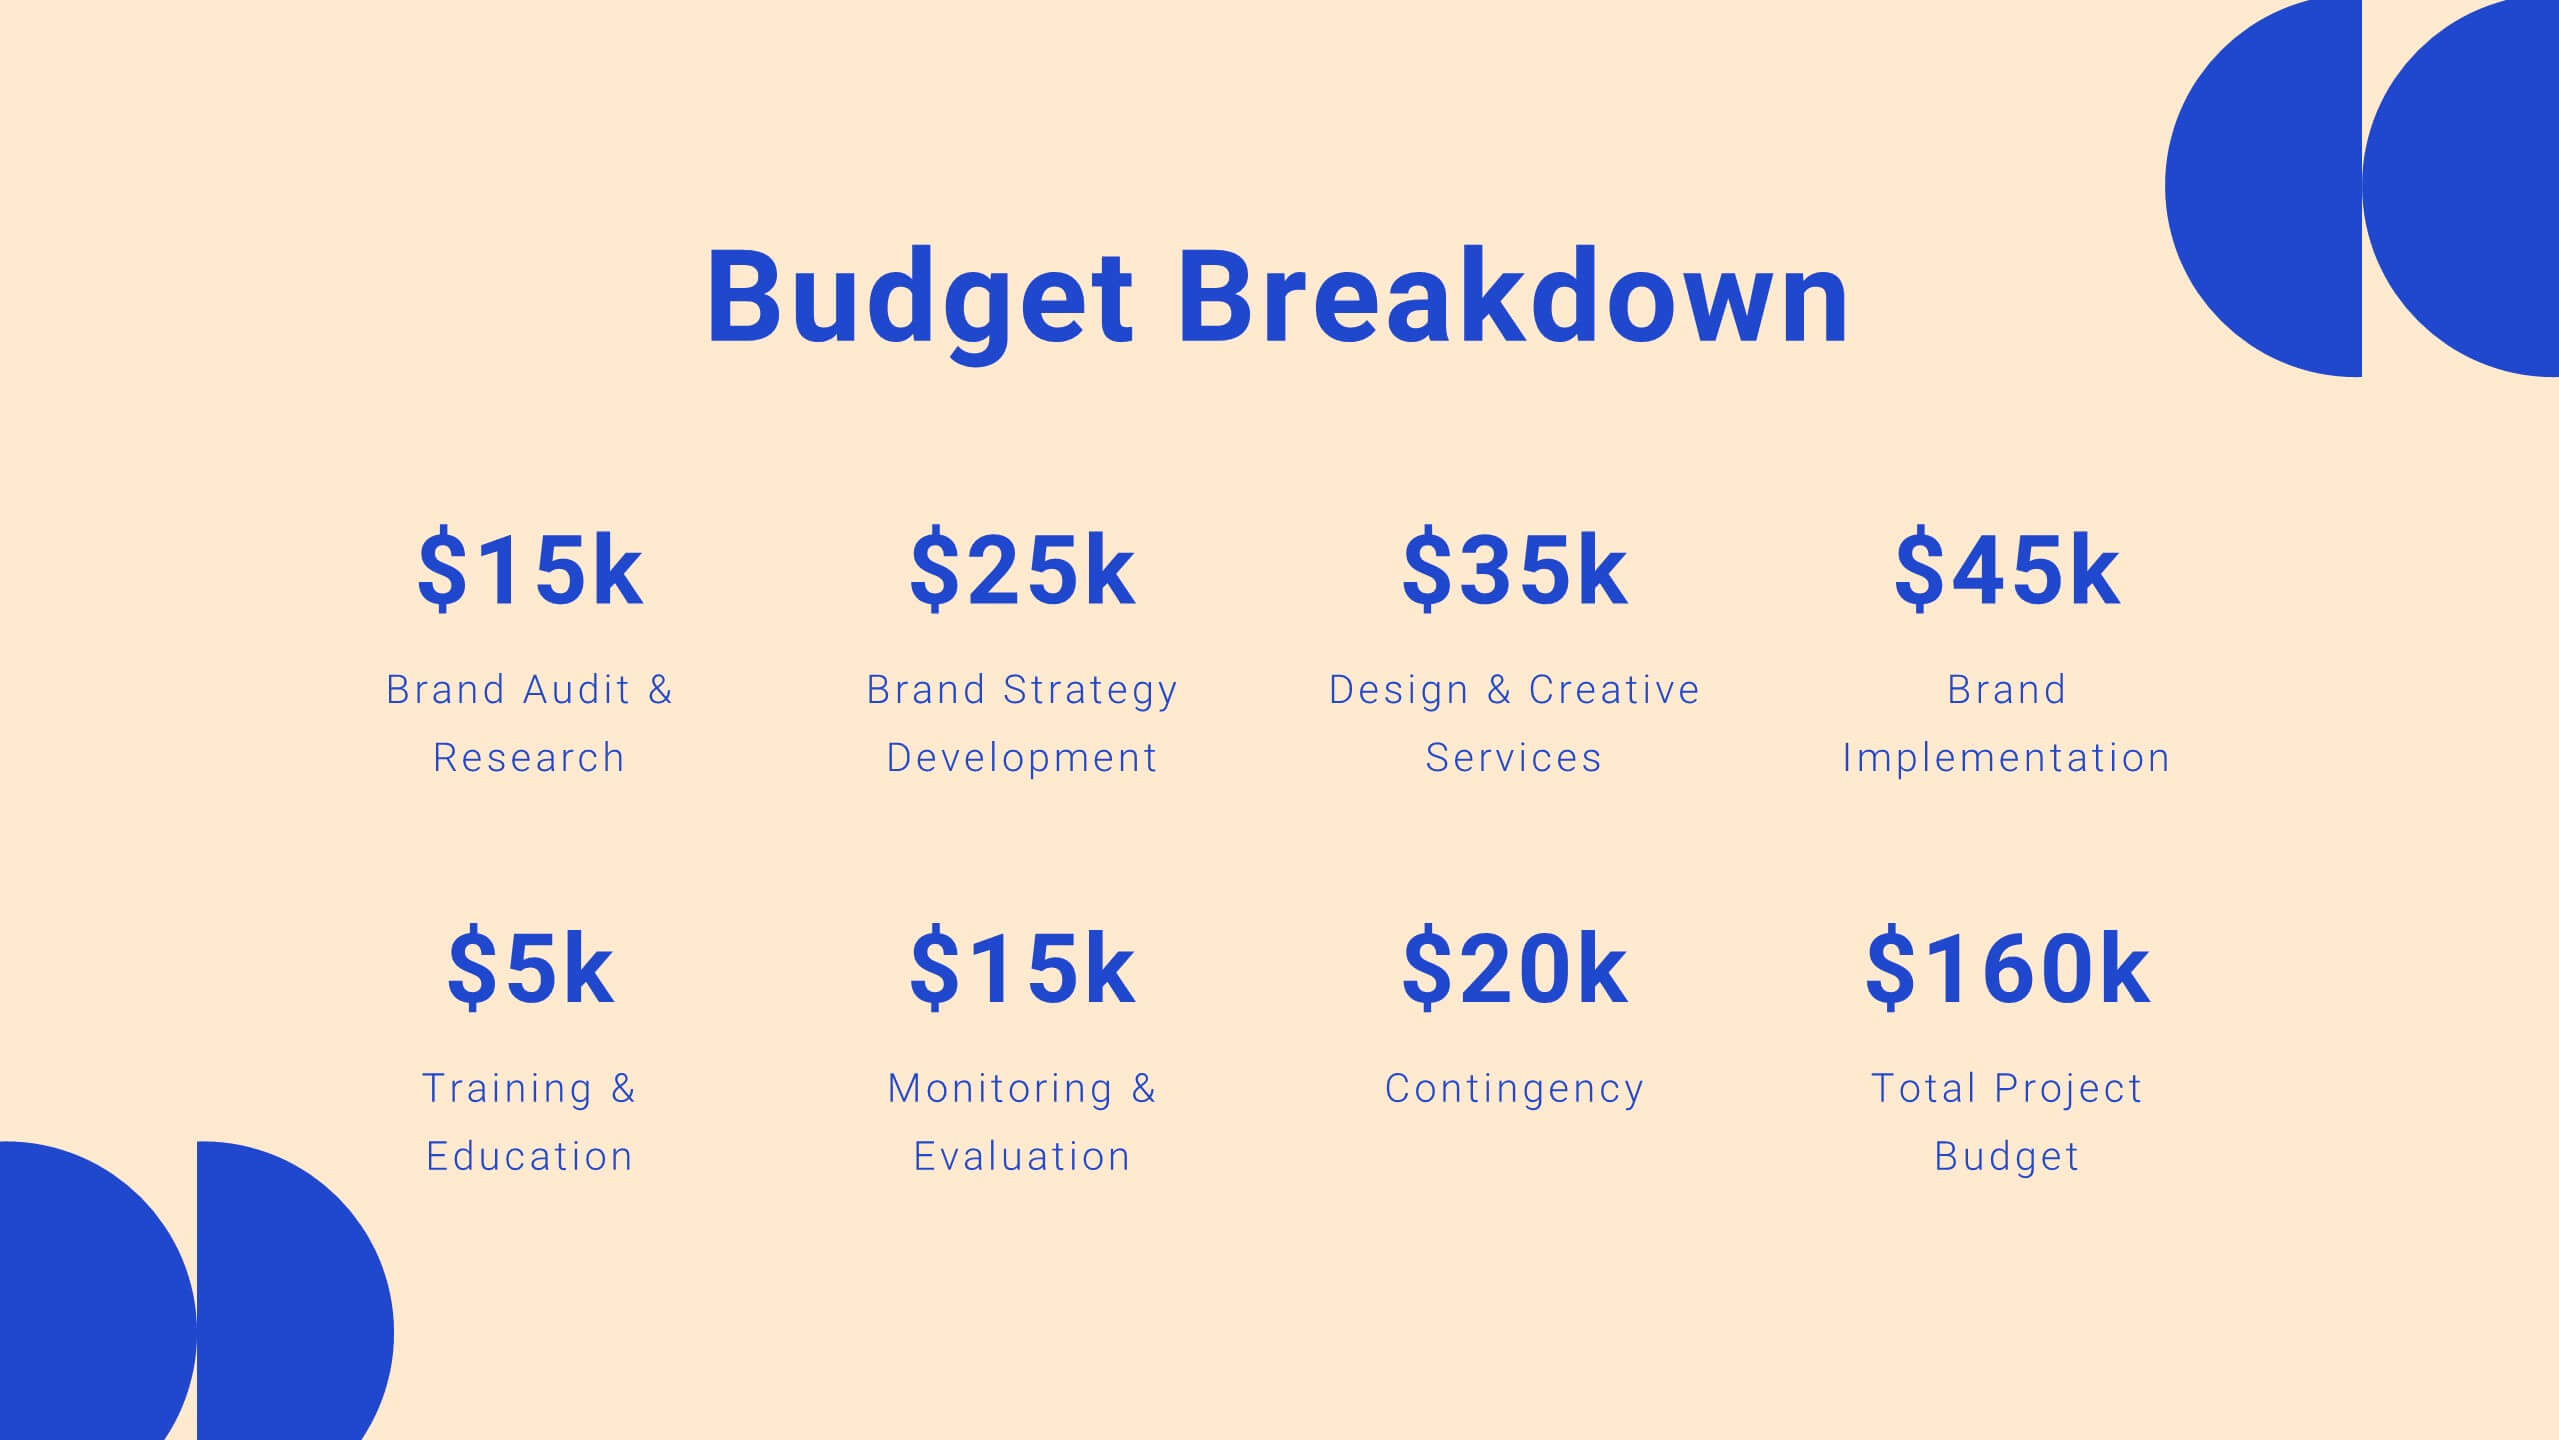
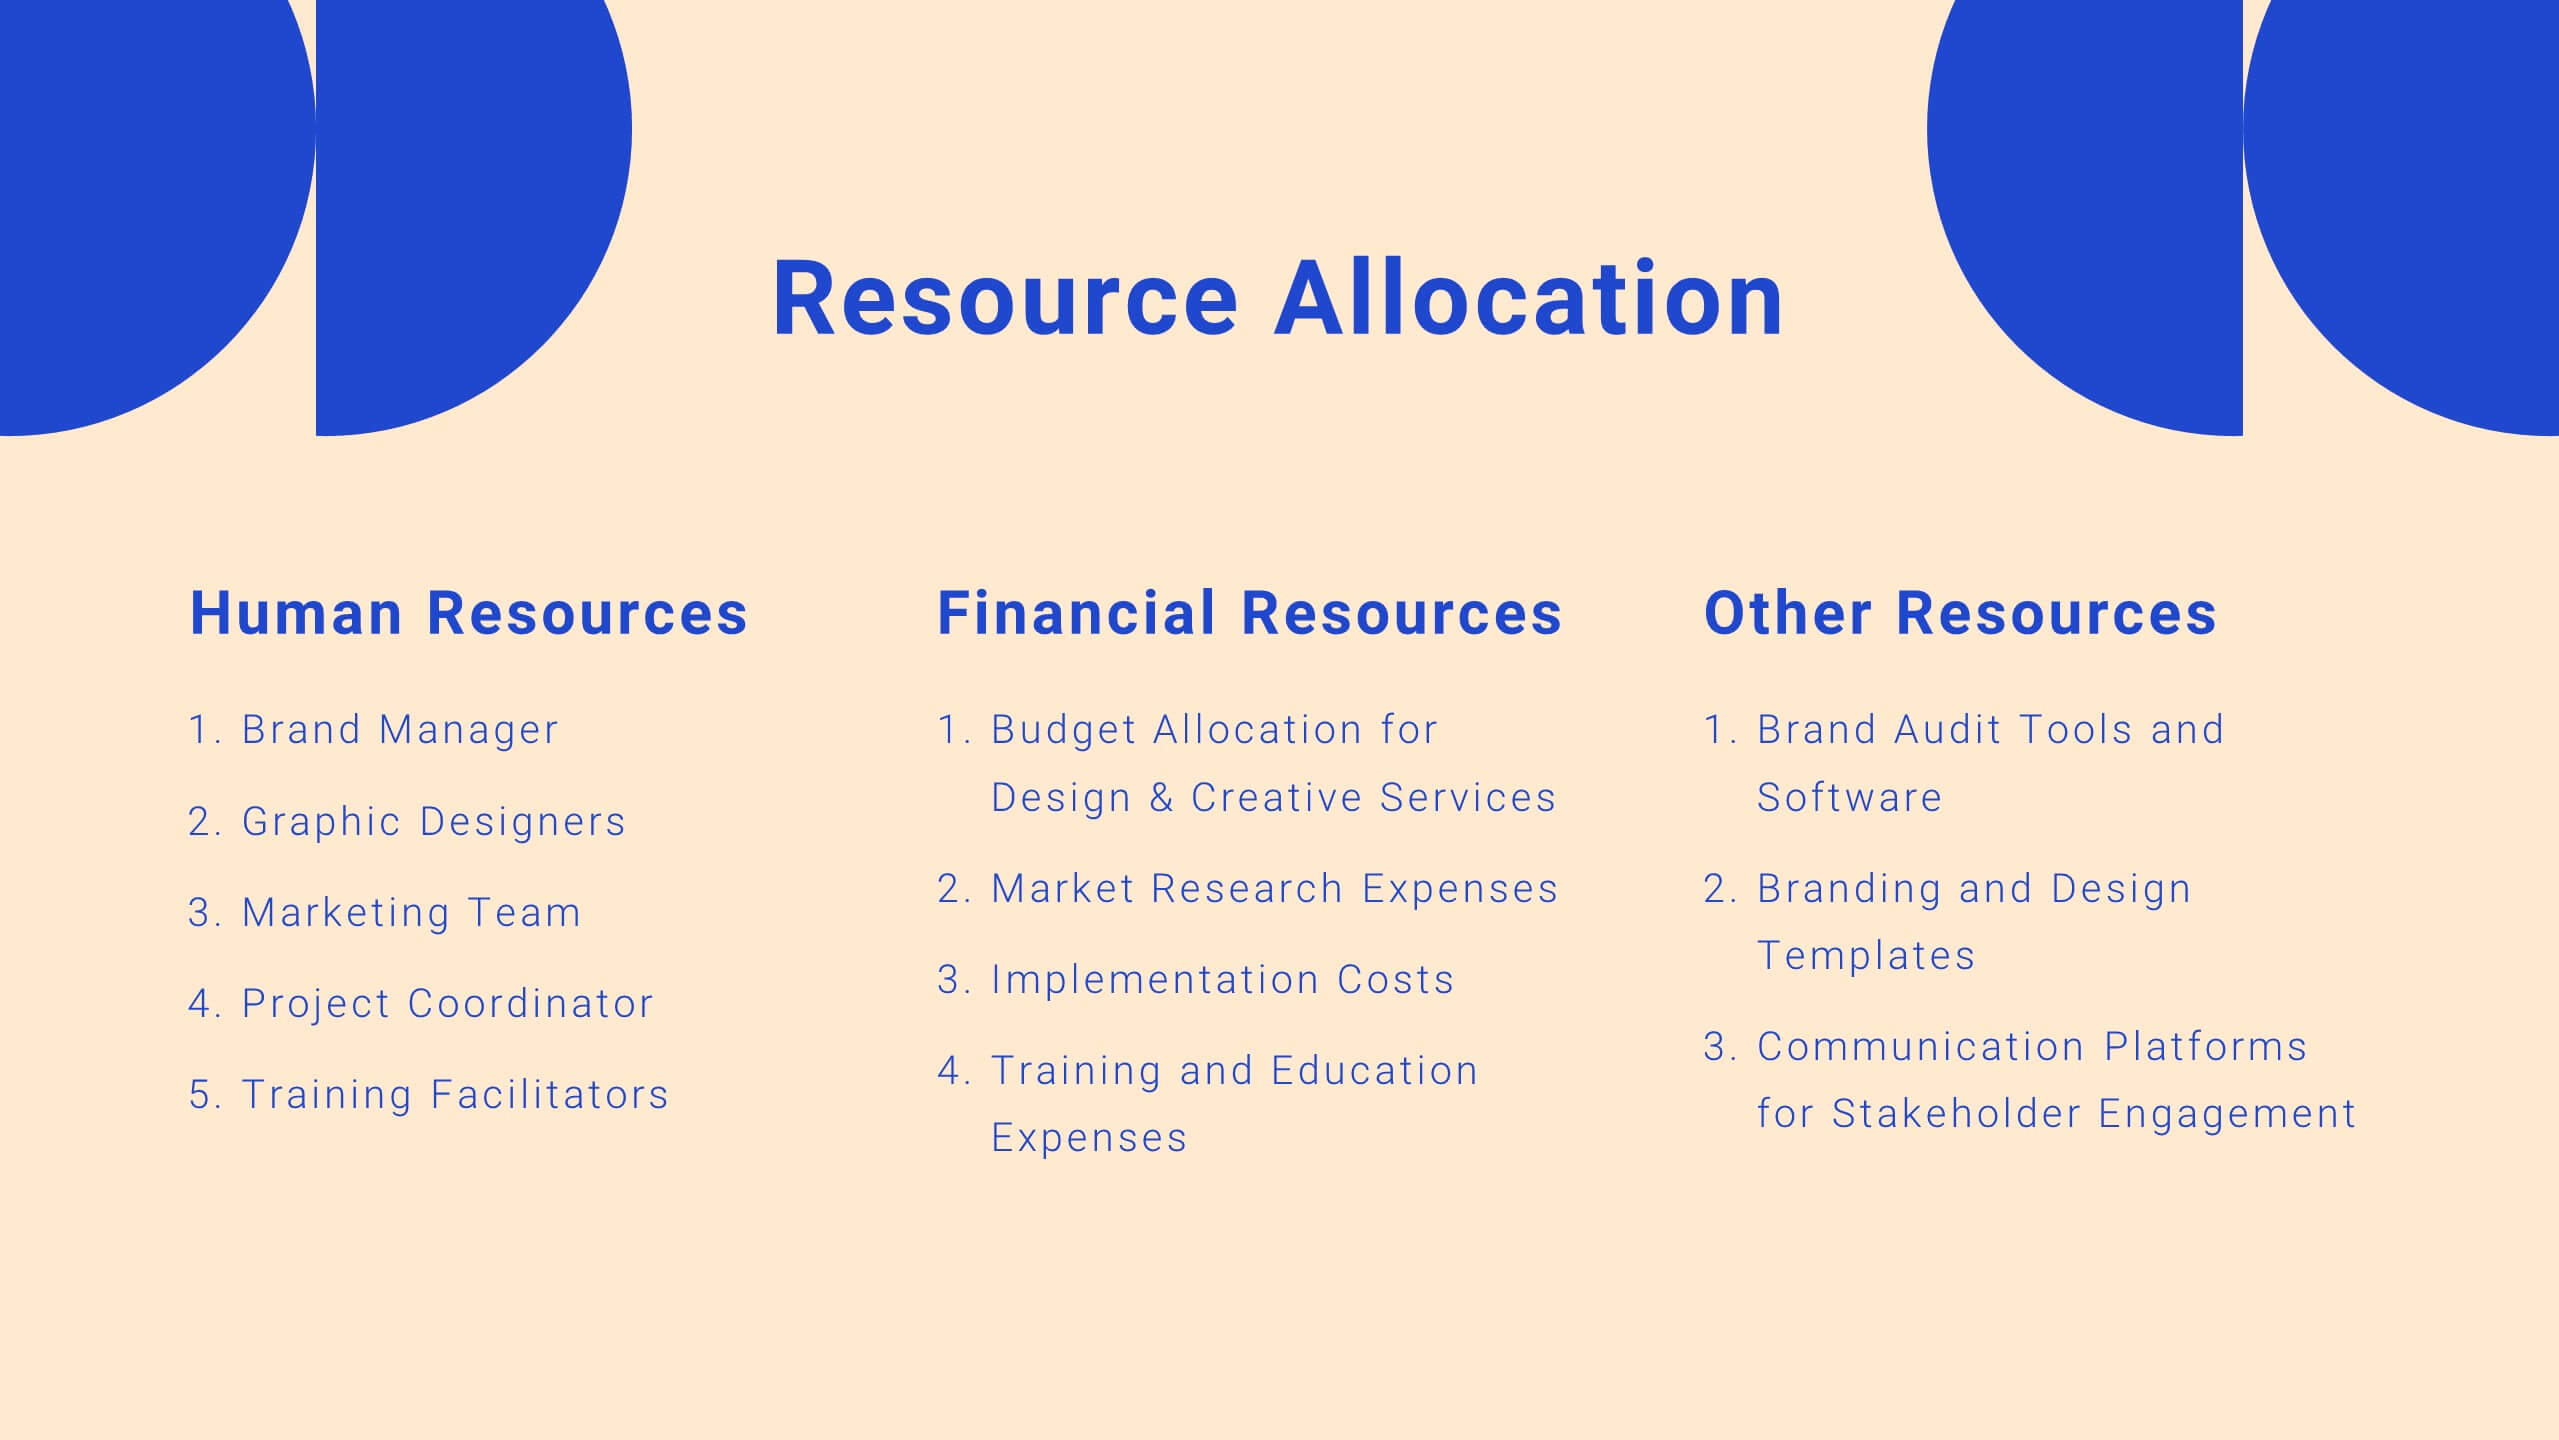
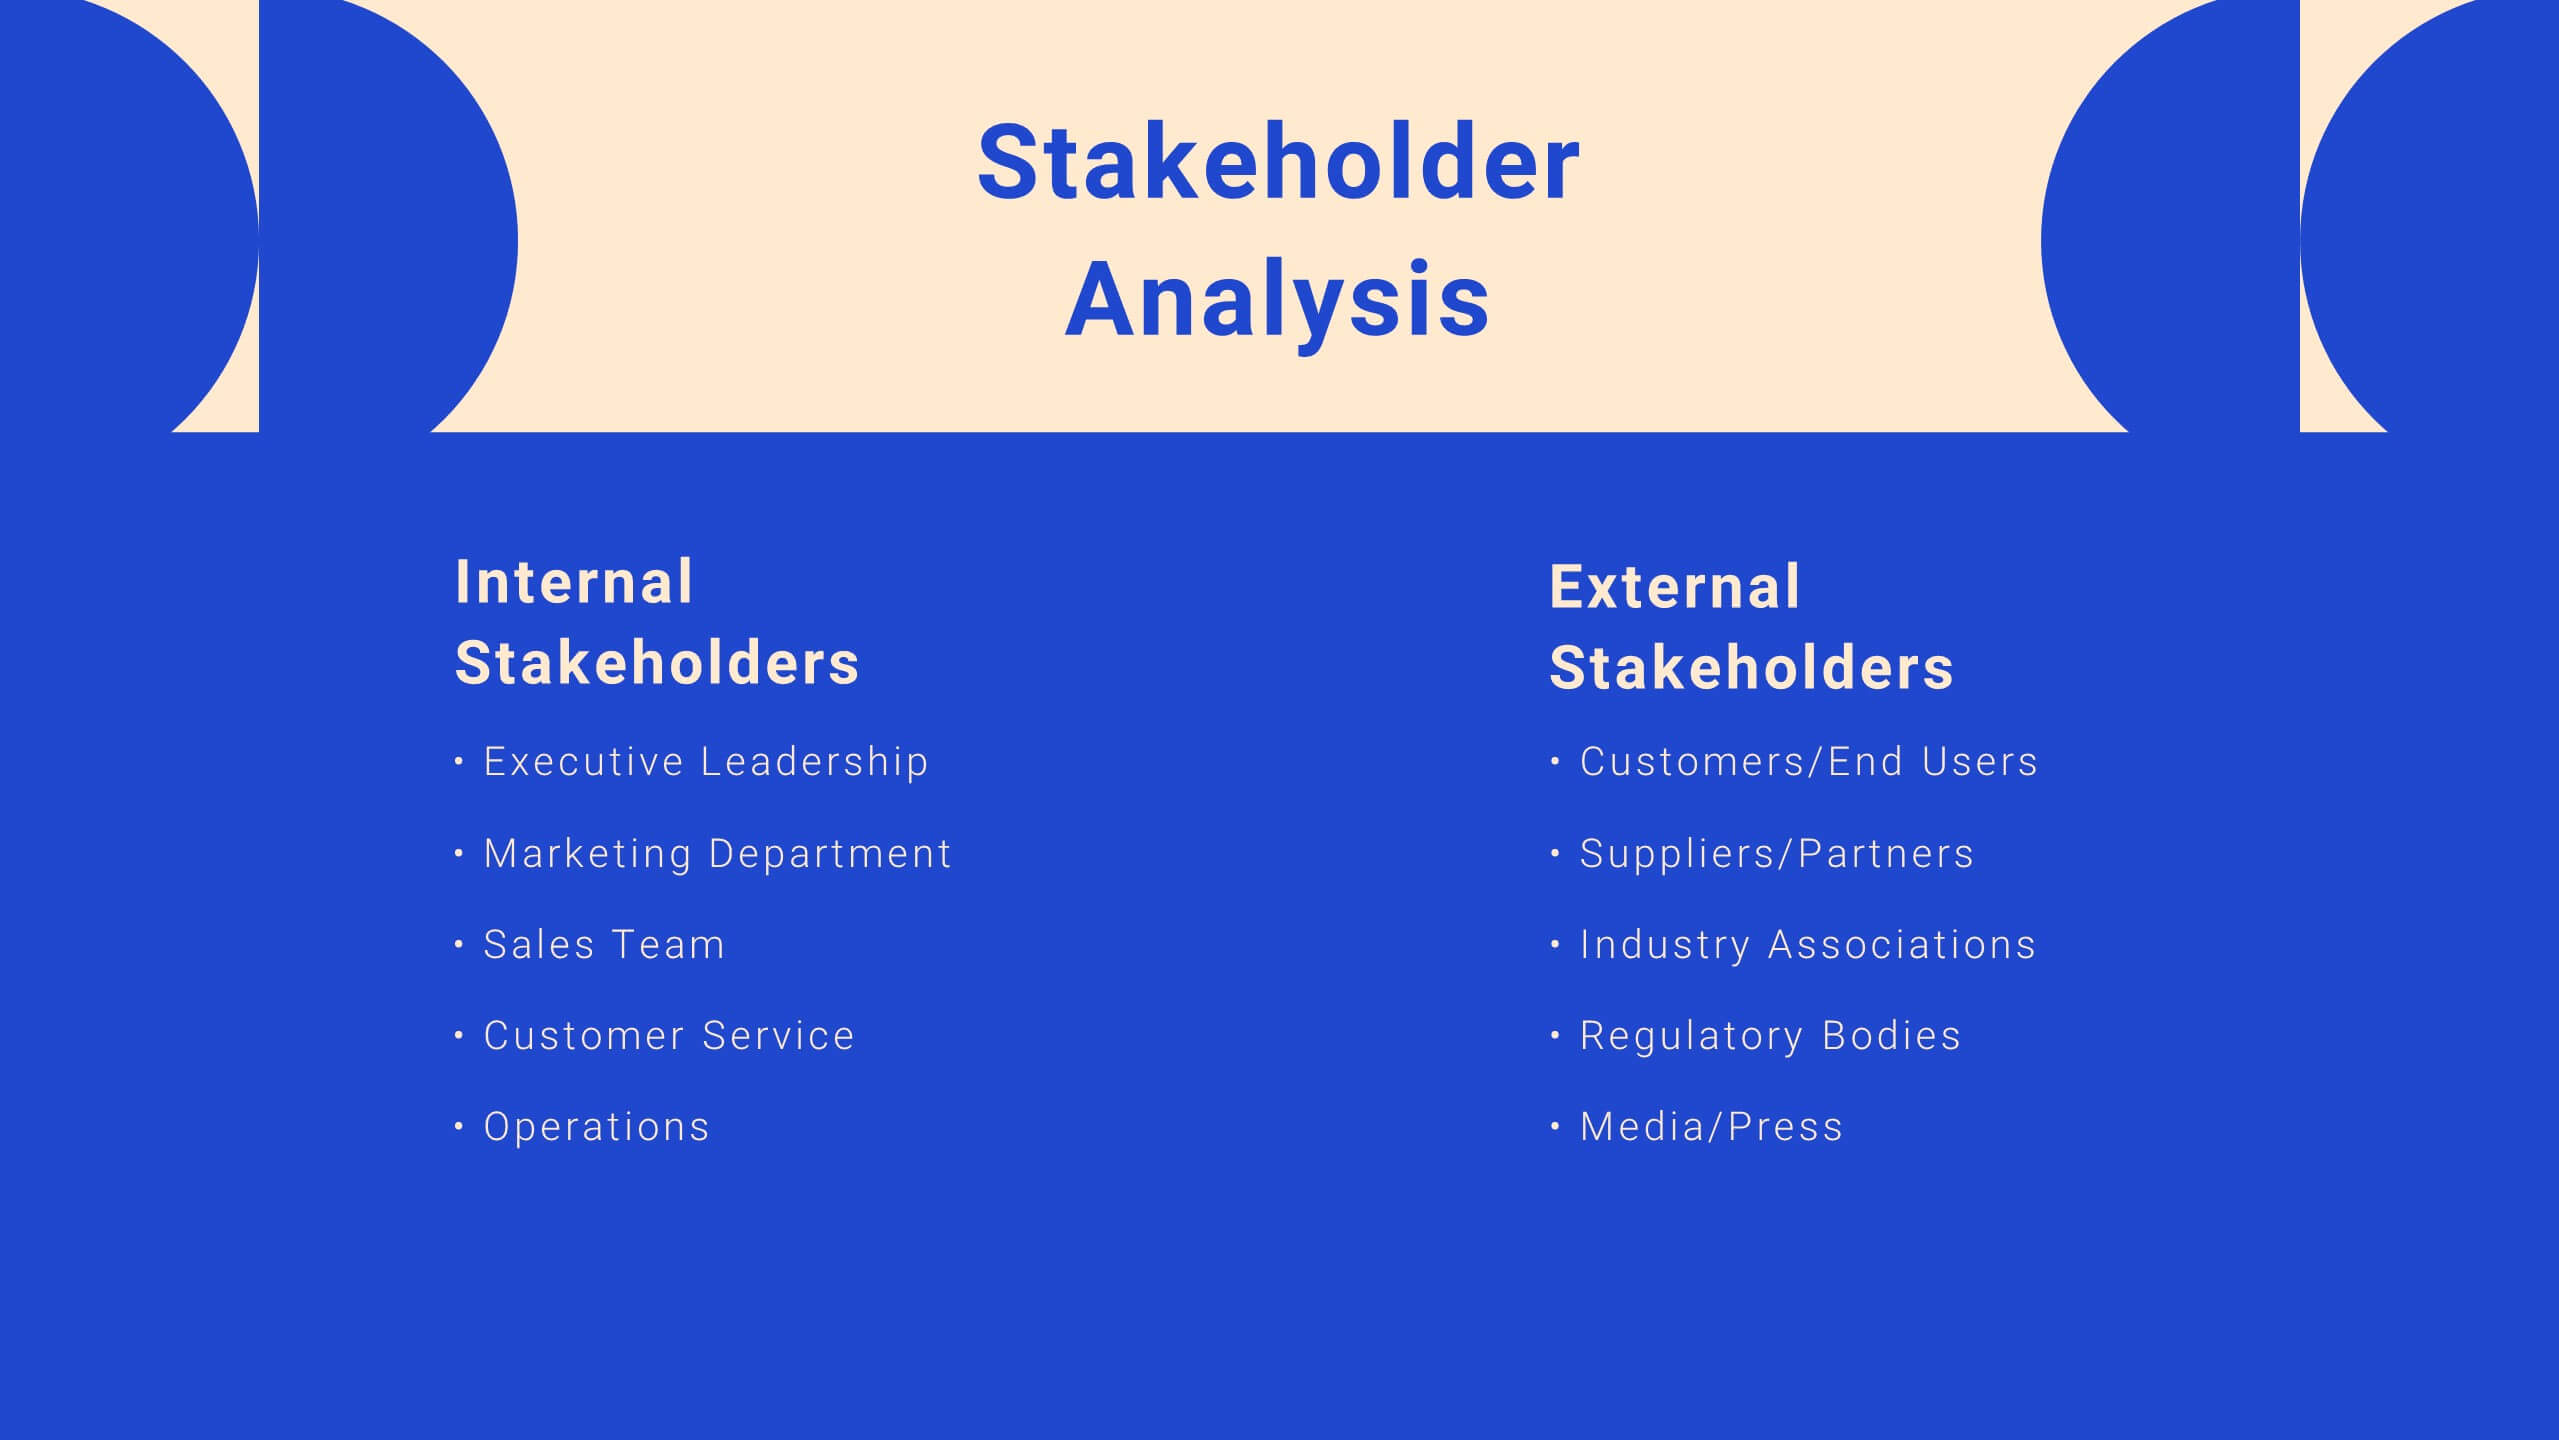
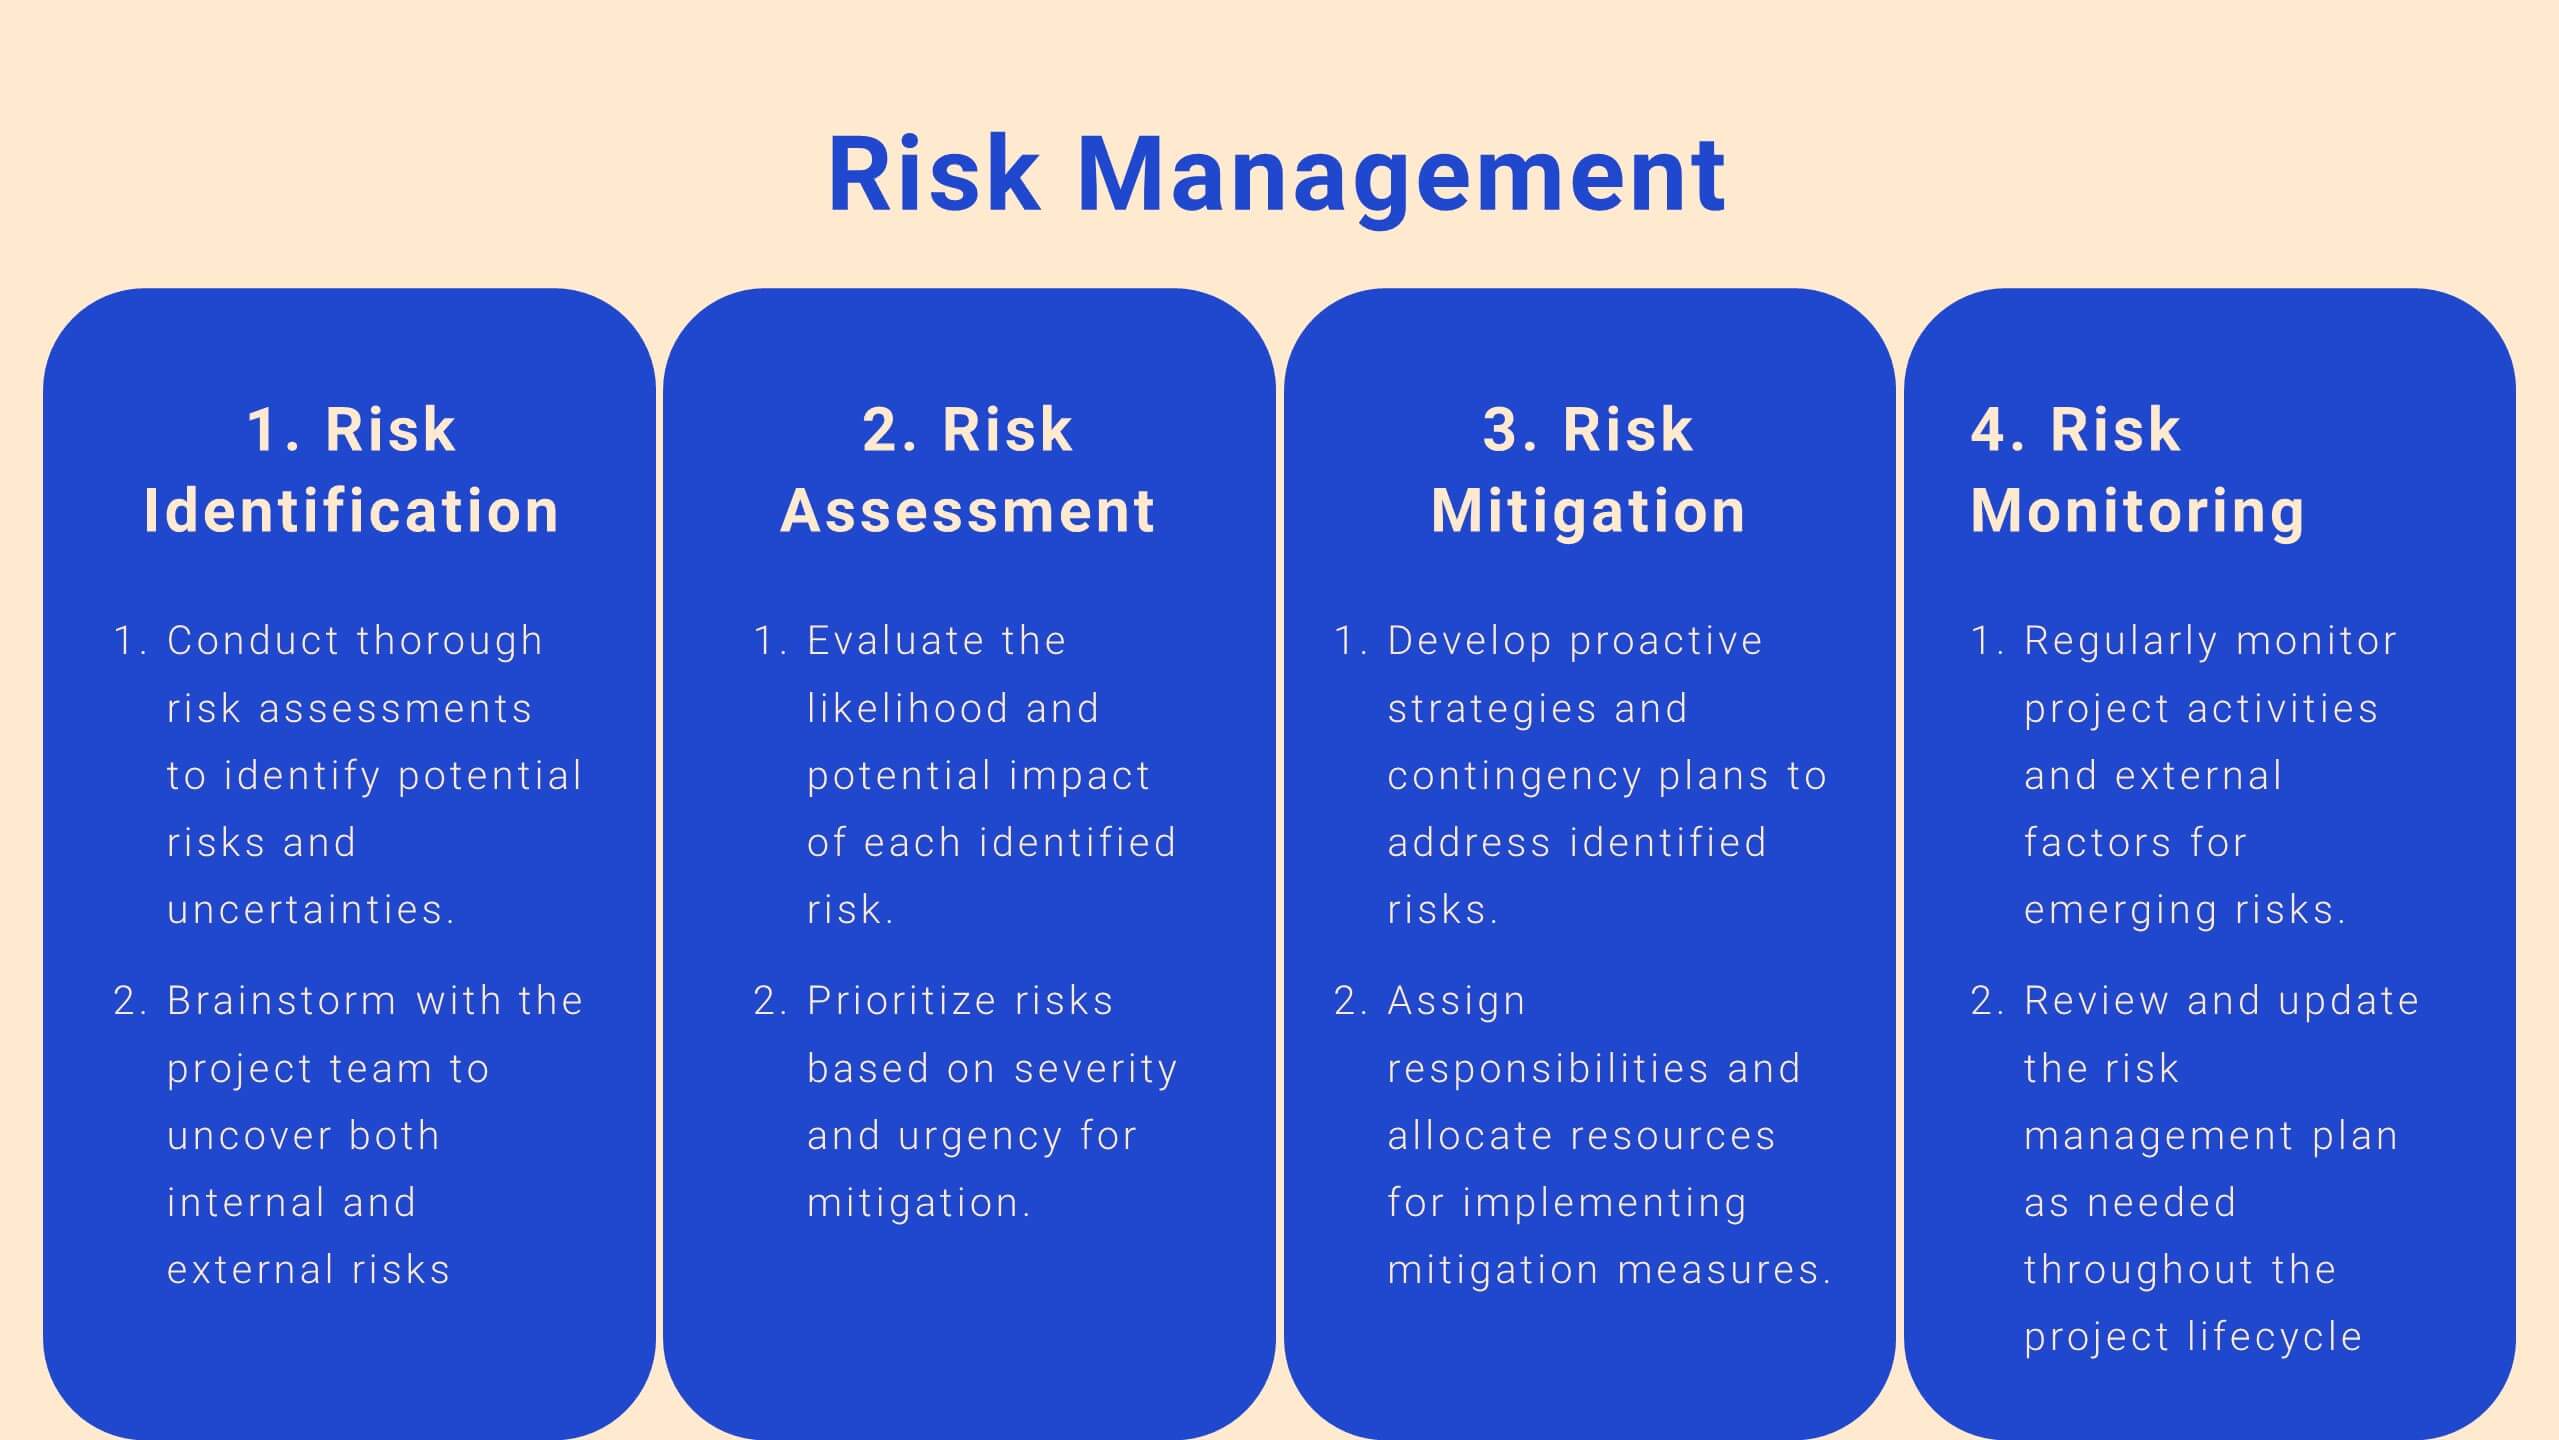
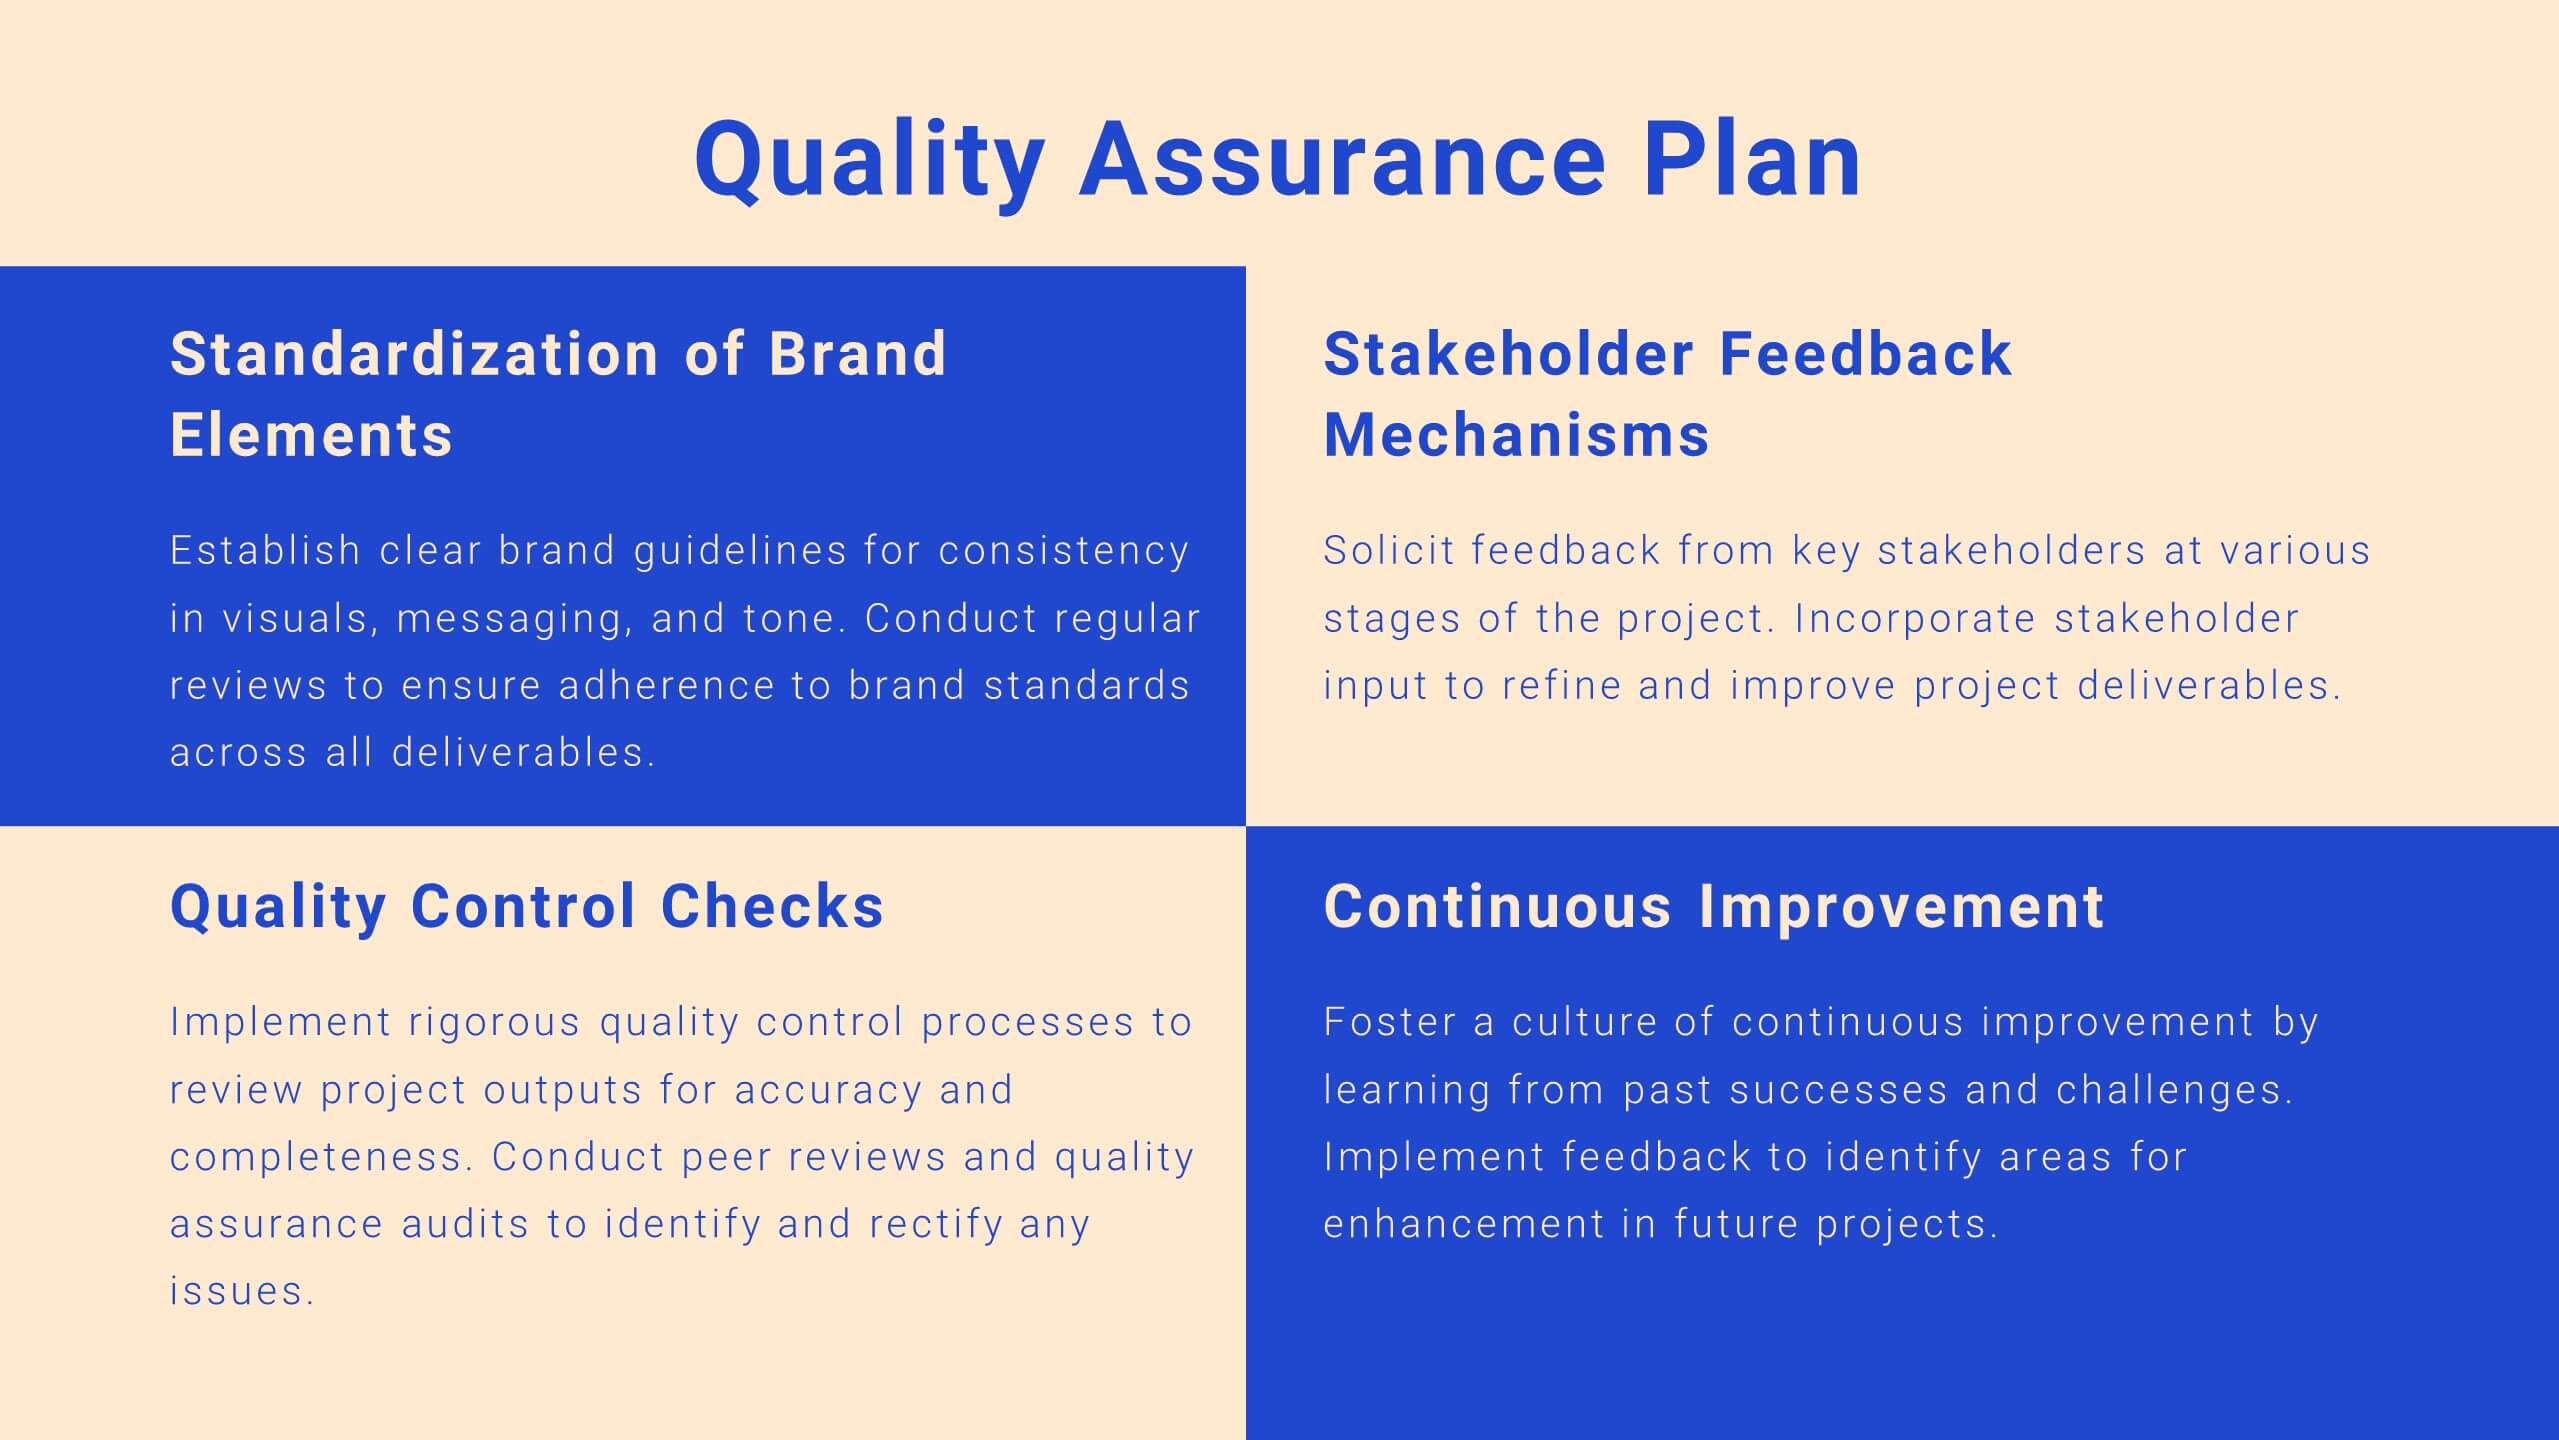
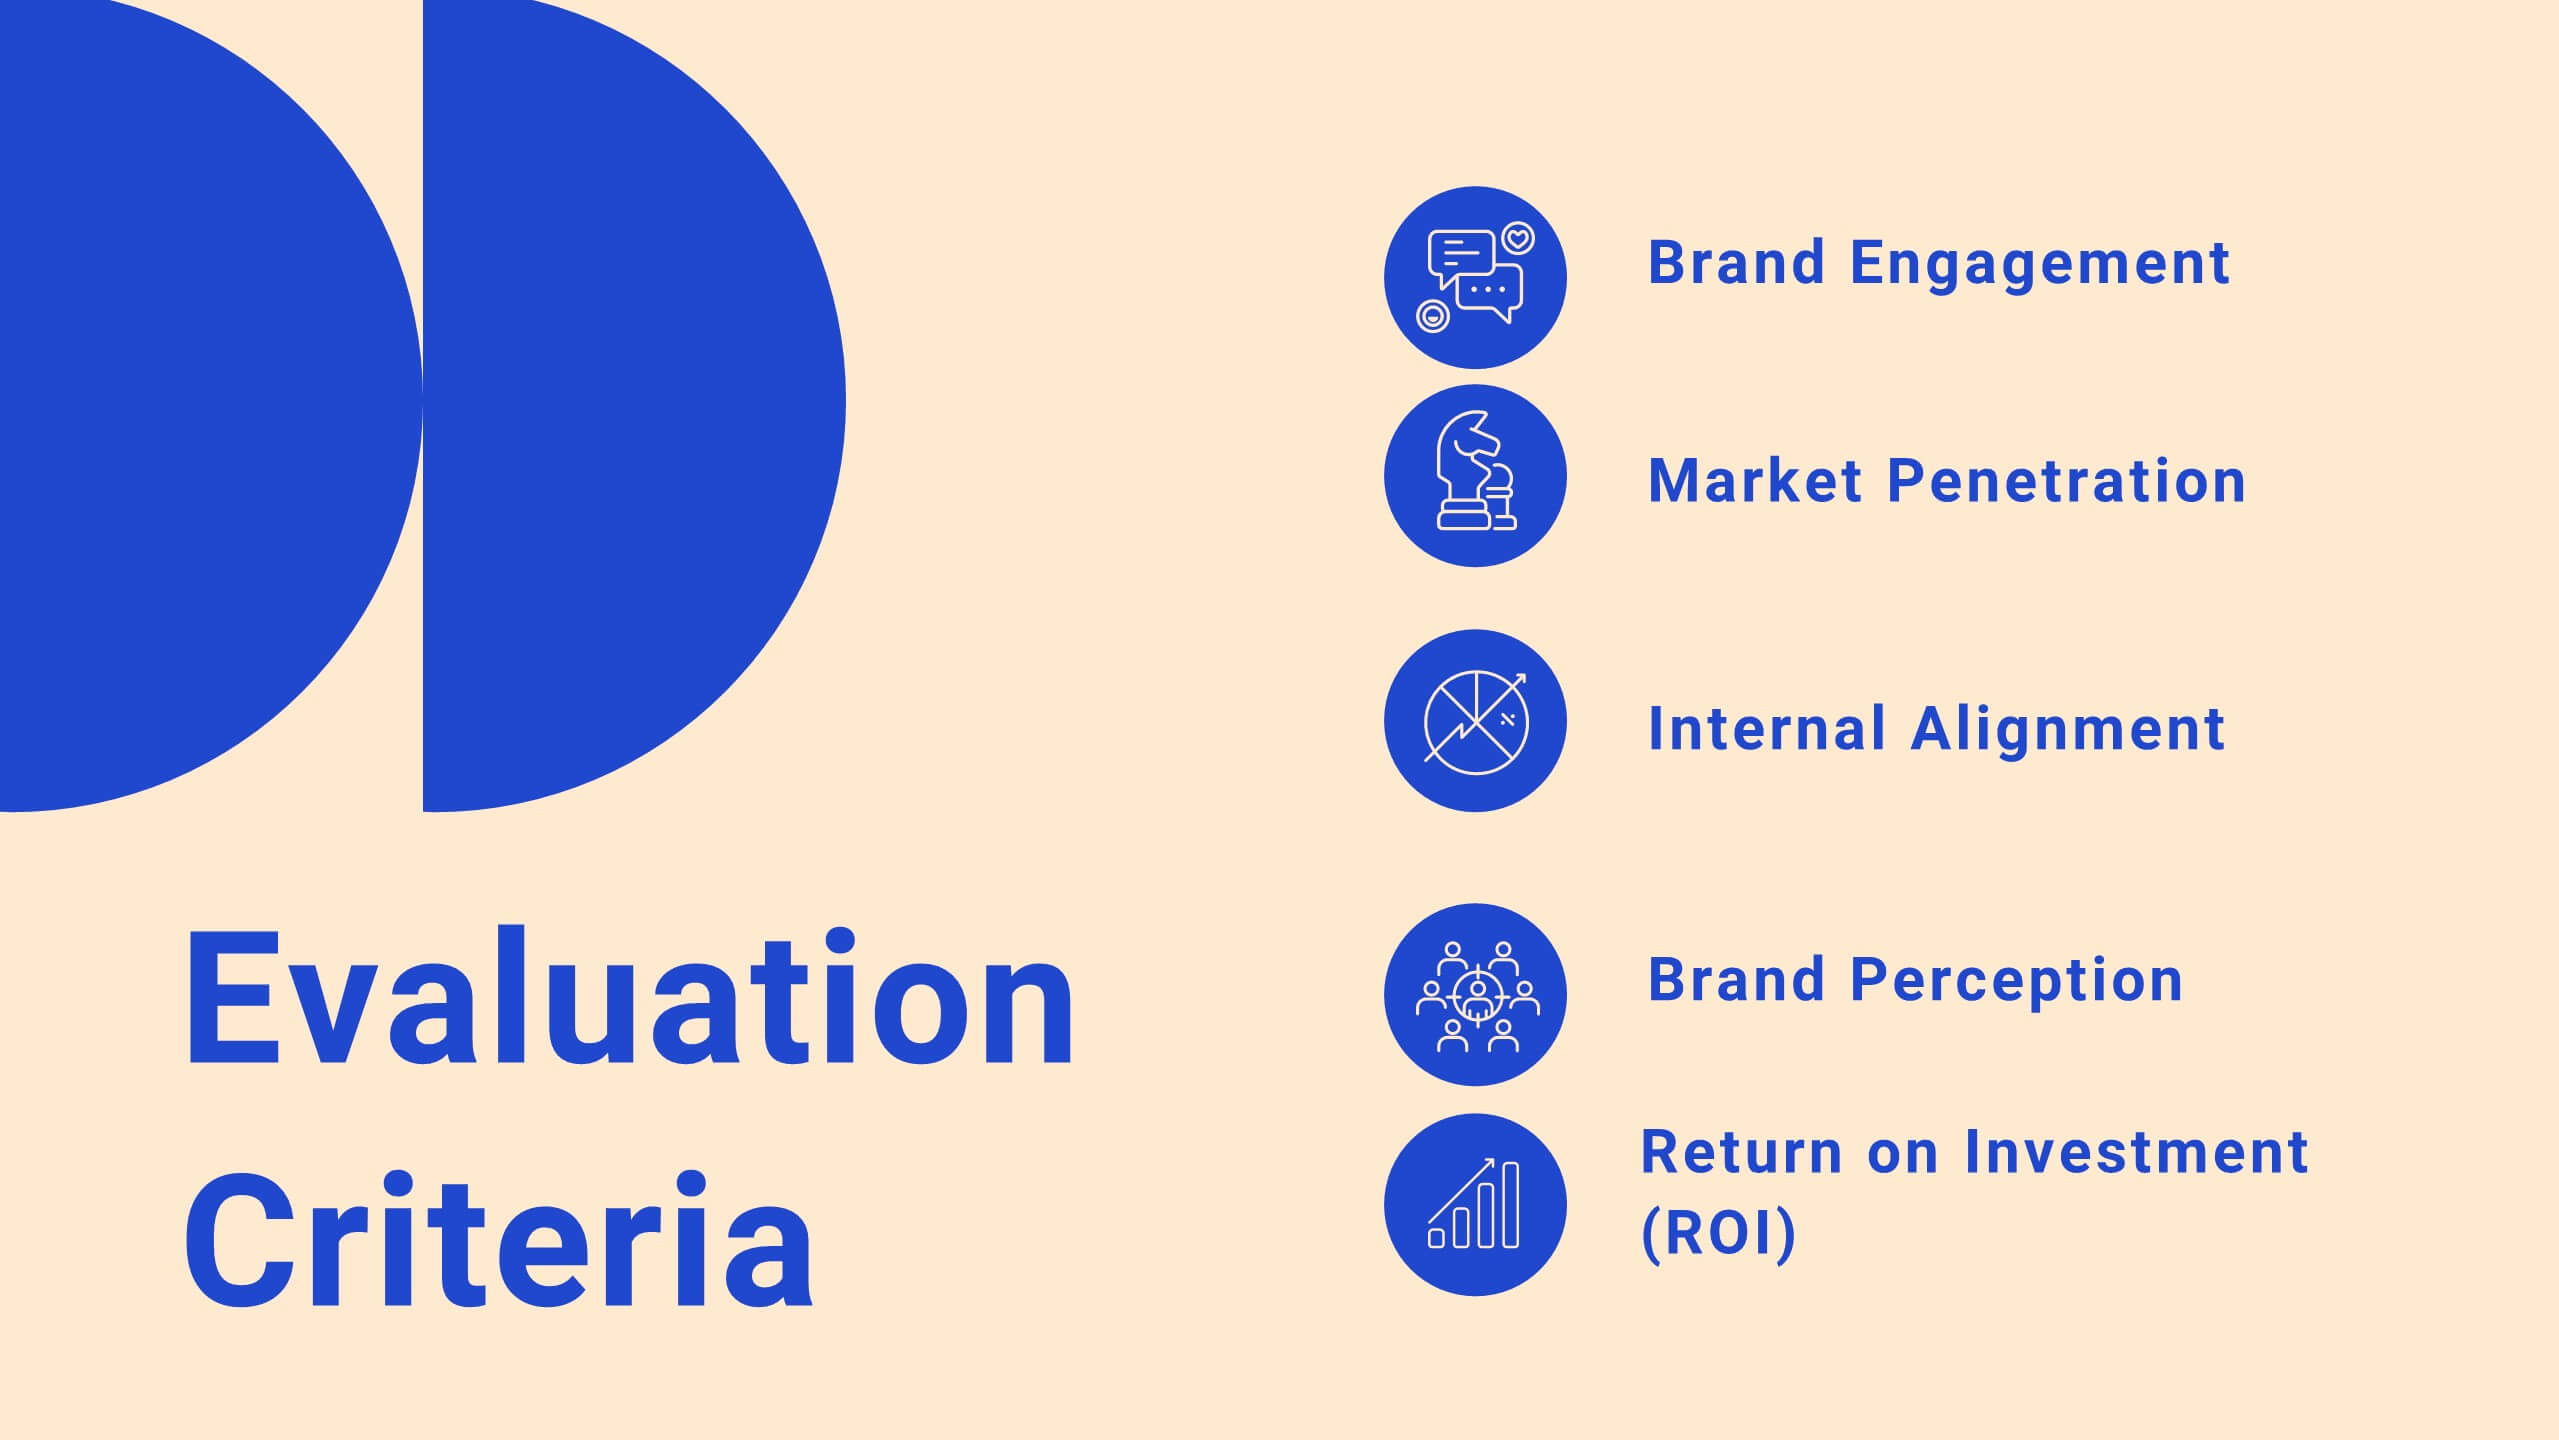
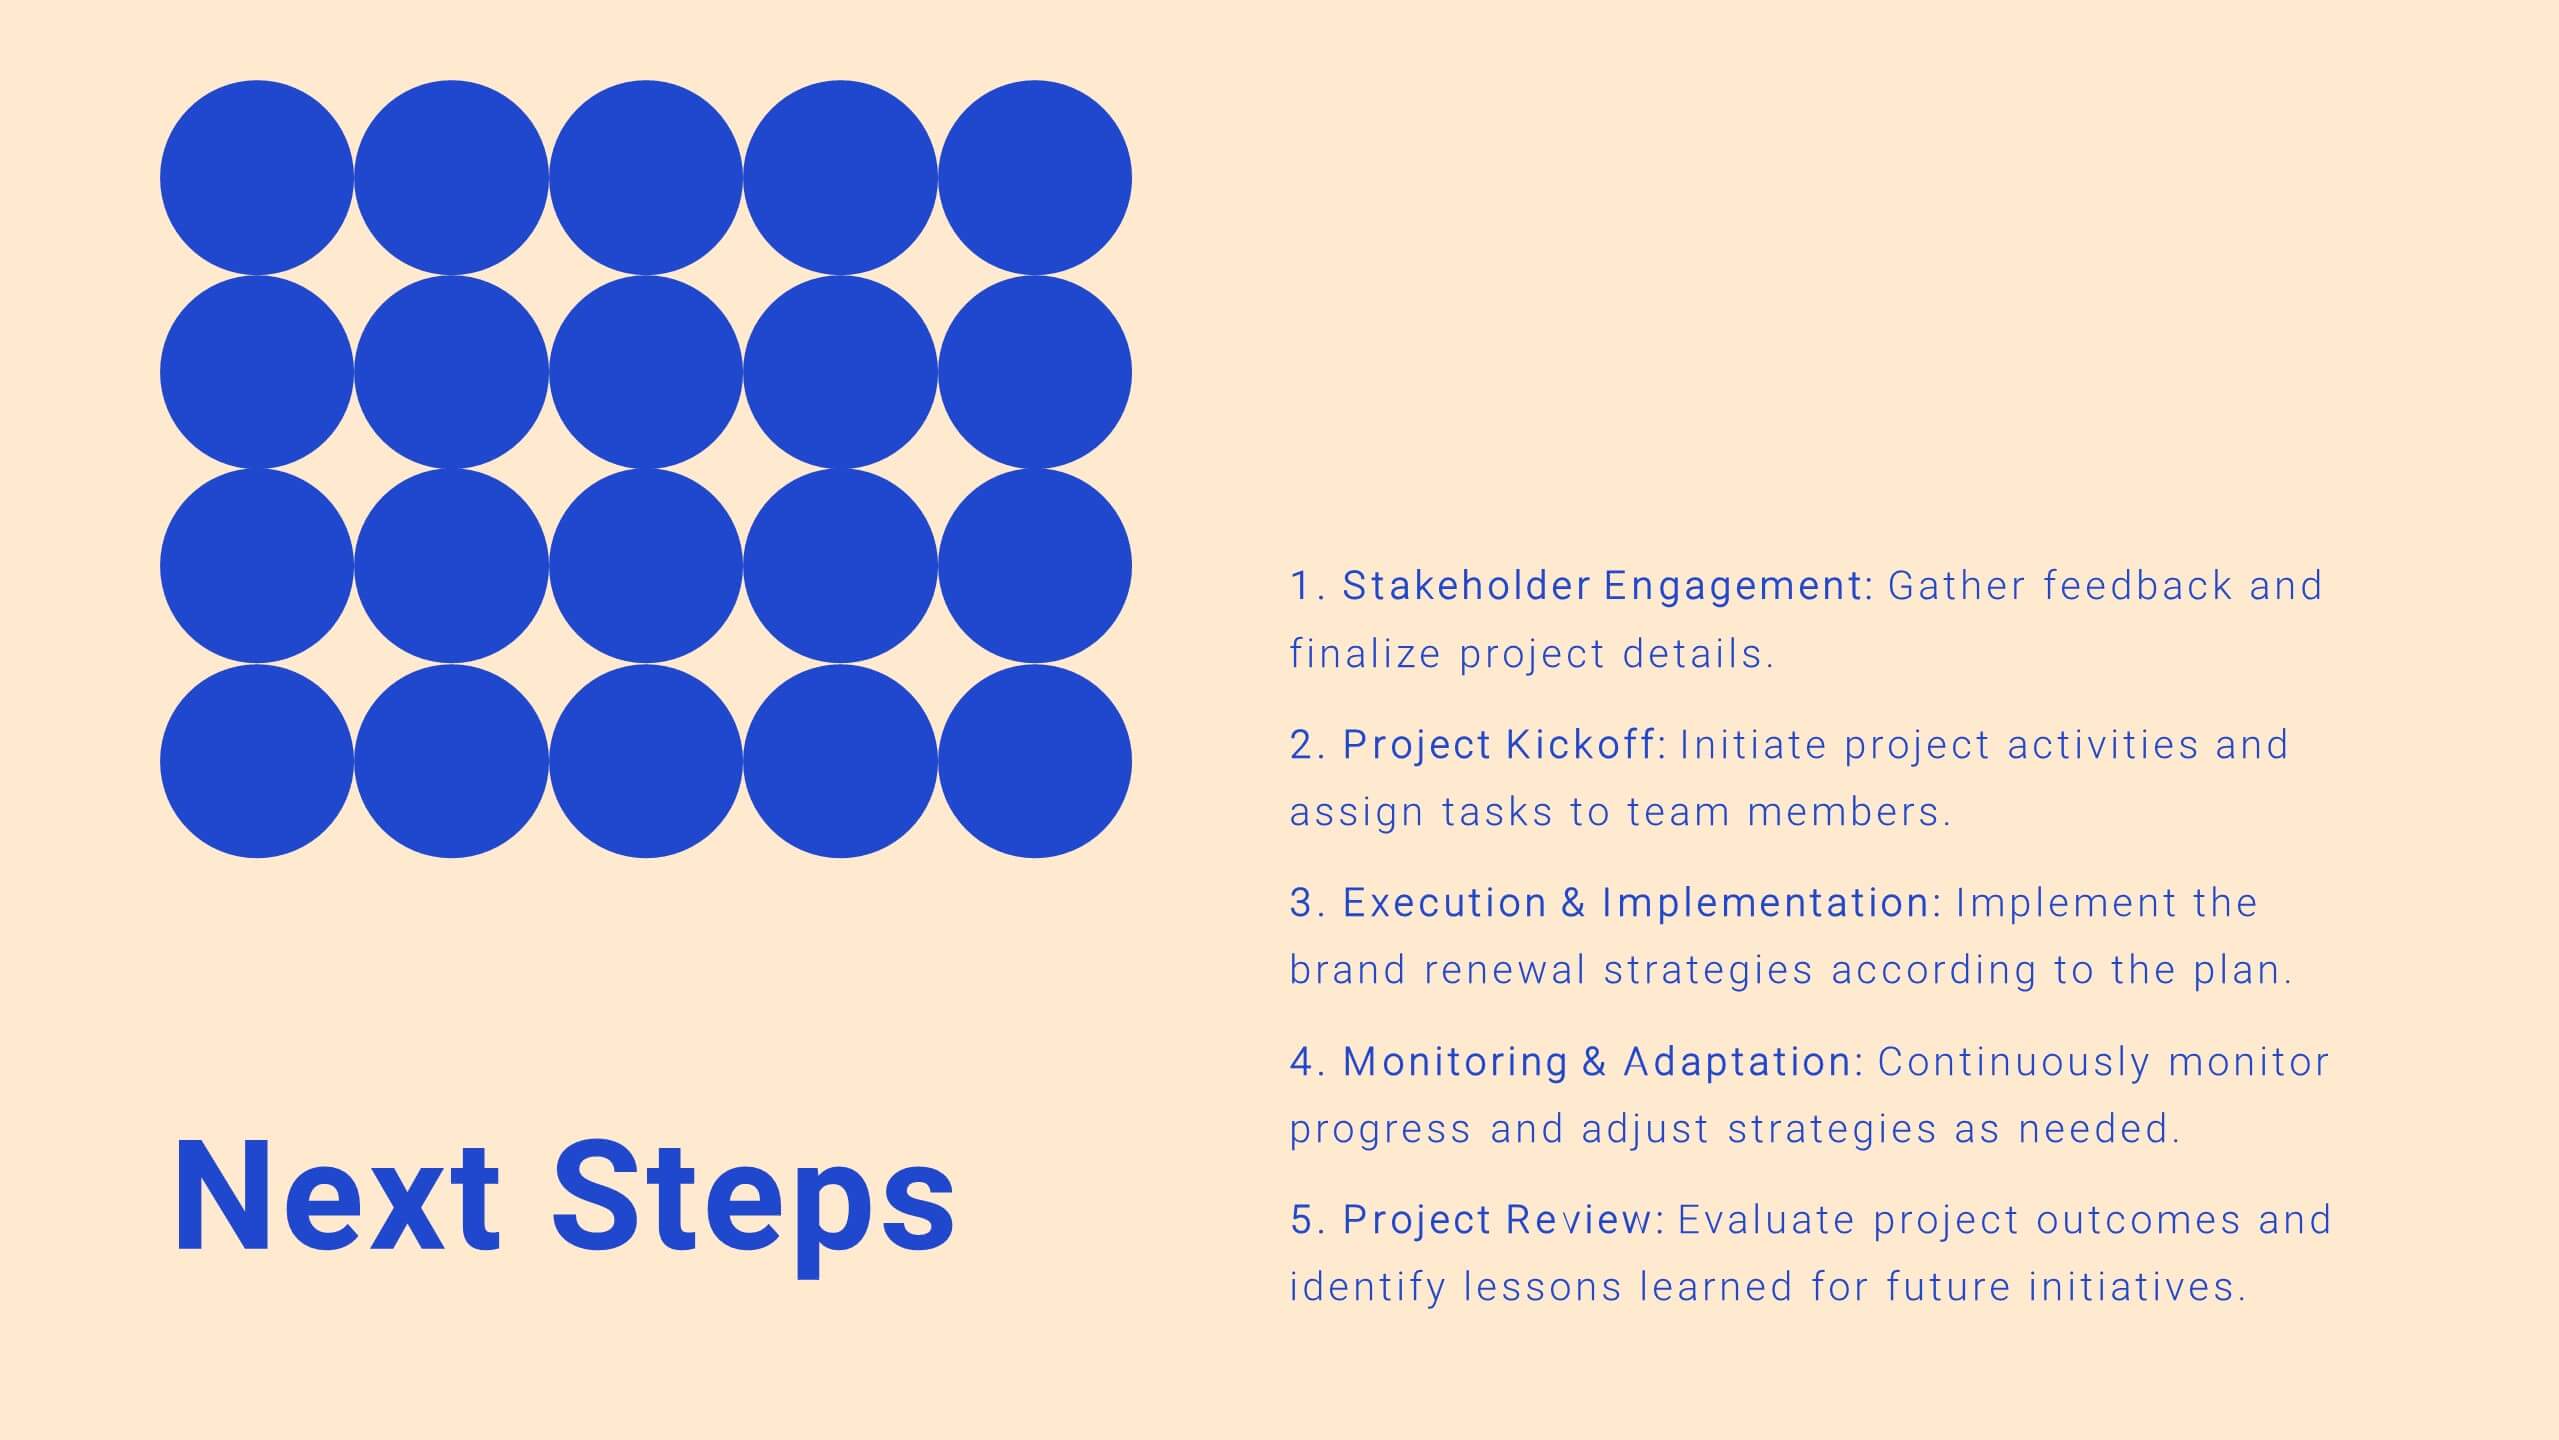
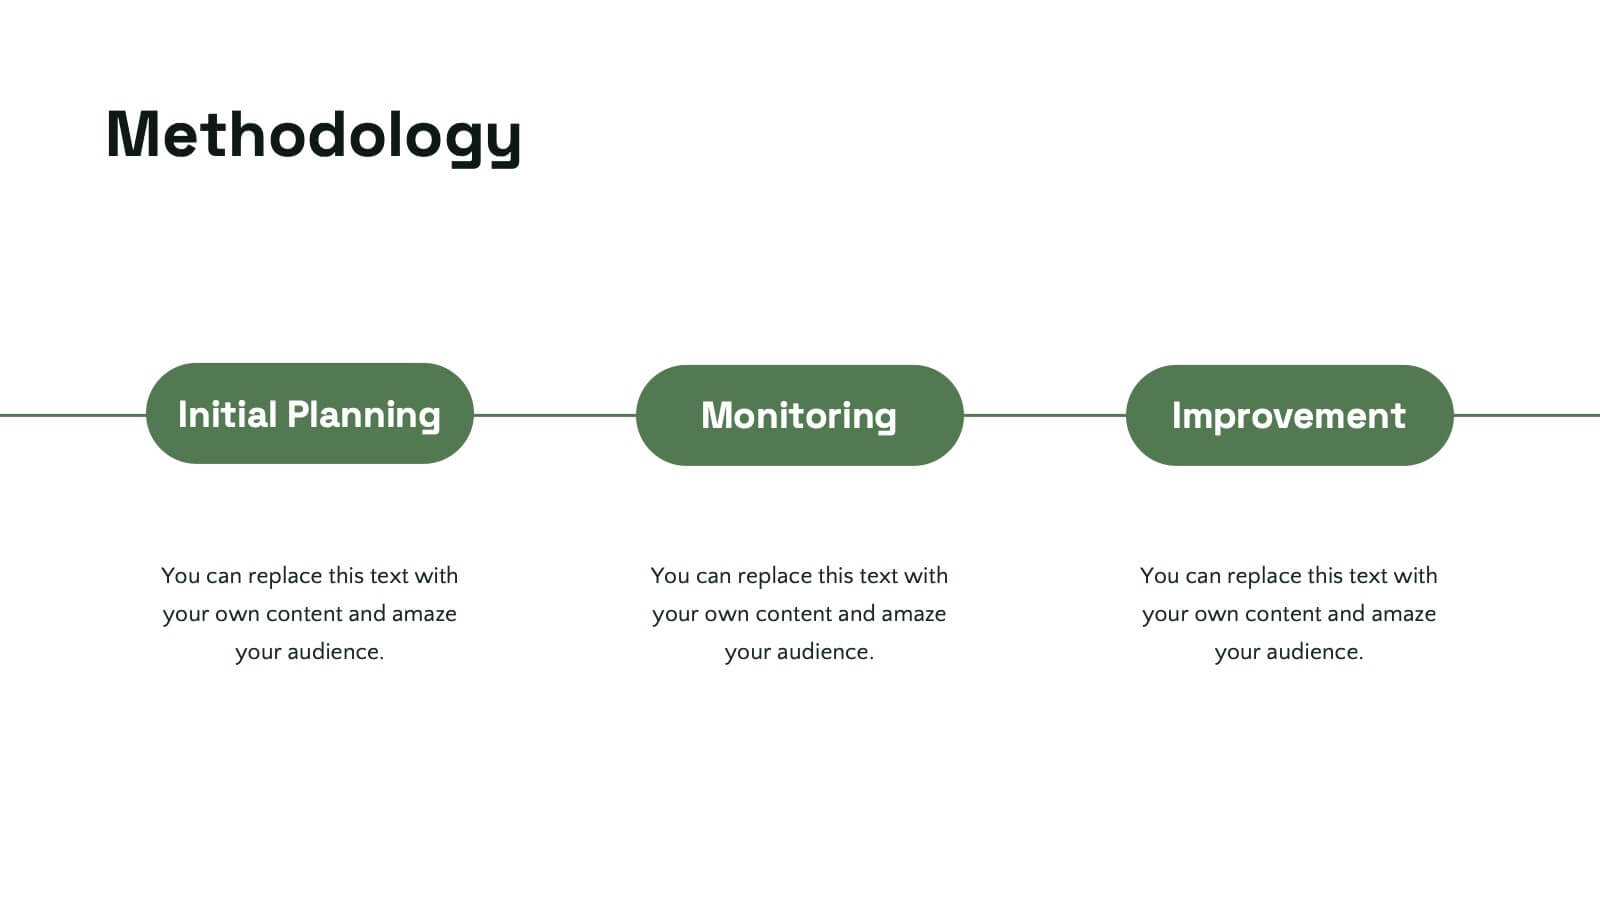
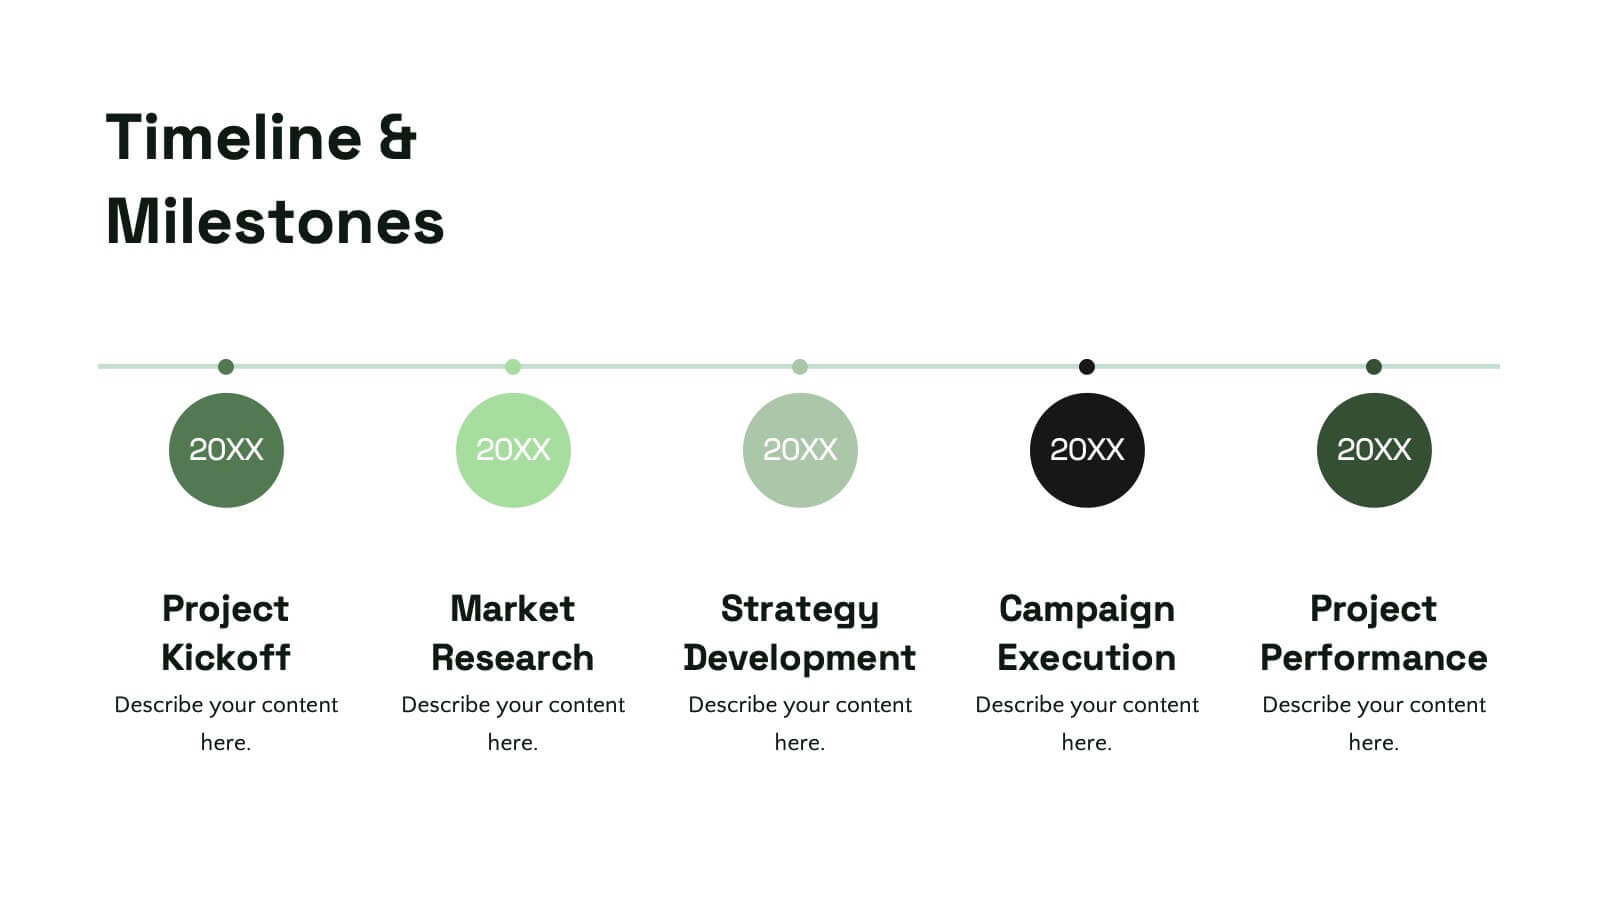
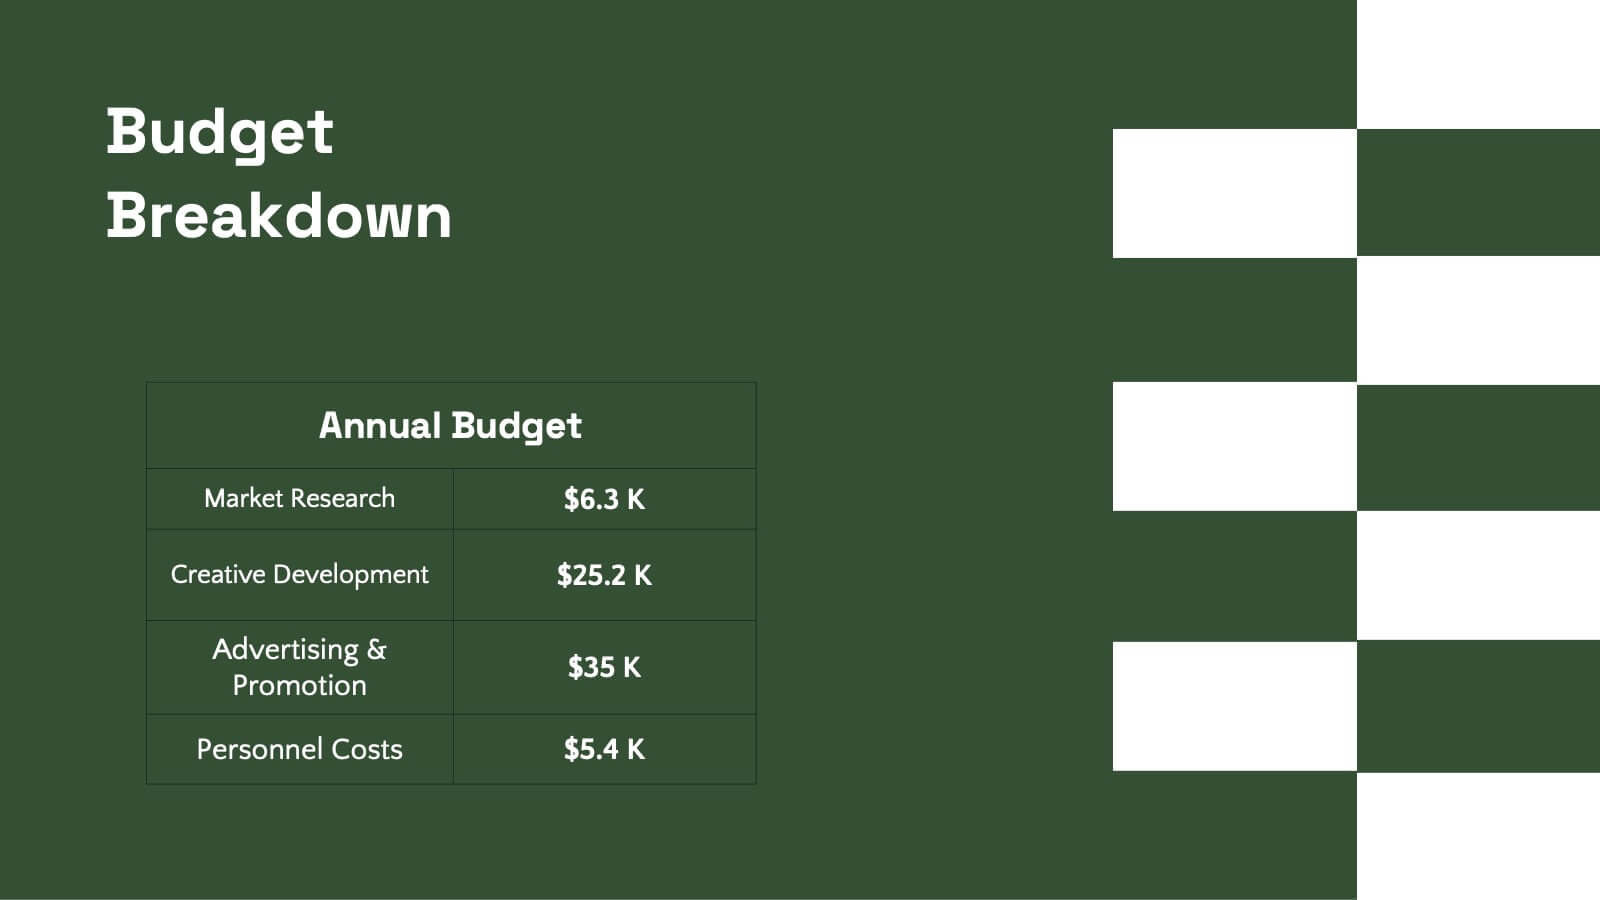
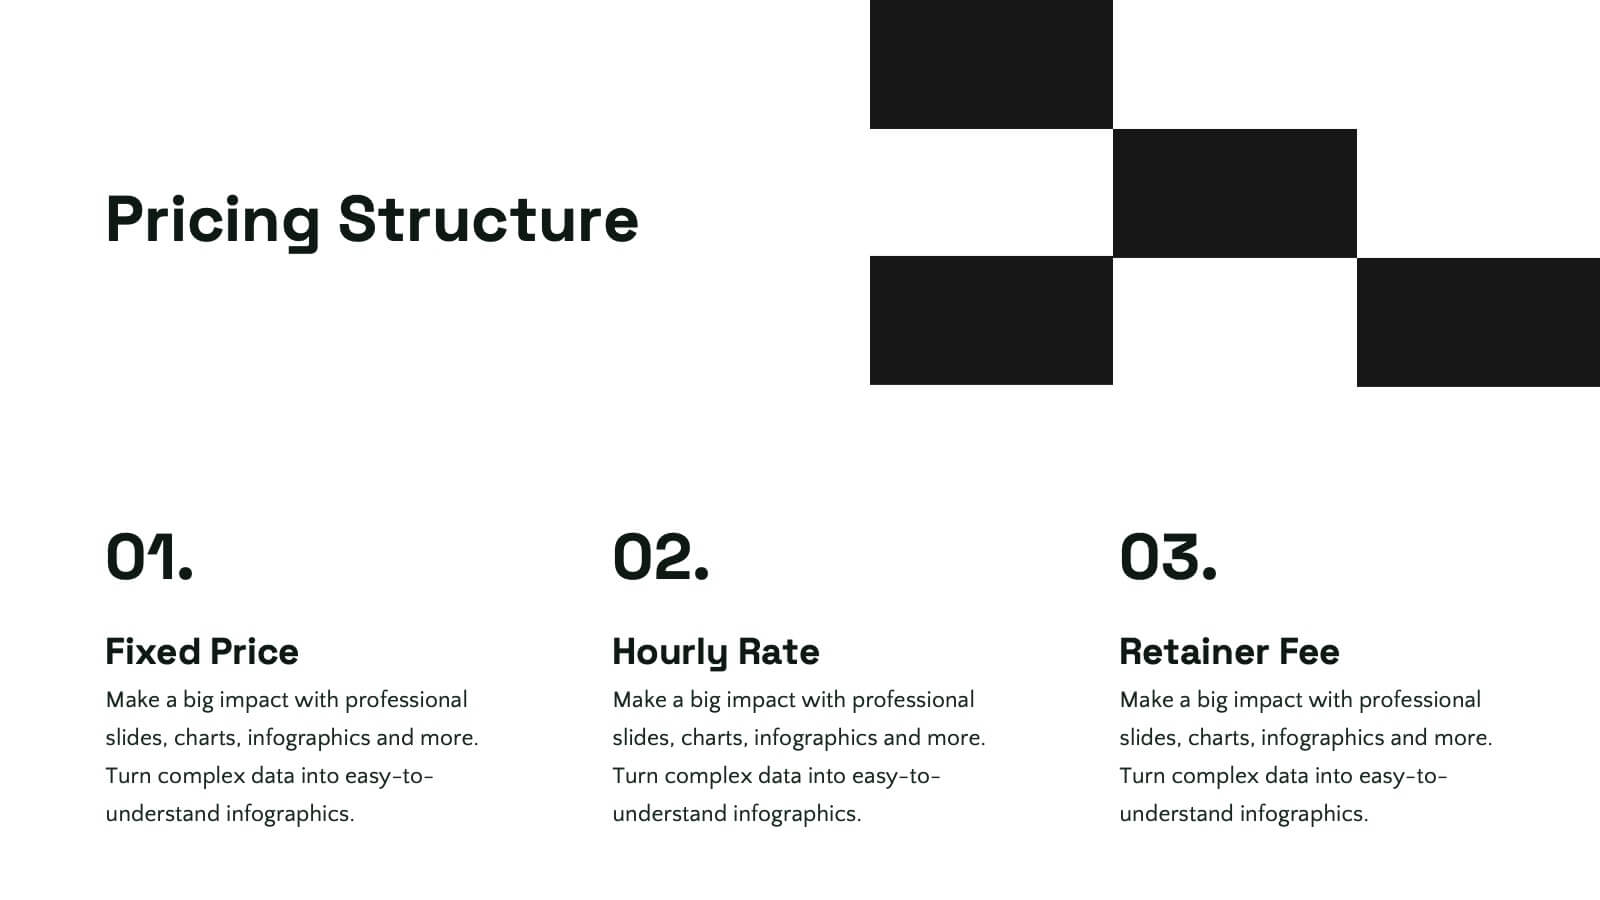
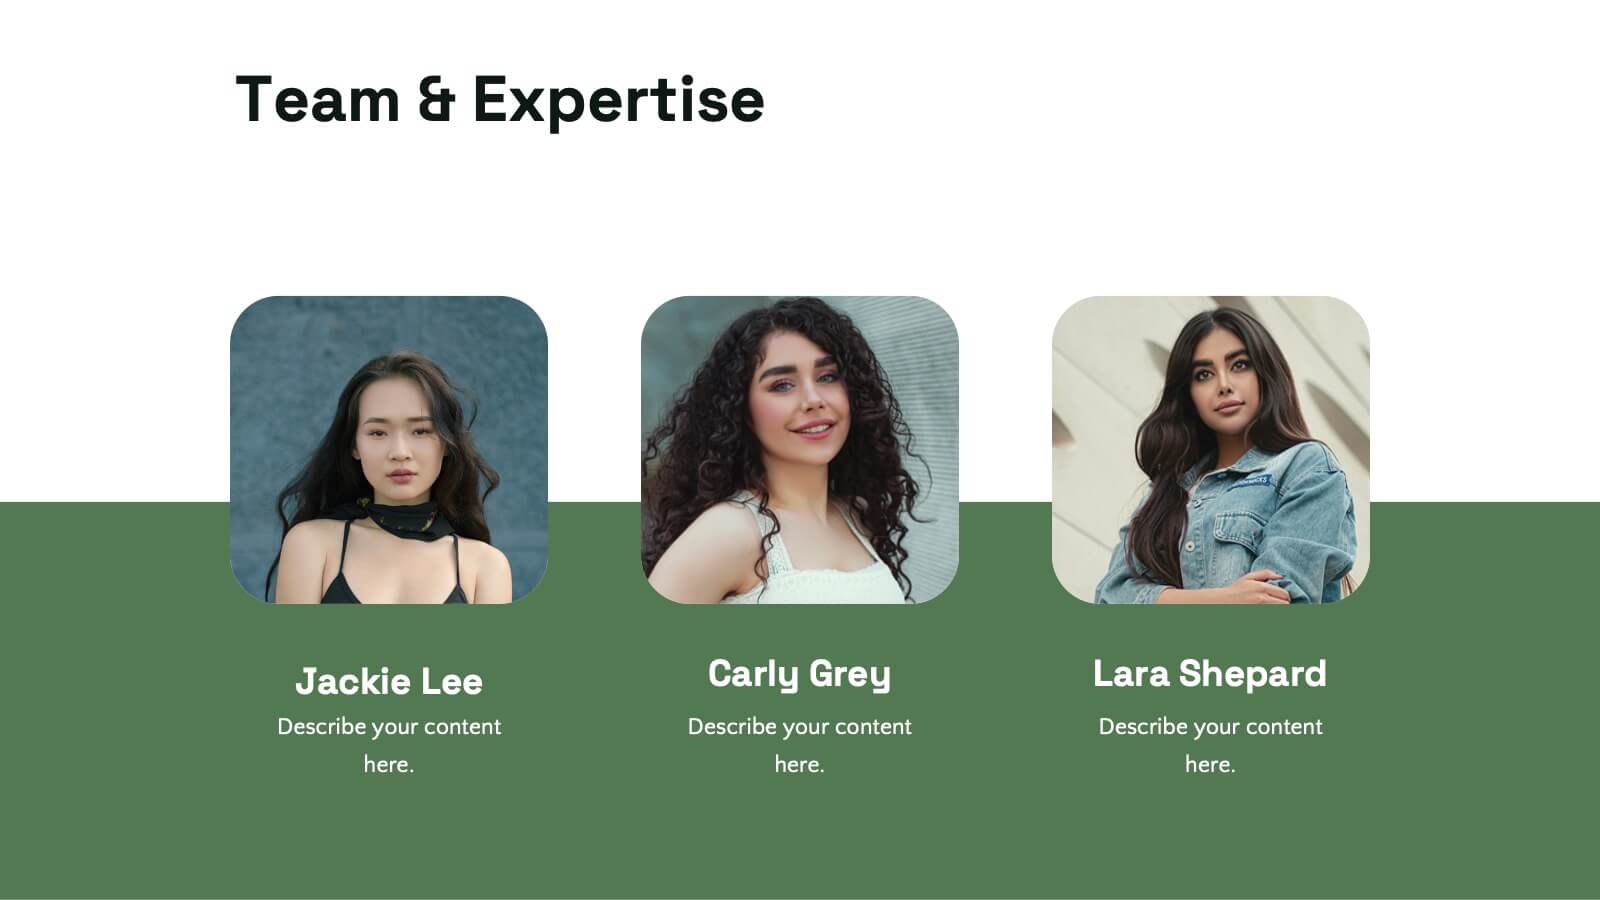
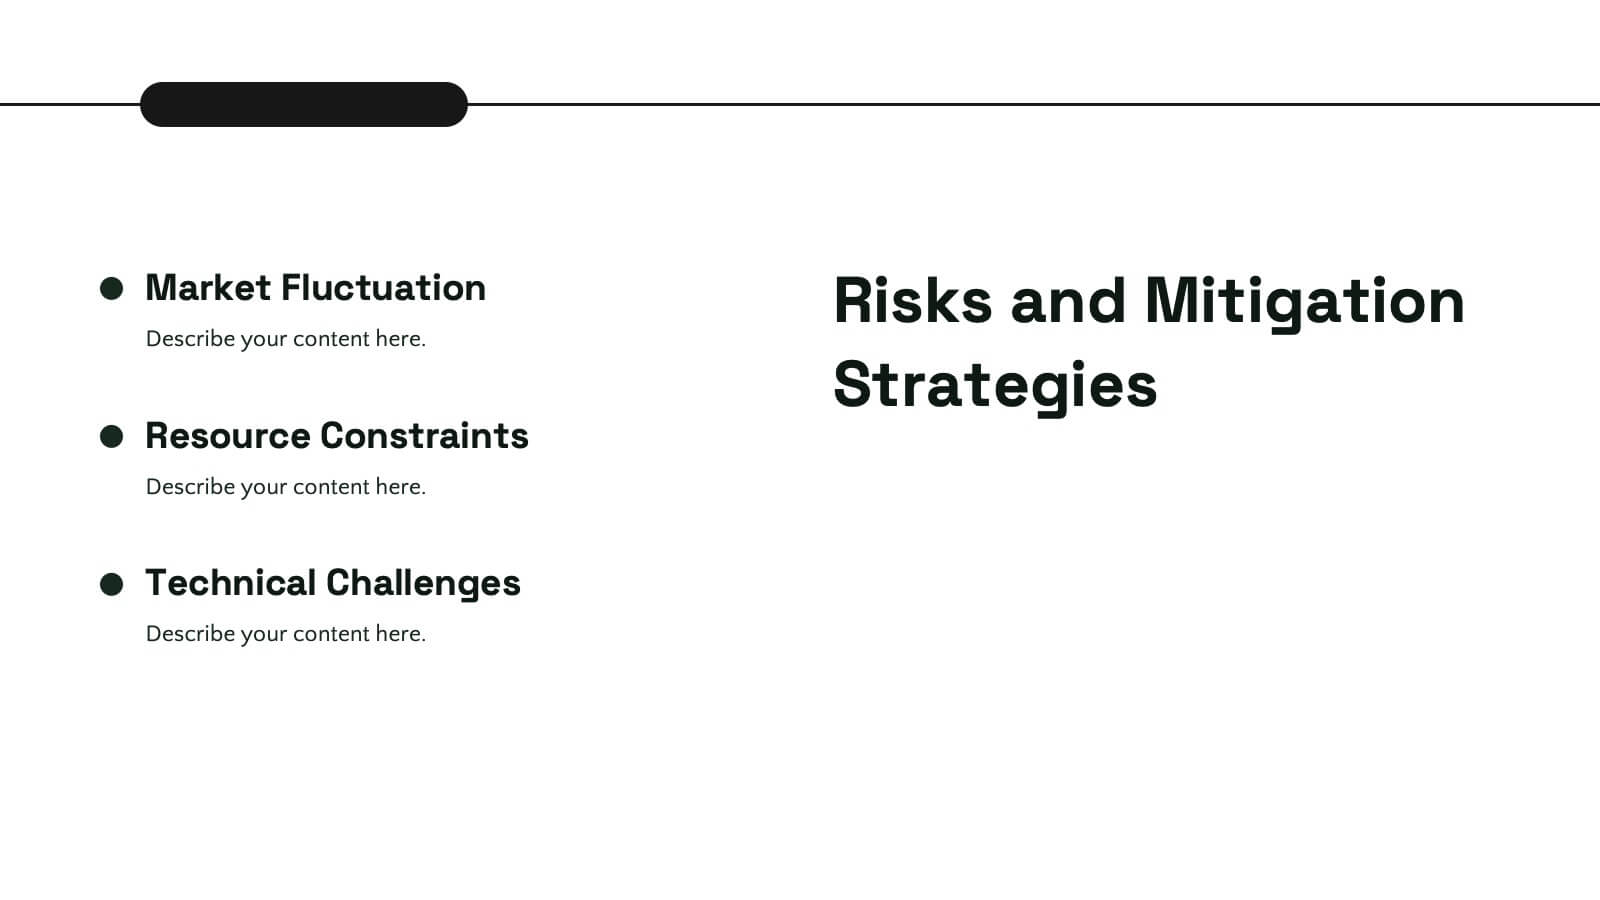
Drift Agile Project Plan Presentation
Take control of your projects with this comprehensive project plan template! From introductions to detailed objectives, this template covers scope of work, methodology, timelines, budget breakdowns, and risk management. Ideal for ensuring your project stays on track, it also includes stakeholder analysis and quality assurance plans. Compatible with PowerPoint, Keynote, and Google Slides.


5 diapositivas
Employee Lifecycle Management Presentation
Visualize every stage of the employee journey with the Employee Lifecycle Management template. Featuring a streamlined process flow, this layout is ideal for showcasing recruitment, onboarding, development, retention, and offboarding strategies. Fully editable in Canva, PowerPoint, and Google Slides, allowing seamless customization to align with your HR goals and branding.


5 diapositivas
Natural Sources of Energy Infographics
The importance of Natural Energy lies in its ability to reduce environmental impact, promote energy security, and create economic benefits. This vertical infographic template showcases the various types of renewable energy sources. It has a modern and clean design that highlights the importance of using sustainable energy sources. The template features customizable photo layouts and charts, along with icons and illustrations related to the energy sector. With this template, you can easily create an infographic that educates your audience about the importance of renewable energy sources and encourages them to adopt sustainable practices.


7 diapositivas
Processed Food Infographic
Indulge in the intricate world of processed foods with our meticulously crafted infographic. Garnished in a palate of clean white and bold red, this template offers a delectable insight into how our everyday foods transition from raw ingredients to the final product on supermarket shelves. Compatible with Powerpoint, Keynote, and Google Slides, our template offers detailed graphics, intuitive icons, and straightforward image placeholders that dive deep into the realm of processed foods. This is a must-have for nutritionists, dieticians, food bloggers, or any individual keen on educating others about the nuances of processed foods in our daily diet.


6 diapositivas
Porter's Five Forces Competitive Rivalry Infographics
Analyze competitive rivalry effectively with our Porter's Five Forces Competitive Rivalry infographic template. This template is fully compatible with popular presentation software like PowerPoint, Keynote, and Google Slides, allowing you to easily customize it to illustrate and communicate the factors influencing competitive rivalry within an industry. The Porter's Five Forces Competitive Rivalry infographic template offers a visually engaging platform to outline Michael Porter's framework for analyzing competitive dynamics, with a focus on the competitive rivalry component. Whether you're a business strategist, analyst, or anyone interested in understanding industry competition, this template provides a user-friendly canvas to create informative presentations and educational materials. Deepen your understanding of Competitive Rivalry with this SEO-optimized infographic template, thoughtfully designed for clarity and ease of use. Customize it to showcase the factors affecting rivalry, such as the number of competitors, industry growth, differentiation, and exit barriers, ensuring that your audience gains valuable insights into competitive forces at play. Start crafting your personalized infographic today to analyze and strategize for competitive advantage effectively.


8 diapositivas
Organizational Hierarchy Tree Diagram Presentation
Streamline Your Organization! The Organizational Hierarchy Tree Diagram Presentation visualizes team structures, reporting relationships, and company workflows. Ideal for corporate presentations, HR planning, and decision-making, it features editable elements for seamless customization. Compatible with PowerPoint, Keynote, and Google Slides, ensuring professional clarity and impact in any business setting.


8 diapositivas
Financial Growth Planning Presentation
Plan and track financial success with this Financial Growth Planning template. This visually engaging slide features a stepwise roadmap with hexagonal icons, helping you outline budgeting, investments, and financial milestones in a clear and structured format. Perfect for financial analysts, business strategists, and executives, this slide is fully editable and compatible with PowerPoint, Keynote, and Google Slides.


7 diapositivas
College Schedule Infographic Presentation
A College Schedule infographic is a visual representation of a typical college schedule, which includes classes, extracurricular activities, and other commitments. This template can be used to help students plan and organize their time effectively, ensuring that they can balance their academic and personal responsibilities. This infographic includes weekly timed schedules in table and chart formats to present the schedules in a clear and easy to understand way. This template is a helpful tool for college students looking to manage their time effectively and balance their various tasks.


7 diapositivas
Business Office Scenes Infographic Presentation
Office Scene Infographics can be a valuable tool for businesses or organizations that want to showcase their workplace culture or attract potential employees by providing a visual representation of what it's like to work at their company. This template is designed to provide a visual representation of different office scenarios and activities. The template is fully customizable and can be used for a variety of purposes, such as internal communication, training, marketing, and educational. It has a unique design, easy customization, and compatibility with Powerpoint, Keynote and Google Slides.


6 diapositivas
SCRUM Methodology Infographic
Scrum is a widely used agile project management framework that helps teams work collaboratively to develop complex products. This infographic template is designed to provide a quick overview of SCRUM for teams, stakeholders, or anyone interested in understanding its fundamental concepts. This template is well-suited for projects where requirements are constantly changing or not fully known at the start. This is characterized by its iterative and incremental approach, enabling teams to deliver high-quality products in a flexible and adaptive manner. This is a popular agile methodology used in software development and project management.


5 diapositivas
Identifying Problems in Projects Presentation
Kickstart your analysis with a bold, colorful layout that makes uncovering project issues feel clear and structured. This presentation helps you outline challenges, compare causes, and guide teams toward practical solutions using a simple, organized flow. Fully compatible with PowerPoint, Keynote, and Google Slides.


5 diapositivas
SEO and Funnel Tactics in Marketing Presentation
Showcase your digital strategy step-by-step with the SEO and Funnel Tactics in Marketing Presentation. Designed with a layered visual layout, this template helps you highlight up to five key stages of your marketing funnel—from awareness to conversion. Fully customizable in PowerPoint, Canva, Keynote, and Google Slides.

19 diapositivas
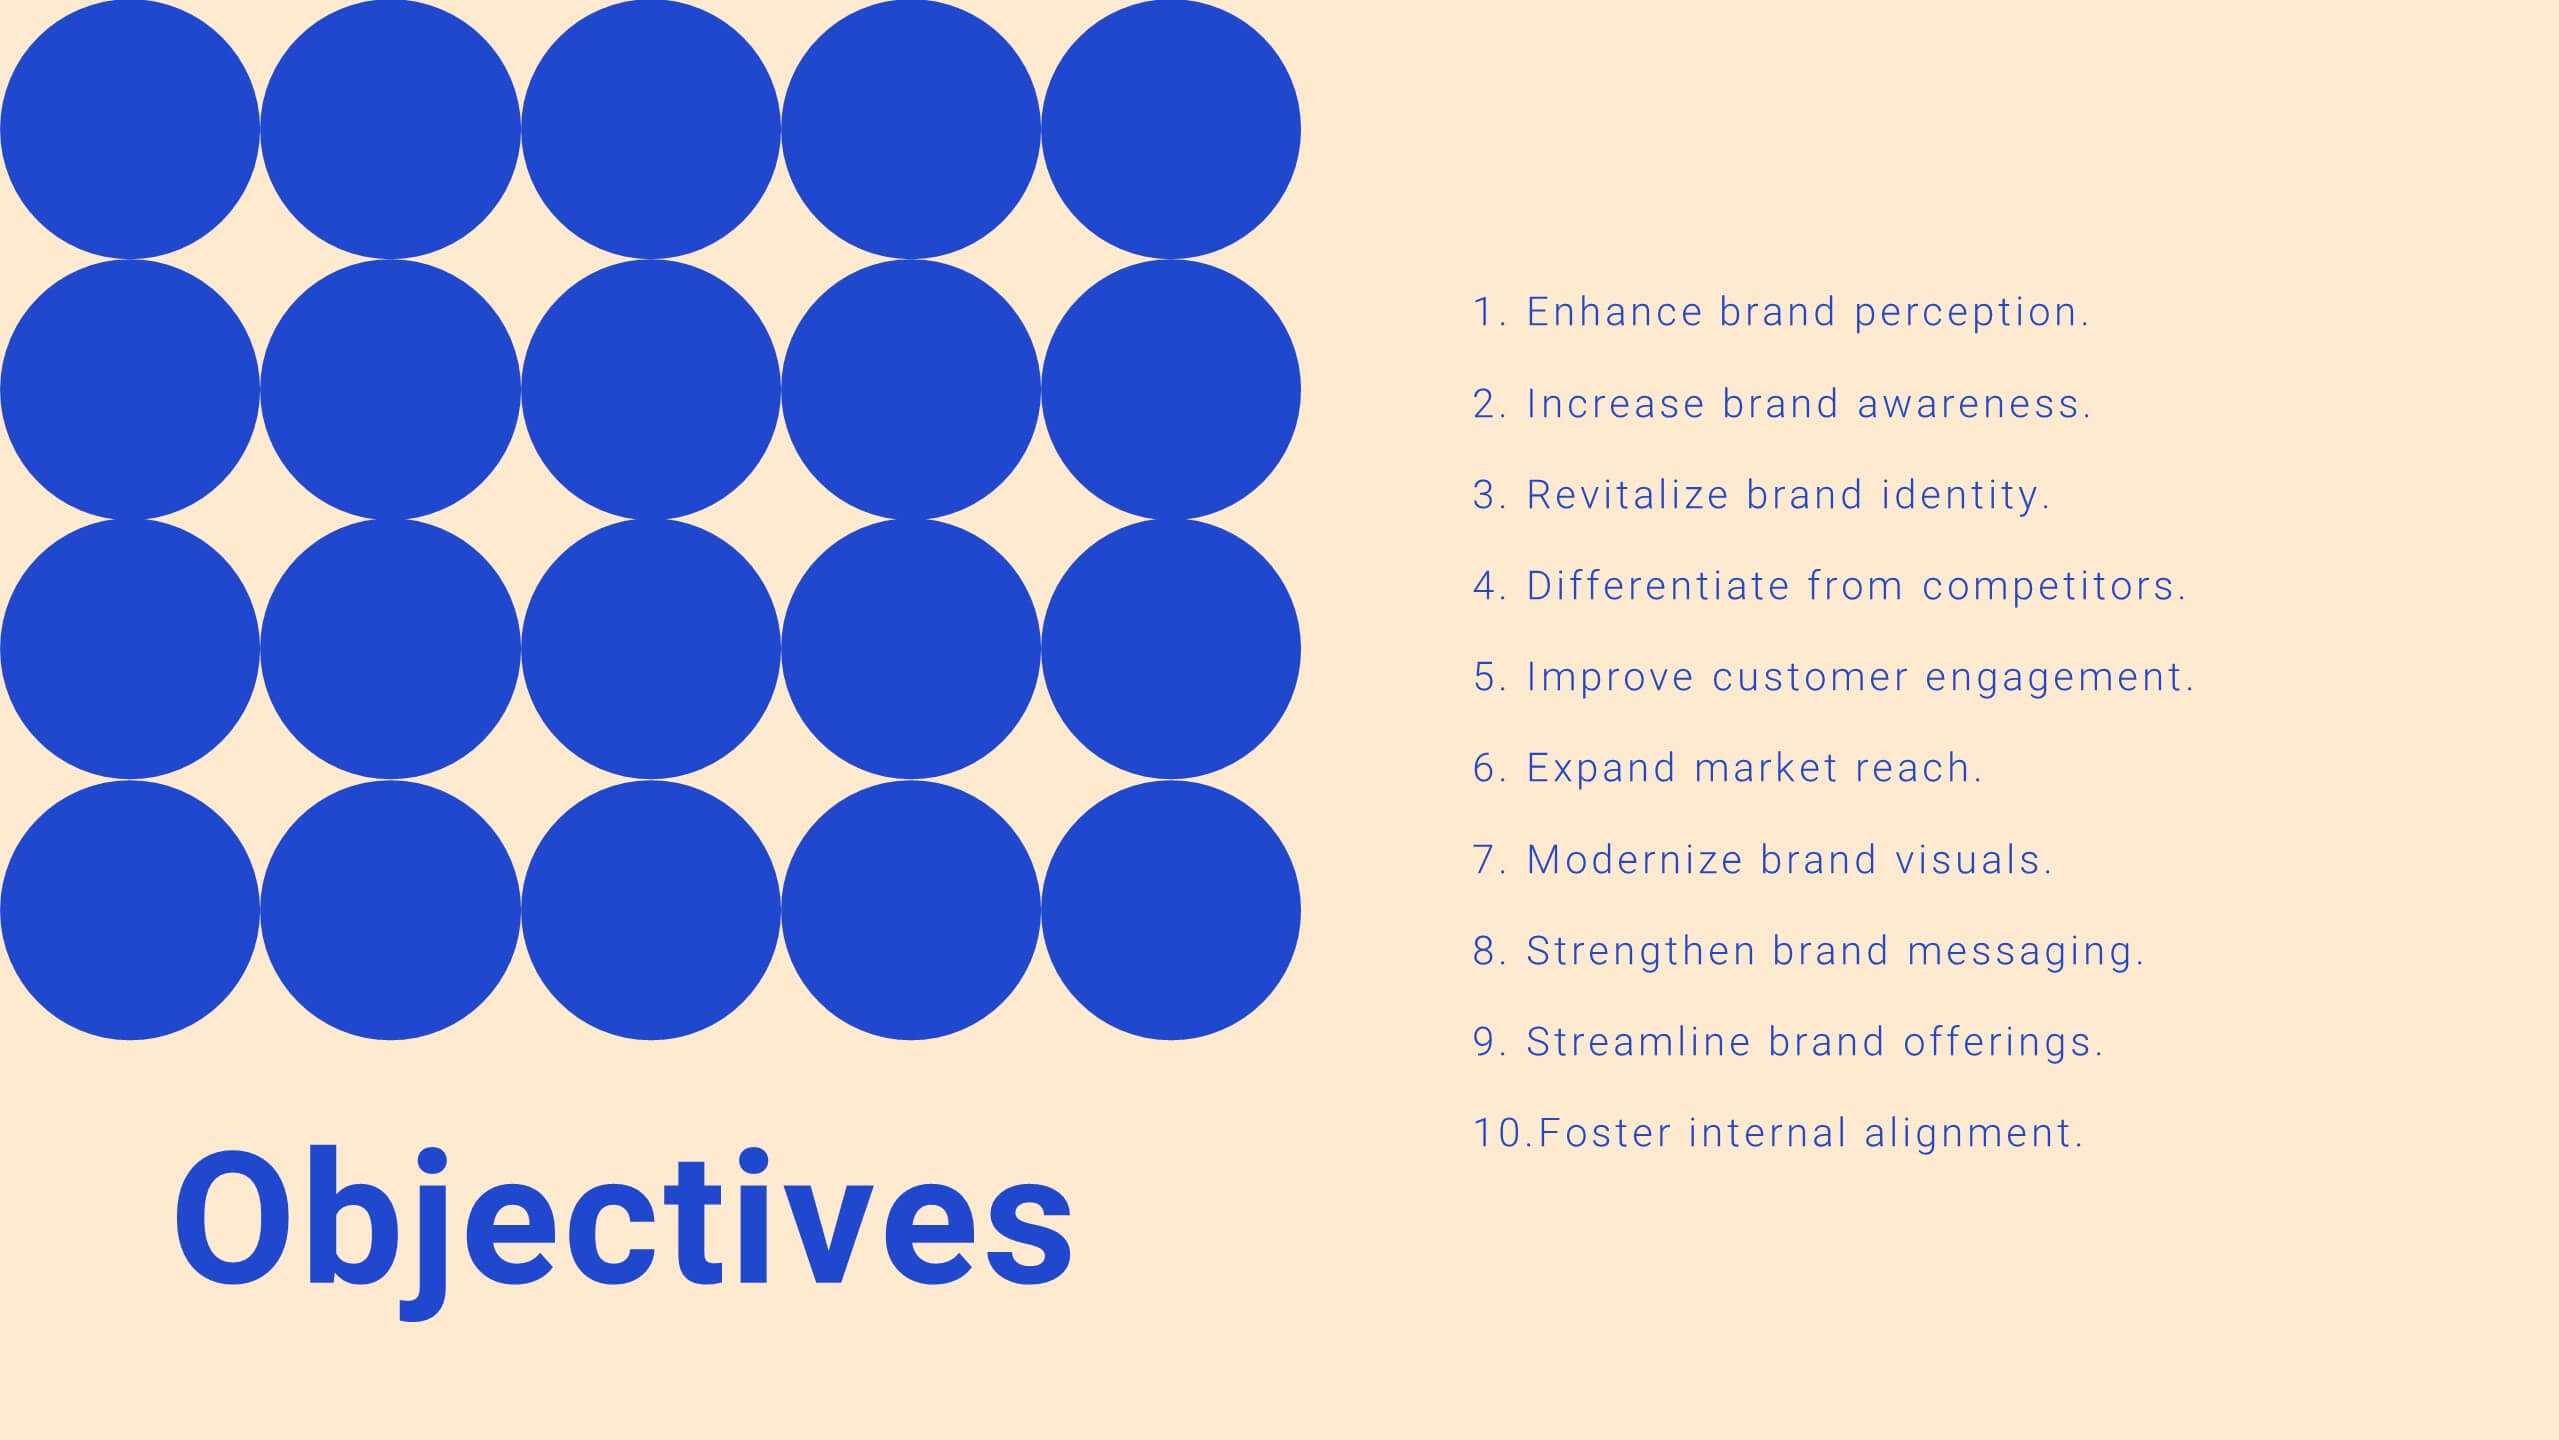
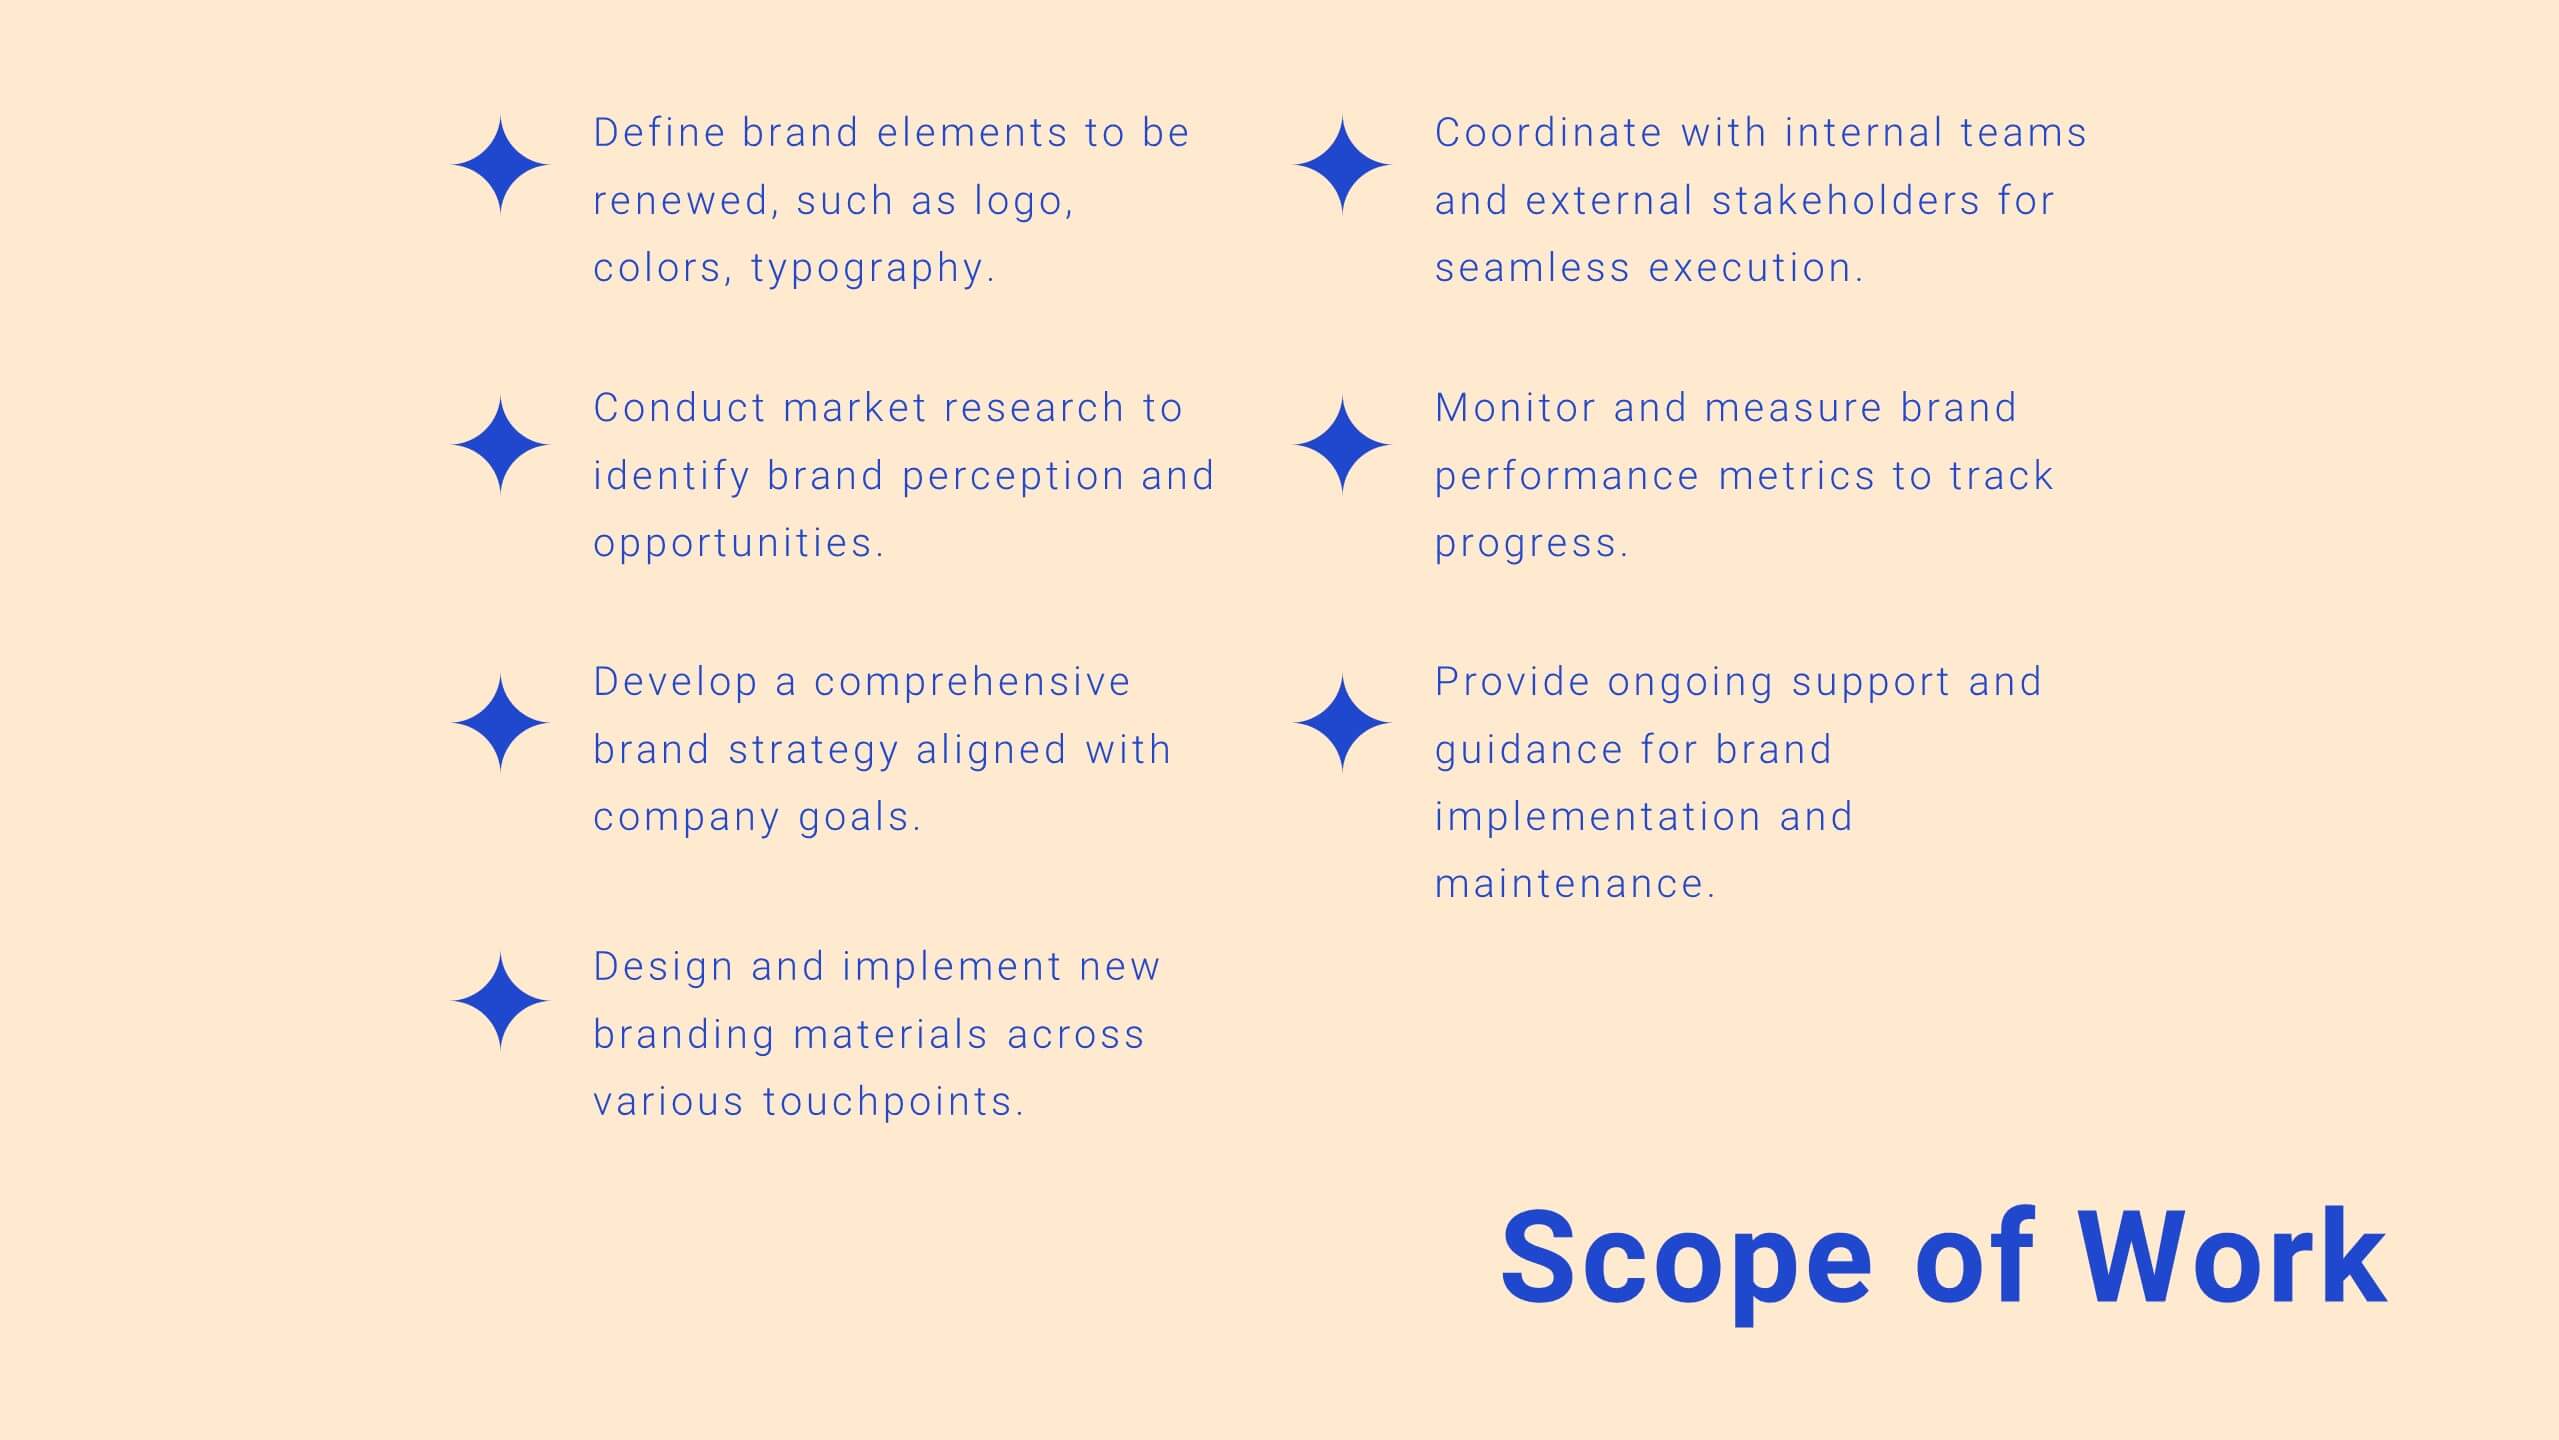
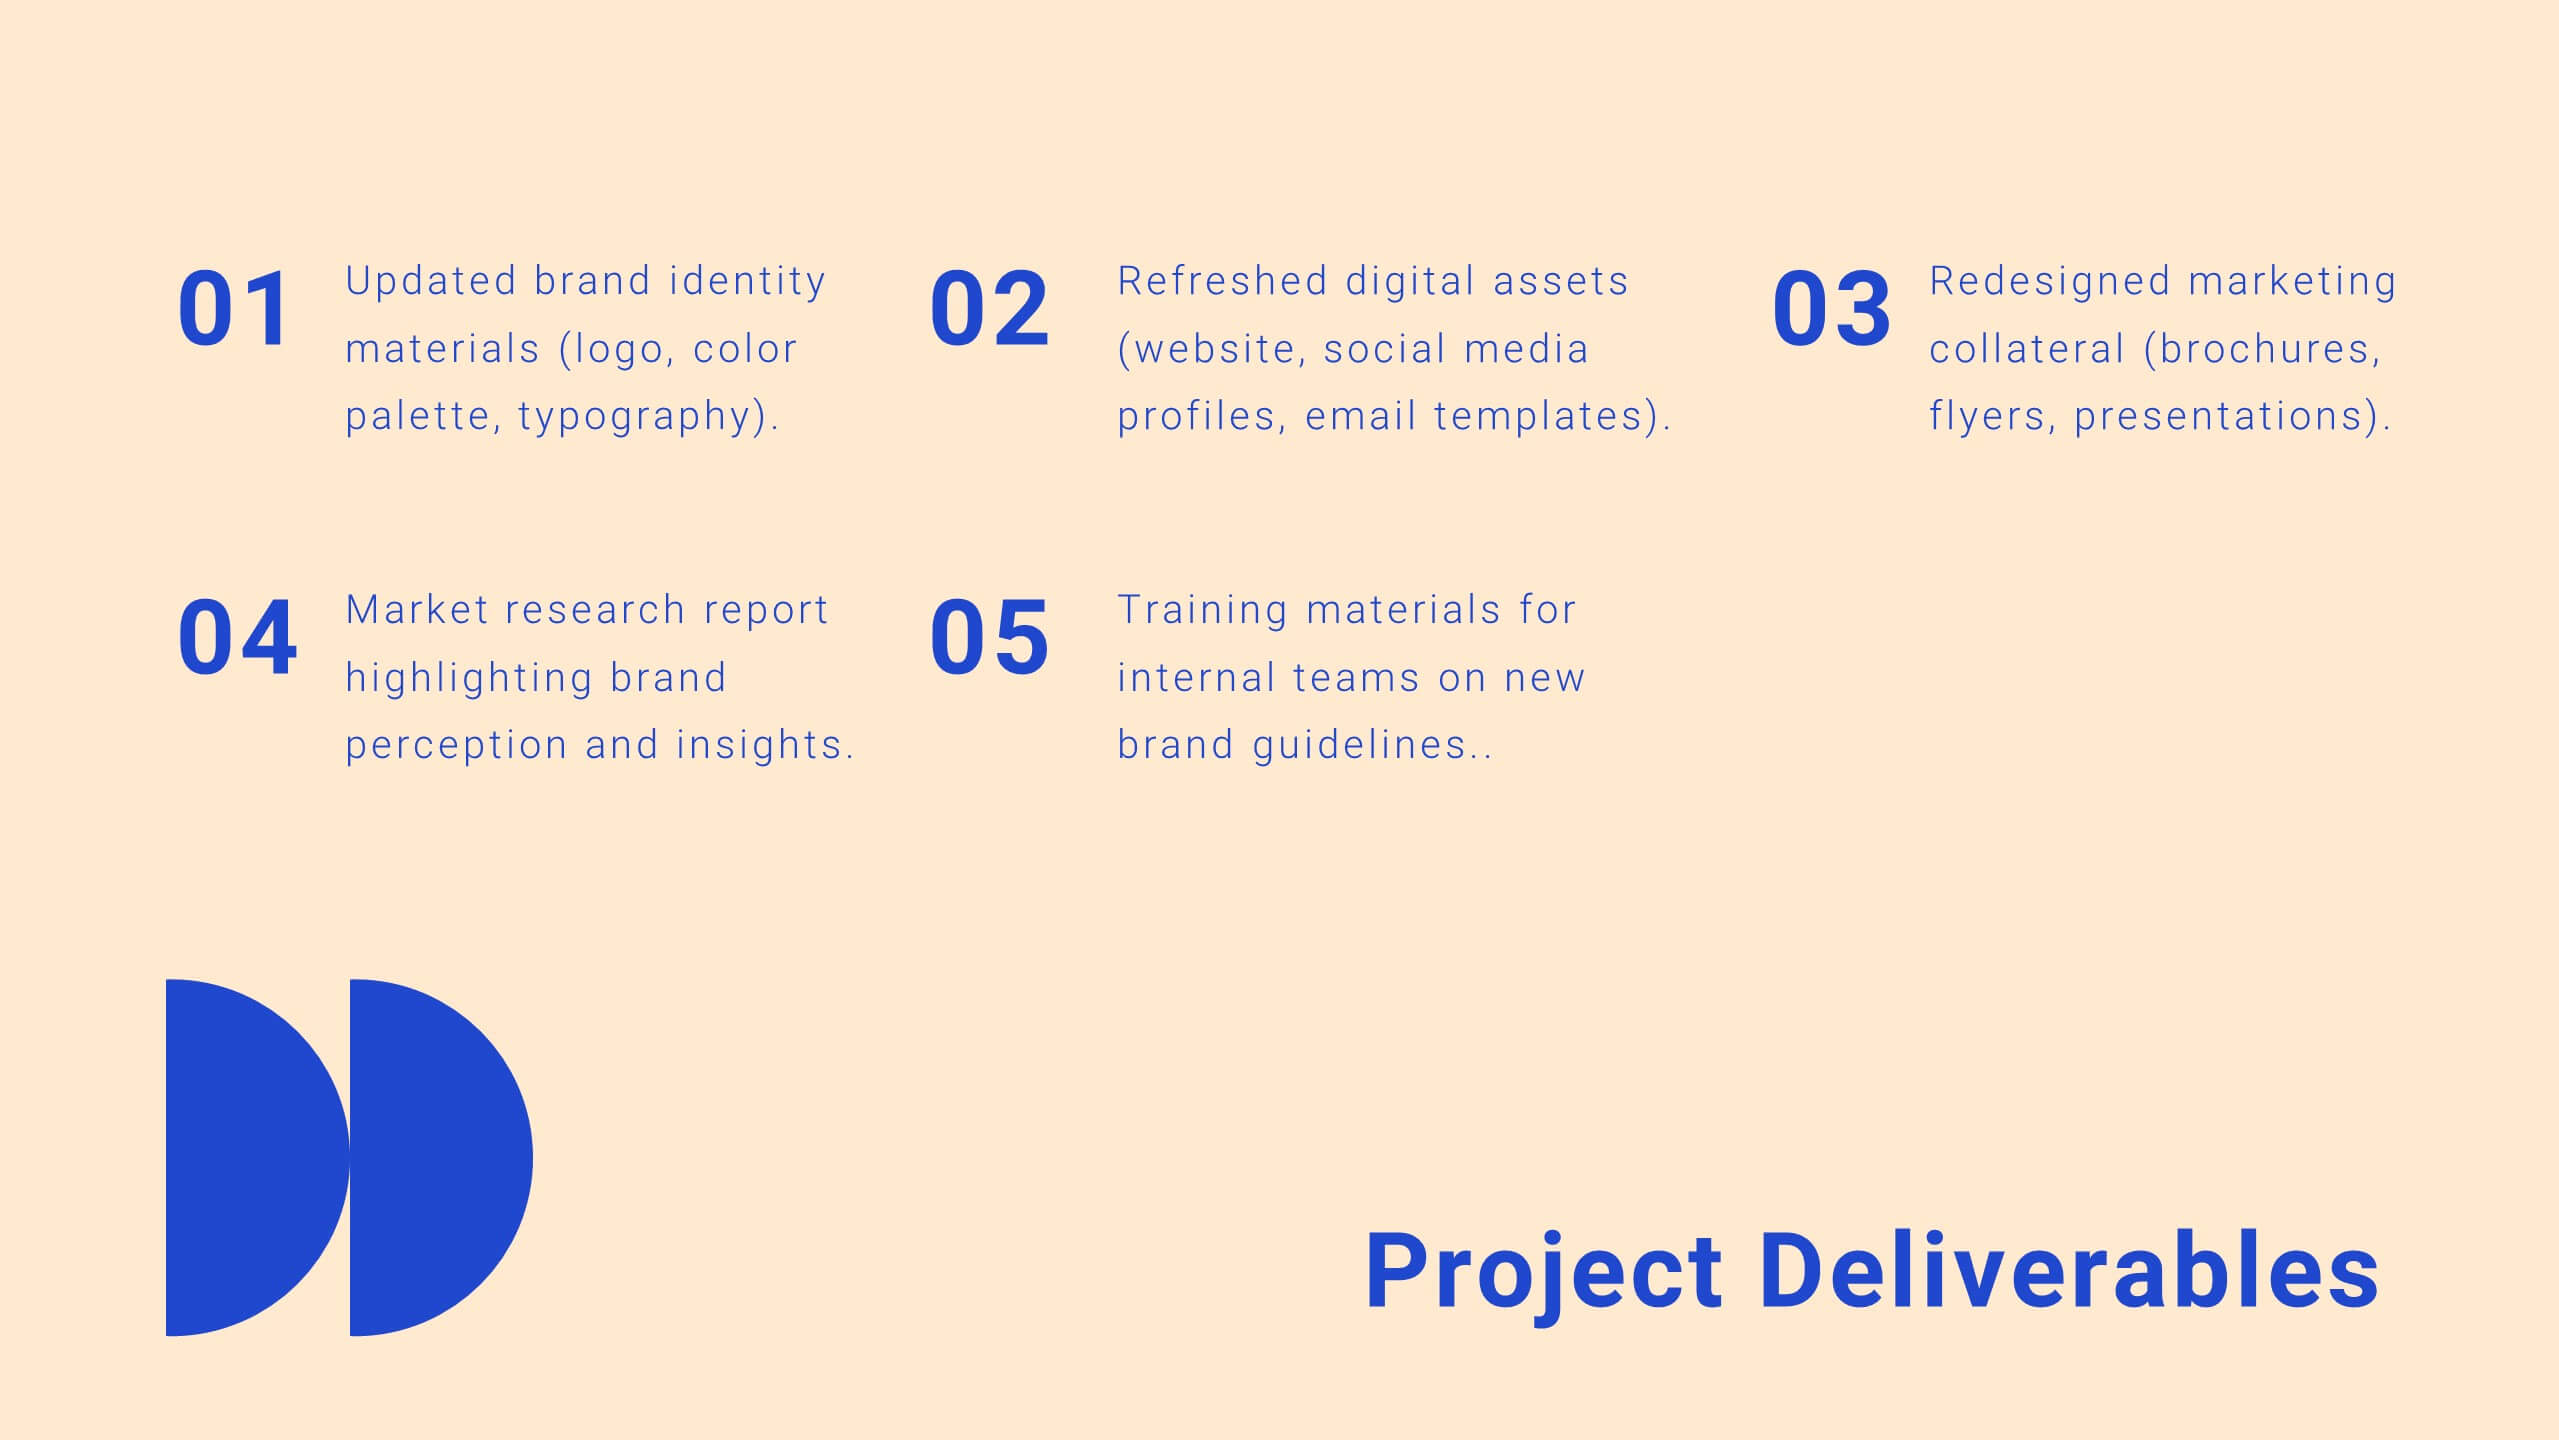
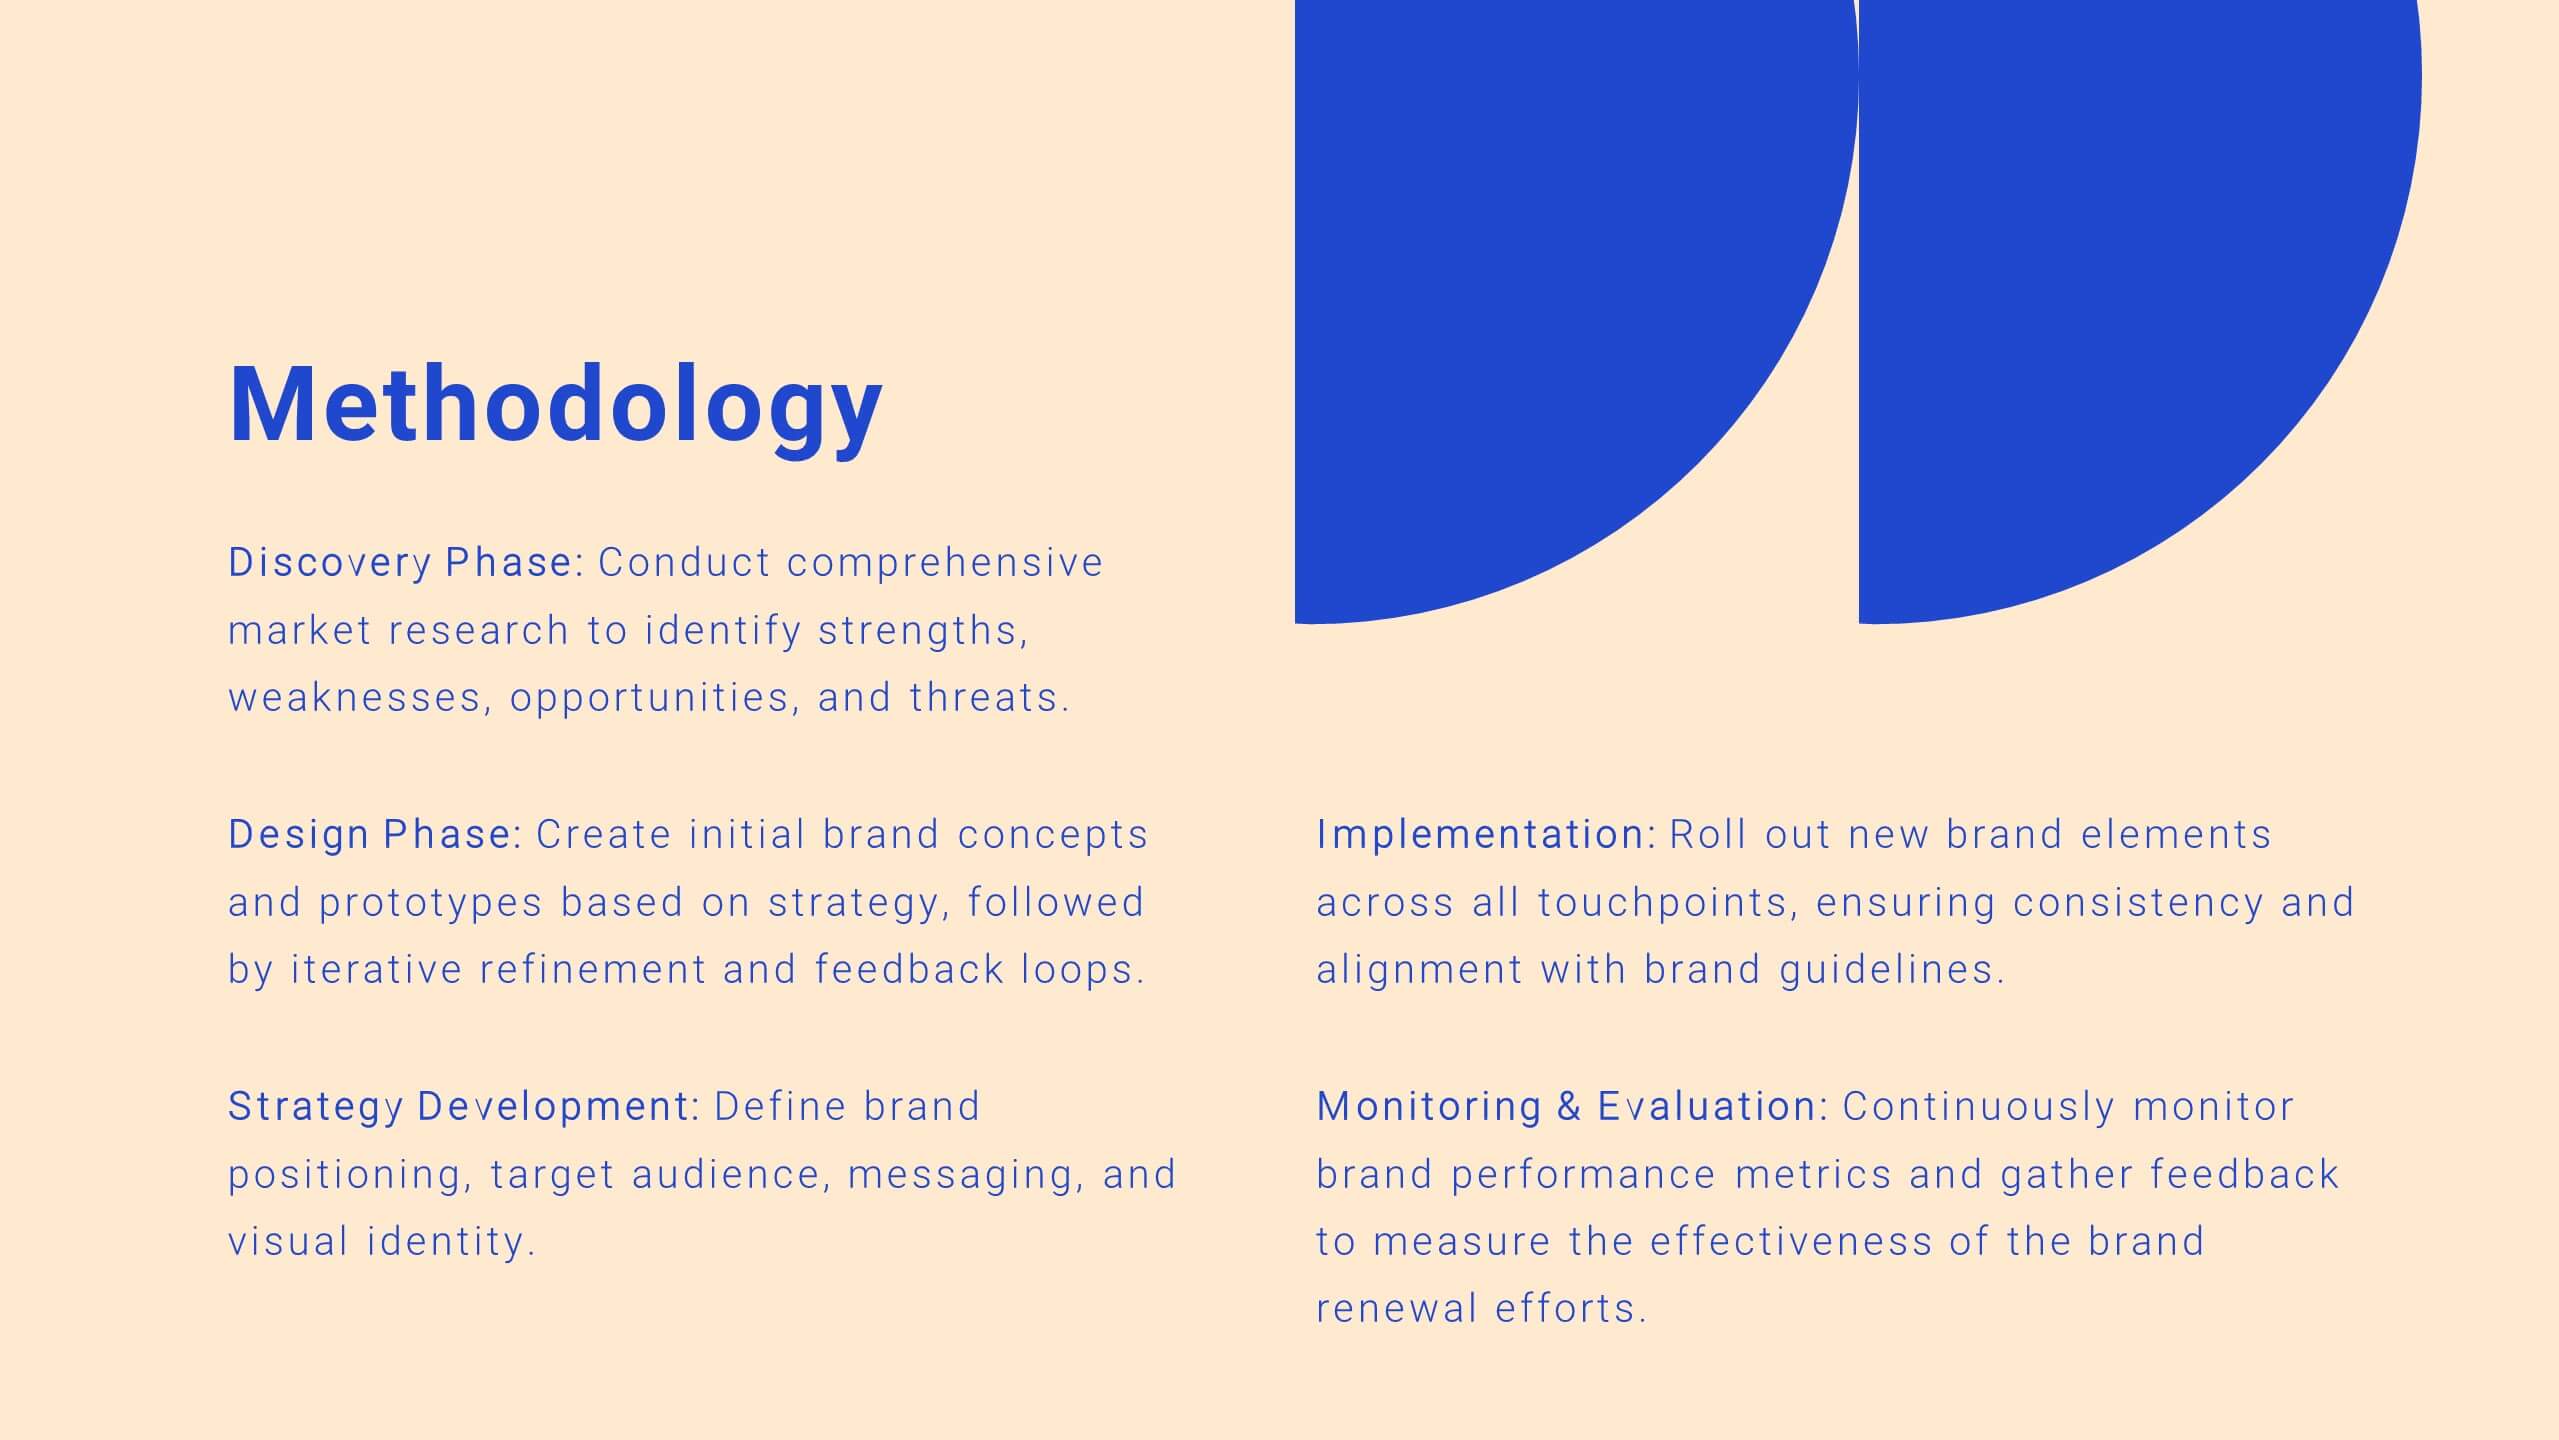
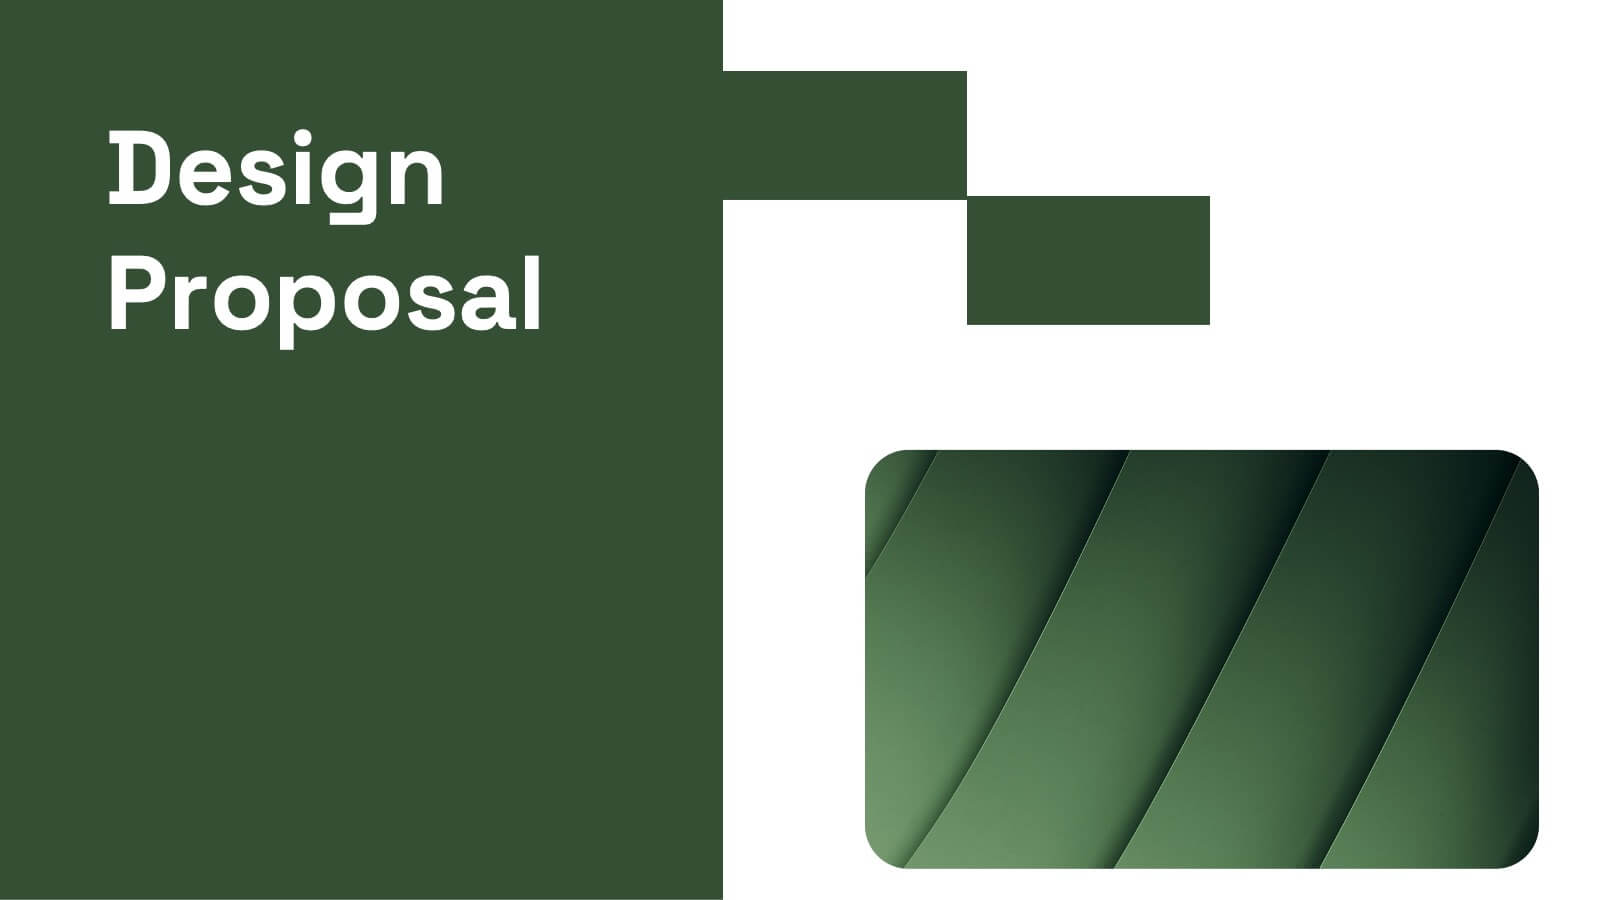
Tidal Design Proposal Presentation
Elevate your pitch with this sleek design proposal template! Perfect for presenting project details, objectives, methodology, and milestones, it ensures your ideas stand out. Impress stakeholders with clear, structured slides and professional aesthetics. Compatible with PowerPoint, Keynote, and Google Slides for a seamless presentation experience across all platforms.


4 diapositivas
Sequential Roadmap Planning Timeline Presentation
Guide your audience through each milestone with the Sequential Roadmap Planning Timeline Presentation. This sleek layout is perfect for showing linear progress over time—ideal for strategic plans, product rollouts, or project phases. Each step is clearly marked with editable years and titles, ensuring clarity and easy customization. Fully compatible with PowerPoint, Google Slides, and Canva.


7 diapositivas
Cryptocurrency Prices Infographic
Cryptocurrency prices refer to the current or historical values of various cryptocurrencies in terms of a specific fiat currency or other cryptocurrencies. This infographic template is a visual journey into the ever-fluctuating world of digital currencies. This template serves as your gateway to understanding the trends and values of cryptocurrencies, empowering you to make informed decisions in this exciting financial realm. Compatible with Powerpoint, Keynote, and Google Slides. Use this infographic to easily present major cryptocurrencies as celestial bodies, emphasizing the vastness and potential of the crypto universe.