


Características


¿Tienes alguna pregunta?
Recomendar


7 diapositivas
Customer Relationship Management
Strengthen client loyalty and drive growth with this organized CRM infographic. Perfect for presenting customer touchpoints, service strategies, and loyalty-building initiatives. Fully customizable in PowerPoint, Keynote, and Google Slides, this design ensures your CRM workflows are communicated with clarity and visual impact.


6 diapositivas
Data Visualization Pie Chart Presentation
Present data with clarity using the Data Visualization Pie Chart Presentation template. This professional and fully customizable slide deck is designed for business analysts, marketers, and data scientists to showcase key insights in an engaging and visually impactful way. Featuring a modern pie chart layout, it simplifies complex information for clear communication. Compatible with PowerPoint, Keynote, and Google Slides.


2 diapositivas
App Interface Device Preview Presentation
Display your mobile app design with this sleek interface preview layout. Centered around a realistic smartphone mockup, this template includes four surrounding sections for text or key features. Ideal for pitch decks or product demos, it's fully editable in PowerPoint, Keynote, or Google Slides to match your brand.
4 diapositivas
Objectives and Results Strategy Tracking Presentation
Track progress with clarity using the Objectives and Results Strategy Tracking Presentation. This sleek, minimalist layout helps visualize how each objective connects to measurable outcomes along a strategic path. Ideal for OKR reviews, quarterly goal updates, and performance check-ins. Fully customizable in PowerPoint, Canva, Keynote, and Google Slides.


7 diapositivas
Job Title Infographic
The slides displayed offer a range of stylish and clear title designs for various business and creative presentations, ideal for introducing key concepts and sections within a professional document or presentation. Each slide is crafted to represent themes such as annual reports, digital strategies, and project retrospectives, as well as specialized areas like web design, strategic planning, and SEO. The designs incorporate modern aesthetics with clean lines, bold color palettes, and minimalist graphic elements, ensuring that the titles are not only eye-catching but also effectively convey the subject matter. This variety allows presenters to choose a slide that best fits the tone and topic of their presentation, making each section distinct and engaging for the audience. These slides are perfect for professionals looking to present complex information in an accessible and visually appealing format.


5 diapositivas
Medical Supplies Infographics
Medical supplies refer to the various equipment, instruments, tools, and consumables that are used in healthcare settings to diagnose, treat, and manage medical conditions. These vertical infographics provide an overview of essential medical supplies used in healthcare settings. They aims to educate and raise awareness about the importance of medical supplies in delivering quality patient care and maintaining a safe healthcare environment. The infographics utilize visually appealing graphics, icons, and color schemes that are relevant to the medical field. These visuals help viewers easily recognize and understand the different types of supplies.


26 diapositivas
Market Growth Tactics Presentation
Chart a path to success with our Market Growth Tactics presentation template, designed for seamless use in PowerPoint, Keynote, and Google Slides. This template is a vital asset for business strategists, marketing professionals, and consultants who aim to drive growth and capture market share. Our Market Growth Tactics template lays out a strategic framework for identifying and leveraging growth opportunities. It provides a comprehensive array of slides to showcase market analysis, competitive landscape, growth strategies, and execution plans. With customizable elements, you can tailor your presentation to reflect specific market insights and growth targets relevant to your audience. The template is crafted to facilitate clear communication of complex growth strategies, breaking them down into actionable steps with the aid of charts, graphs, and infographics. This helps to convey your message effectively, ensuring that your audience can visualize the growth journey and understand the tactics involved. Elevate your market growth presentations and become an authoritative voice in your industry with our SEO-optimized template, designed to engage, inform, and inspire action towards market expansion.


7 diapositivas
Industrial Safety Infographic
Industrial safety, also known as occupational safety, pertains to the management of processes and conditions within industrial settings to ensure the safety, health, and well-being of workers and the general public. This impactful infographic template encapsulates the essentials for fostering a secure and hazard-free industrial environment. Compatible with Powerpoint, Keynote, and Google Slides. The customizable set of icons represents emergency response actions, underlining the need for rapid and efficient responses in critical situations. Build a foundation of safety that fosters a secure and thriving work environment.


7 diapositivas
PESTEL Chart Infographic Presentation
A PESTEL Chart is a strategic planning tool used to analyze and identify the key external factors that could affect an organization's performance and its ability to achieve its objectives. Create epic pestel charts in no time using this template. All you need to do is enter your data and the template will do the rest. Use this template as an introduction to your most important points. It is completely editable change the fonts, sizes and shapes and it can be used for any type of business or academic project. This template is available in PowerPoint, Keynote and Google Slides formats.


5 diapositivas
Breast Cancer Prevention Infographics
Breast Cancer is a serious disease that affects millions of people worldwide. These infographics are visual representations of information that provide tips and strategies to help prevent breast cancer. These infographics include statistics about breast cancer, risk factors, and preventative measures that can be taken to reduce the risk of developing the disease. You can also use these to provide information on screening and early detection, such as mammograms and self-exams. The visuals in these infographics may include icons, images, graphs, and charts to make the information easy to understand.


6 diapositivas
Medical School Infographics
The "Medical School" infographic template is a meticulously curated and visually sophisticated tool, expertly tailored for PowerPoint, Keynote, and Google Slides. This template is an indispensable asset for medical educators, students, and healthcare professionals, aiming to illustrate the rigorous and multi-faceted journey of medical education. This template masterfully outlines key components of medical school, including curriculum structure, clinical rotations, research opportunities, and key milestones like exams and residencies. Its organized and detailed layout is perfect for guiding prospective students, orienting new enrollees, or showcasing medical programs during educational fairs and open houses. The design is as professional as it is educational, with a color scheme that is both serene and scholarly. This not only ensures your presentation is visually appealing but also aligns with the serious and life-changing nature of medical education. Whether it's used for orientation, academic presentations, or informational seminars, this template ensures that the journey through "Medical School" is presented in a manner that's both comprehensive and visually compelling.


6 diapositivas
Business Ethics and Governance Presentation
Navigate the complexities of ethical decision-making with our Business Ethics and Governance Presentation template. This visually engaging tool highlights key aspects of corporate ethics and governance, ideal for workshops and training sessions. Compatible with PowerPoint, Keynote, and Google Slides, it's designed to facilitate clear and effective discussions.


23 diapositivas
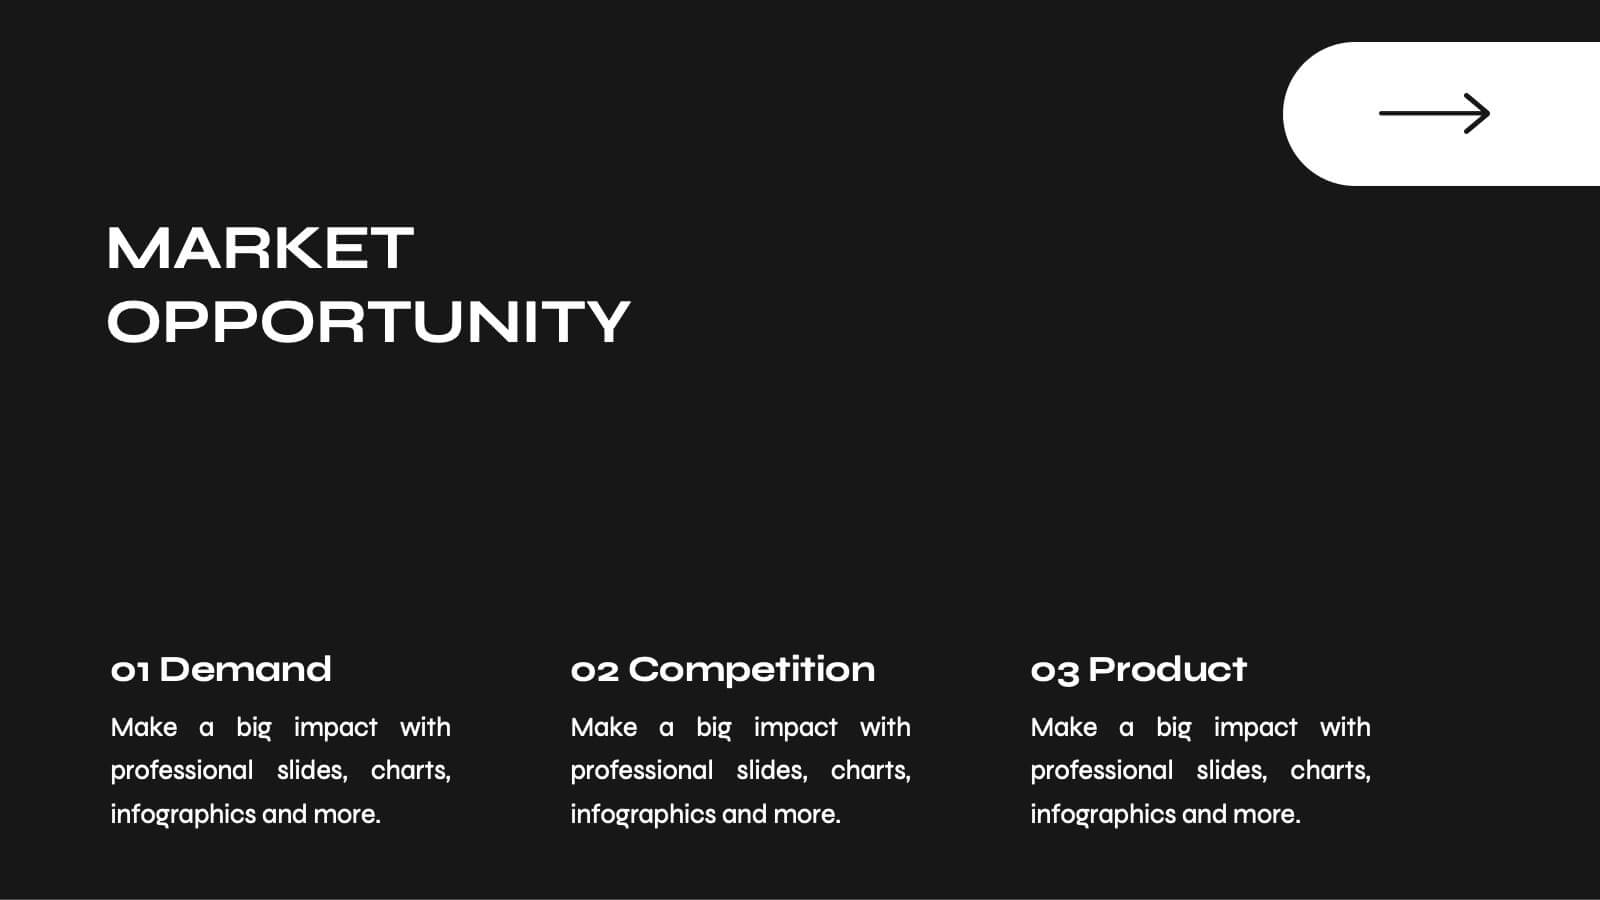
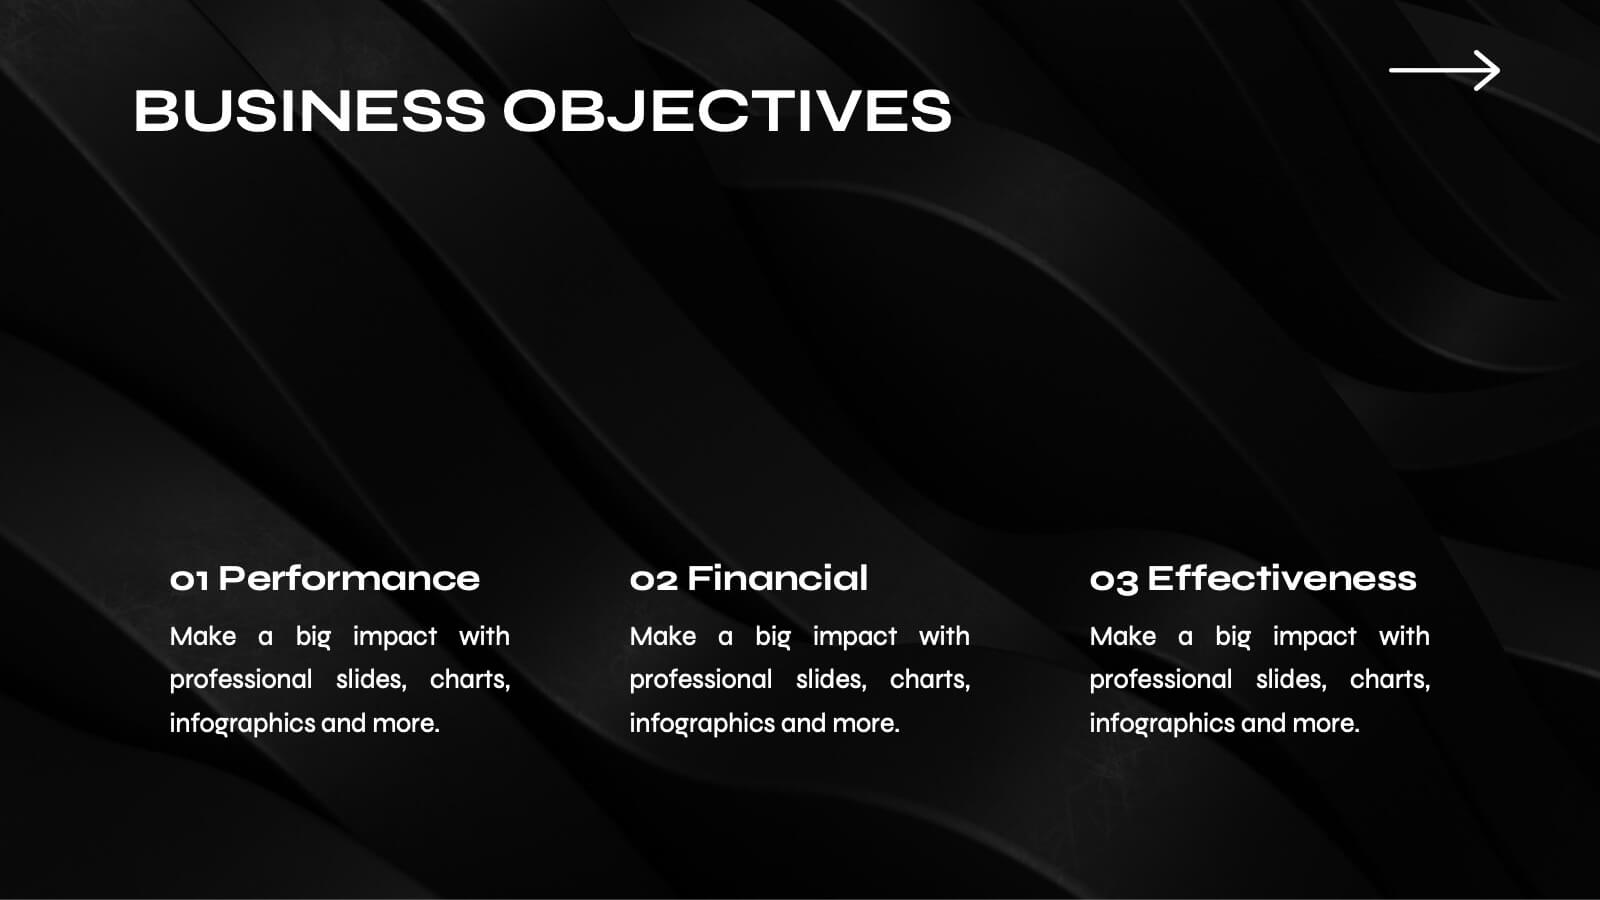
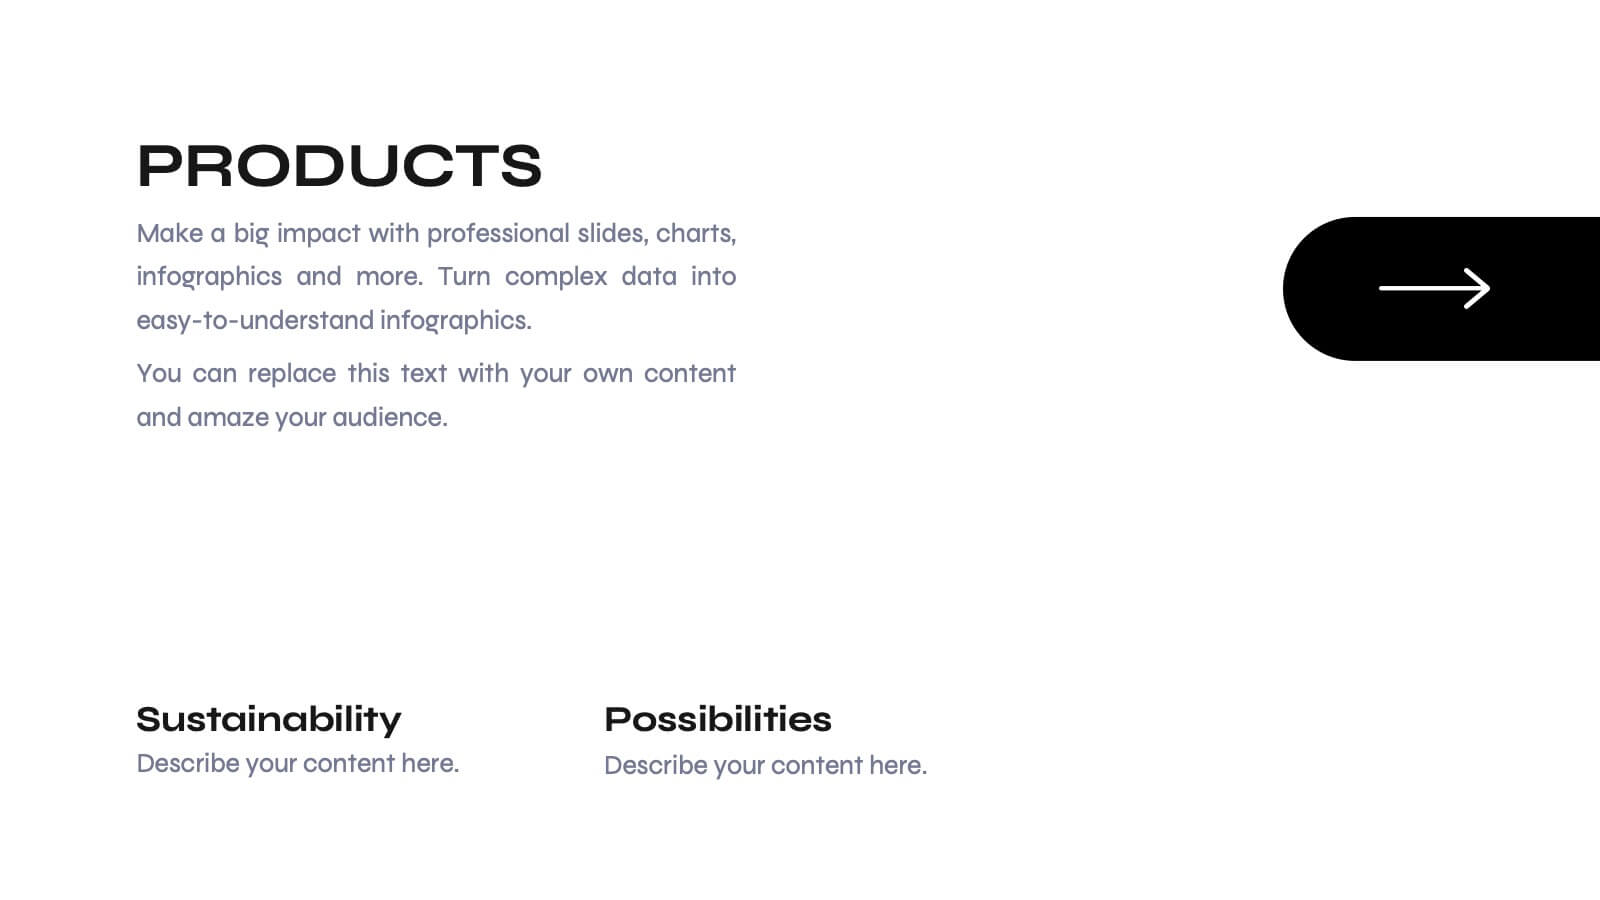
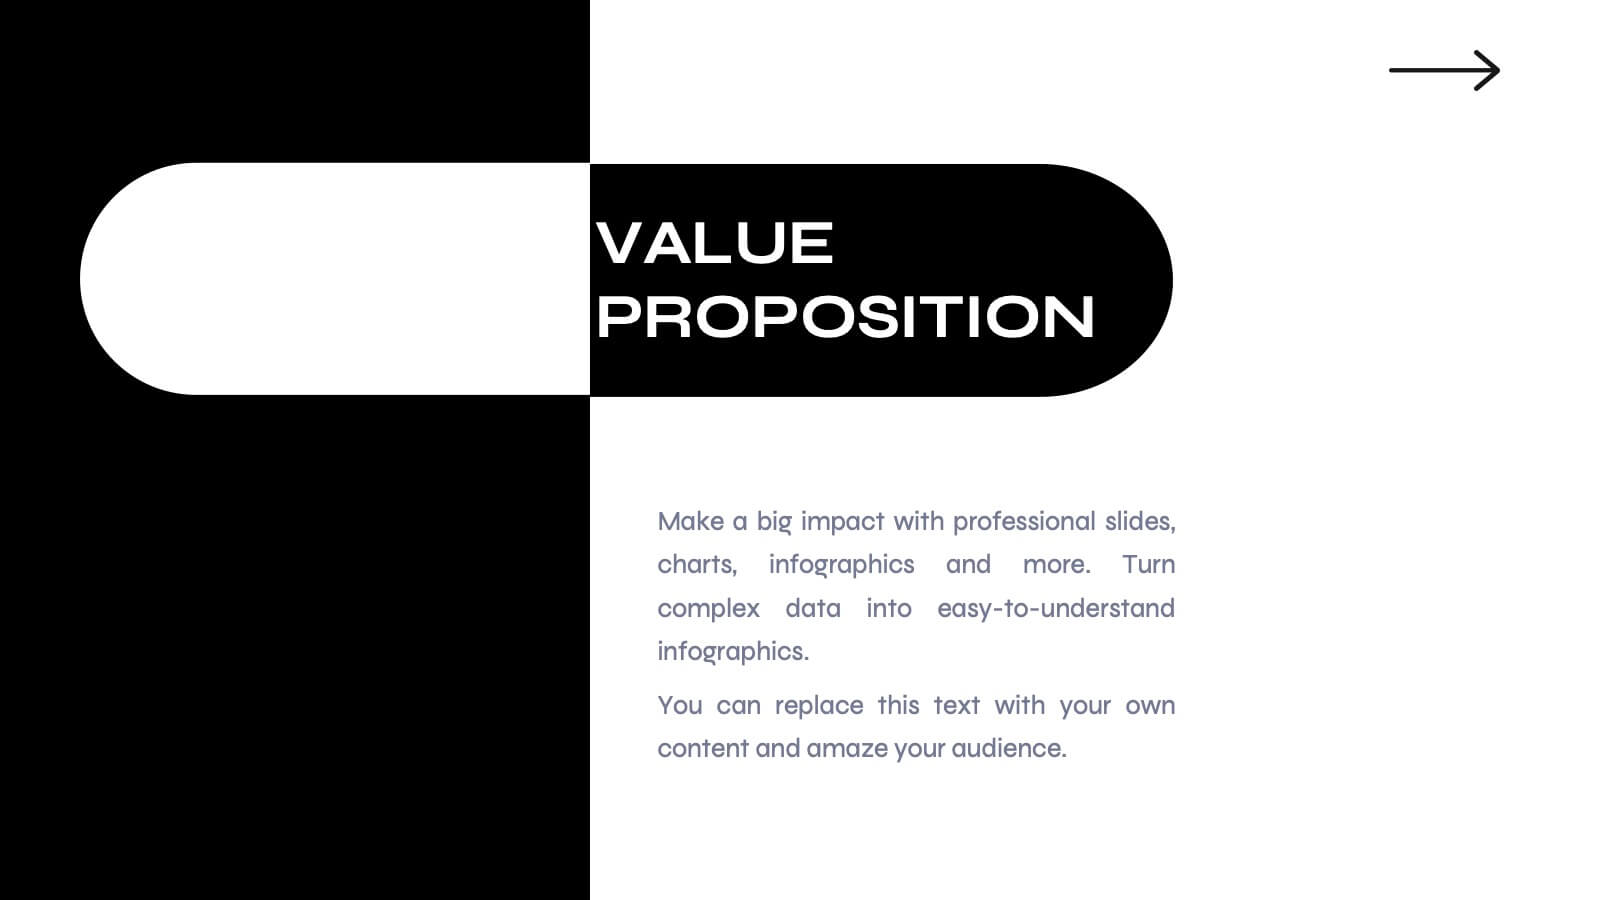
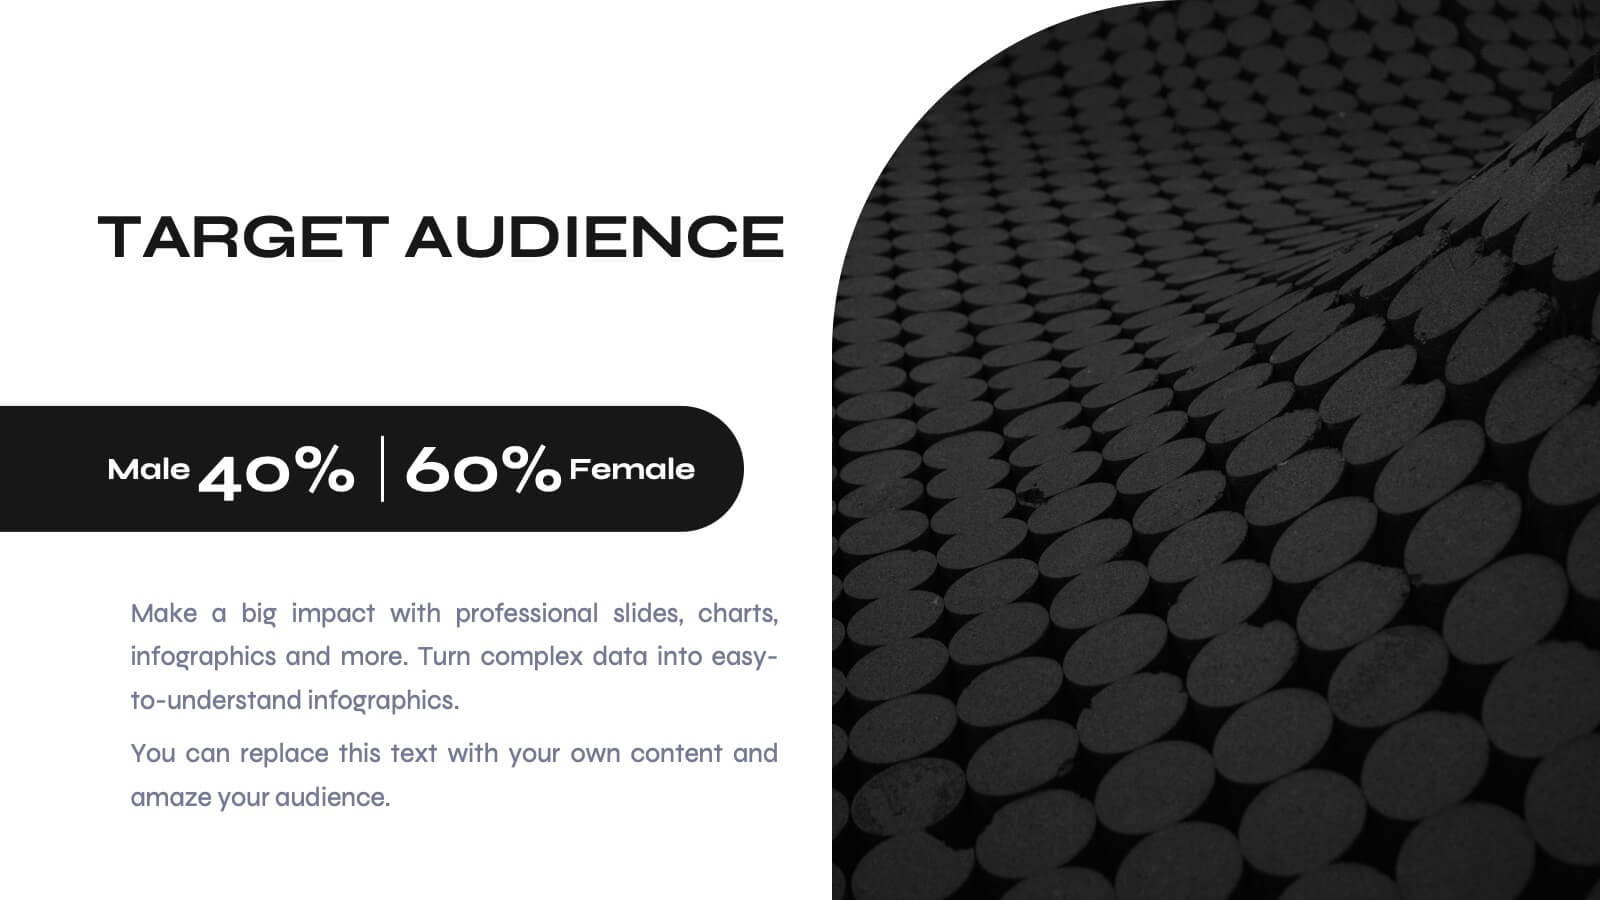
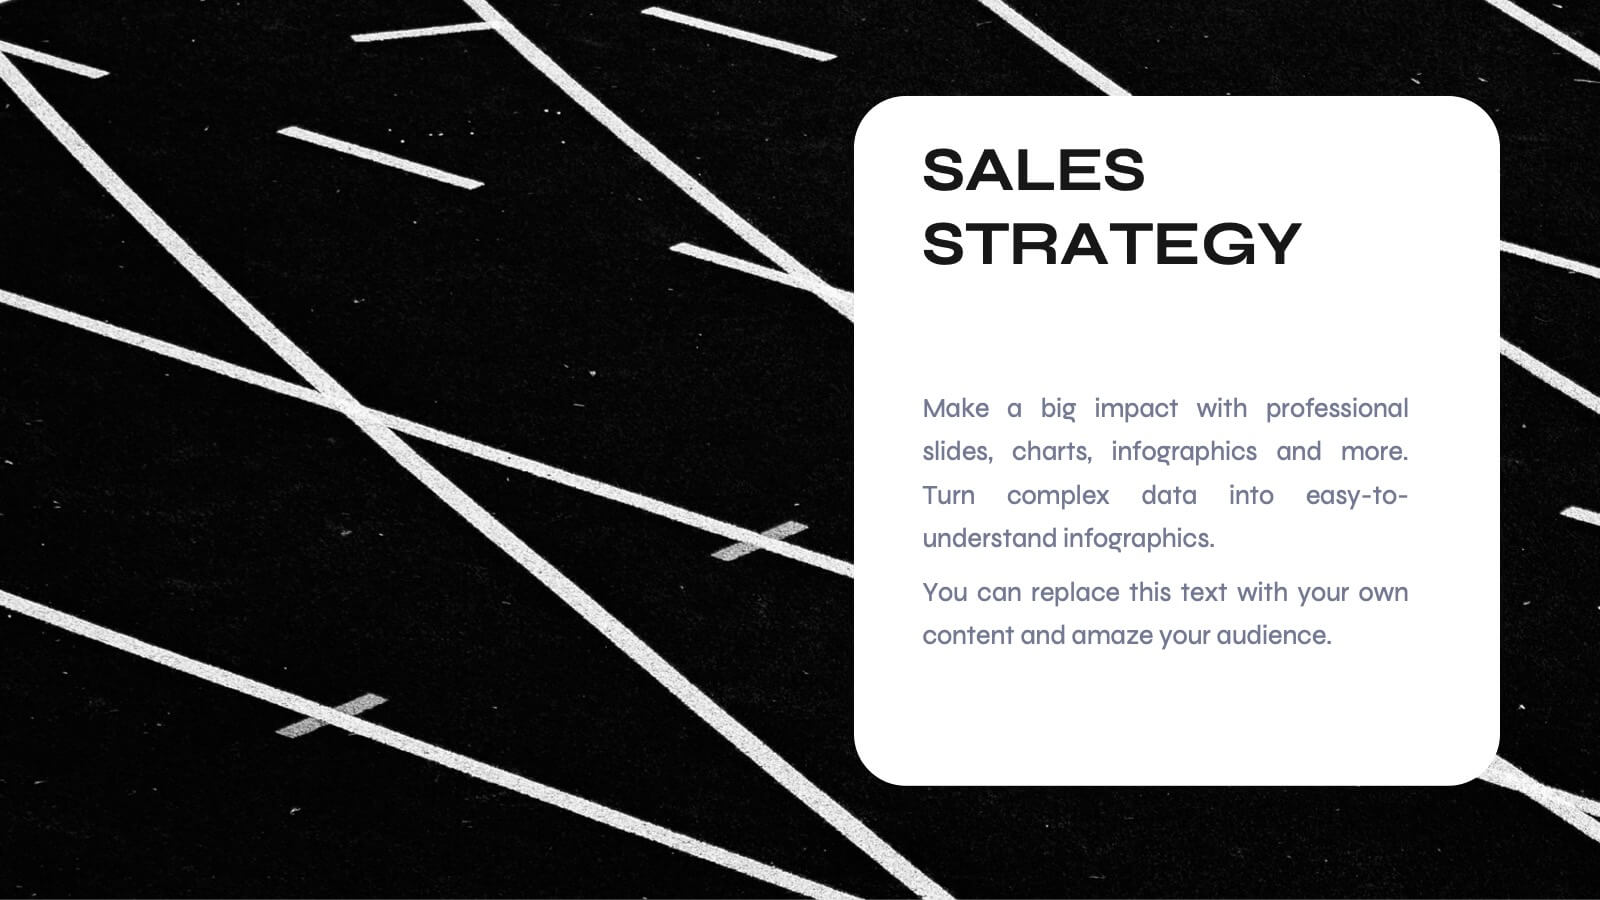
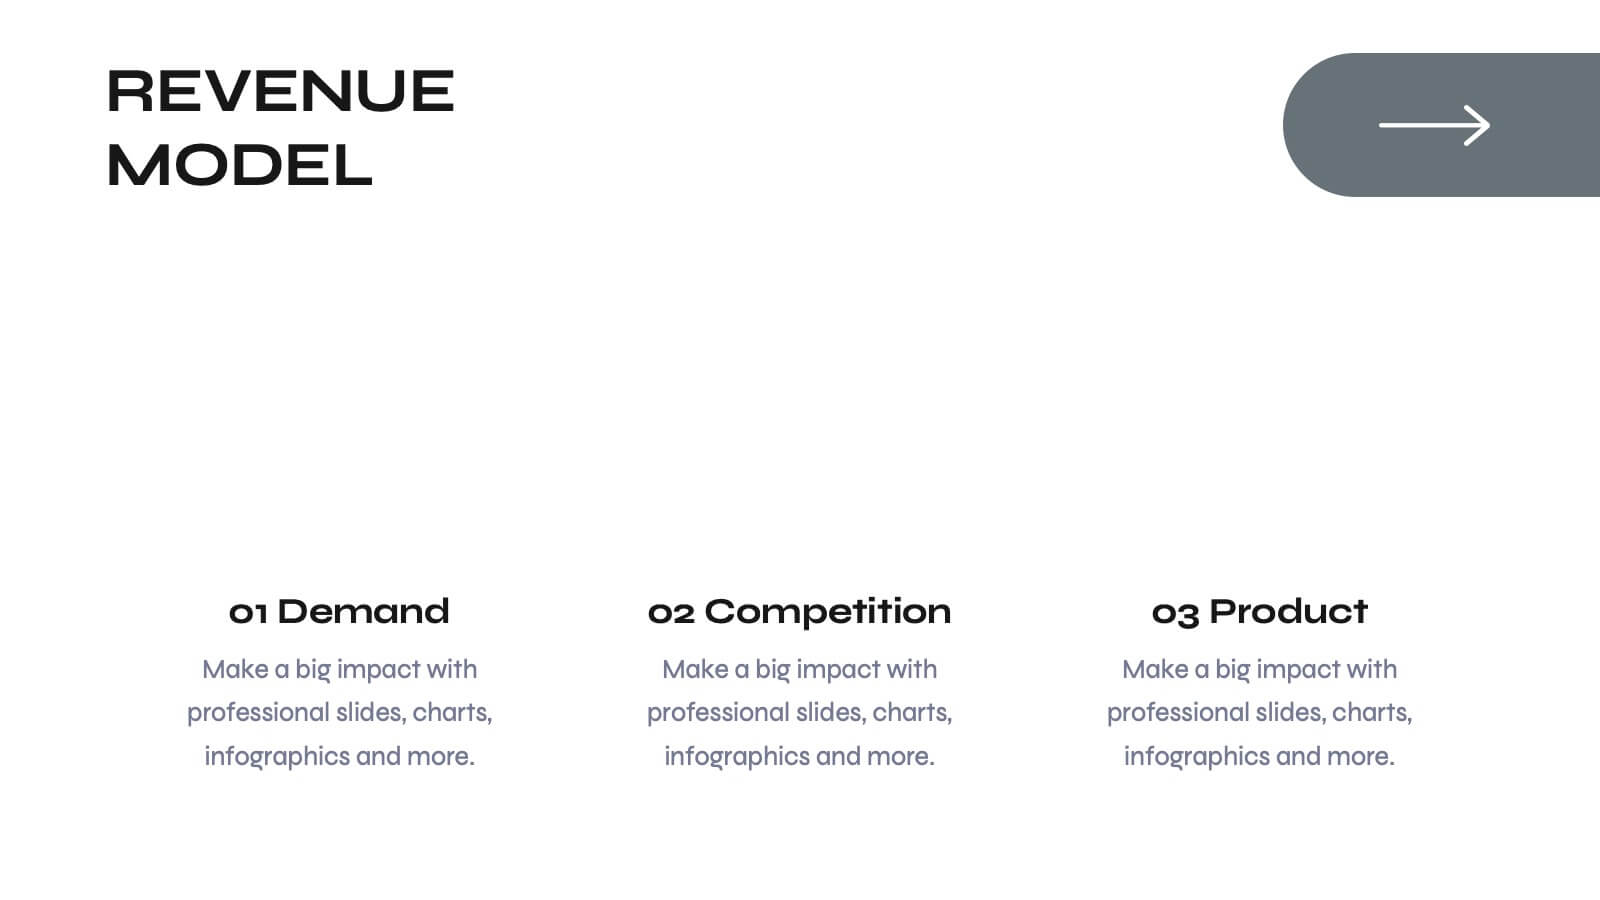
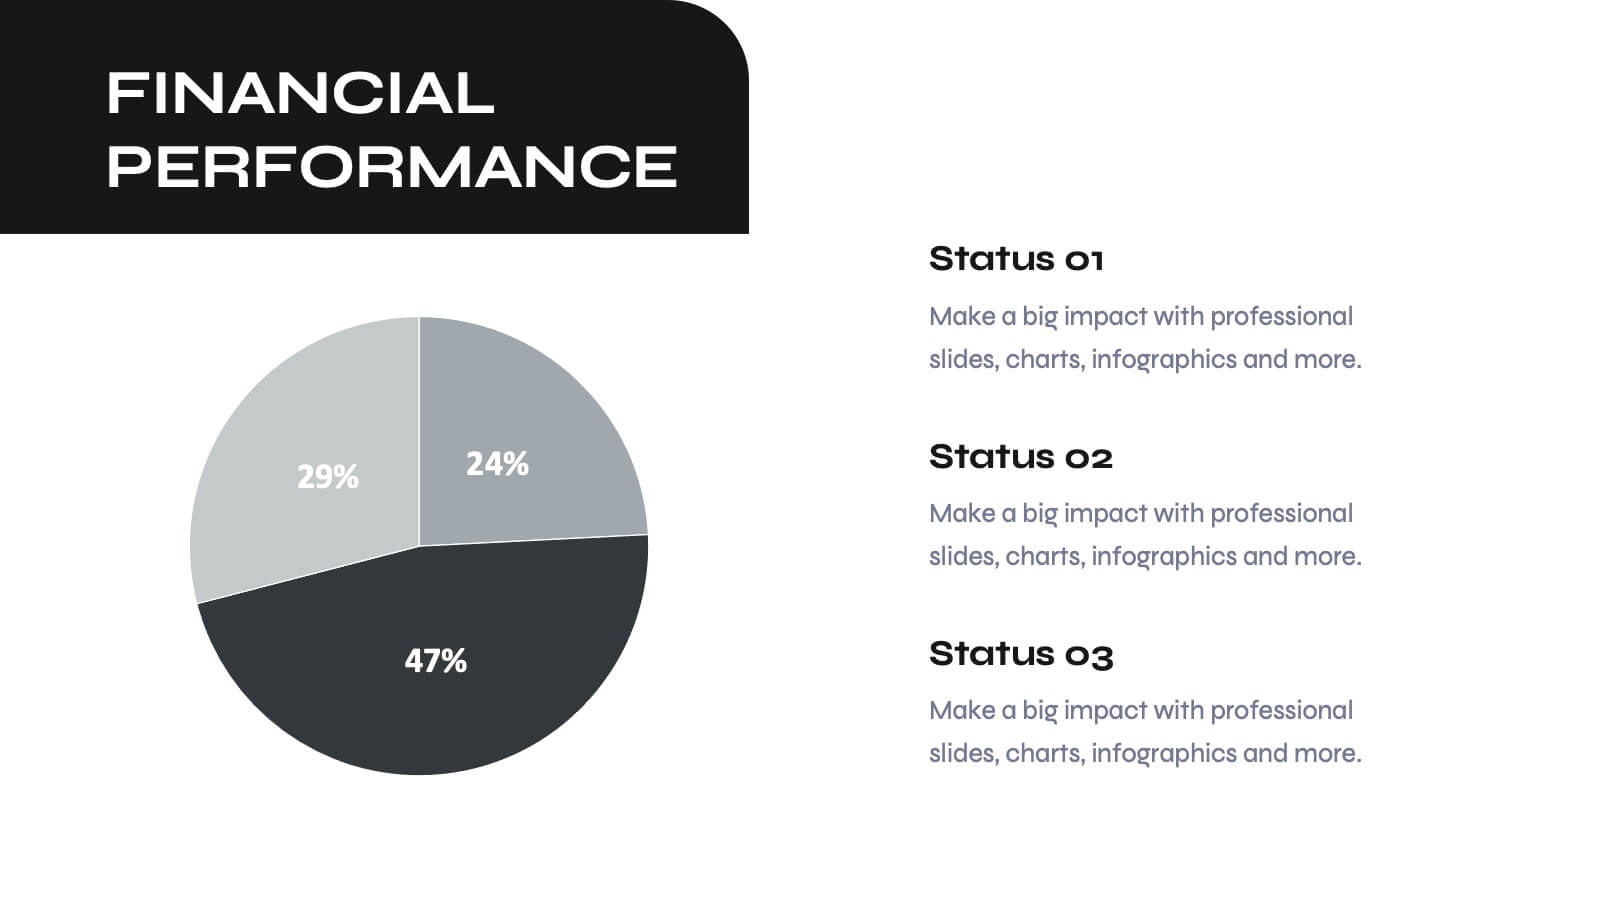
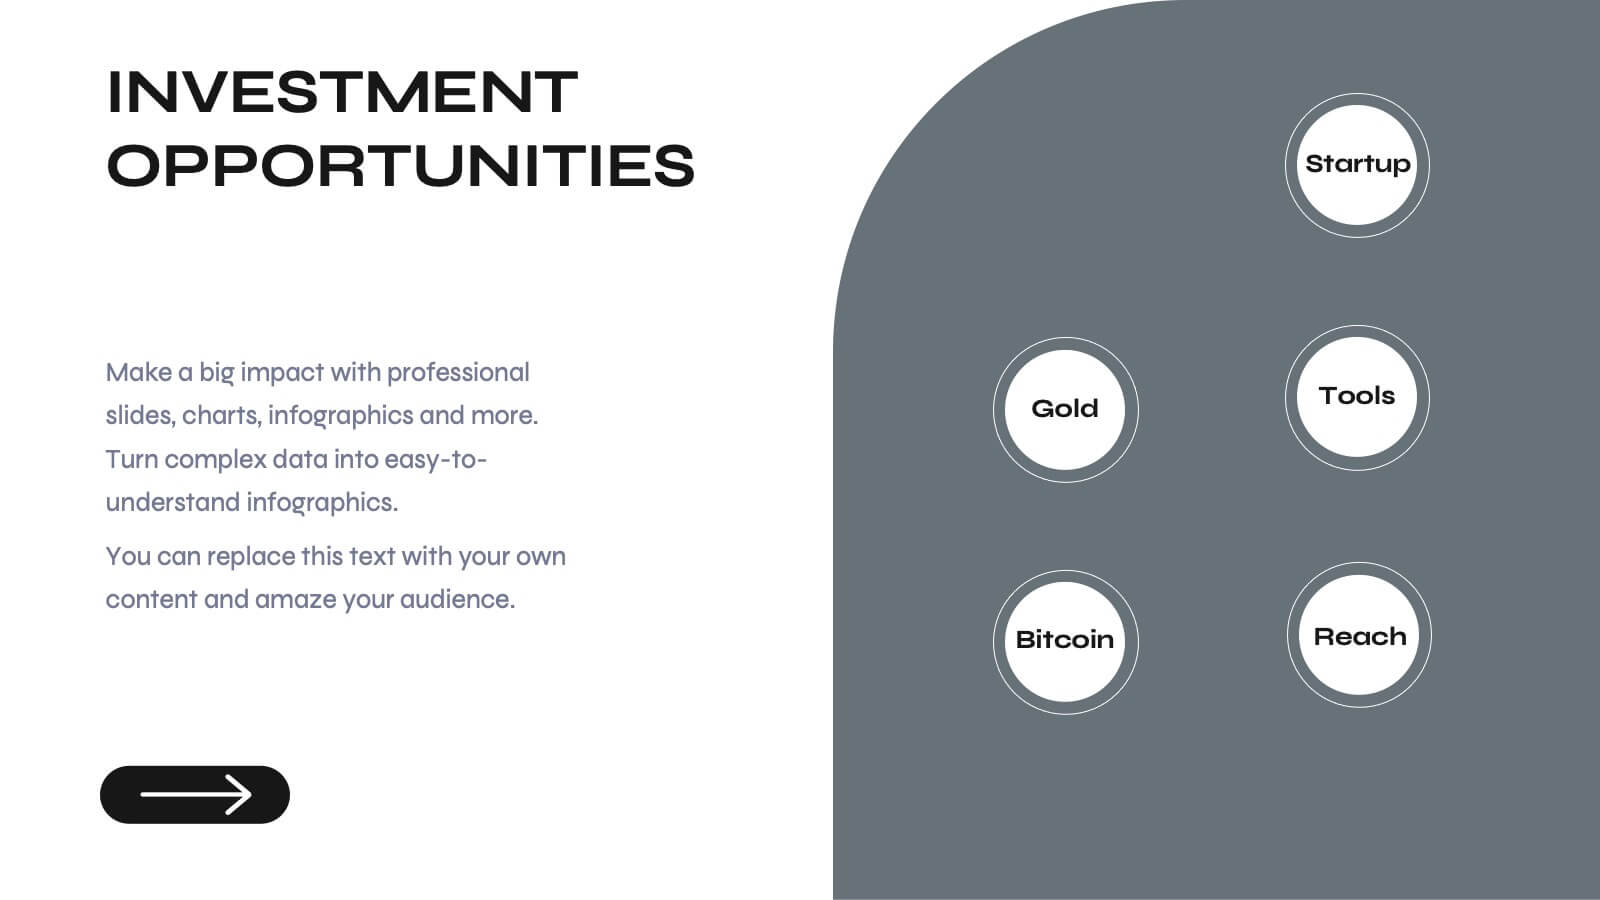
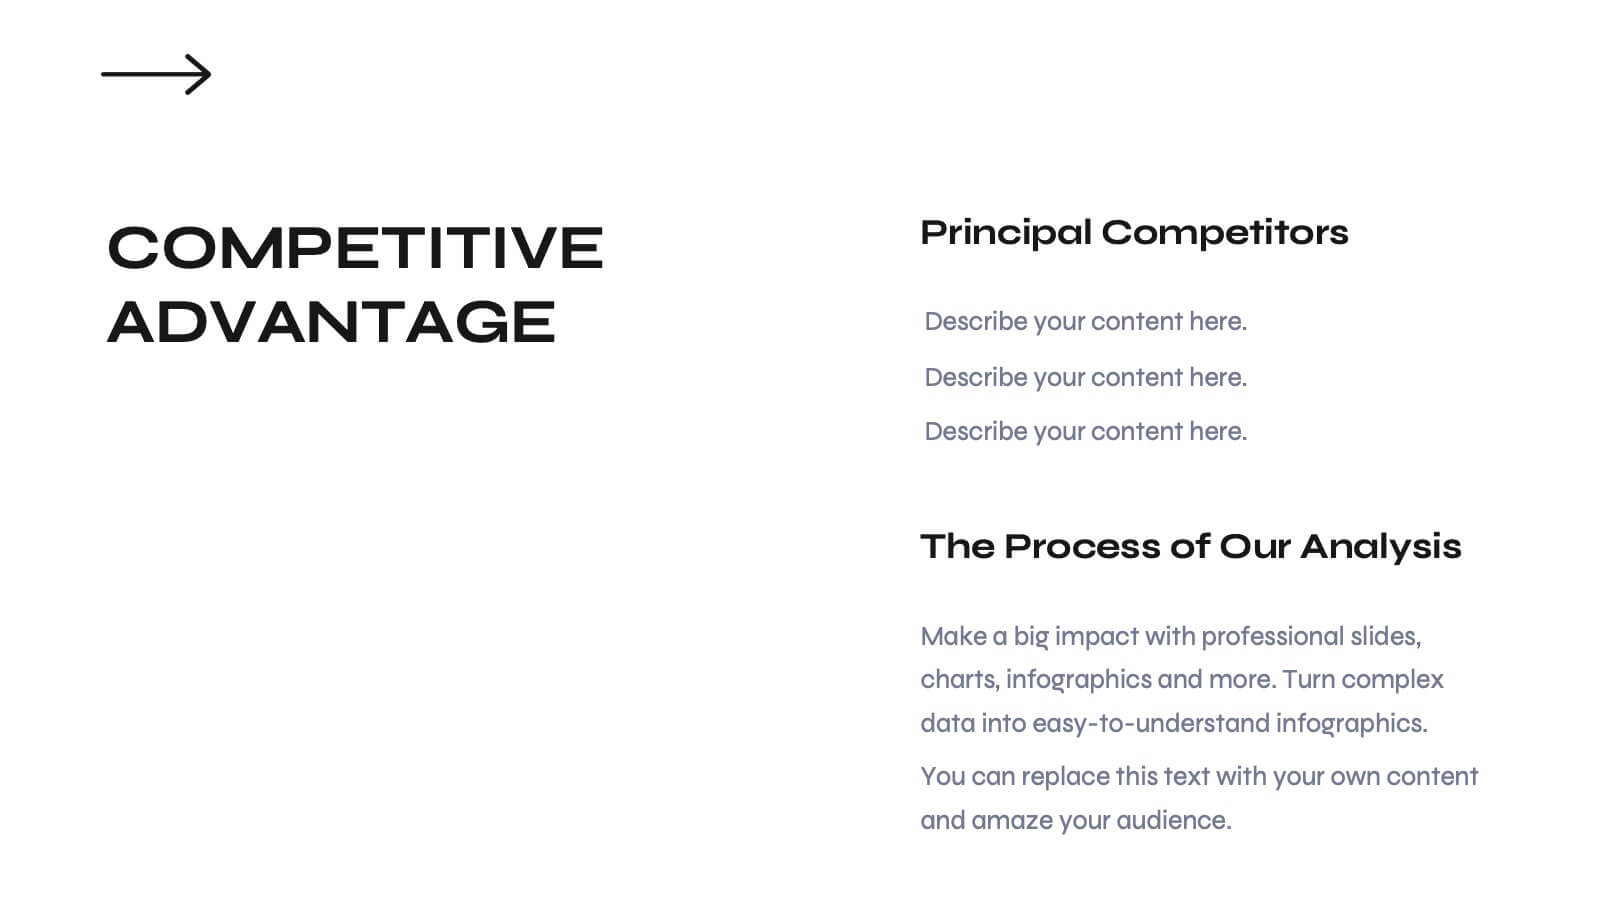
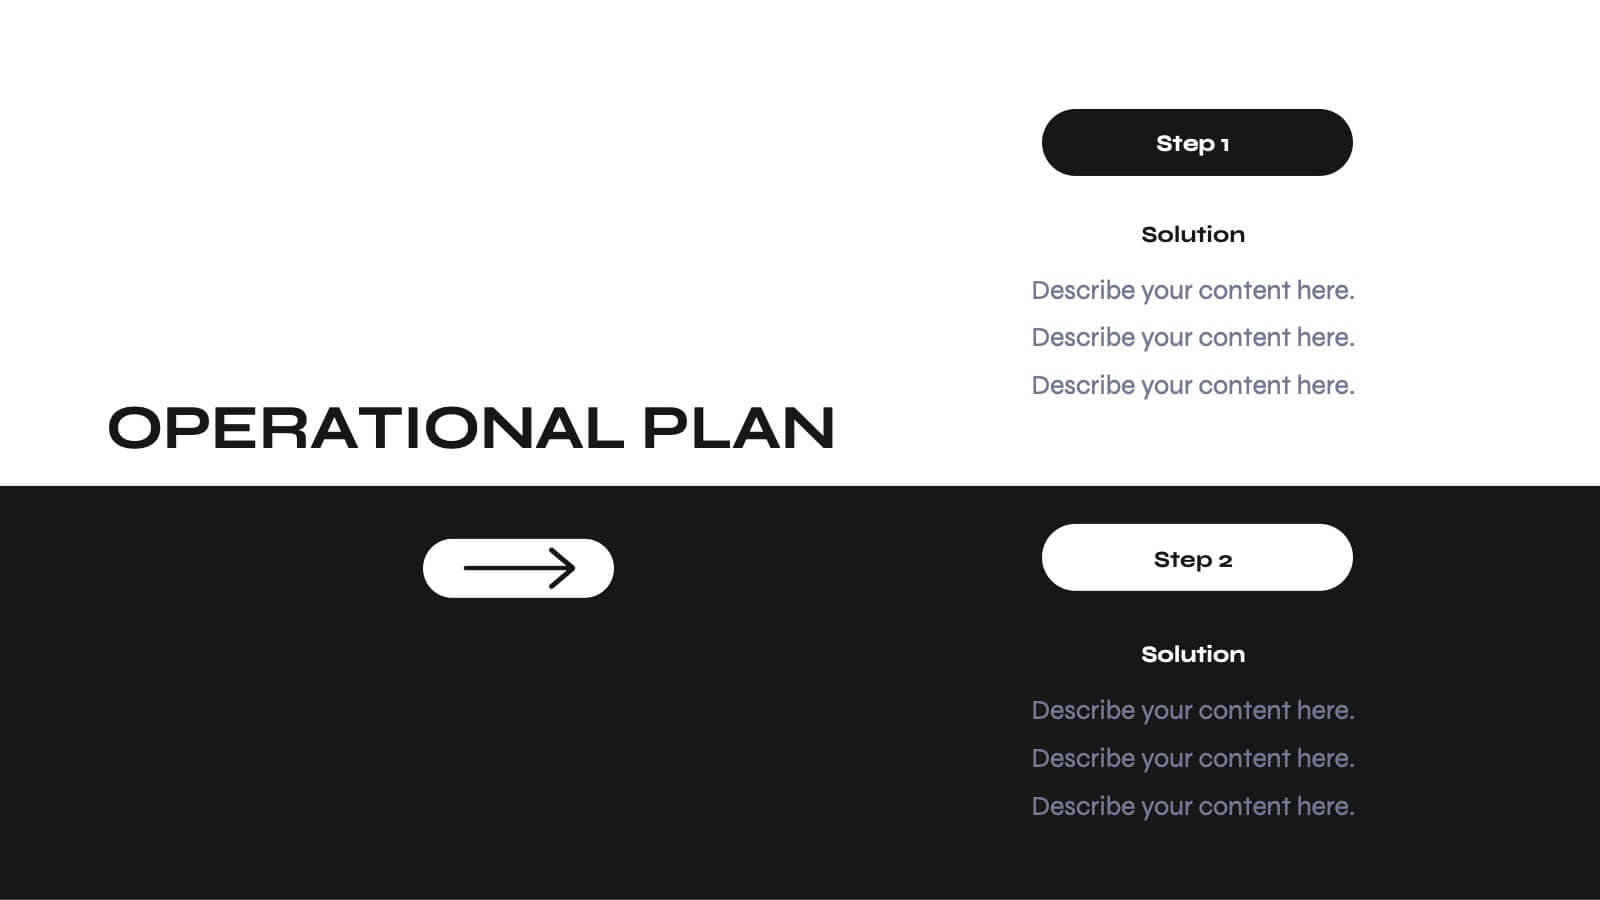
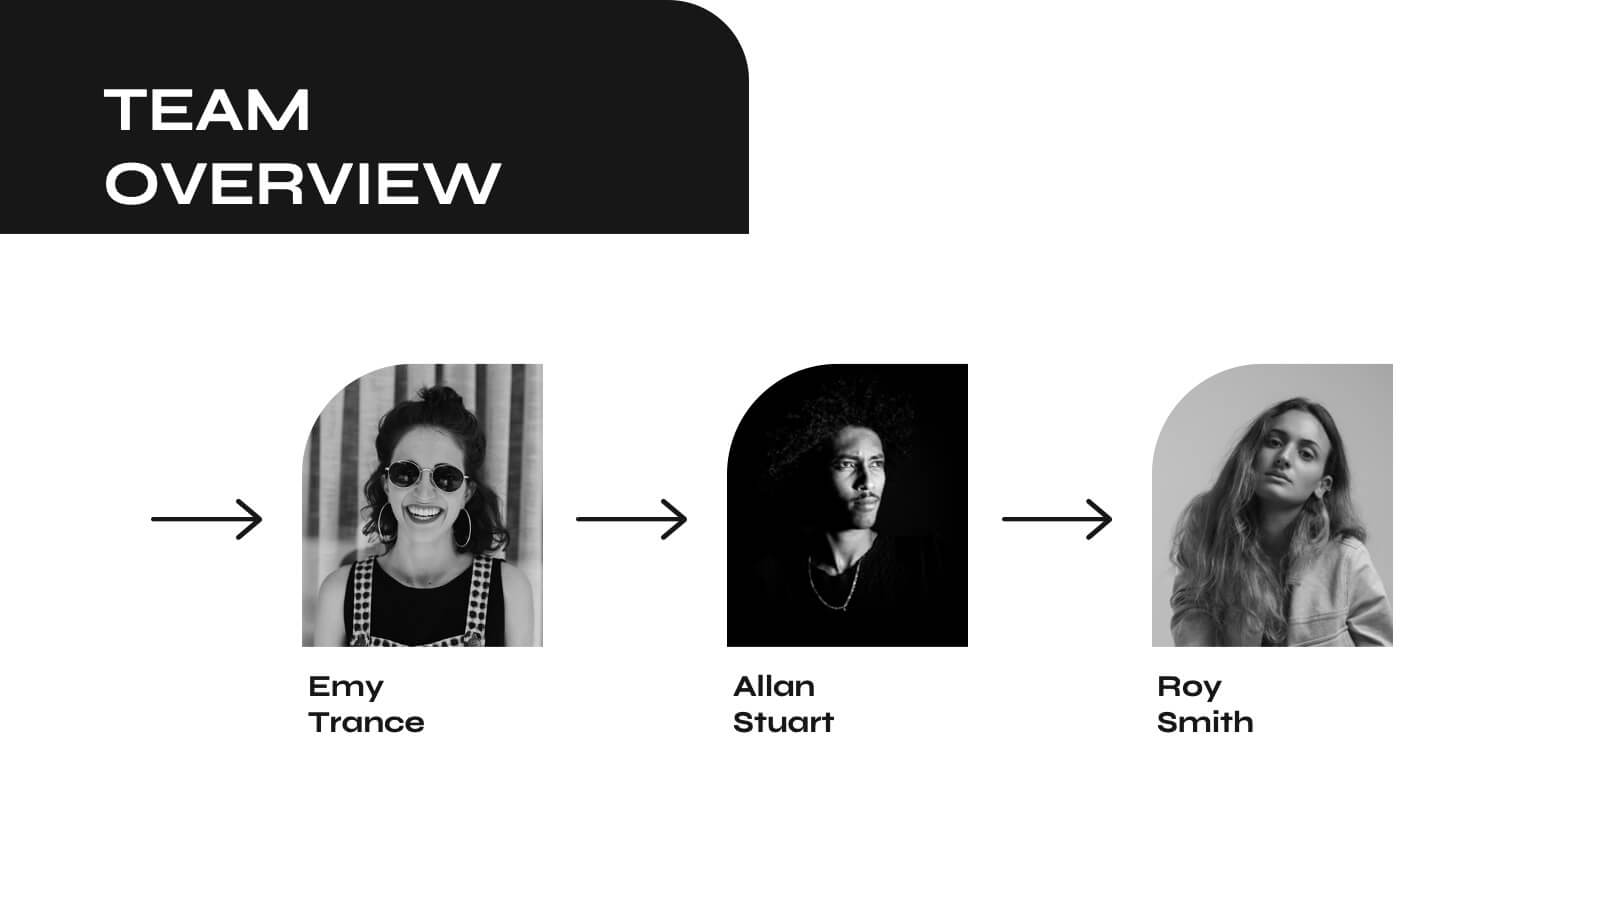
Odyssey Small Business Pitch Deck Presentation
Elevate your business pitch with this sleek, monochrome presentation template. Perfect for presenting company backgrounds, market opportunities, and financial performance, it features a minimalist design that enhances clarity and impact. Highlight your value proposition and strategic plans to captivate investors. Compatible with PowerPoint, Keynote, and Google Slides, it ensures seamless presentations on any platform.


6 diapositivas
Circle Schedule Infographic
A circle schedule, also known as a radial schedule, is a visual representation of time management that organizes tasks or activities in a circular format. This visually engaging infographic allows you to create a dynamic and intuitive schedule using a circular design. The template offers a creative way to showcase time-based information, such as daily routines, event schedules, project timelines, or weekly agendas. This can be used in various contexts where schedules or timelines need to be visually presented. Fully customizable and compatible with Powerpoint, Keynote, and Google Slides.


6 diapositivas
Annual Corporation Report Infographics
Our Annual Corporation Report infographic is an optimal visual enhancement for presentations in Powerpoint, Keynote, and Google Slides, tailored for corporate executives, financial analysts, and stakeholders. This infographic is meticulously designed to present annual financial and operational data in a structured and easily interpretable manner. The infographic provides a visual summary of an organization's yearly performance, including financial figures, growth metrics, and key performance indicators (KPIs). Its layout is engineered to present complex data in a digestible format, facilitating quick comprehension and analysis of the company's annual achievements and areas for improvement. Incorporating this infographic into your annual report presentations will not only streamline the communication of your corporation's yearly outcomes but also enable your audience to better grasp the strategic insights derived from this data. Whether you're reviewing revenue streams, expenditure, or performance benchmarks, this infographic will serve as a powerful tool to convey your message with clarity and precision.


7 diapositivas
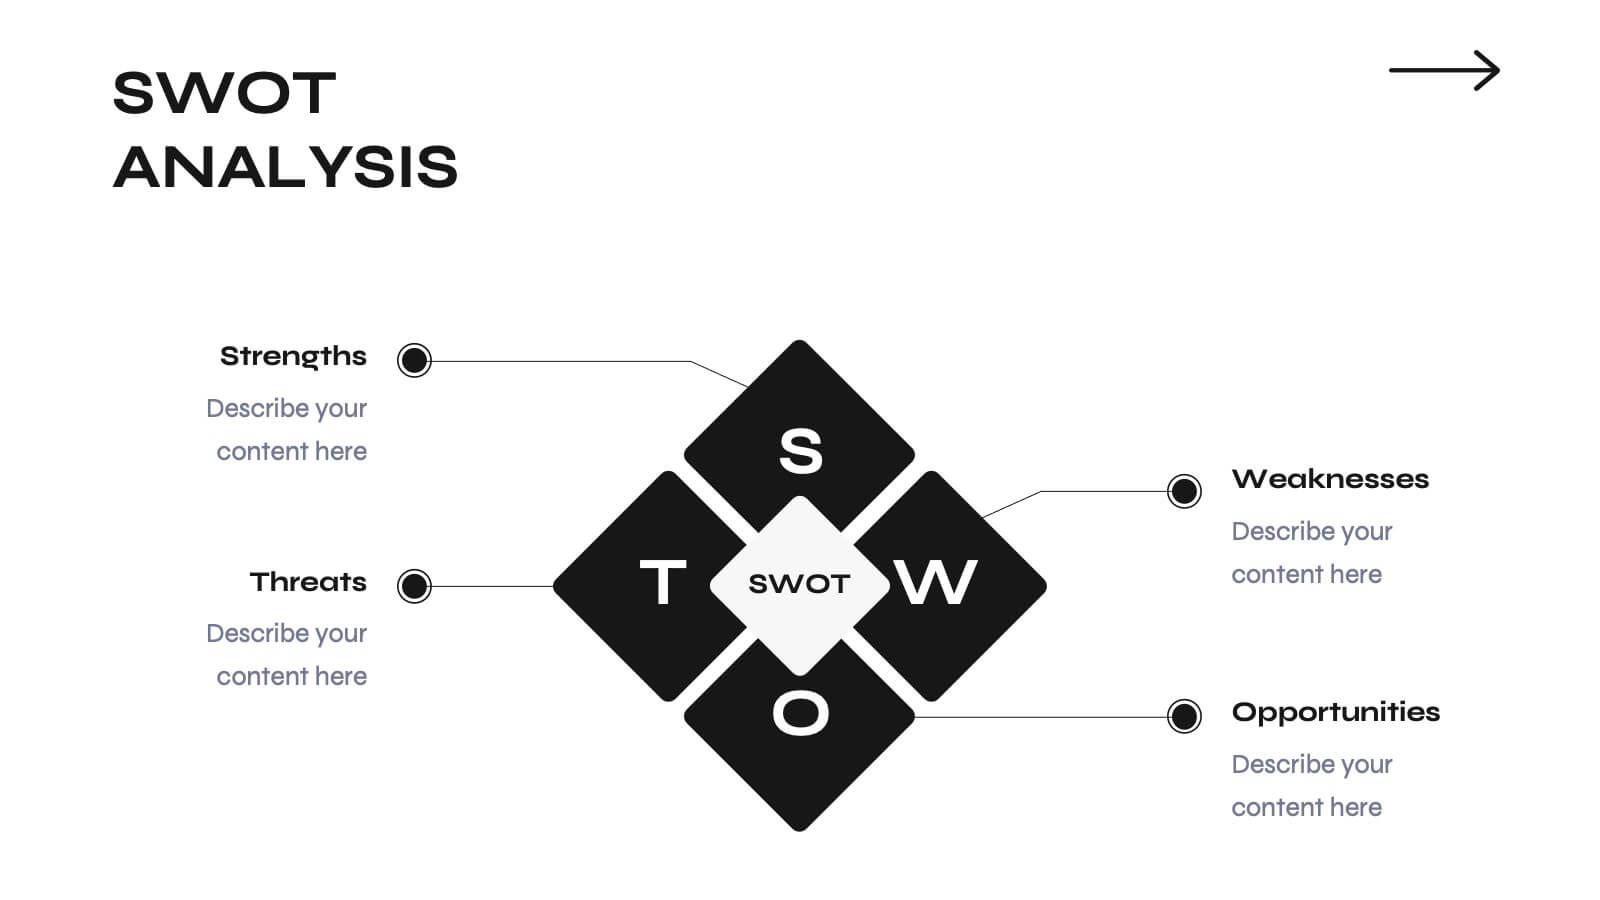
SWOT Analysis Marketing Infographic Presentation
SWOT Analysis is a simple, but powerful strategic planning method. It helps identify your company’s strengths, weaknesses, opportunities and threats as you plan a course for the future. This template includes everything you need for your next project, including data and insight about your business. This template comes with 7 slides. It includes a title for each infographic and allows you to build your swot charts, add icons and convert the text into bullet points. You have complete control over all elements within each slide and can easily add, delete or modify content at any time!


5 diapositivas
Understanding Customer Needs with Empathy Map Presentation
Gain deeper customer insights with the Understanding Customer Needs with Empathy Map Presentation. This template simplifies user research by visually organizing customer thoughts, behaviors, and emotions into a clear layout. Perfect for UX teams, product designers, and marketers aiming to craft user-centric strategies. Fully editable in PowerPoint, Keynote, Canva, and Google Slides.