


Características


¿Tienes alguna pregunta?
Recomendar


2 diapositivas
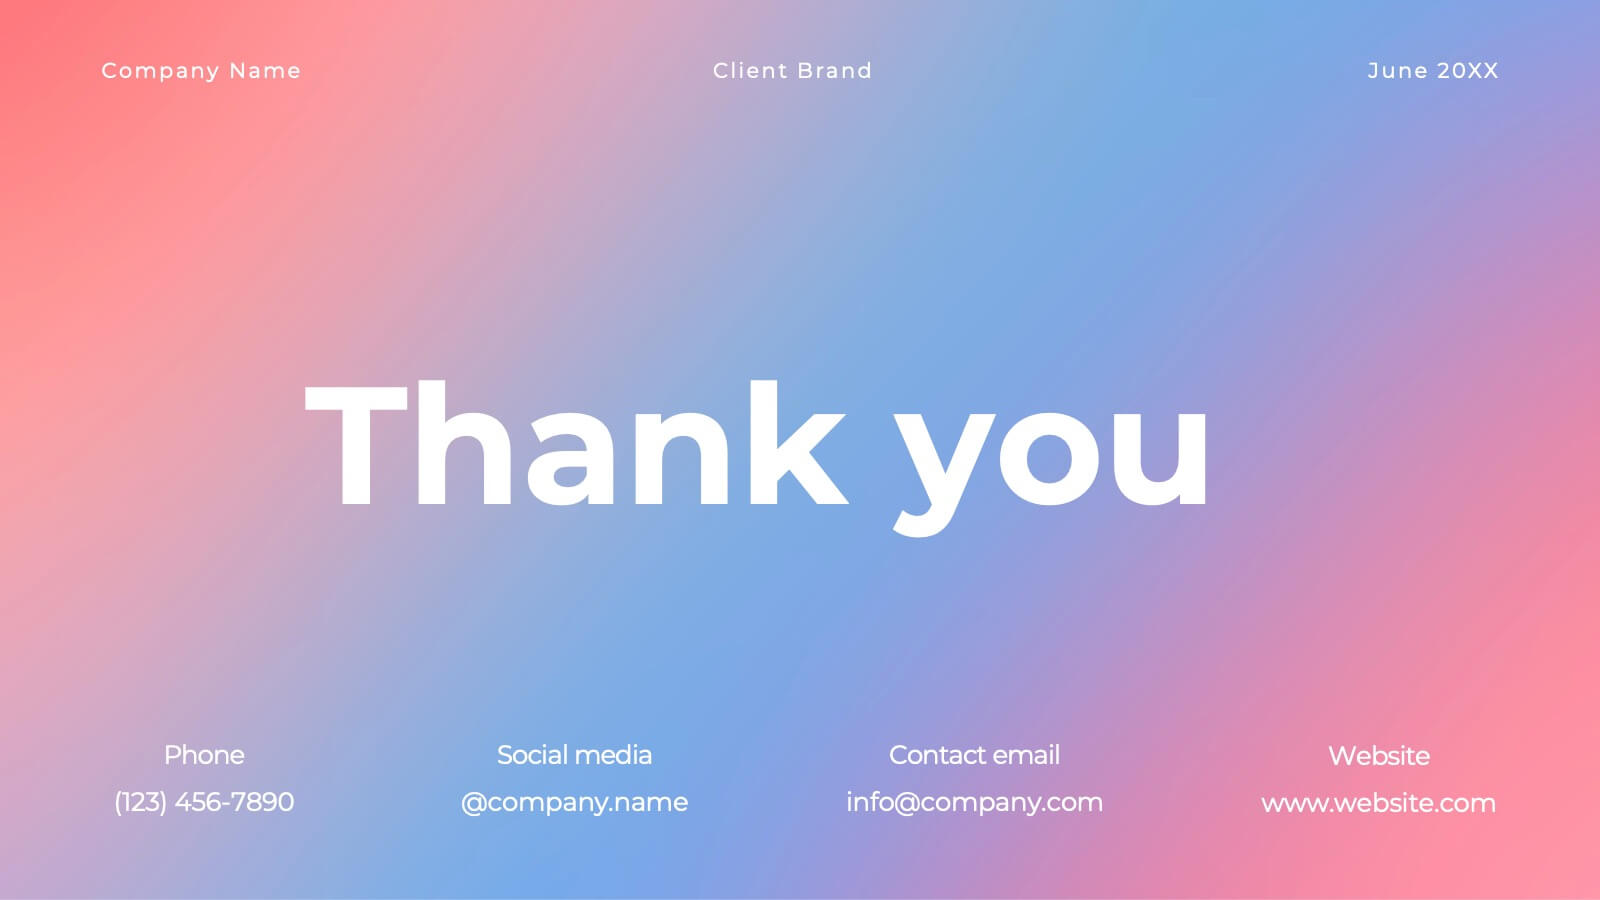
Elegant Thank You Slide
Leave a lasting impression with this modern and refined thank-you slide. Designed with clean lines, professional typography, and an image placeholder to showcase your team, workspace, or branding. Ideal for closing business decks and project presentations. Compatible with PowerPoint, Keynote, and Google Slides.


26 diapositivas
Protecting Your Digital Assets with Cybersecurity Presentation Template
Safeguard your digital world with this sleek and professional presentation on protecting your digital assets with cybersecurity! This template is designed to simplify complex concepts while showcasing the importance of online safety, data protection, and risk management. Featuring modern layouts, detailed infographics, and customizable charts, it’s ideal for exploring cybersecurity strategies, emerging threats, or best practices for organizations and individuals. The polished design, complete with high-tech visuals and a calming color palette, ensures your audience stays engaged while absorbing critical information. Perfect for IT professionals, educators, or businesses, this template is fully compatible with PowerPoint, Keynote, and Google Slides, making it an essential tool for impactful presentations.


6 diapositivas
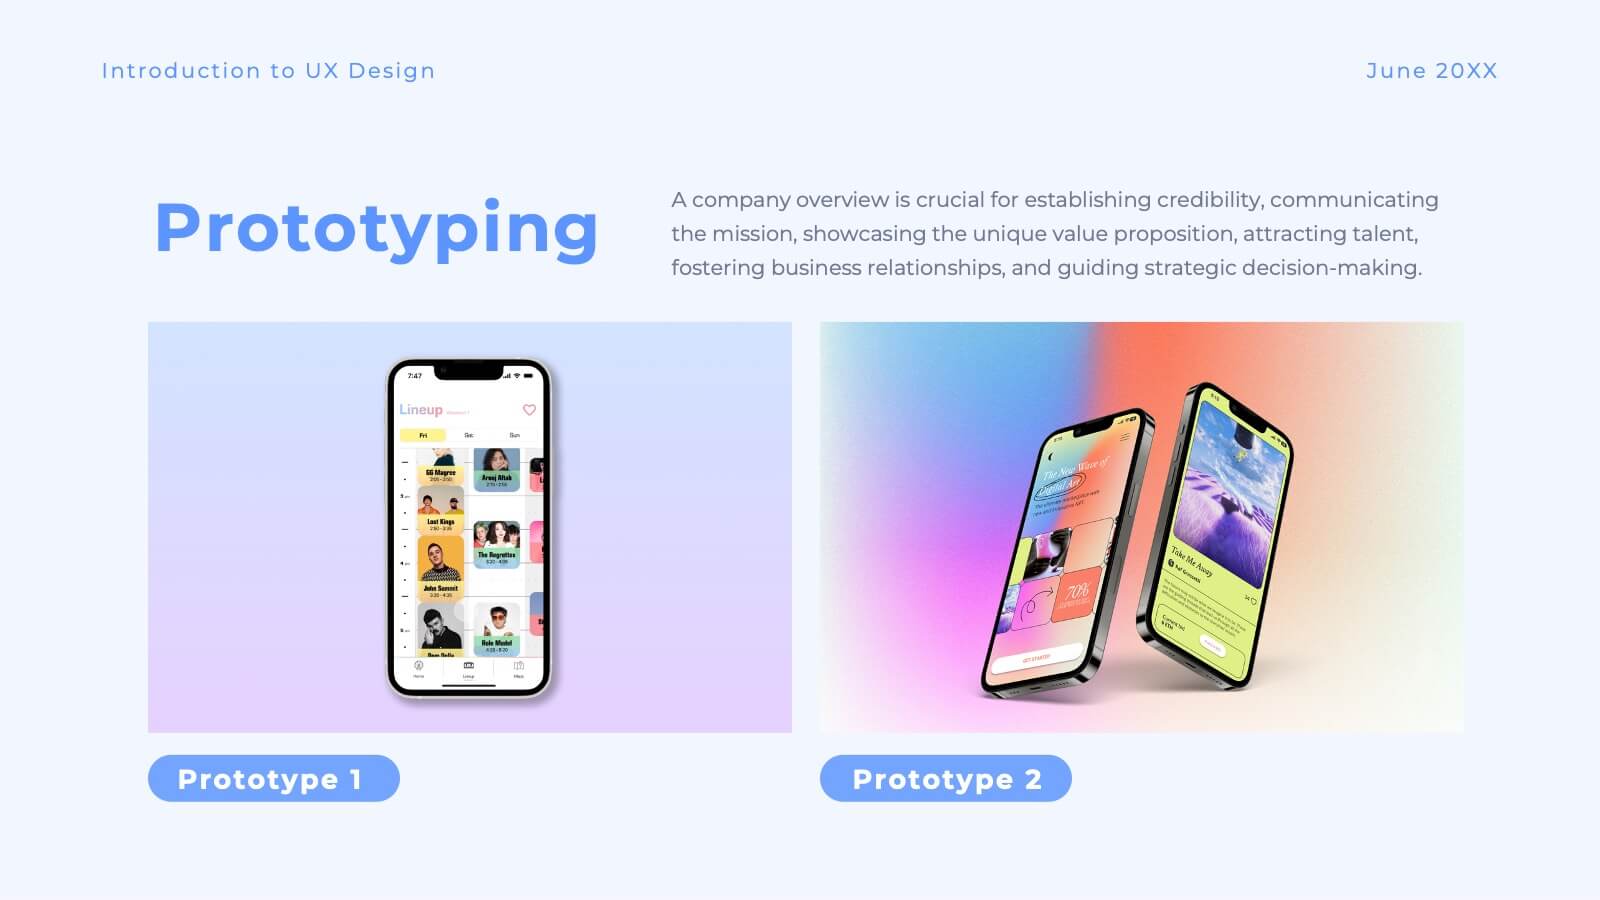
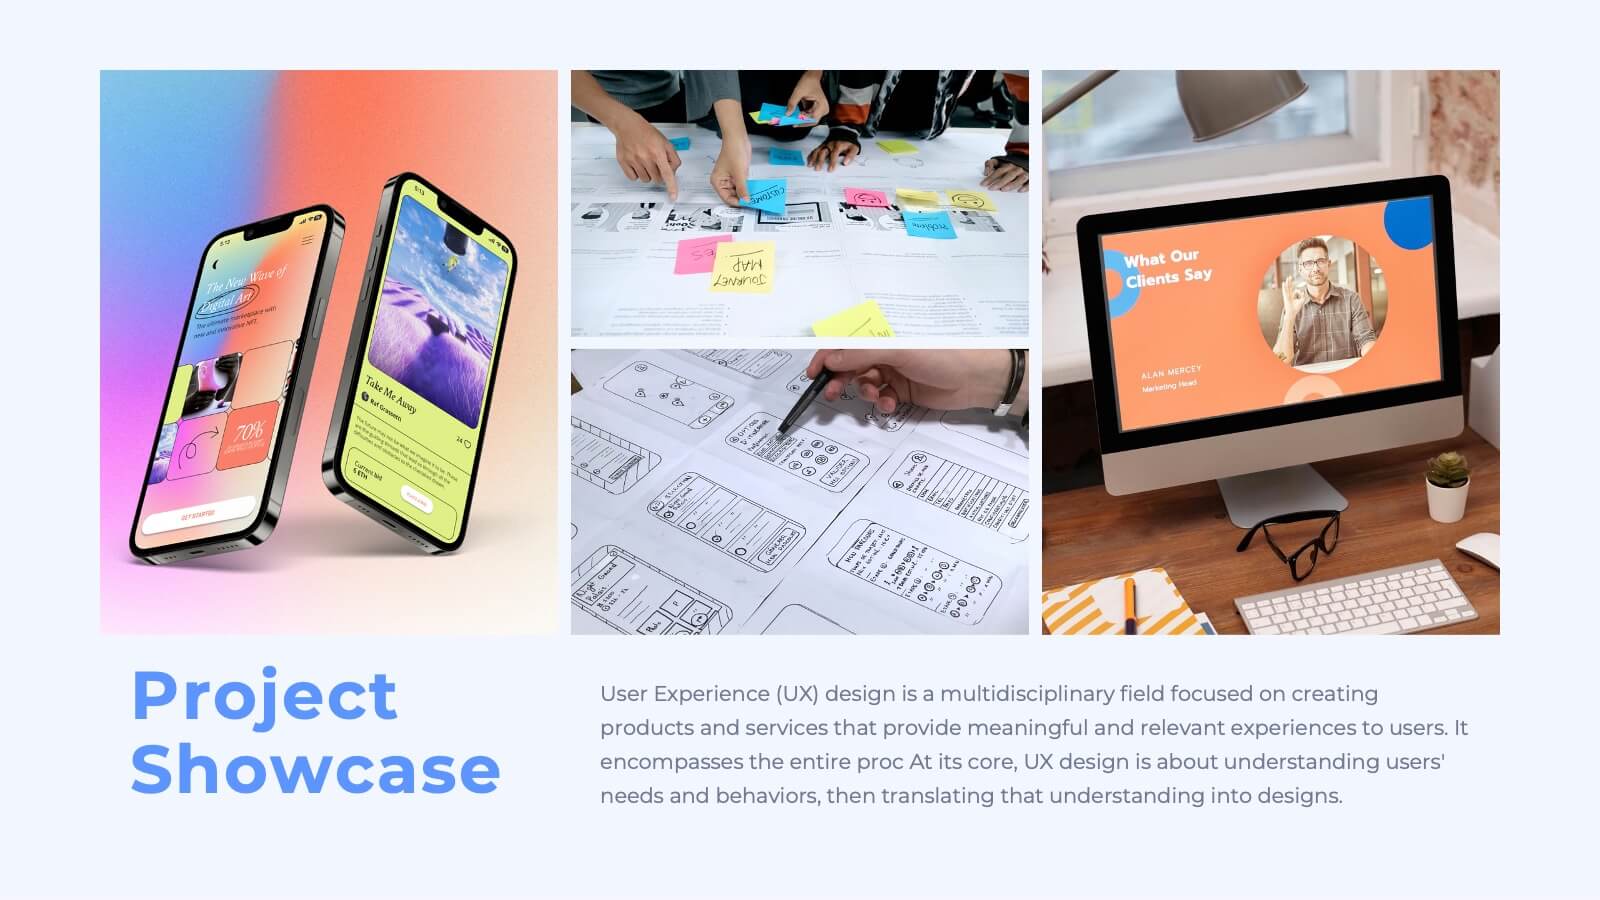
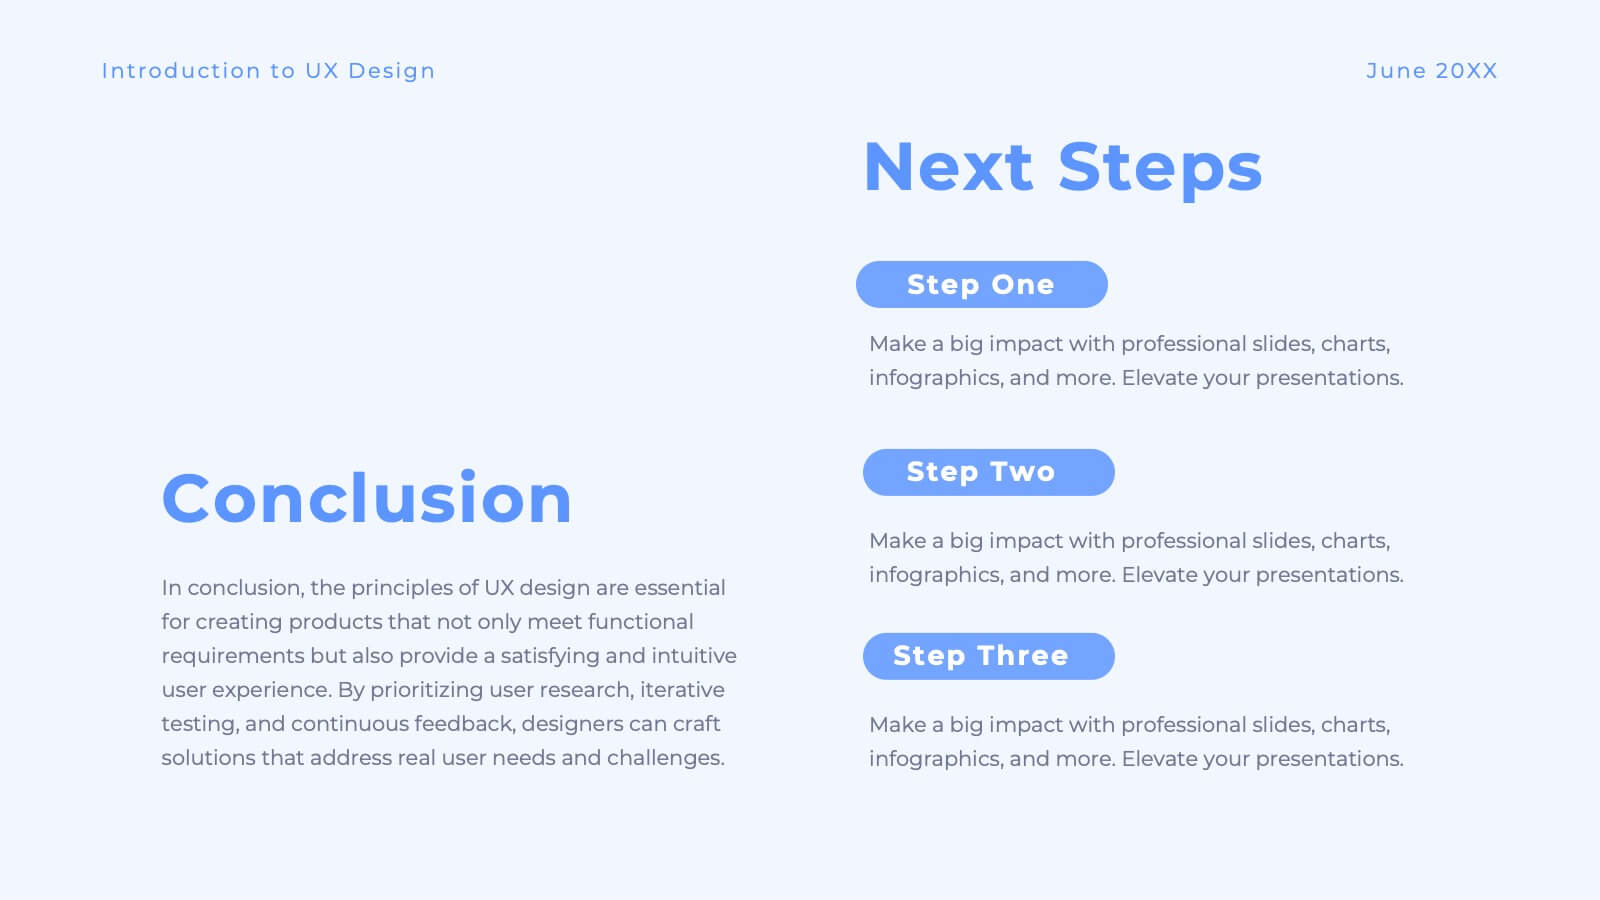
Empathy to Prototype Framework Presentation
Transform ideas into real-world solutions with a clear, step-by-step framework that connects creativity with action. This presentation helps you visualize each stage of innovation—from understanding users to testing prototypes—in a professional, engaging way. Fully compatible with PowerPoint, Keynote, and Google Slides for effortless customization and presentation.


7 diapositivas
Thank You Infographic
Express your gratitude in style with this beautifully designed template, perfect for adding a touch of elegance and personalization to your messages of appreciation. Featuring a range of versatile layouts—from minimalist designs to vibrant color schemes and eye-catching typography—each slide offers a unique way to say thank you, whether it’s to clients, team members, or partners. Customize the visuals to align with your brand or personal style by integrating your own photos, logos, and text, making each expression of gratitude uniquely yours. Ideal for corporate settings, personal use, or charitable events, this template helps you create memorable, heartfelt thanks that resonate deeply with recipients, and is perfect for use in presentations, emails, or as special tokens of appreciation to leave a lasting impression.


7 diapositivas
Competitive Advantage Through Value Chain
Make your value chain comparison stand out with this bold, visual slide that maps two sides head-to-head. Perfect for highlighting competitive advantages, strategic differences, and operational gaps. This template is clear, customizable, and ready to plug into PowerPoint, Keynote, or Google Slides.
23 diapositivas
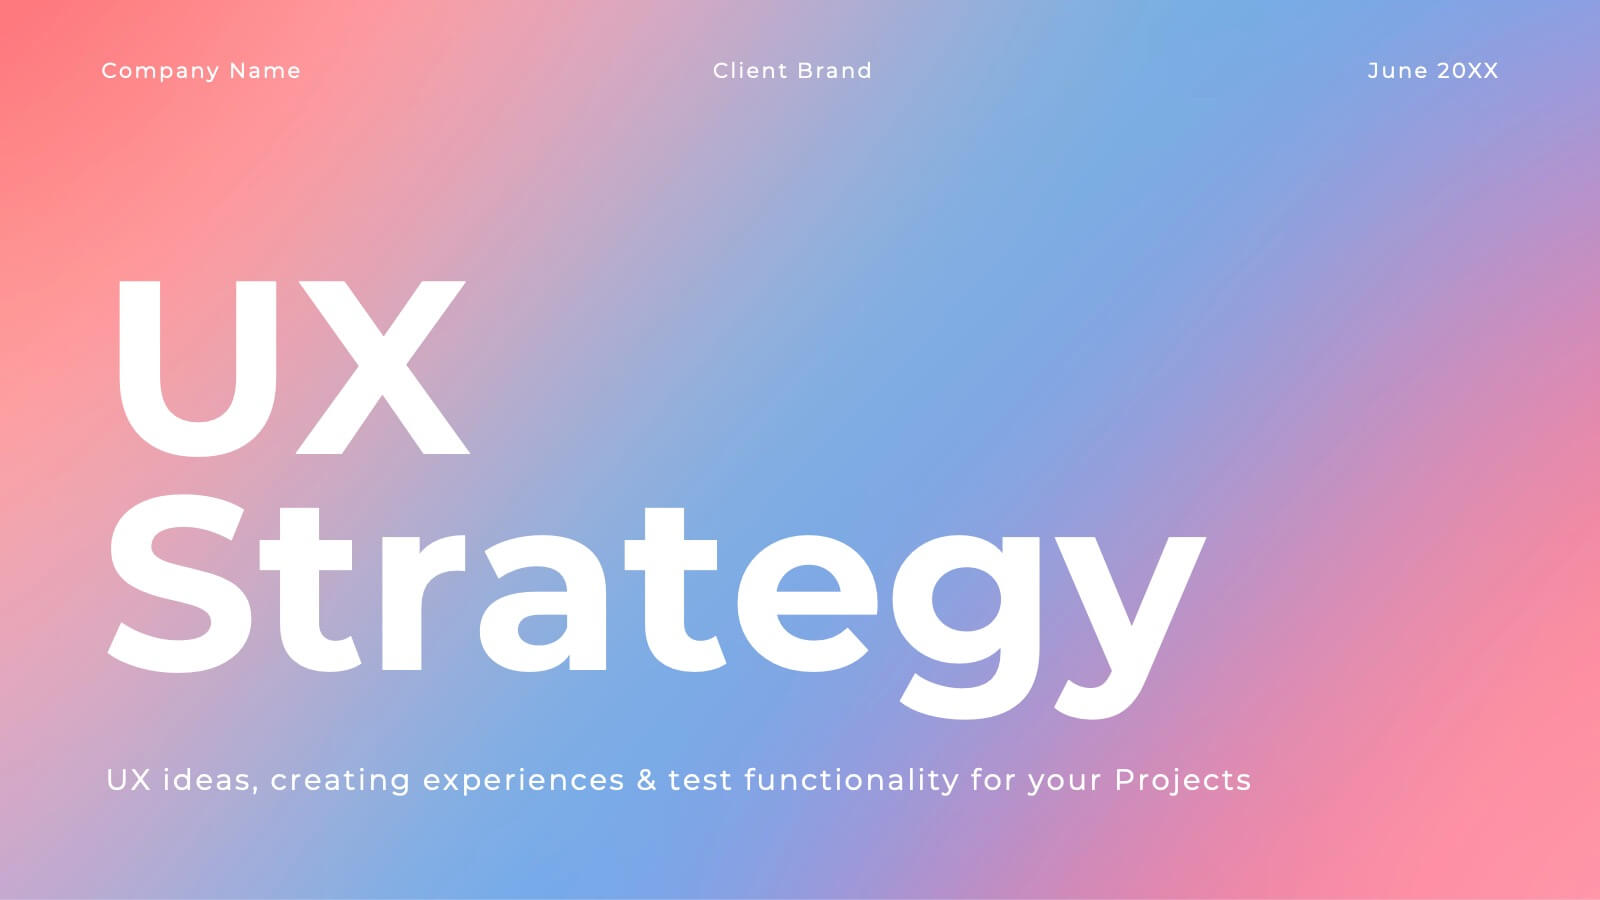
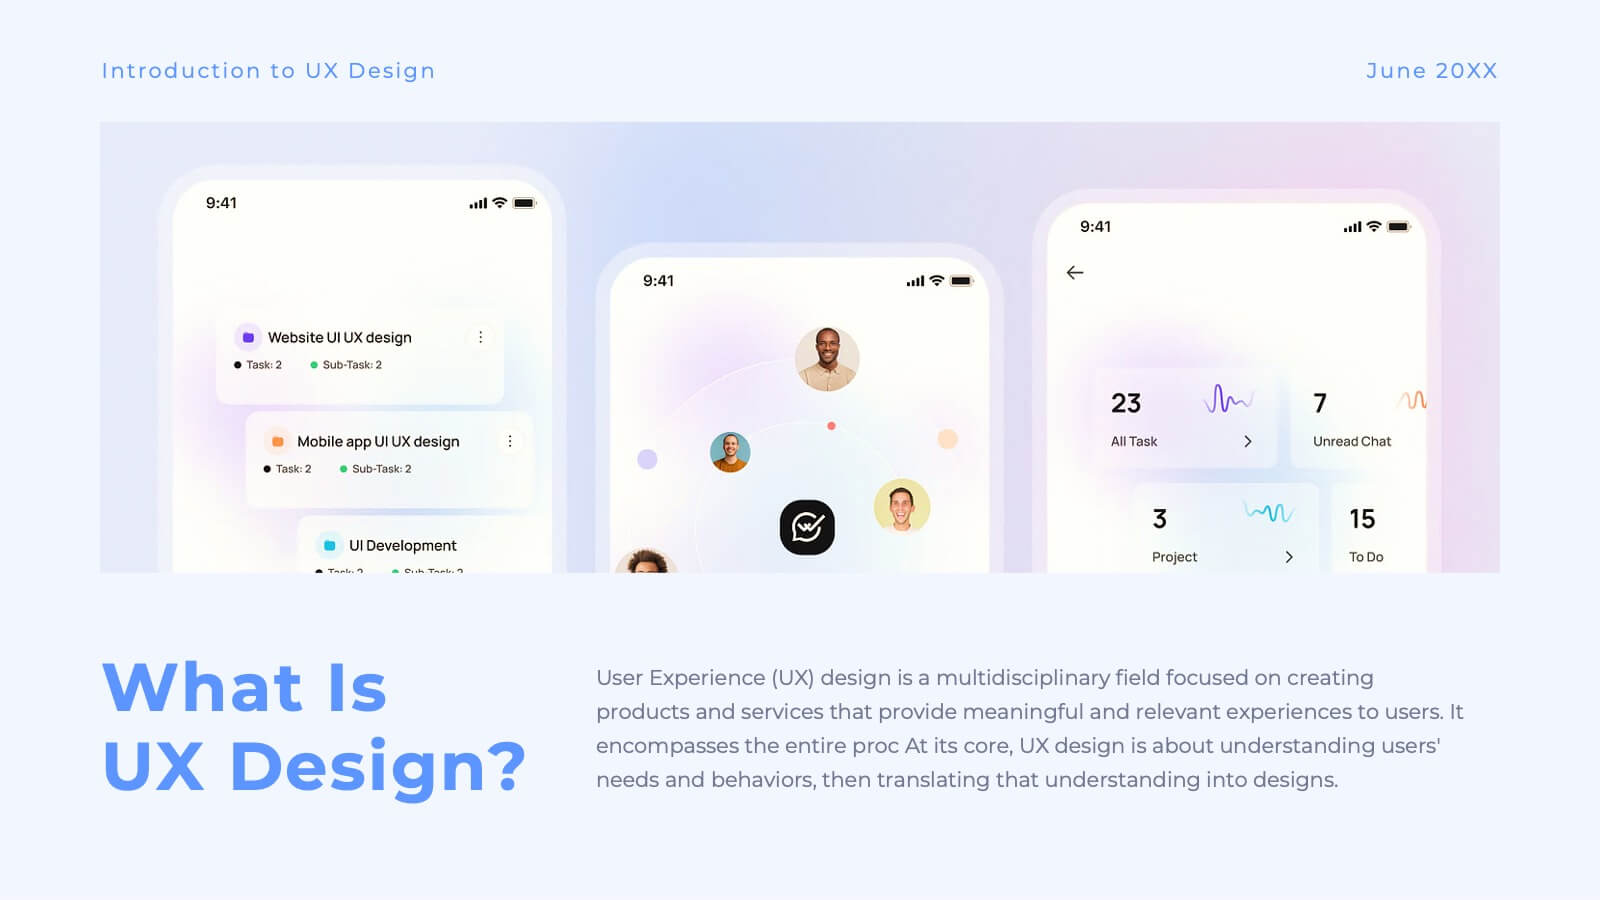
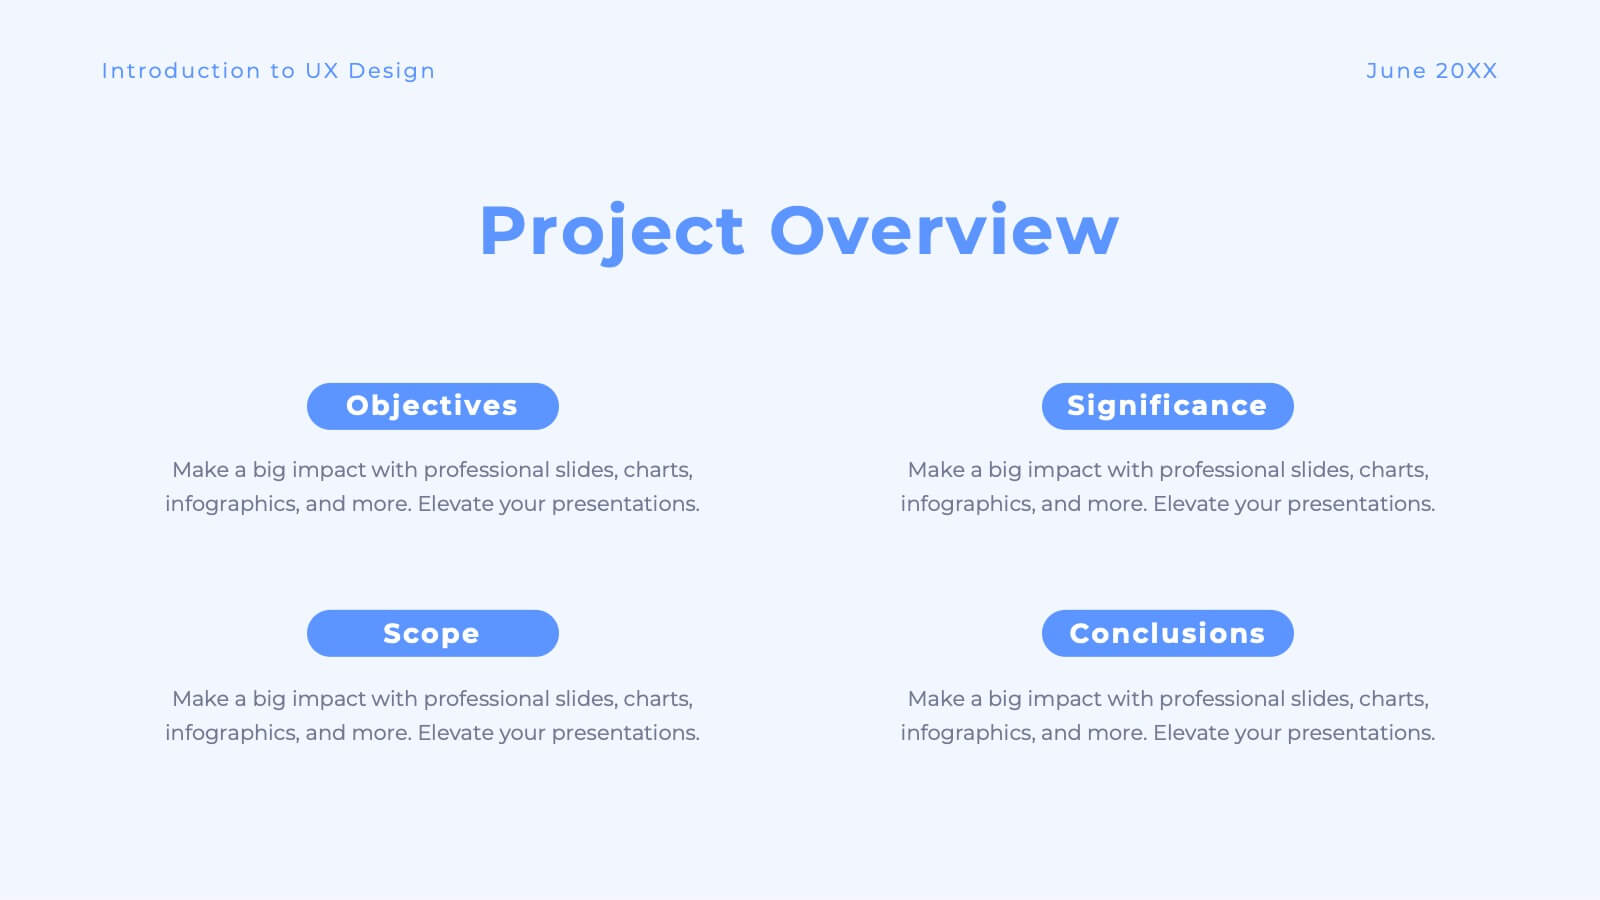
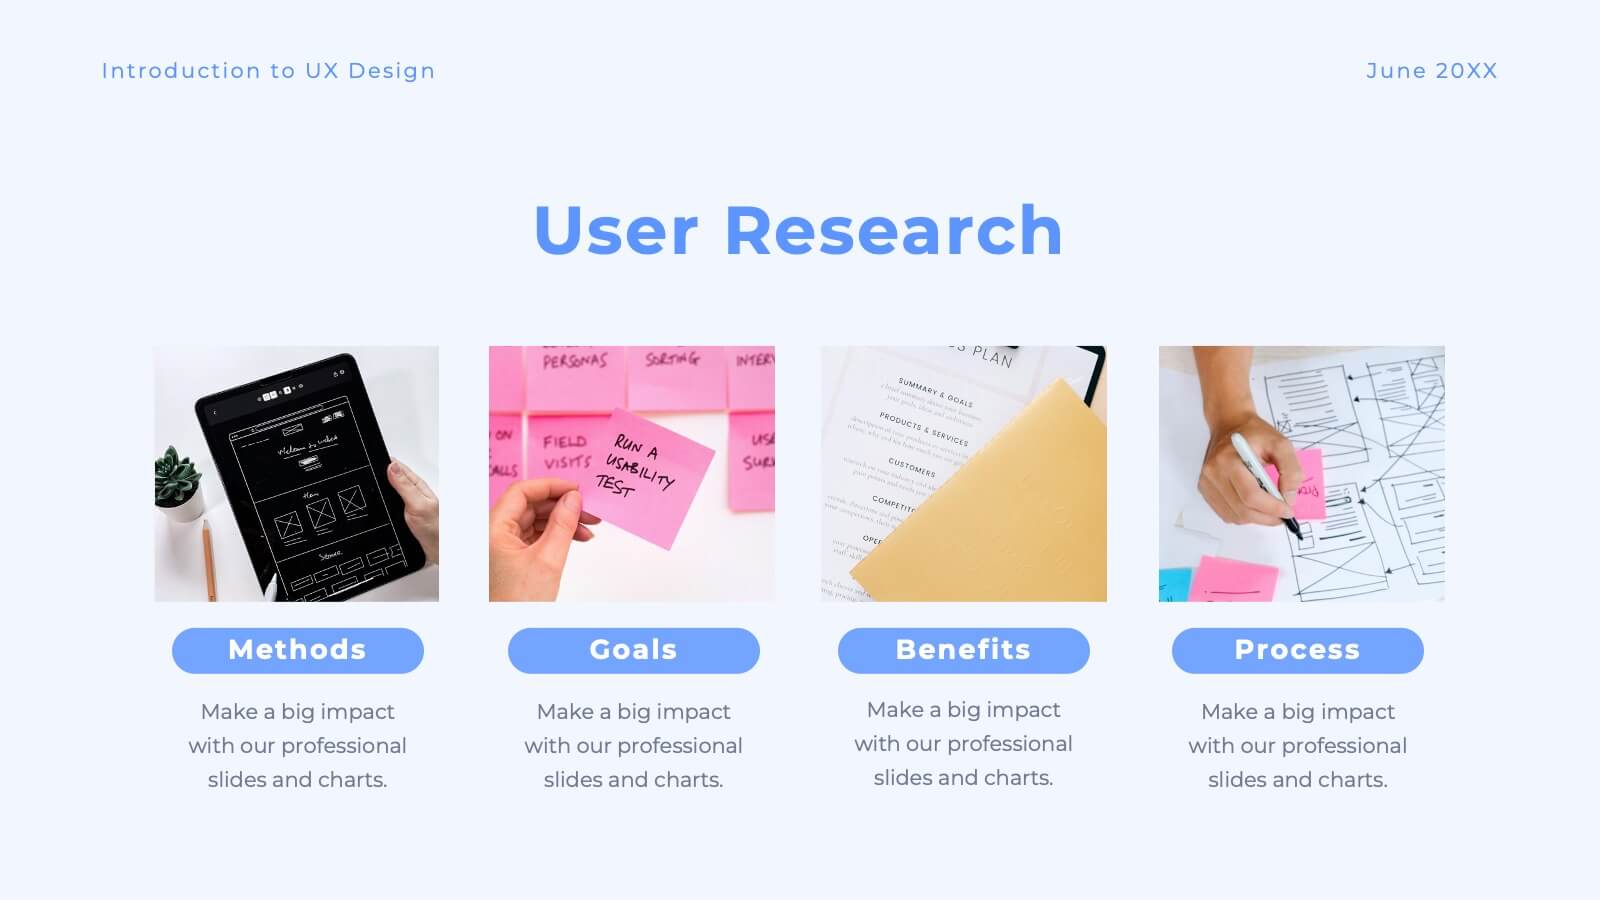
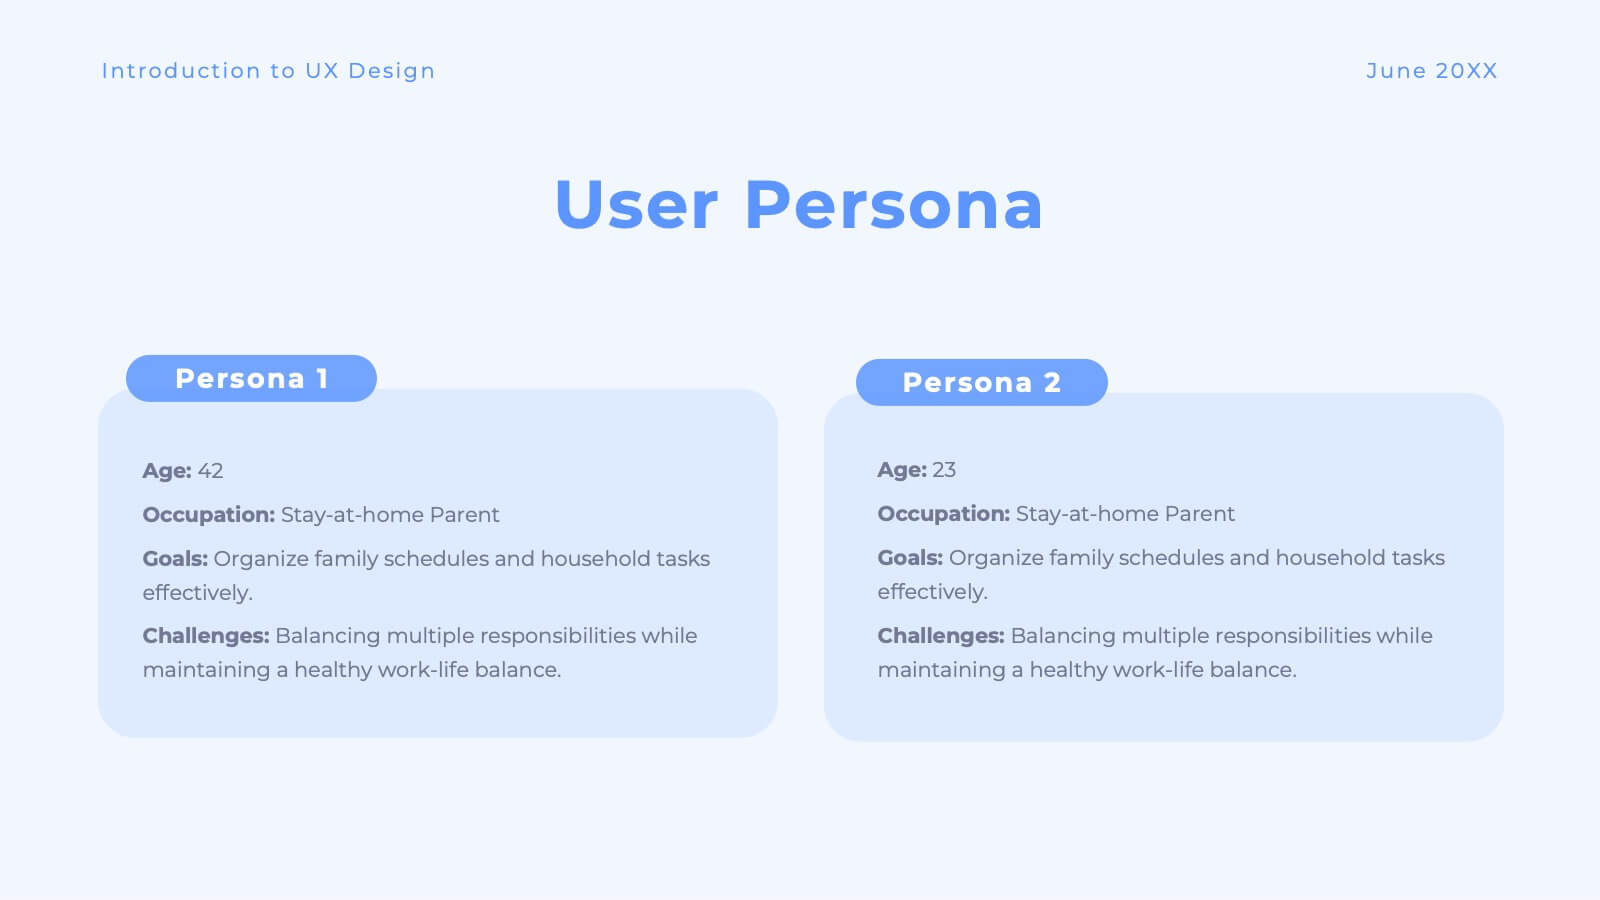
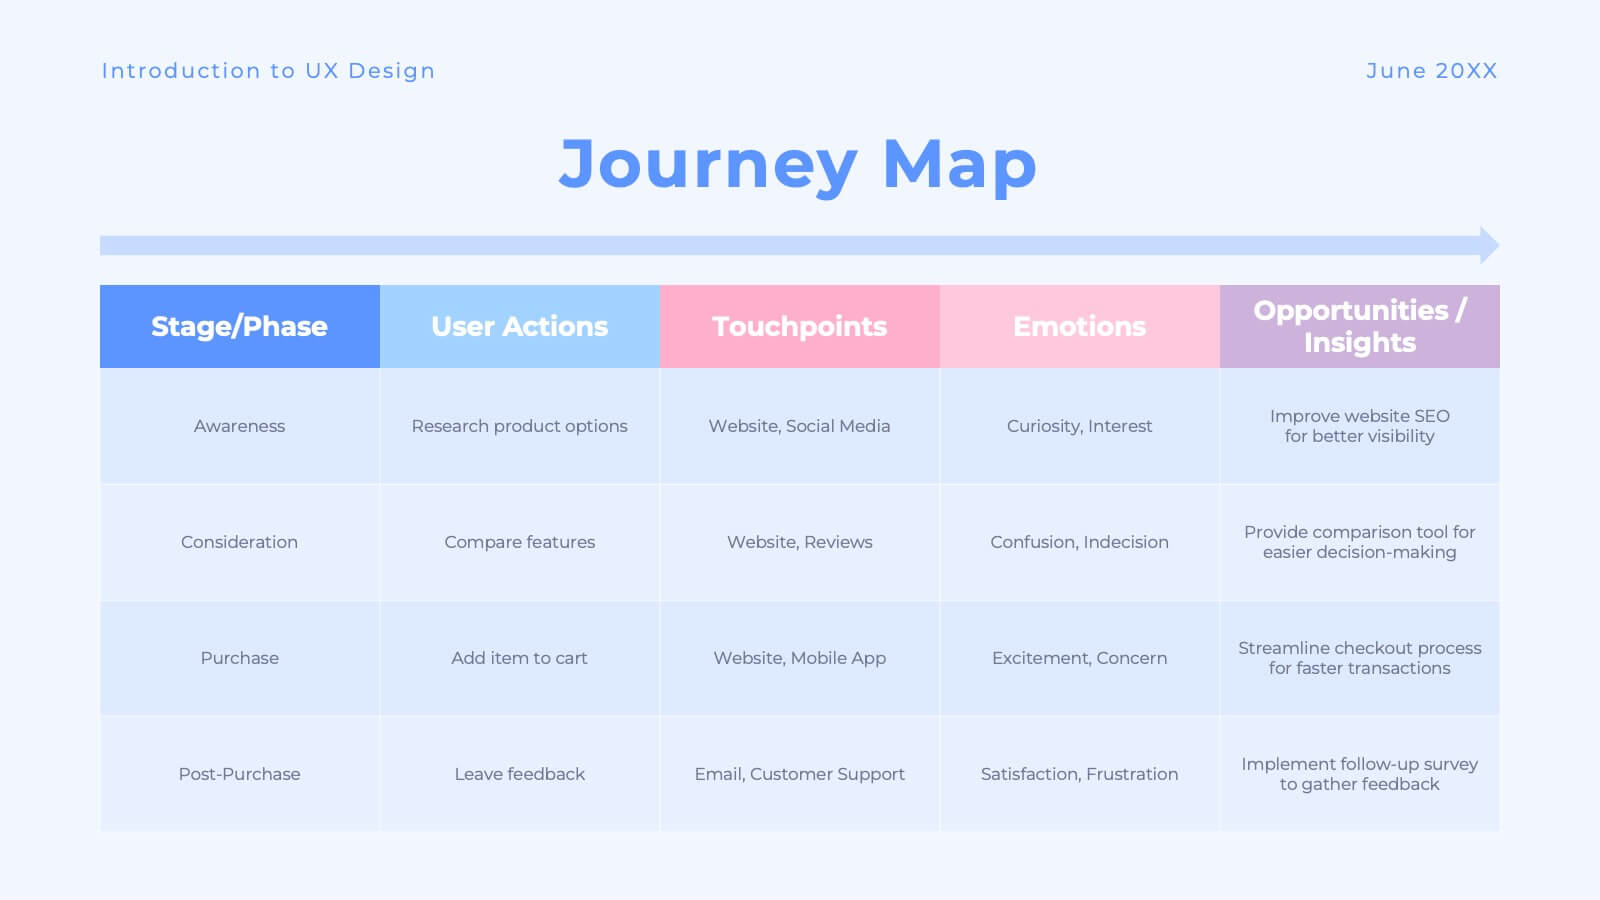
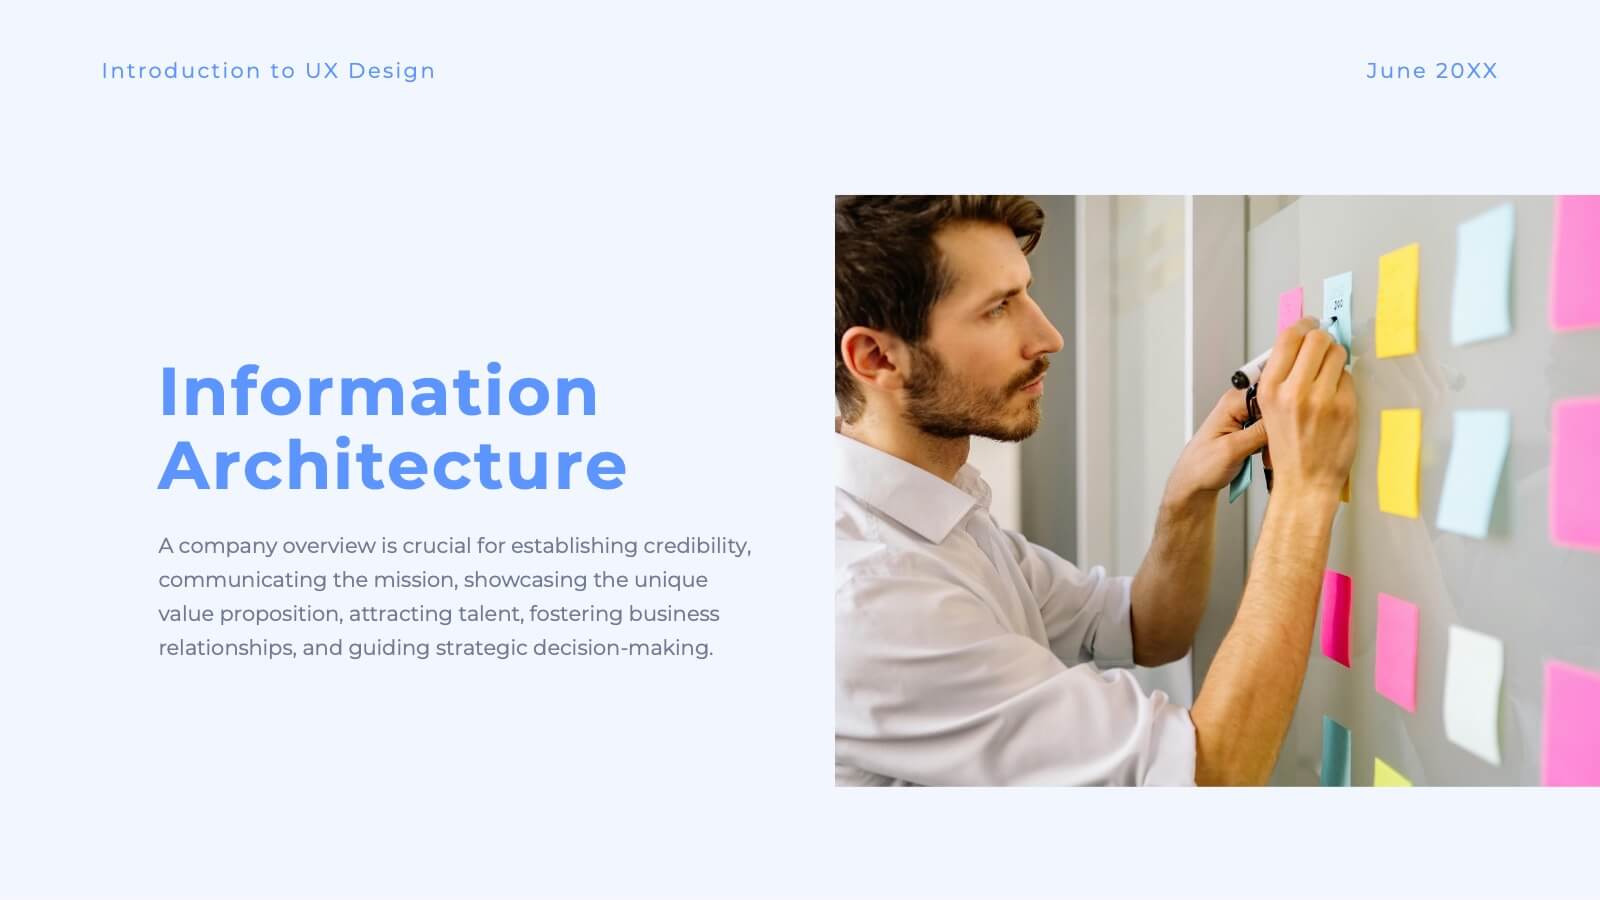
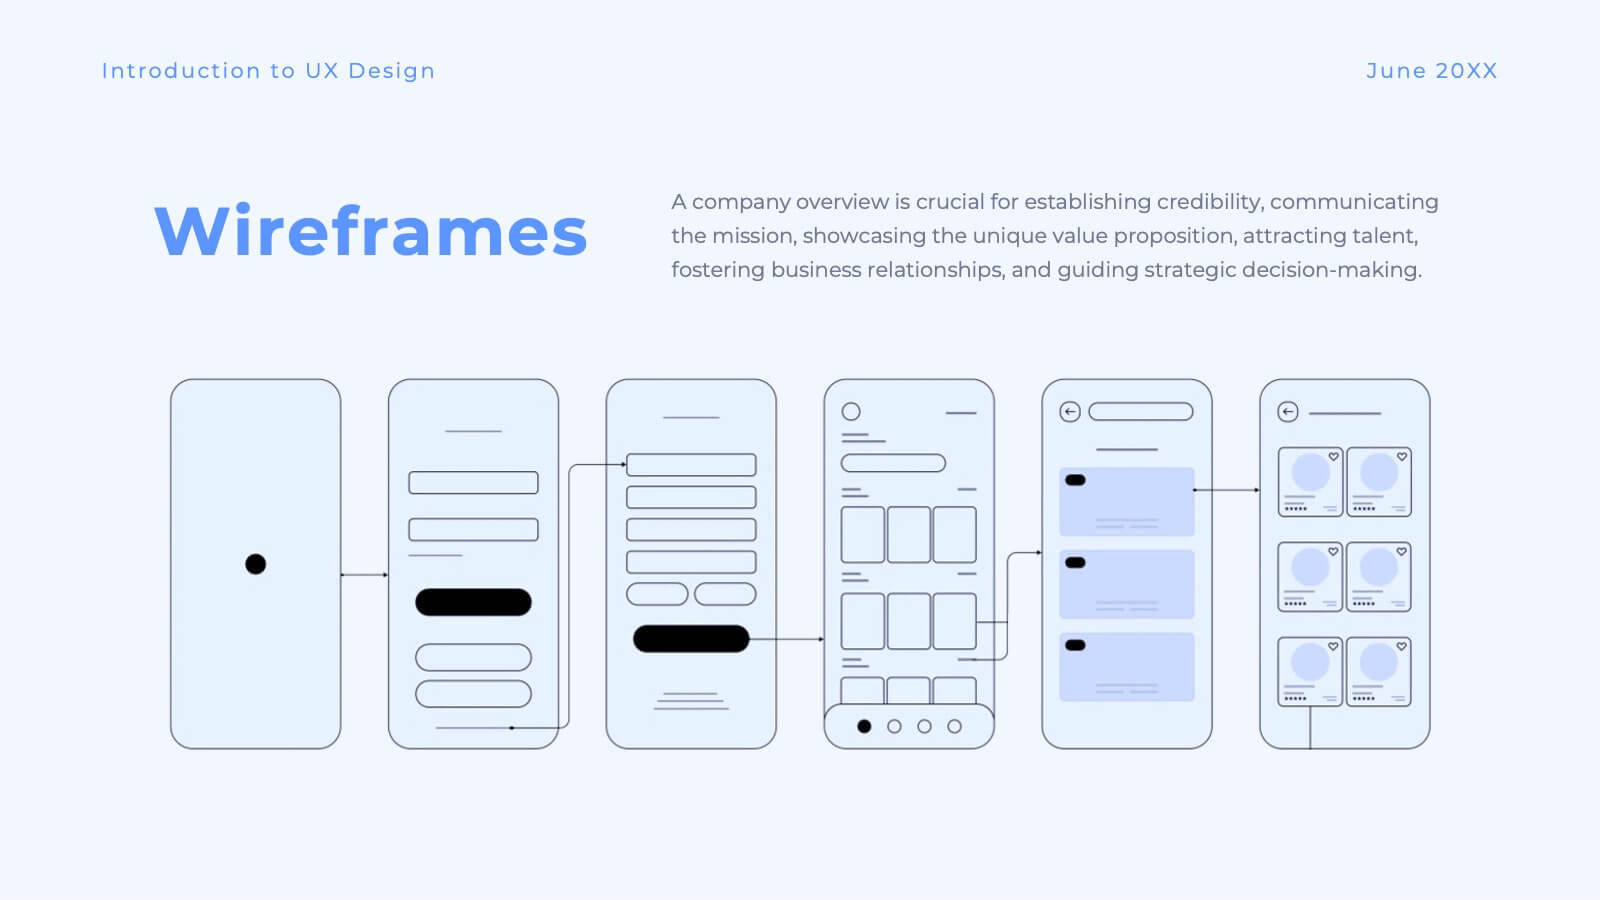
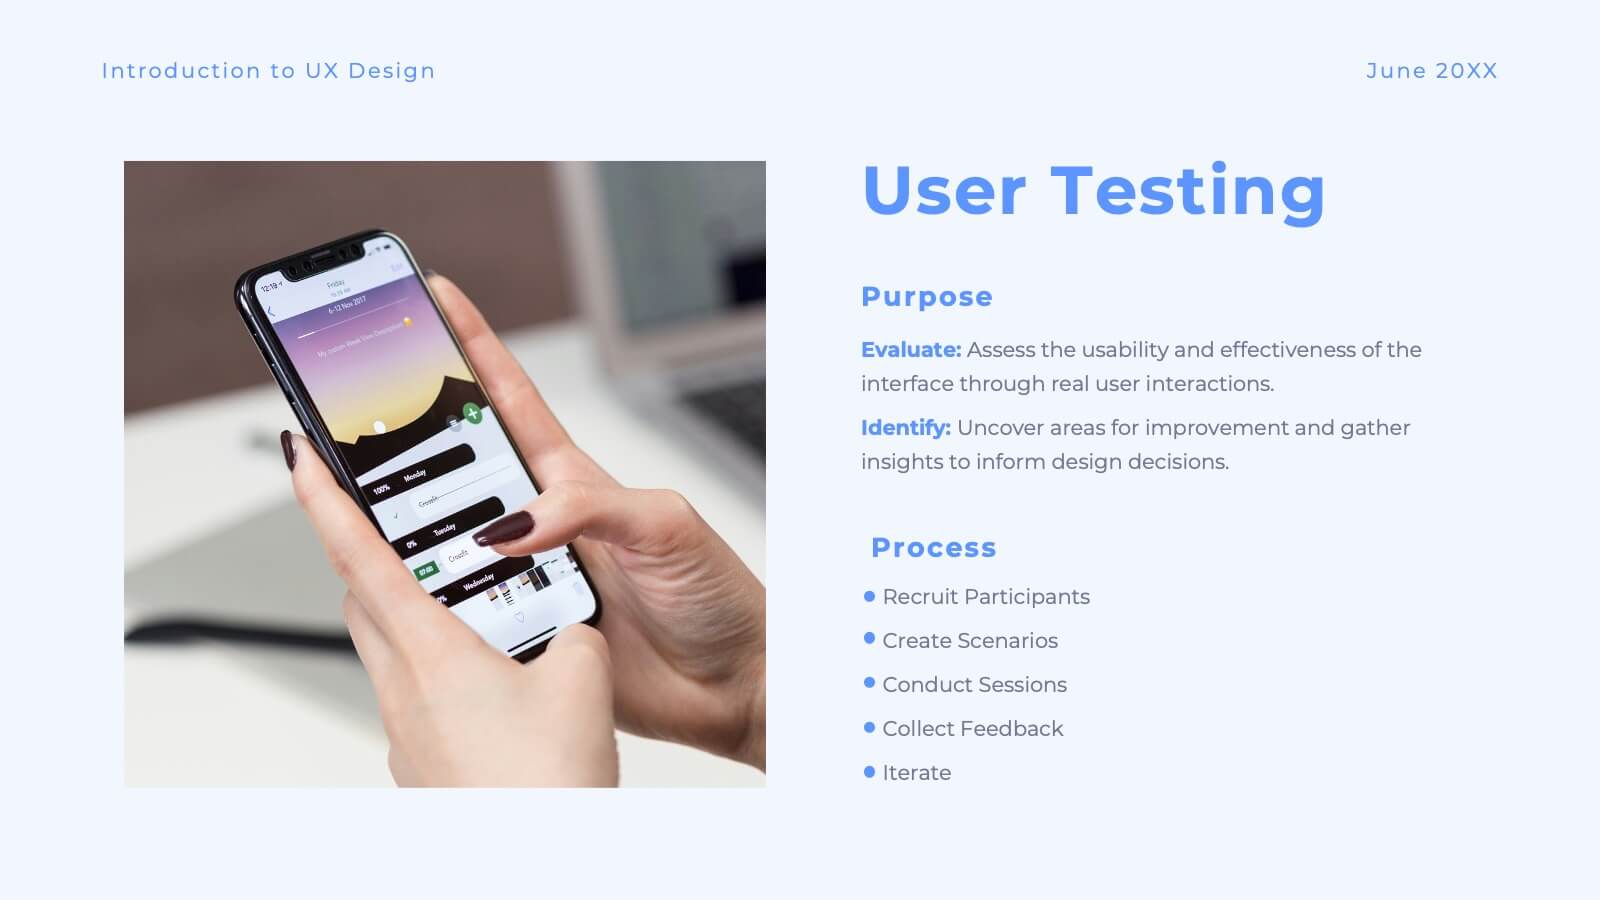
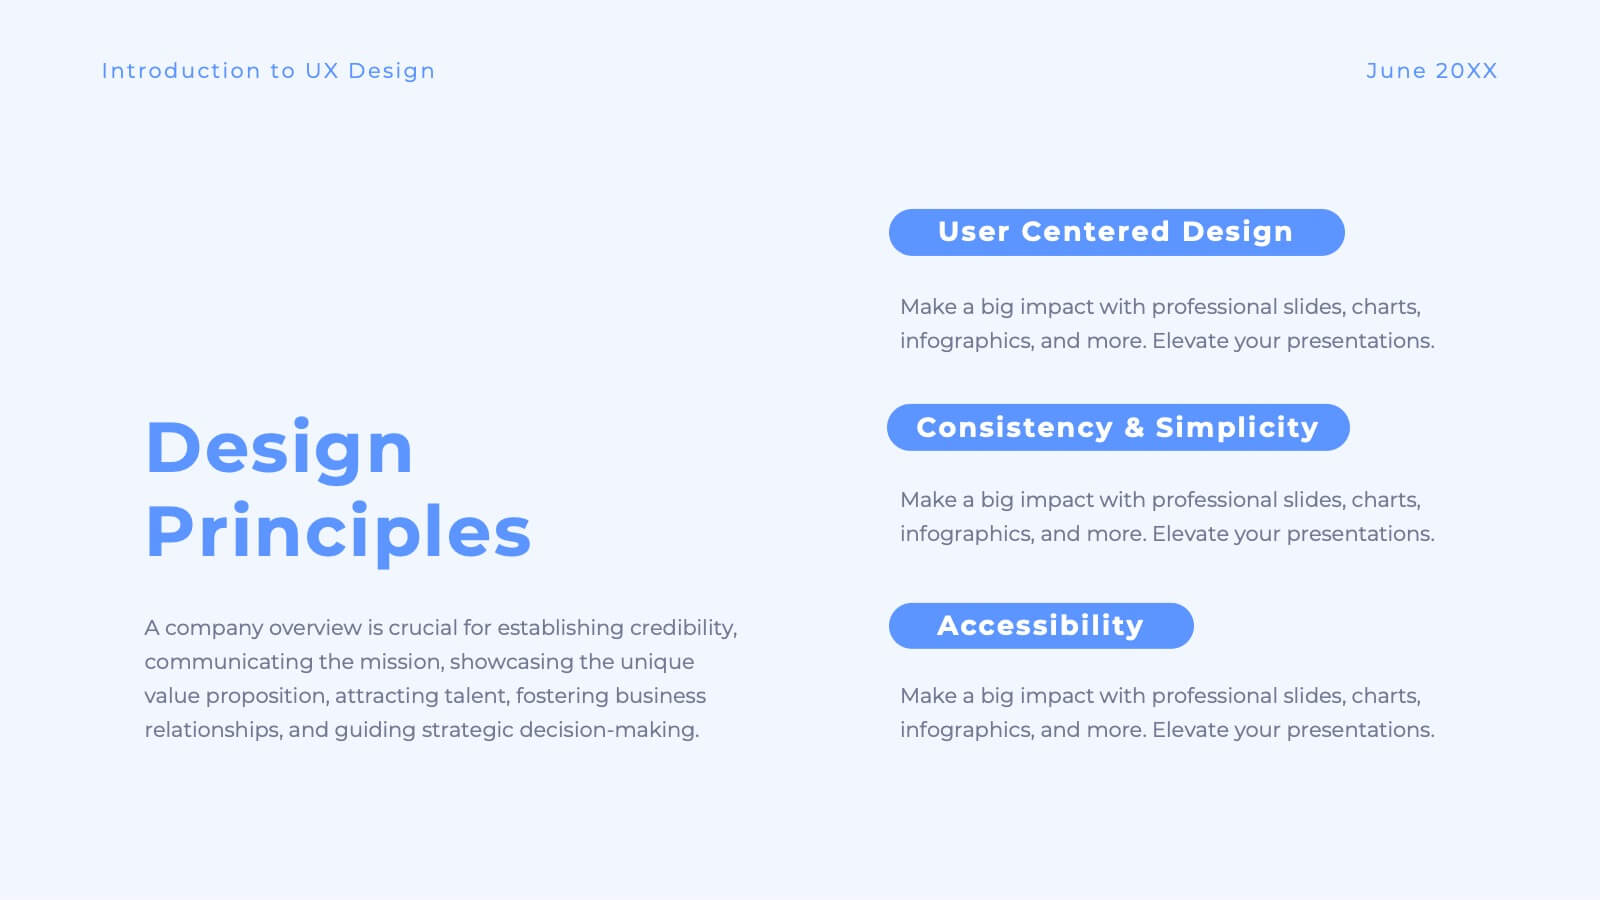
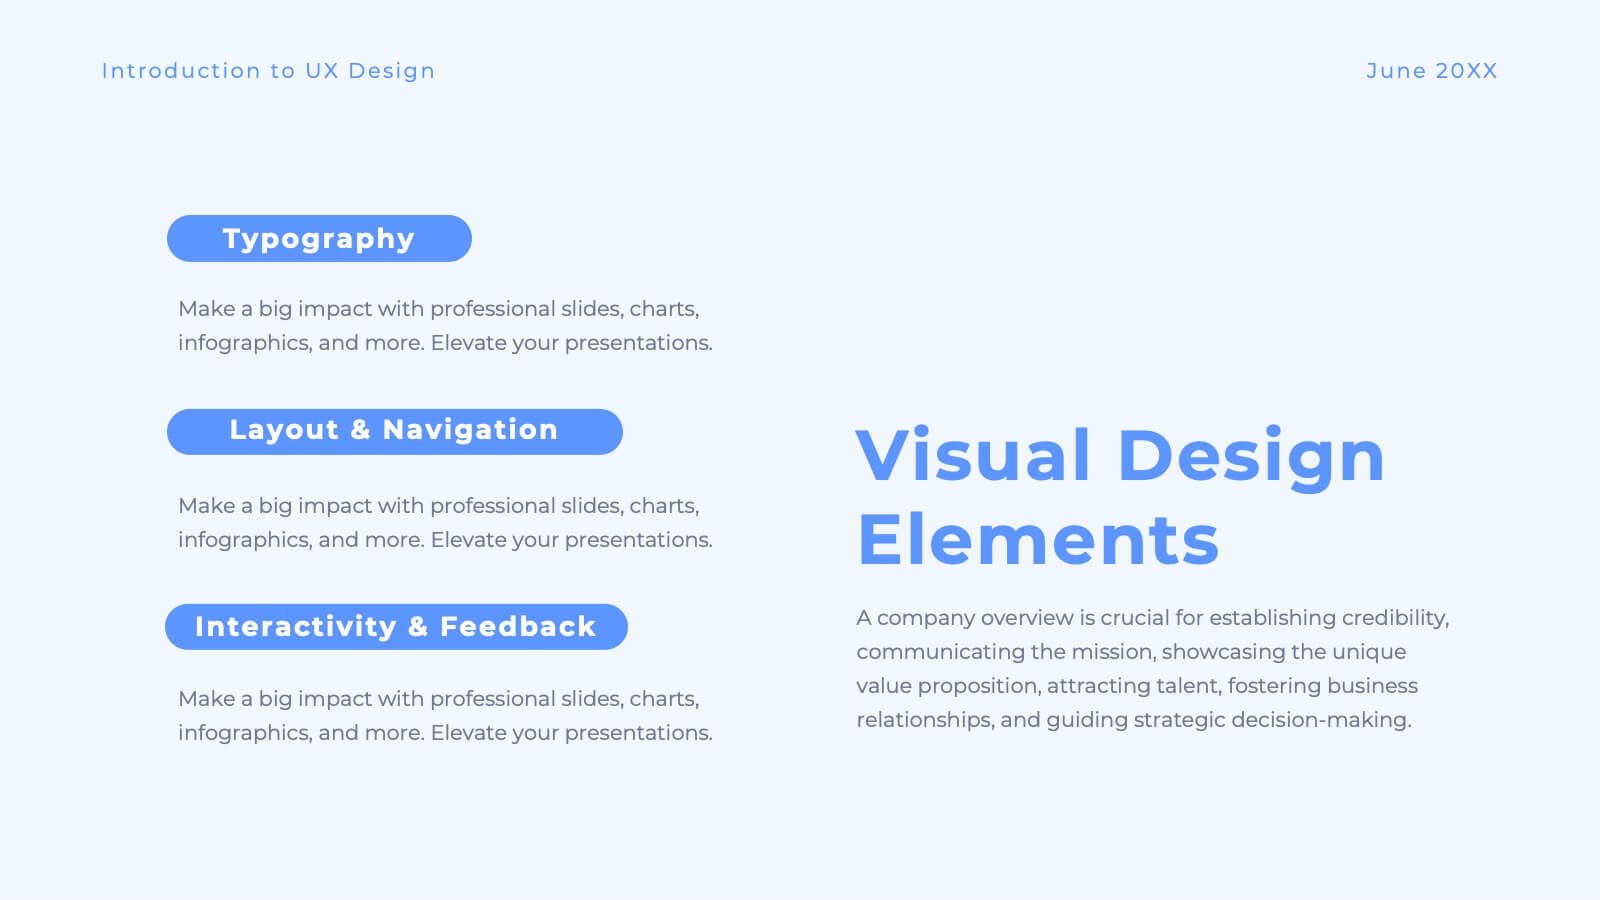
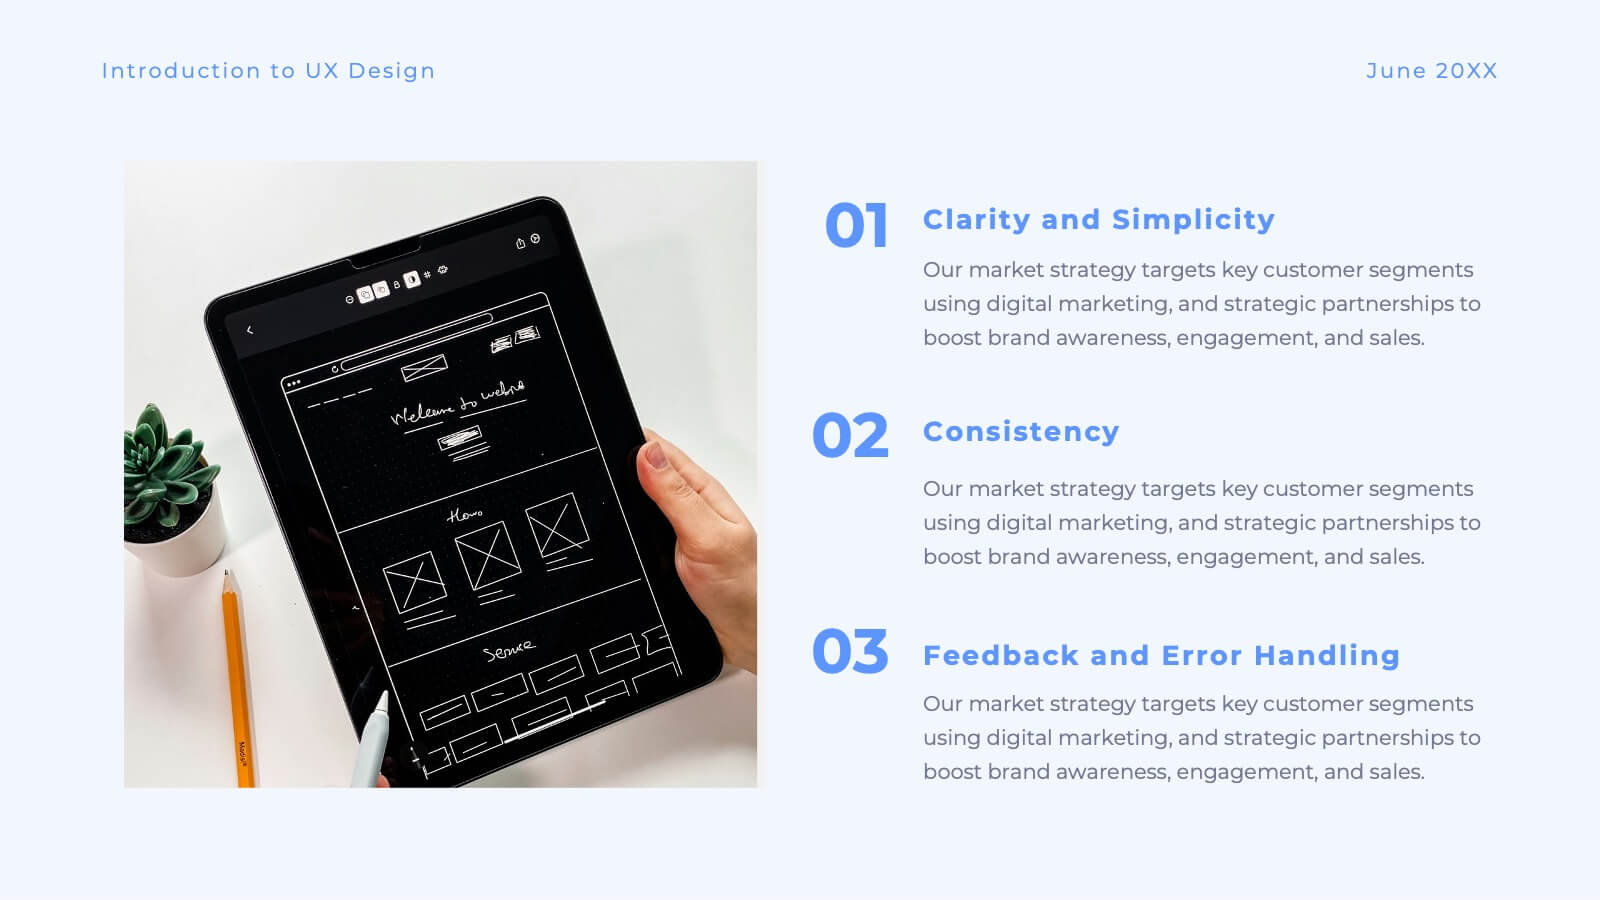
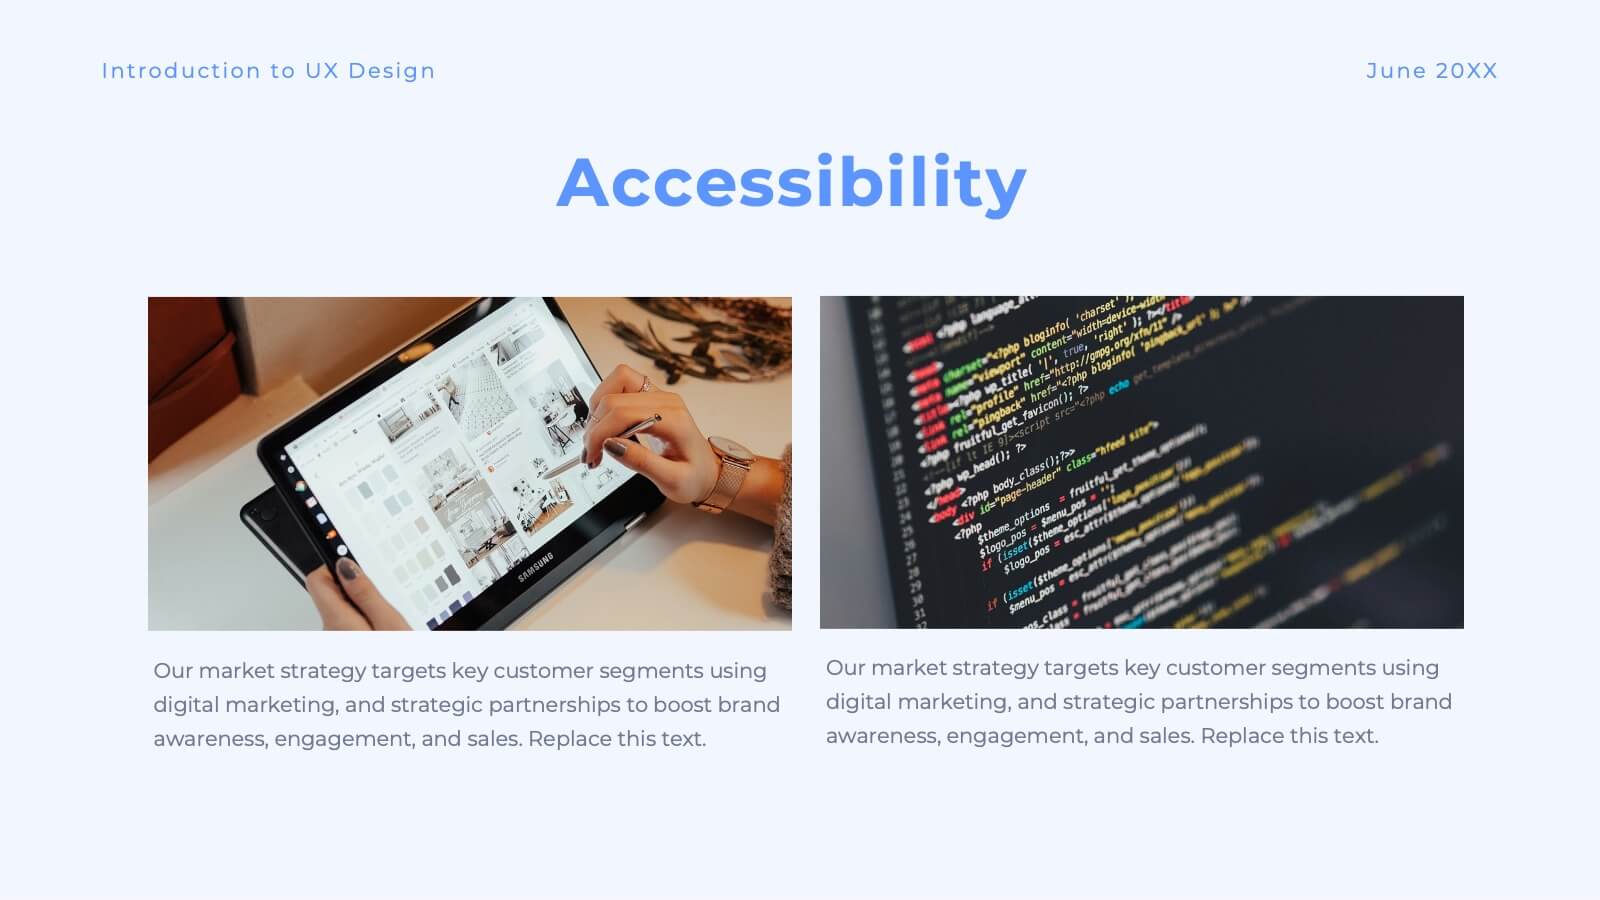
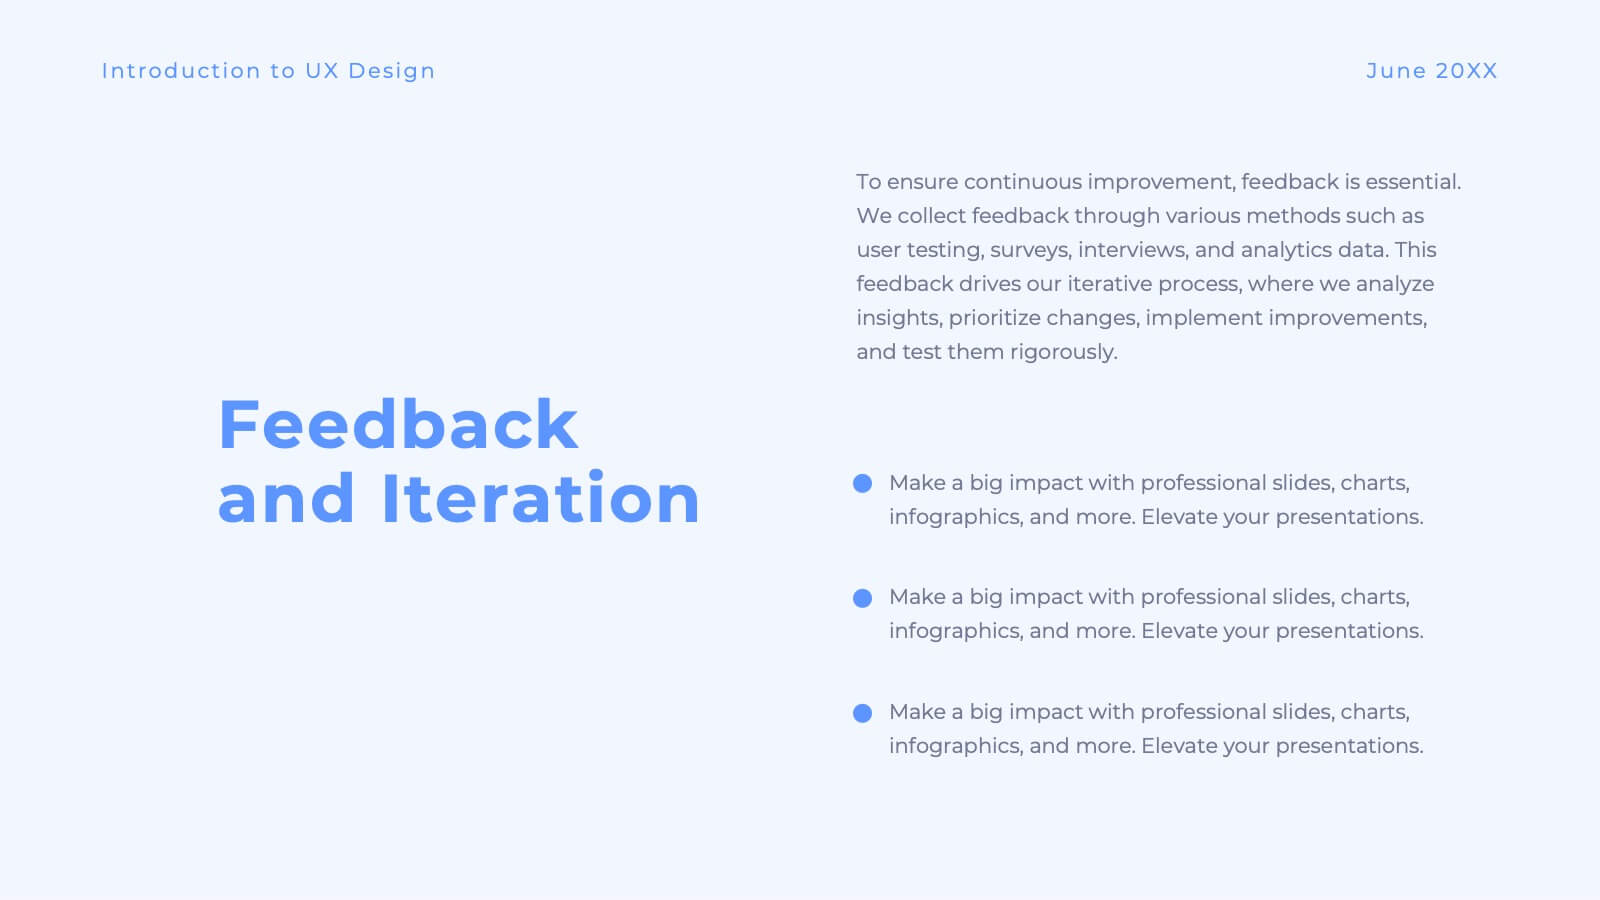
Luster UX Strategy Plan Presentation
Enhance user experience with this comprehensive UX strategy template! Perfect for outlining user research, personas, and design principles. Ideal for UX/UI designers aiming to present their strategies effectively. Compatible with PowerPoint, Keynote, and Google Slides, this template ensures your UX presentations are clear, professional, and impactful. Create exceptional user experiences today!


5 diapositivas
Behavioral Psychology in the Workplace Presentation
Boost employee engagement and team dynamics with the Behavioral Psychology in the Workplace Presentation. This slide deck is designed to help HR leaders, managers, and consultants visualize psychological insights that shape workplace behavior. Use it to present motivation theories, behavioral models, or communication styles. Fully editable in Canva, PowerPoint, Google Slides, and Keynote.


6 diapositivas
Time Management Benefits Infographics
Unlock the benefits of effective time management with our Time Management Benefits infographic template. This template is fully compatible with popular presentation software like PowerPoint, Keynote, and Google Slides, allowing you to easily customize it to illustrate and communicate the advantages of mastering your time. The Time Management Benefits infographic template offers a visually engaging platform to highlight the positive outcomes of efficient time management, including increased productivity, reduced stress, improved work-life balance, and more. Whether you're a professional, student, or anyone looking to make the most of their time, this template provides a user-friendly canvas to create informative presentations and educational materials. Optimize your time management skills with this SEO-optimized Time Management Benefits infographic template, thoughtfully designed for clarity and ease of use. Customize it to showcase specific benefits, time-saving techniques, tools, and strategies for effective time management, ensuring that your audience understands the value of this essential skill. Start crafting your personalized infographic today to reap the rewards of improved time management.


5 diapositivas
RAPID Decision-Making Model Presentation
The RAPID Decision-Making Model template simplifies complex decision processes, laying out steps from recommending to deciding in an easily digestible format. It's ideal for team leaders and managers who want to streamline decision-making. The template is designed for seamless use across PowerPoint, Keynote, and Google Slides, ensuring broad compatibility and user-friendly presentations.


5 diapositivas
Scaling Operations and Team Expansion Presentation
Illustrate your company’s growth journey with the Scaling Operations and Team Expansion Presentation. This dynamic layout uses a circular sequence to showcase five key phases of business scaling, from small teams to full-scale departments. Perfect for strategy sessions, investor updates, and team meetings. Fully editable in Canva, PowerPoint, Keynote, and Google Slides.


26 diapositivas
Water Pollution in the Pacific Presentation
Water Pollution in the Pacific refers to the contamination of water bodies in the Pacific Ocean, which can have severe consequences for marine life, ecosystems, and human health. This template is designed to raise awareness about the critical issue of water pollution in the Pacific Ocean. This template can effectively convey the urgency and significance of addressing water pollution in the Pacific Ocean. This serves as a powerful tool to educate and inspire individuals, organizations, and policymakers to take action and work towards sustainable solutions for the preservation of our precious marine ecosystems.


26 diapositivas
AIl for Social Good Presentation
Harness the power of technology for positive change with this inspiring presentation on AI for social good. Covering topics like ethical AI, humanitarian applications, sustainability, and global impact, this template helps showcase how artificial intelligence can drive meaningful progress. Fully customizable and compatible with PowerPoint, Keynote, and Google Slides for a seamless experience.


10 diapositivas
Lean Business Model Planning Presentation
Streamline your startup strategy with this Lean Canvas presentation template. Designed for entrepreneurs and agile teams, it breaks down your business plan into 9 essential blocks—from Problem and Solution to Revenue Streams and Cost Structure. Easy to edit in PowerPoint, Keynote, or Google Slides for fast, effective planning and pitch presentations.


6 diapositivas
Staff Integration and Onboarding Journey Presentation
Streamline your onboarding process with the Staff Integration and Onboarding Journey Presentation. This clean, step-by-step layout uses human icons to represent each phase of a new hire's journey—from orientation to full integration. Ideal for HR professionals, it’s fully editable in Canva, PowerPoint, Keynote, or Google Slides for easy customization.


5 diapositivas
Energy and Natural Resources Infographics
Energy and natural resources are essential components of modern societies and economies. These vertical infographics are designed to showcase key information about energy sources, natural resources, and their impact on the environment. This template is ideal for educational purposes, awareness campaigns, environmental organizations, and companies in the energy sector. The visuals display the different types of renewable energy, such as solar, wind, hydro, geothermal, and biomass, along with their benefits and growth potential. This is fully customizable and compatible with Powerpoint, Keynote, and Google Slides.


3 diapositivas
Break Even Financial Model Presentation
Bring your financial story to life with this sleek and professional presentation design. Ideal for illustrating profit margins, cost recovery, or growth potential, it helps visualize when investments start to pay off. Fully customizable and compatible with PowerPoint, Keynote, and Google Slides for effortless editing and impactful presentations.


8 diapositivas
Modern Pricing Table Design Presentation
Turn heads and highlight value with this sleek, modern layout that makes pricing clear and compelling. Perfect for showcasing service tiers or subscription plans, this clean design uses bold icons and structured comparisons to guide decisions. Fully compatible with PowerPoint, Keynote, and Google Slides for easy customization and professional pricing presentations.