


Características


¿Tienes alguna pregunta?
Recomendar


8 diapositivas
Value Chain Optimization and Analysis Presentation
Streamline Your Business for Maximum Efficiency with this Value Chain Optimization and Analysis presentation template. This visually engaging template is designed to map, analyze, and enhance the key activities in your value chain, helping businesses identify opportunities for cost reduction, performance improvements, and strategic advantages. Featuring a clean flowchart layout, intuitive color-coded sections, and editable placeholders, this template is ideal for business analysts, consultants, and executives. Fully compatible with PowerPoint, Keynote, and Google Slides, ensuring seamless customization and professional delivery.


6 diapositivas
Next-Gen Wireless Solutions Overview Presentation
Give your wireless solutions pitch a sleek, professional edge with this futuristic globe-style layout. Perfect for tech-driven topics, this infographic highlights six key areas in a clear, visually engaging format. Fully customizable and easy to use in PowerPoint, Keynote, and Google Slides—ideal for product overviews, innovation briefings, or strategy updates.


6 diapositivas
Create Challenge Infographic
Challenges are obstacles, difficulties, or problems that individuals, organizations, or societies face while trying to achieve their goals or navigate through various situations. This infographic template involves visually presenting a specific challenge, its context, and possible solutions in an informative way. Summarize the key takeaways from the infographic, emphasizing the importance of addressing the challenge and implementing the suggested solutions. An effective challenge infographic can be used for educational purposes, presentations, or as a reference guide to help individuals and teams overcome challenges in a structured and informed manner.


4 diapositivas
Social Campaign Planning Presentation
Bring clarity to your outreach goals with a bold, funnel-style layout that makes every campaign step easy to visualize. This presentation helps you outline stages, objectives, and audience actions in a clean, structured format ideal for marketing teams. Fully editable and compatible with PowerPoint, Keynote, and Google Slides.


4 diapositivas
Workforce Skills Gap Analysis
Spot the gap. Bridge the skills. This Workforce Skills Gap Analysis slide helps visualize the journey from your team’s current capabilities to their desired performance level, with a clear action plan in between. Fully editable and works seamlessly in PowerPoint, Keynote, and Google Slides.


4 diapositivas
Green Business and Climate Goals Presentation
Bring your sustainability message to life with a fresh and vibrant layout that guides viewers through key milestones. This template helps communicate eco-friendly initiatives and climate strategies in a simple timeline format. Ideal for showcasing goals, progress, and impact. Fully compatible with PowerPoint, Keynote, and Google Slides for easy editing.


8 diapositivas
Product Development and Market Growth Presentation
Discover the dynamics of 'Product Development and Market Growth' with this versatile presentation template. Designed for business analysts and product managers, it visualizes key stages of product evolution and market expansion. Ideal for presentations on business growth strategies, compatible with all major presentation platforms.


22 diapositivas
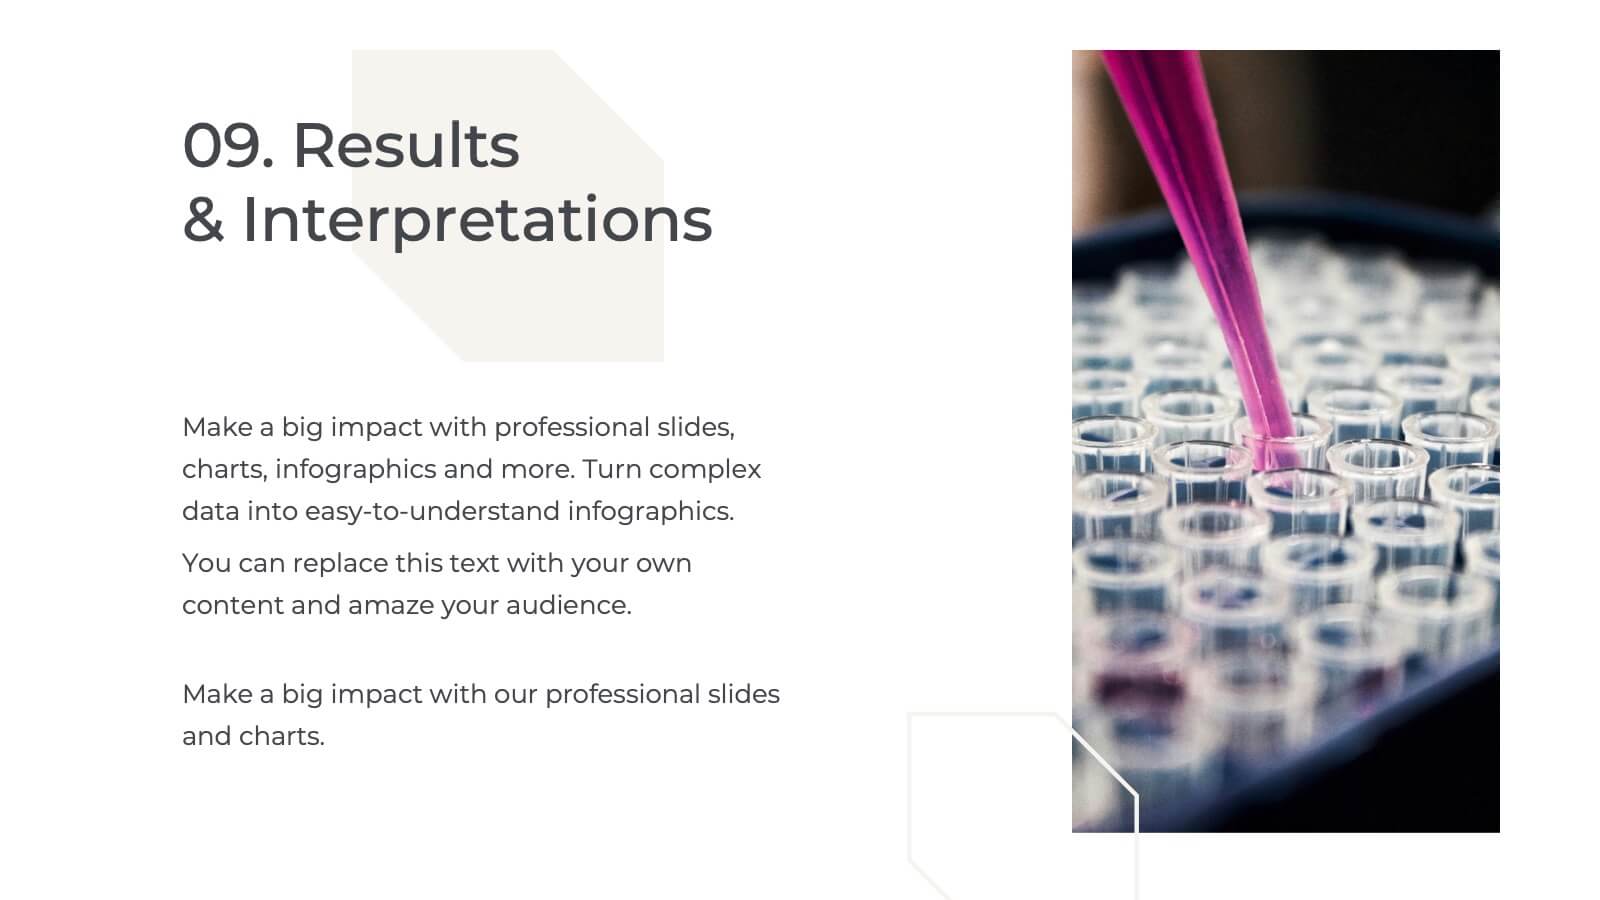
Vivid Market Research Presentation
Unveil the insights that drive decisions with the Vivid Market Research Presentation template! This sleek and professional template is crafted to help you present complex data in an engaging and easy-to-understand format. Whether you're analyzing market trends, exploring customer behavior, or evaluating competitive landscapes, this template provides a clear structure to convey your findings. It includes sections for research objectives, methodologies, key findings, and recommendations, ensuring you cover every aspect of your market research comprehensively. With a clean design that emphasizes clarity and visual appeal, your audience will stay focused and intrigued throughout the presentation. Perfect for business analysts, marketers, and researchers, the Vivid template is fully customizable and works seamlessly with PowerPoint, Keynote, and Google Slides. Elevate your market research presentations and make your data come to life with Vivid!


6 diapositivas
Product Development Lifecycle Presentation
Visualize each stage of your product’s journey with this sleek infinity loop diagram template. Perfect for outlining development processes, continuous improvement cycles, or iterative workflows. Fully editable in Canva, PowerPoint, and Google Slides, it delivers a clear, modern design to communicate lifecycle stages with impact and professional appeal.

22 diapositivas
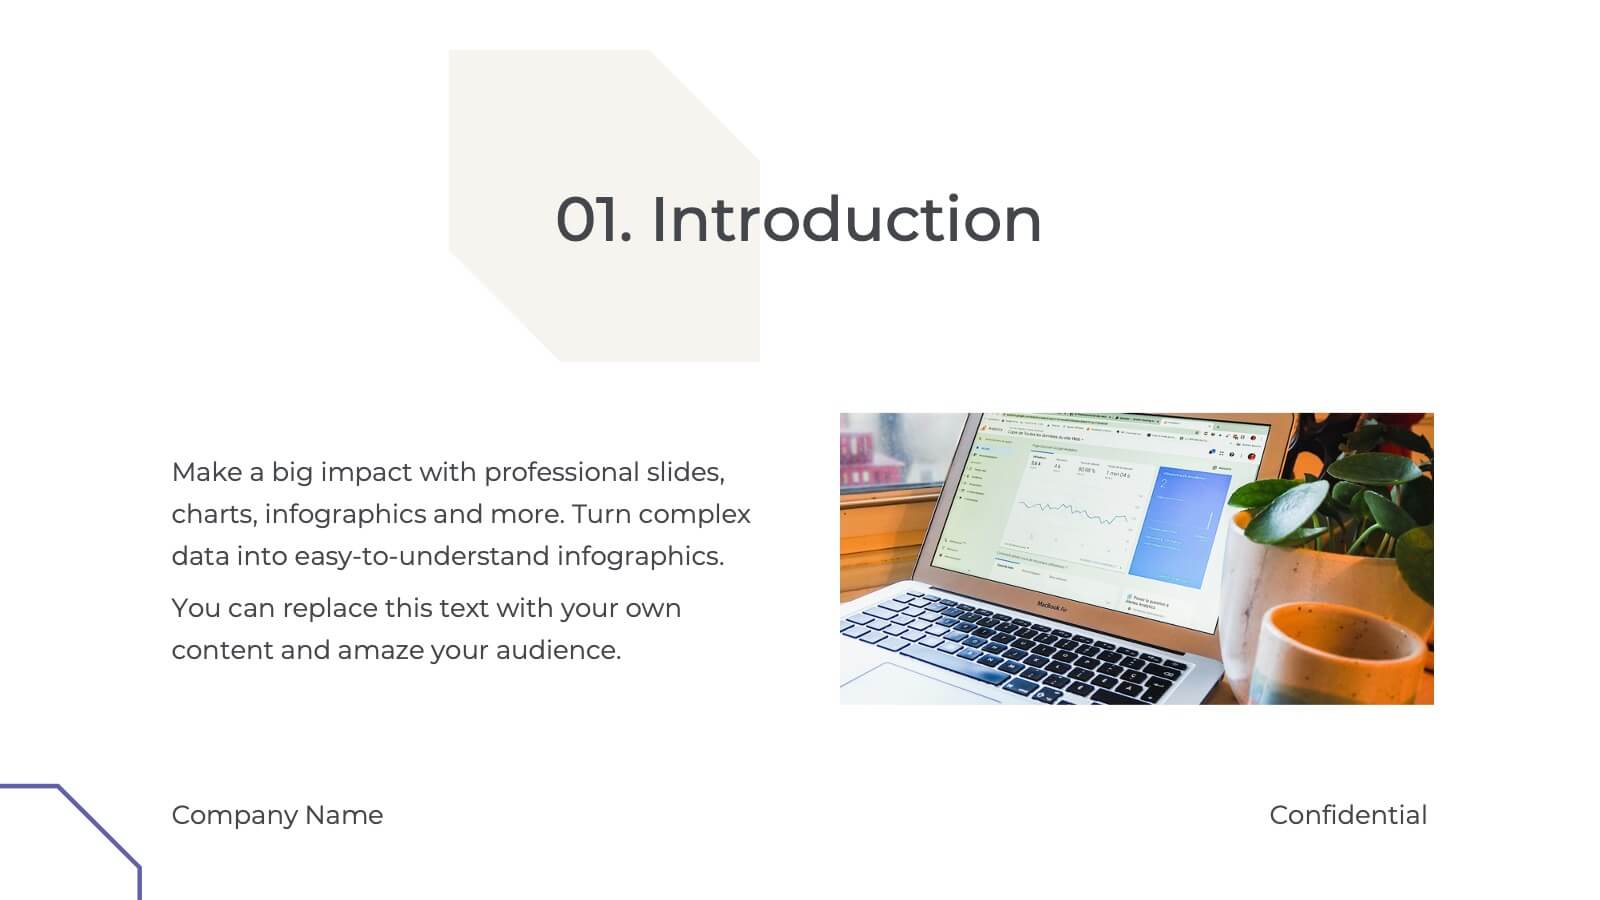
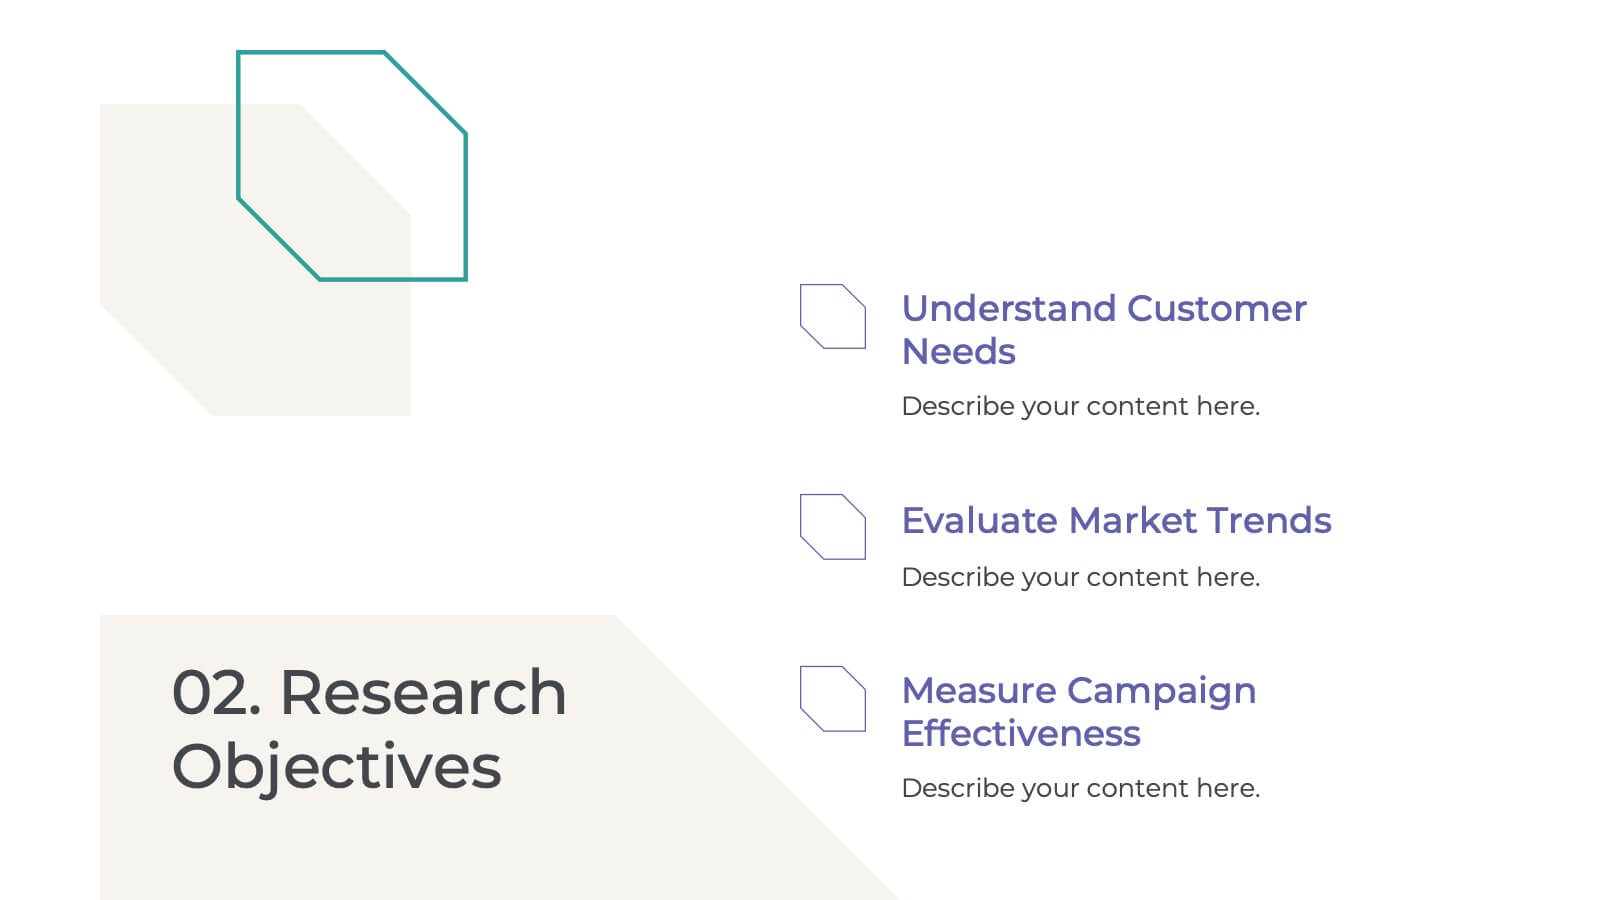
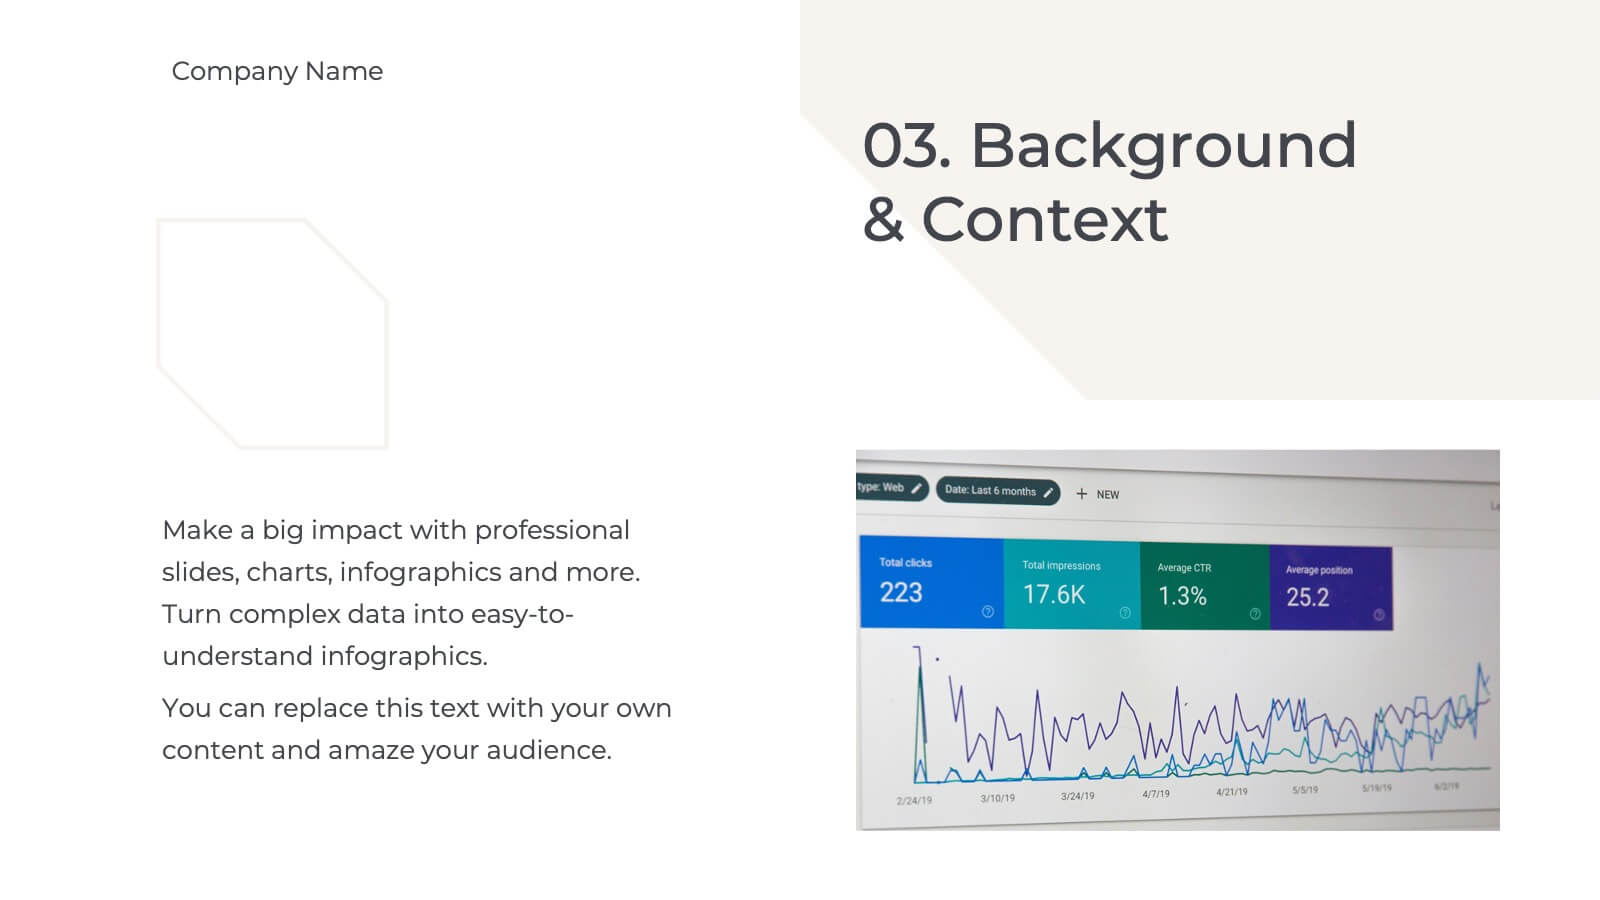
Palladium Qualitative Research Findings Presentation
Present your qualitative research findings effectively with this sleek, professional template. It includes sections for objectives, data analysis, key findings, and recommendations. Ideal for organizing research insights clearly, it's customizable and compatible with PowerPoint, Keynote, and Google Slides, ensuring smooth collaboration and impactful presentations for your audience.


4 diapositivas
Task Management Checklist Presentation
Stay organized and boost productivity with the Task Management Checklist template. This structured design helps you categorize tasks into Do’s and Don’ts, ensuring a clear workflow for efficient task execution. Fully editable and compatible with PowerPoint, Keynote, and Google Slides, making it perfect for teams and professionals alike.


4 diapositivas
Collaborative Team Workflow Presentation
Visualize seamless collaboration with the Collaborative Team Workflow Presentation. This slide design features team icons, branching layouts, and a clean structure to showcase group dynamics and process flow. Perfect for teamwork strategies, HR initiatives, or cross-functional planning. Fully editable in PowerPoint, Keynote, and Google Slides for tailored communication.


2 diapositivas
Creative Business Presentation
Showcase your ideas with energy and style using this bold, contemporary presentation layout. Featuring dynamic visuals and clean typography, this template is ideal for business proposals, portfolios, and startup pitches. Easily customizable in PowerPoint, Keynote, and Google Slides to suit your brand's identity.


6 diapositivas
School Goals and Administration Presentation
Visualize key academic priorities with this notebook-style layout, perfect for school administrators and teachers. Featuring colorful pushpin markers and a two-page spread, this template is great for outlining goals, responsibilities, or class guidelines. Fully editable in PowerPoint, Keynote, and Google Slides for customized, classroom-ready presentations.


5 diapositivas
Easy Dinner Recipes Infographics
Easy Dinner Recipes offer a practical solution for busy individuals or those who are new to cooking. These infographic templates offer a practical resource for meal planning and preparation. Its visually appealing design, clear instructions, and organized layout make it easy to follow and implement. Whether for personal use or as a presentation tool in cooking classes this template simplifies the process of discovering and trying out delicious dinner recipes. Use these to provide a collection of quick and delicious dinner recipes. This is designed to make meal planning easier, providing step-by-step instructions, ingredient lists, and visuals.


5 diapositivas
Freight and Shipping Optimization Presentation
Streamline your logistics narrative with this world map–inspired layout designed for international freight strategies. This infographic-style slide features four customizable location markers with icons and descriptive text, perfect for mapping routes, warehouses, or shipping hubs. Ideal for global supply chain teams, logistics consultants, and shipping analysts. Fully editable in PowerPoint, Keynote, and Google Slides.


5 diapositivas
Porter's Five Forces Competitive Analysis Presentation
Illustrate market dynamics and industry competitiveness using Porter’s Five Forces. This template covers New Entrants, Buyer Power, Supplier Power, Substitutes, and Customer Power in a clean, letter-coded format. Fully editable in PowerPoint, Keynote, and Google Slides, it's perfect for strategic analysis and investor presentations. Clear, structured, and easy to customize.