


Características


¿Tienes alguna pregunta?
Recomendar


6 diapositivas
Digital Education and E-Learning Trends Presentation
Present modern educational insights with clarity using this well-structured slide focused on digital learning trends. Featuring an icon-based circular layout around a graduate figure and six editable titles, it's ideal for showcasing online learning strategies, tech tools, and training programs. Designed to keep your content concise and visually engaging, this layout is perfect for educators, institutions, and e-learning professionals. Fully customizable in PowerPoint, Keynote, and Google Slides.


6 diapositivas
IT Architecture System Infographic
IT architecture, referred to as information technology architecture, is a structured framework that defines how an organization's technology systems, applications, processes, and data interact and work together to support its business goals and objectives. This infographic template visually explains the components and structure of an IT architecture system within an organization. The visuals are included to simplify your technical concepts and guide your viewers through the intricacies of IT. This infographic can be customized to fit the specific needs of different organizations. Compatible with Powerpoint, Keynote, and Google Slides.


7 diapositivas
Stakeholder Strategy Infographic
Empower your organization's approach to its stakeholders with our stakeholder strategy infographic. Colored in a mix of vibrant orange, crisp white, and bold red, this infographic not only informs but also captures attention. Ideal for business strategists, project managers, and team leaders, it visually dissects the intricate layers of stakeholder engagement and strategy. Its design includes specialized graphics, tailored icons, and strategic image placeholders to guide your storytelling. Whether you're presenting in PowerPoint, Keynote, or Google Slides, this template is your key to a well-orchestrated stakeholder communication.


7 diapositivas
Personal Roadmap Infographic
A personal roadmap infographic is a visual representation of an individual's goals, plans, achievements, and milestones over a specific period. Embark on a transformative journey through your life with our personal roadmap infographic template. This is a grand adventure, and this visually engaging template is your map to navigate it with purpose and direction. This template is a graphical and often chronological display that helps an individual outline and track their personal development, progress, and objectives. This infographic is fully customizable and compatible with Powerpoint, Keynote, and Google Slides.


6 diapositivas
Top Priorities Business List Presentation
Streamline your workflow with this structured priorities list template. Designed for business professionals, it visually organizes key tasks, helping teams focus on top objectives efficiently. With a clean and modern design, it's ideal for strategic planning, productivity tracking, and project management. Fully compatible with PowerPoint, Keynote, and Google Slides.


19 diapositivas
Eclipse Detailed Project Execution Plan Presentation
Get ready to wow your audience with this mesmerizing project plan template! With its captivating eclipse design, every slide exudes professionalism and creativity. Perfect for showcasing project objectives, timelines, and deliverables, this template will keep your viewers engaged from start to finish. Compatible with PowerPoint, Keynote, and Google Slides!


7 diapositivas
Important Stats and Metrics by Numbers Presentation
Display key metrics with impact using this modern numeric infographic layout. Ideal for summarizing performance statistics, benchmarks, or data highlights across six categories. The circular markers and bold percentages enhance readability and focus. Fully editable in Canva—perfect for business reviews, investor decks, or analytical presentations that demand clarity.


4 diapositivas
End Slide with Strategic Reflection Presentation
Wrap up your presentation with purpose using the End Slide with Strategic Reflection Presentation. Designed to highlight final insights, priorities, or key outcomes, this template features a visual pyramid layout ideal for summarizing growth, goals, or performance tiers. Fully editable in Canva, PowerPoint, and Google Slides for easy customization.


5 diapositivas
Business Strategy Briefcase Presentation
Unlock the potential of strategic planning with our "Business Strategy Infographic" template! This design cleverly uses suitcase icons to represent different aspects of your strategy, making it perfect for executives and teams who aim to present their business insights and objectives clearly and engagingly. Each segment of the suitcase aligns key data points with your strategic goals, offering a visual roadmap to success. Compatible with PowerPoint, Keynote, and Google Slides, this template is a powerful tool for conveying complex business strategies in a straightforward, visually appealing manner.


6 diapositivas
Modern Agriculture Industry Trends
Highlight key data and insights with this visually engaging agriculture-themed slide. Designed with circular data visuals and crop illustrations, it's perfect for showcasing percentages, trends, or growth stats in modern farming, agri-tech, and sustainability initiatives. Fully editable in PowerPoint, Keynote, and Google Slides.

21 diapositivas
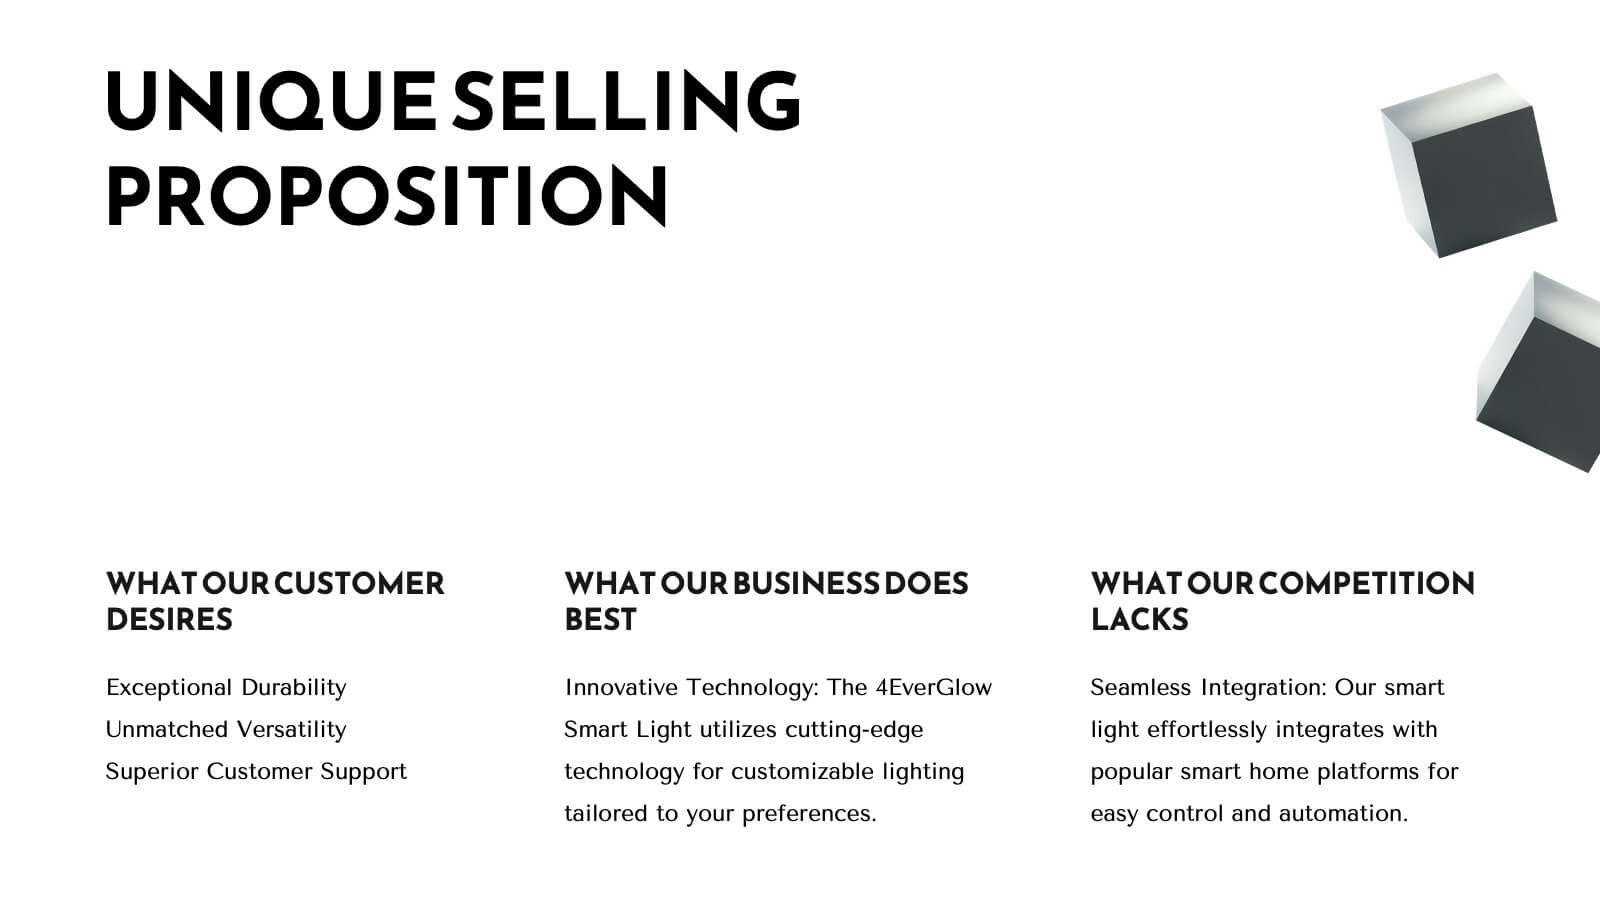
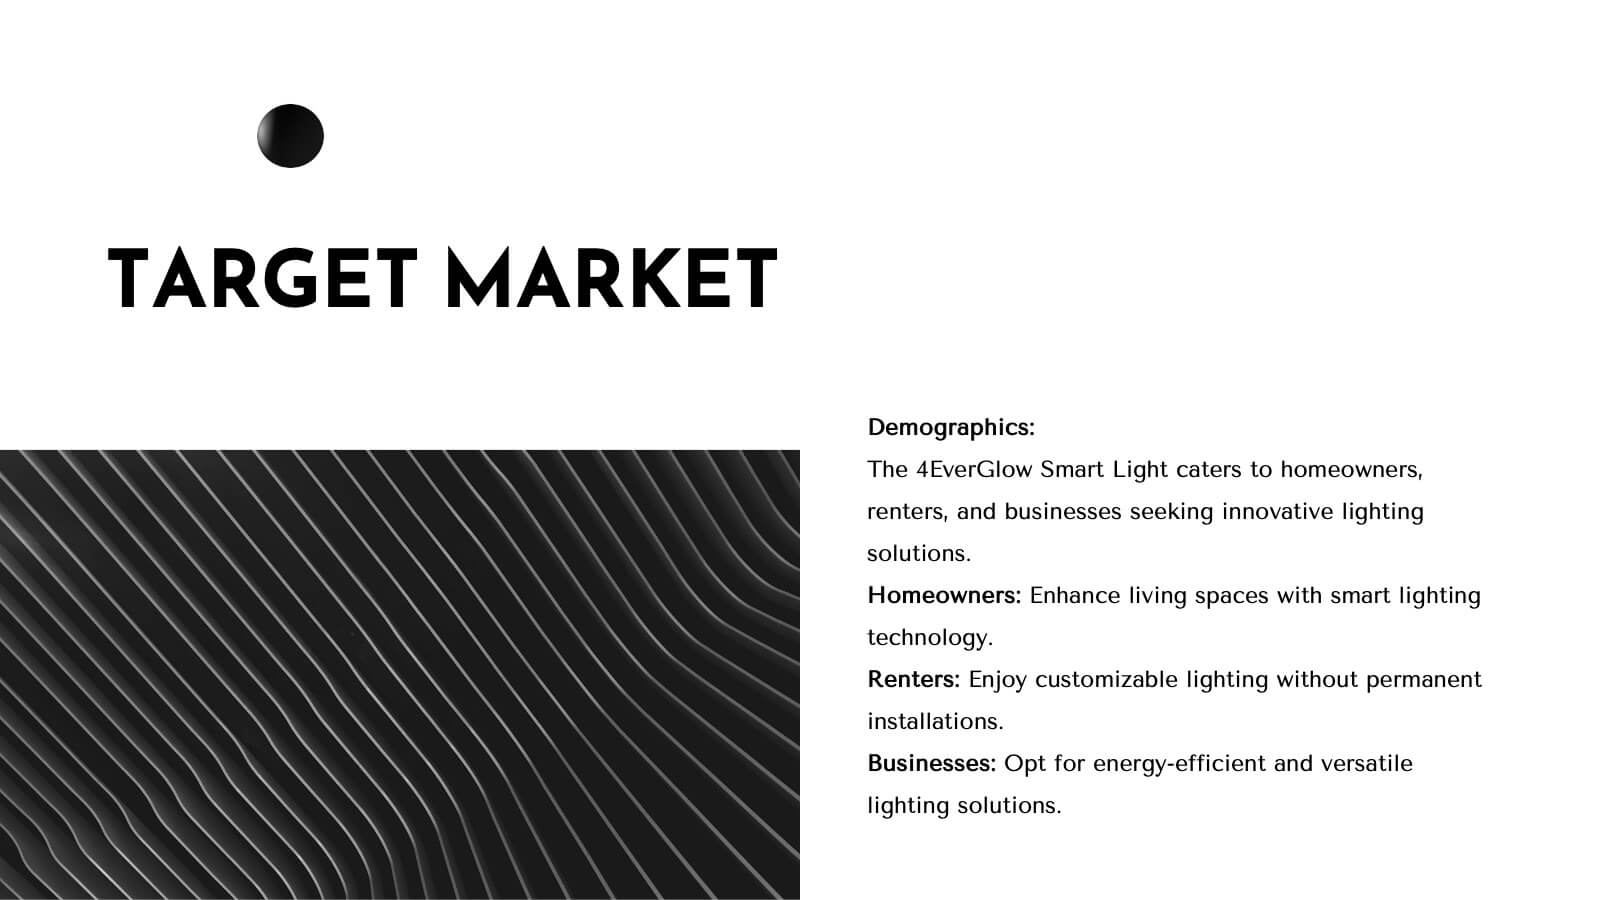
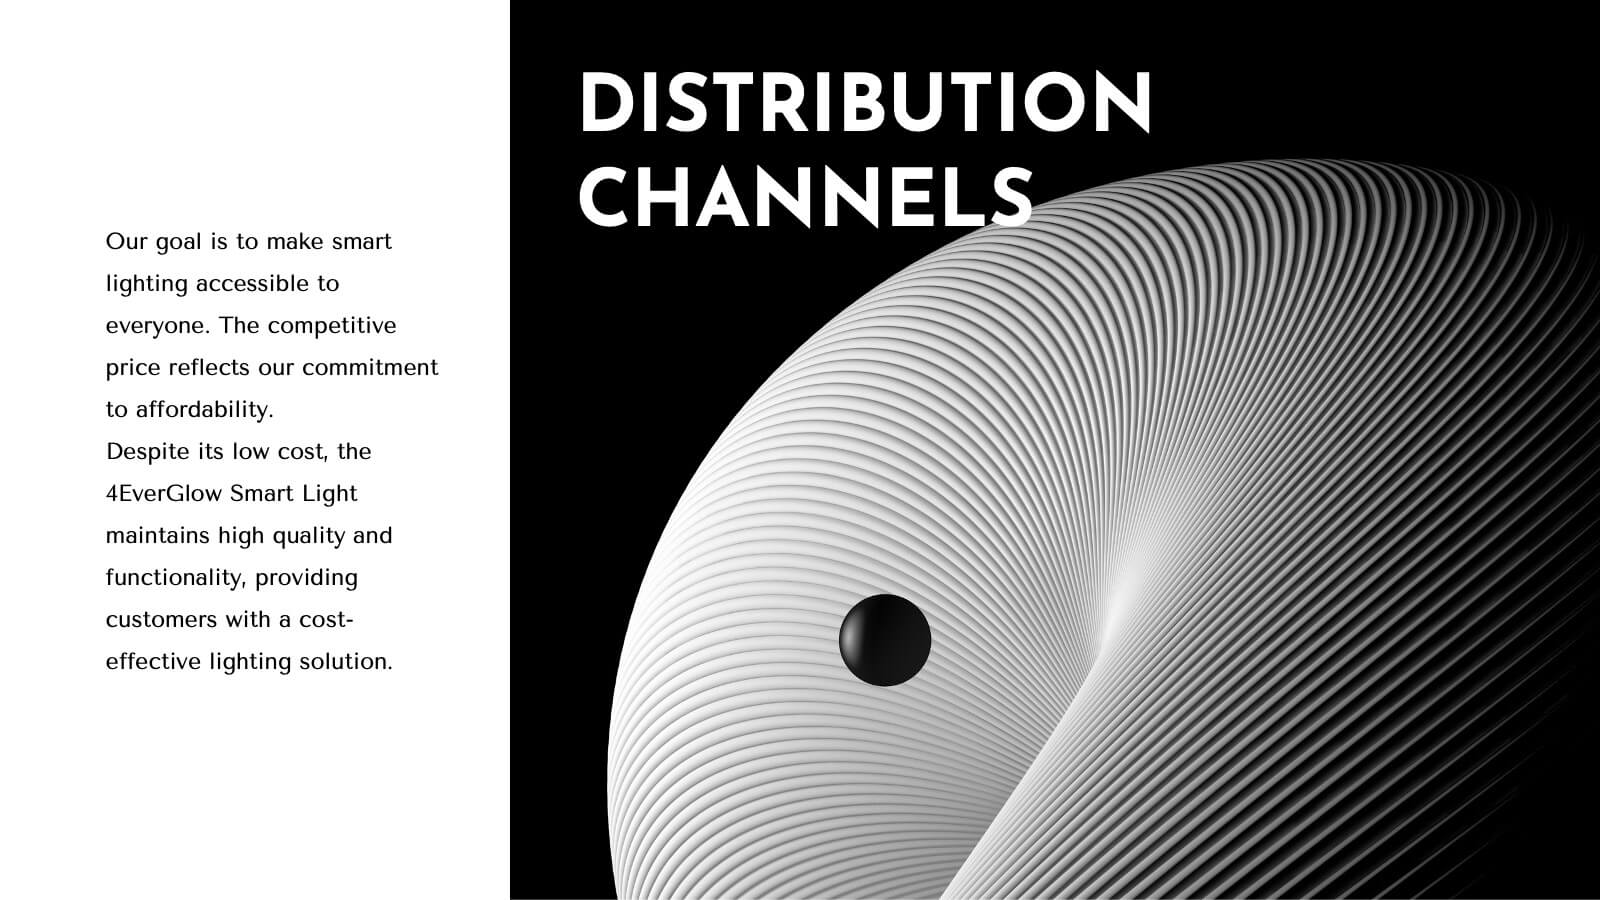
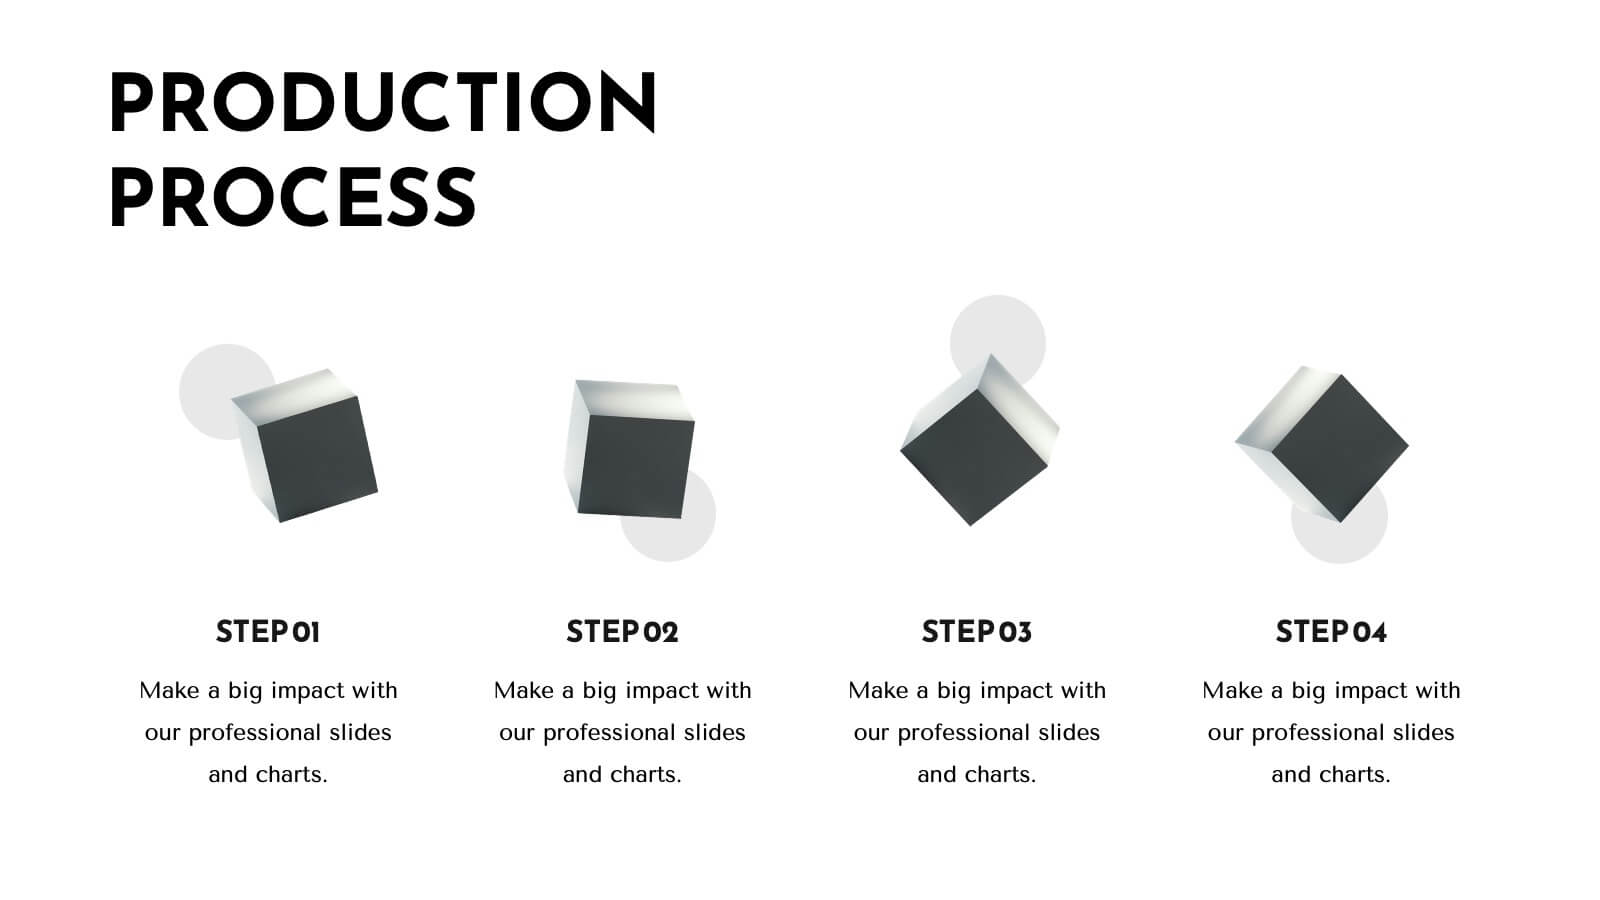
Trident Product Development Plan Presentation
Present your product development strategy with this sleek, professional template! Highlight company overview, product features, and unique selling proposition. Ideal for showcasing market analysis, pricing strategy, and production process. Perfect for developers and project managers. Compatible with PowerPoint, Keynote, and Google Slides.


26 diapositivas
Modern Company Profile Striped Presentation
Present your company with style, our modern company profile presentation, is the perfect template to showcase your business in a contemporary and stylish way. This template combines professionalism with a touch of flair and striped elements, making it ideal for modern businesses looking to make a lasting impression. Ideal for tech startups, creative agencies, or a professional service firms, this presentation will help you convey your company's professionalism. Fully customizable and compatible with Powerpoint, Keynote, and Google Slides. This makes it easy for potential clients, partners, and investors to reach out!


21 diapositivas
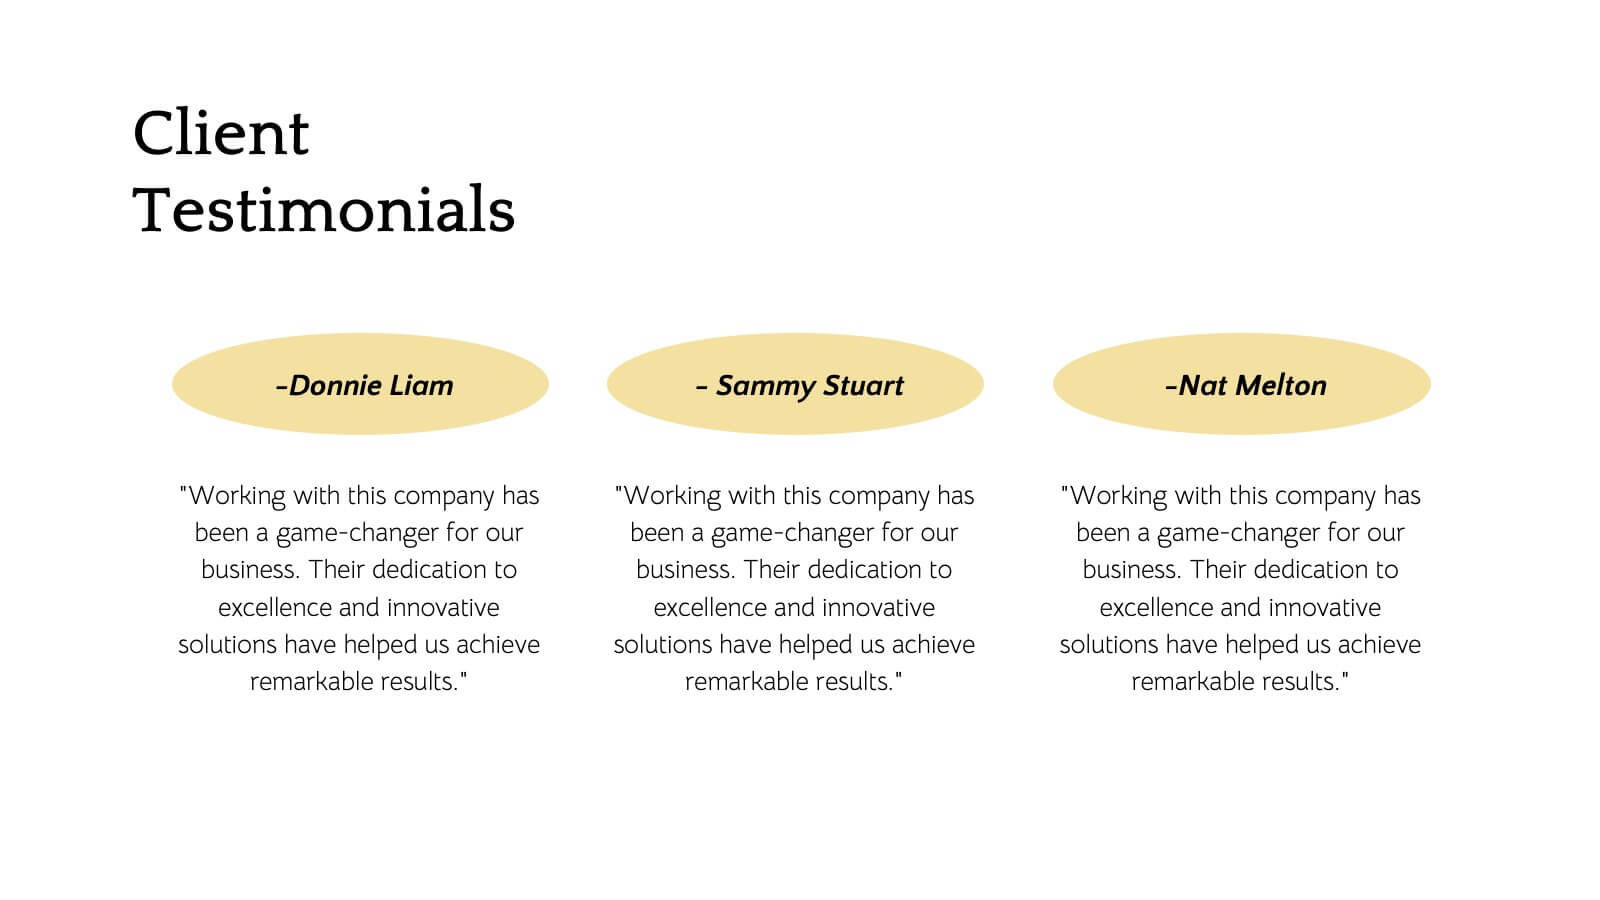
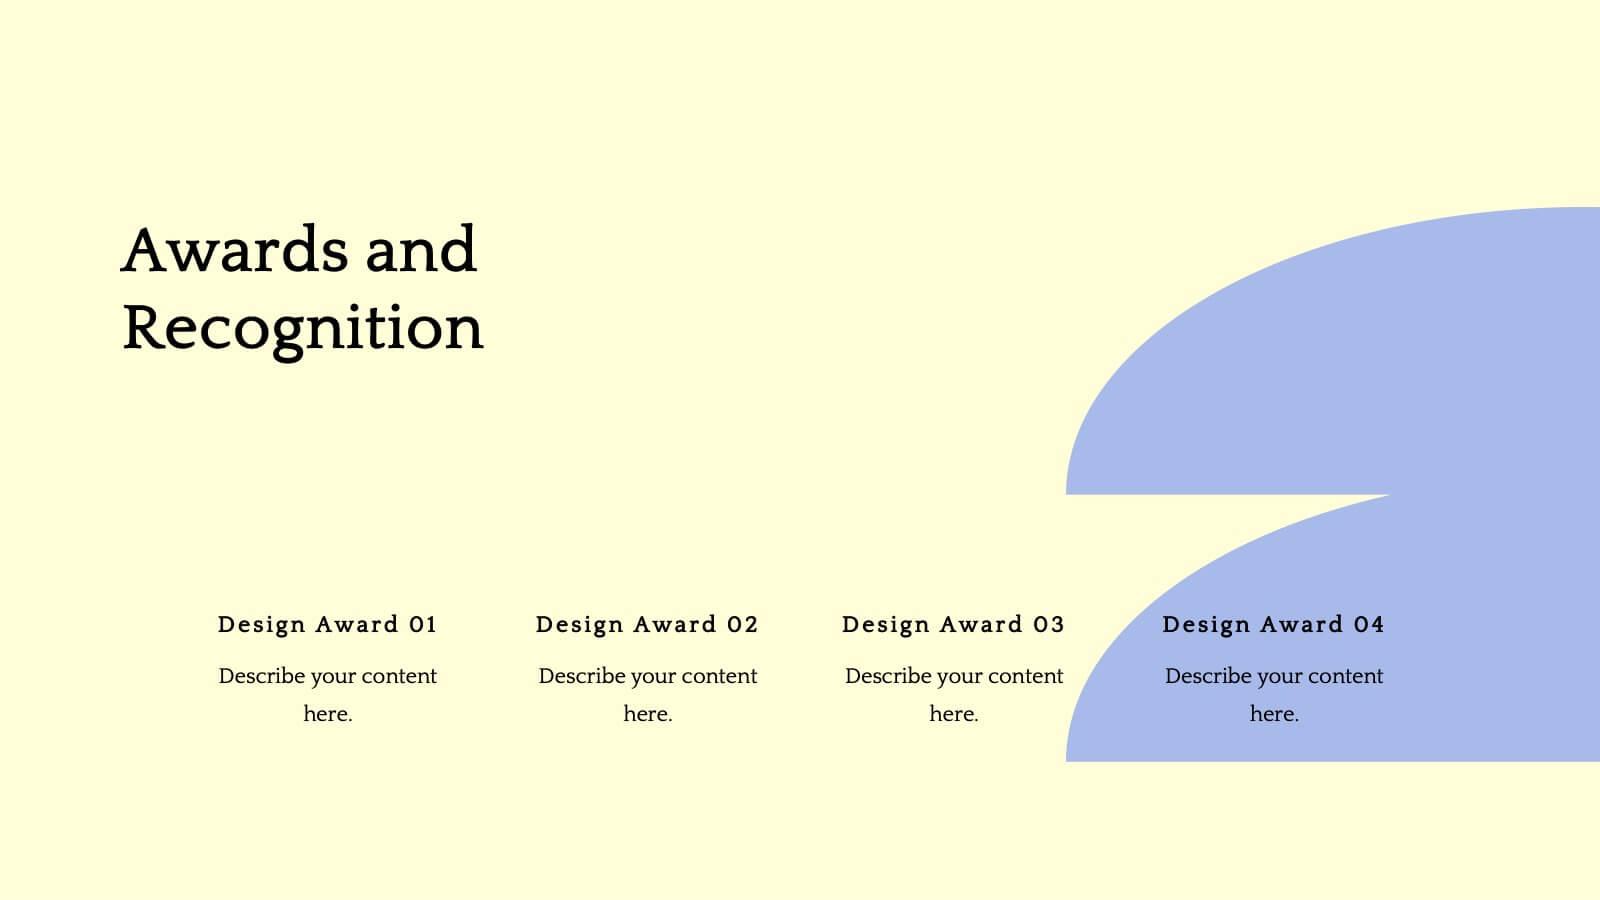
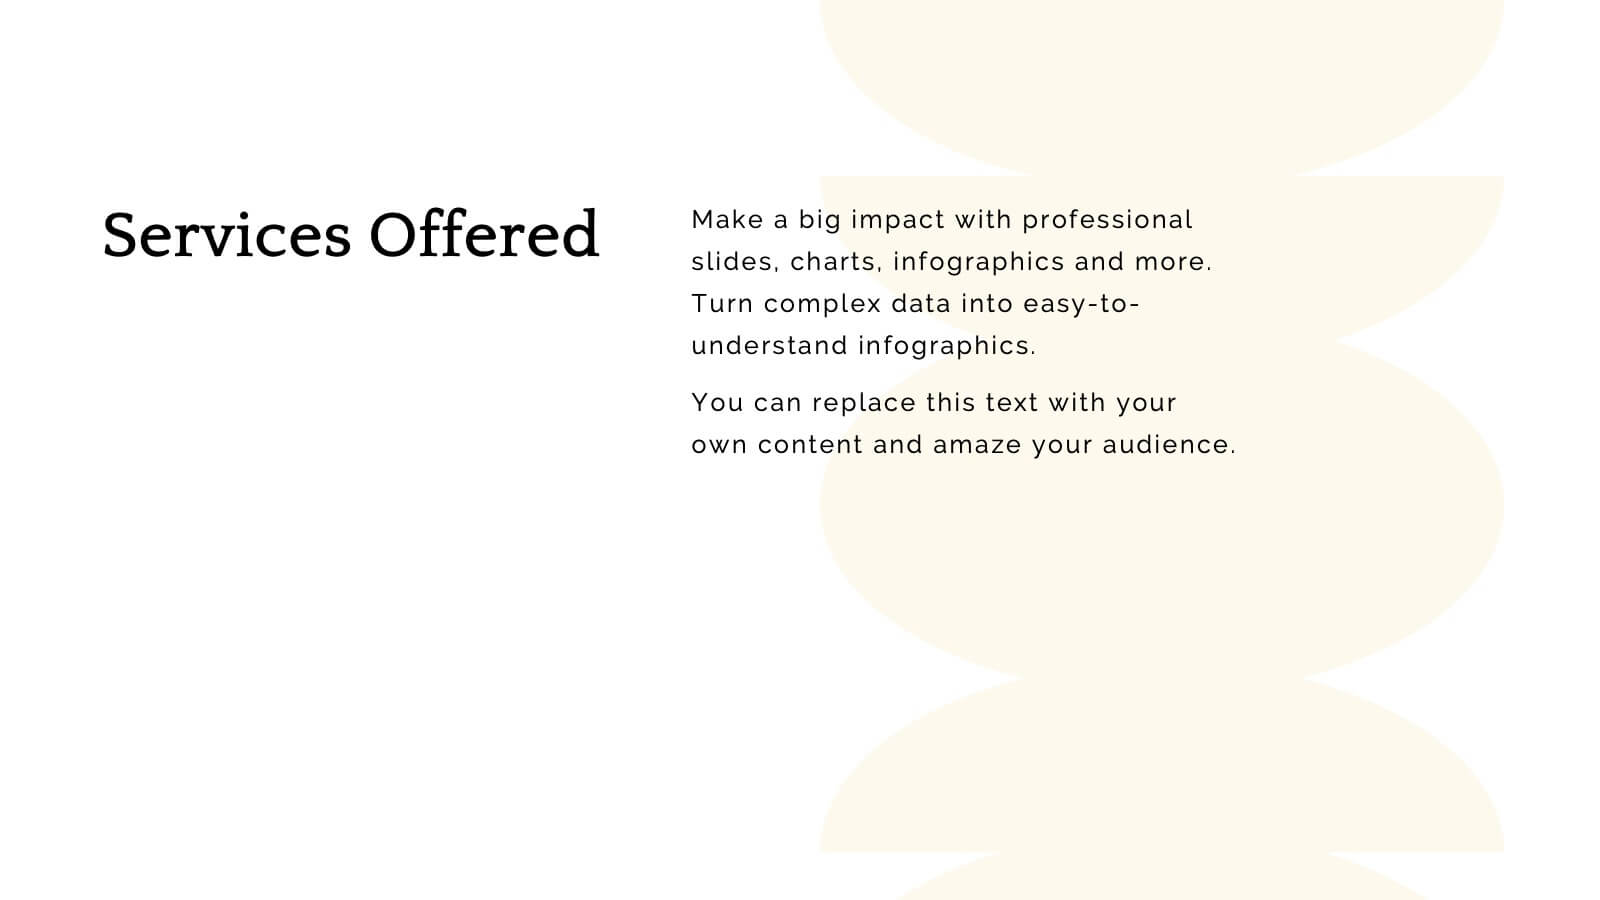
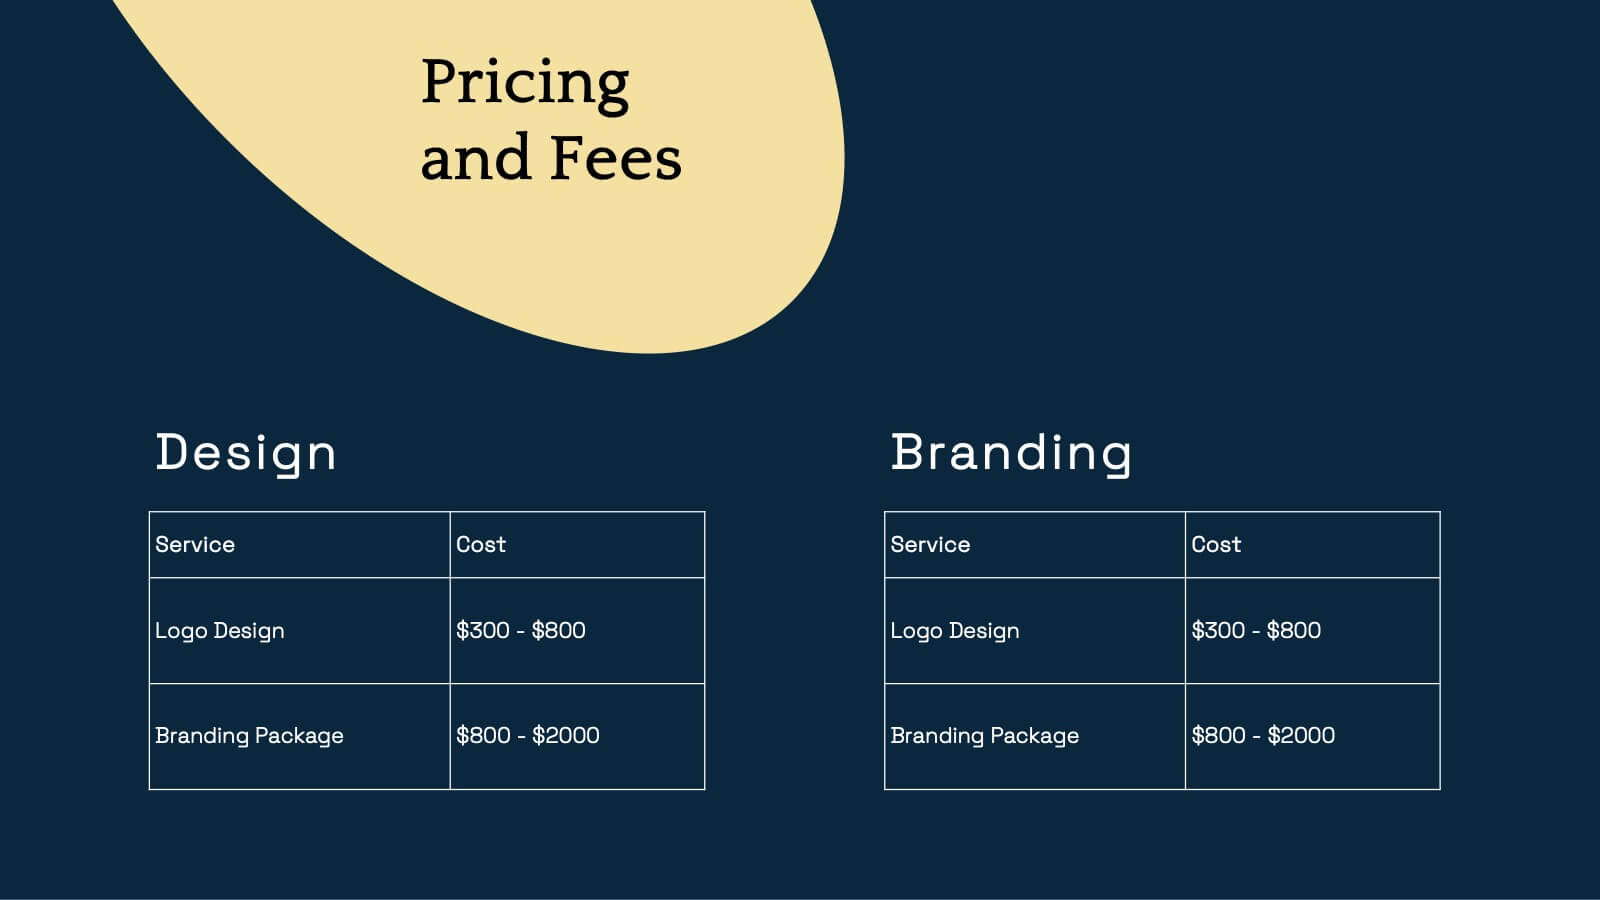
Somnara Full-Service Agency Project Plan Presentation
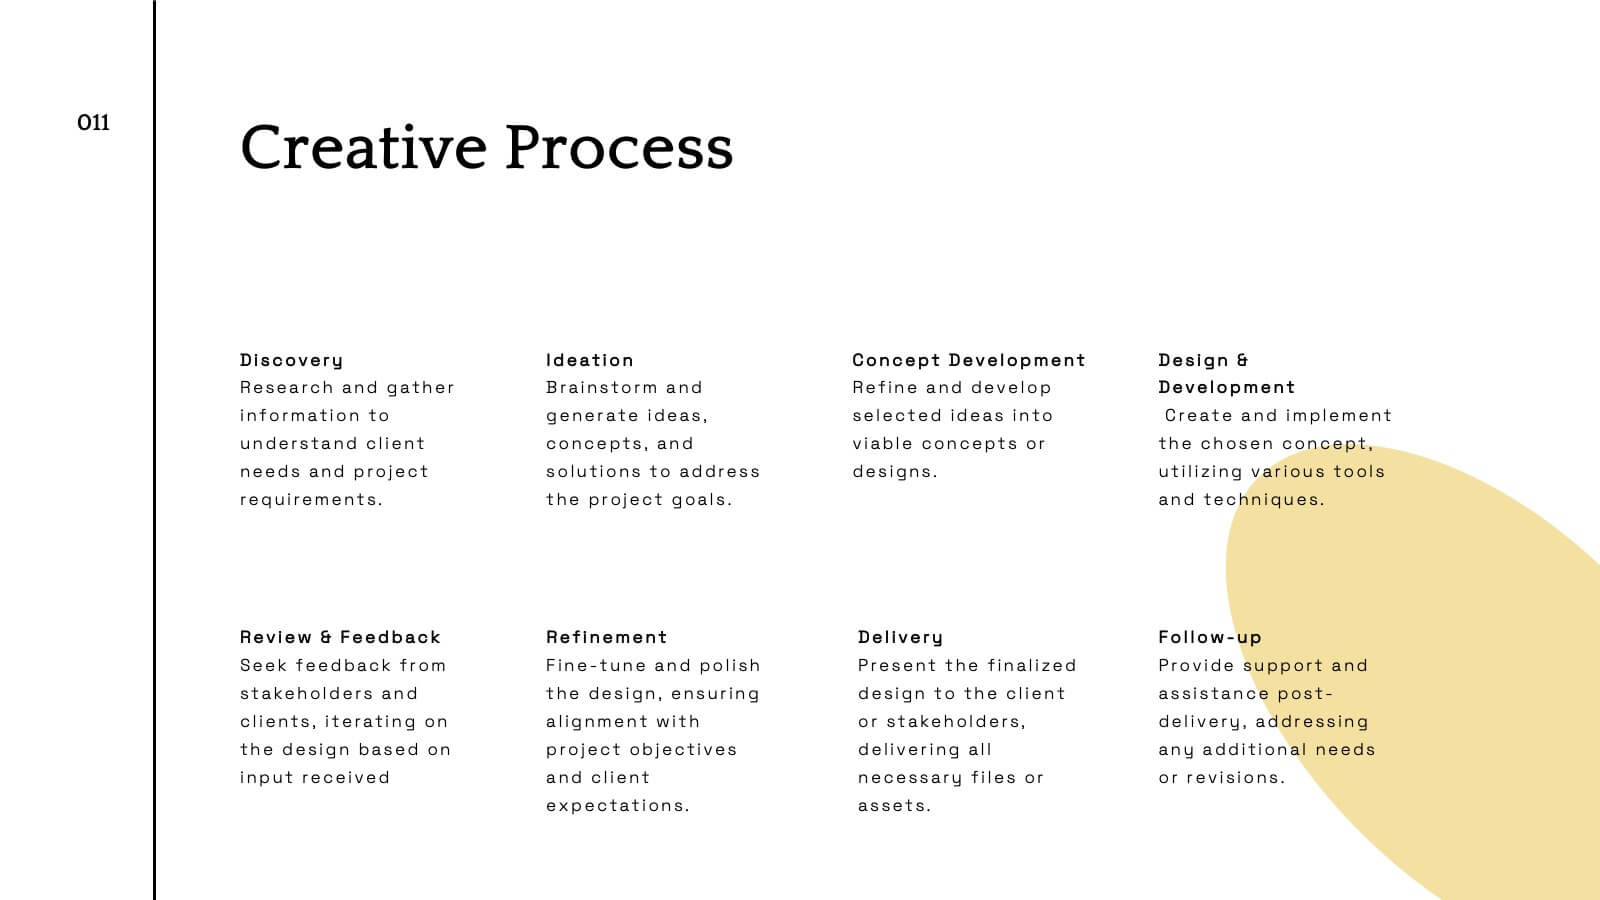
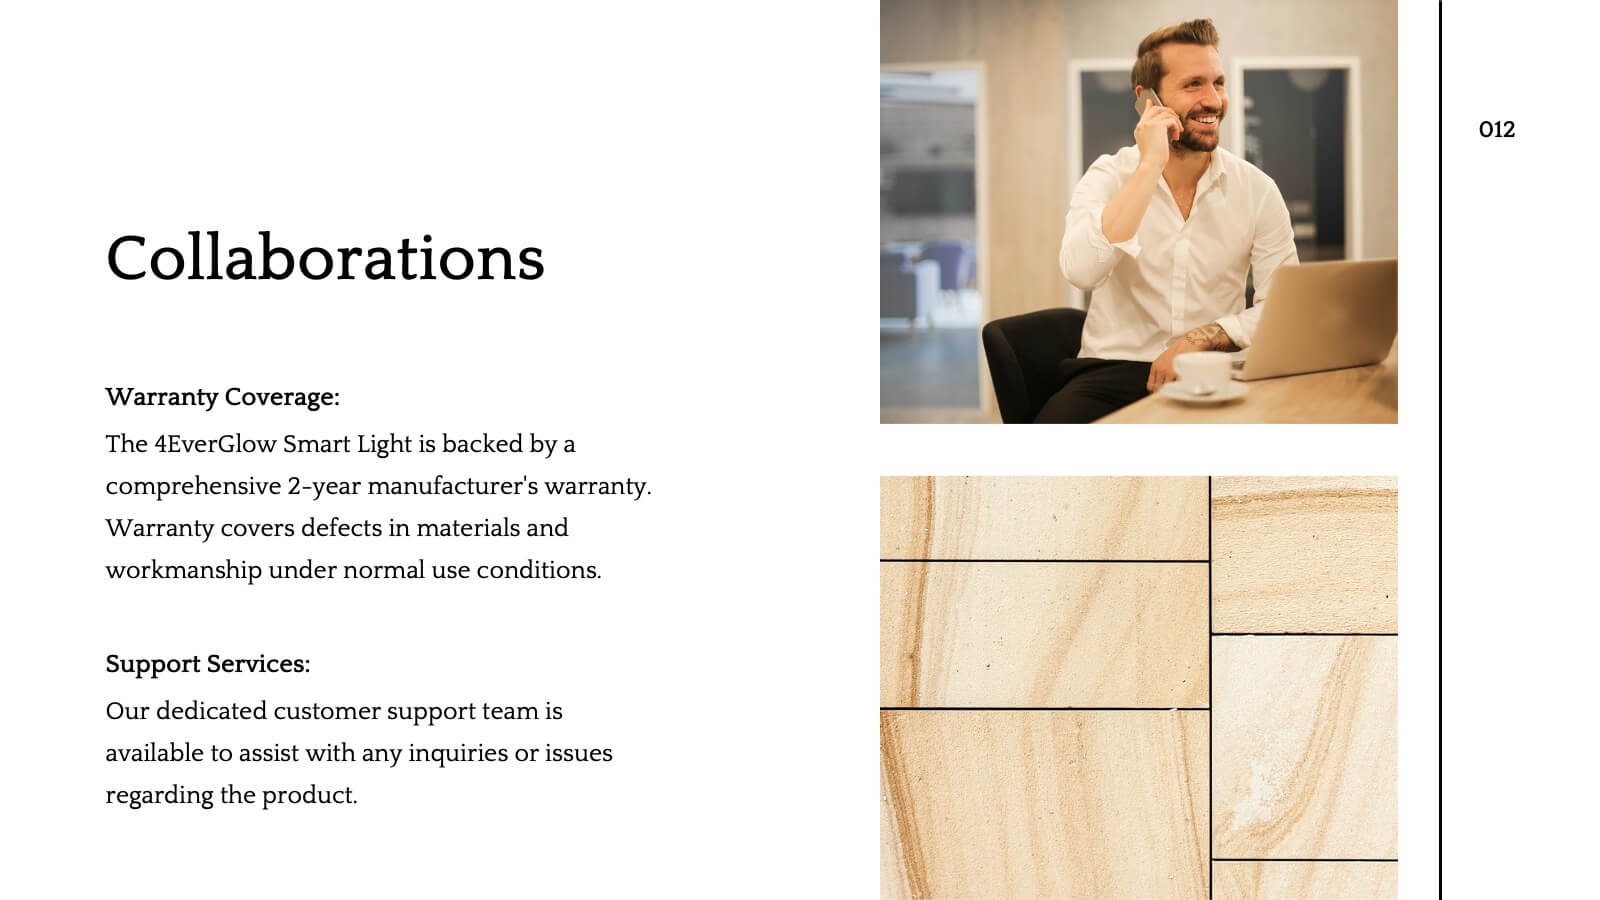
Present your agency’s expertise with a comprehensive project plan template designed to impress clients and stakeholders. This sleek and professional layout allows you to outline your mission and vision, highlight team strengths, and showcase core services with clarity. Use the client testimonials and case studies sections to establish credibility and trust. Visualize your strategic approach with dedicated slides for market analysis, creative process, and execution strategy. The template also includes detailed sections for partnership opportunities, social responsibility initiatives, and a future outlook, ensuring a holistic view of your agency’s capabilities and forward-thinking approach. Fully editable and compatible with PowerPoint, Google Slides, and Keynote, this template is perfect for full-service agencies seeking to elevate their presentations. Customize each slide to reflect your unique value and deliver impactful, results-oriented proposals.
21 diapositivas
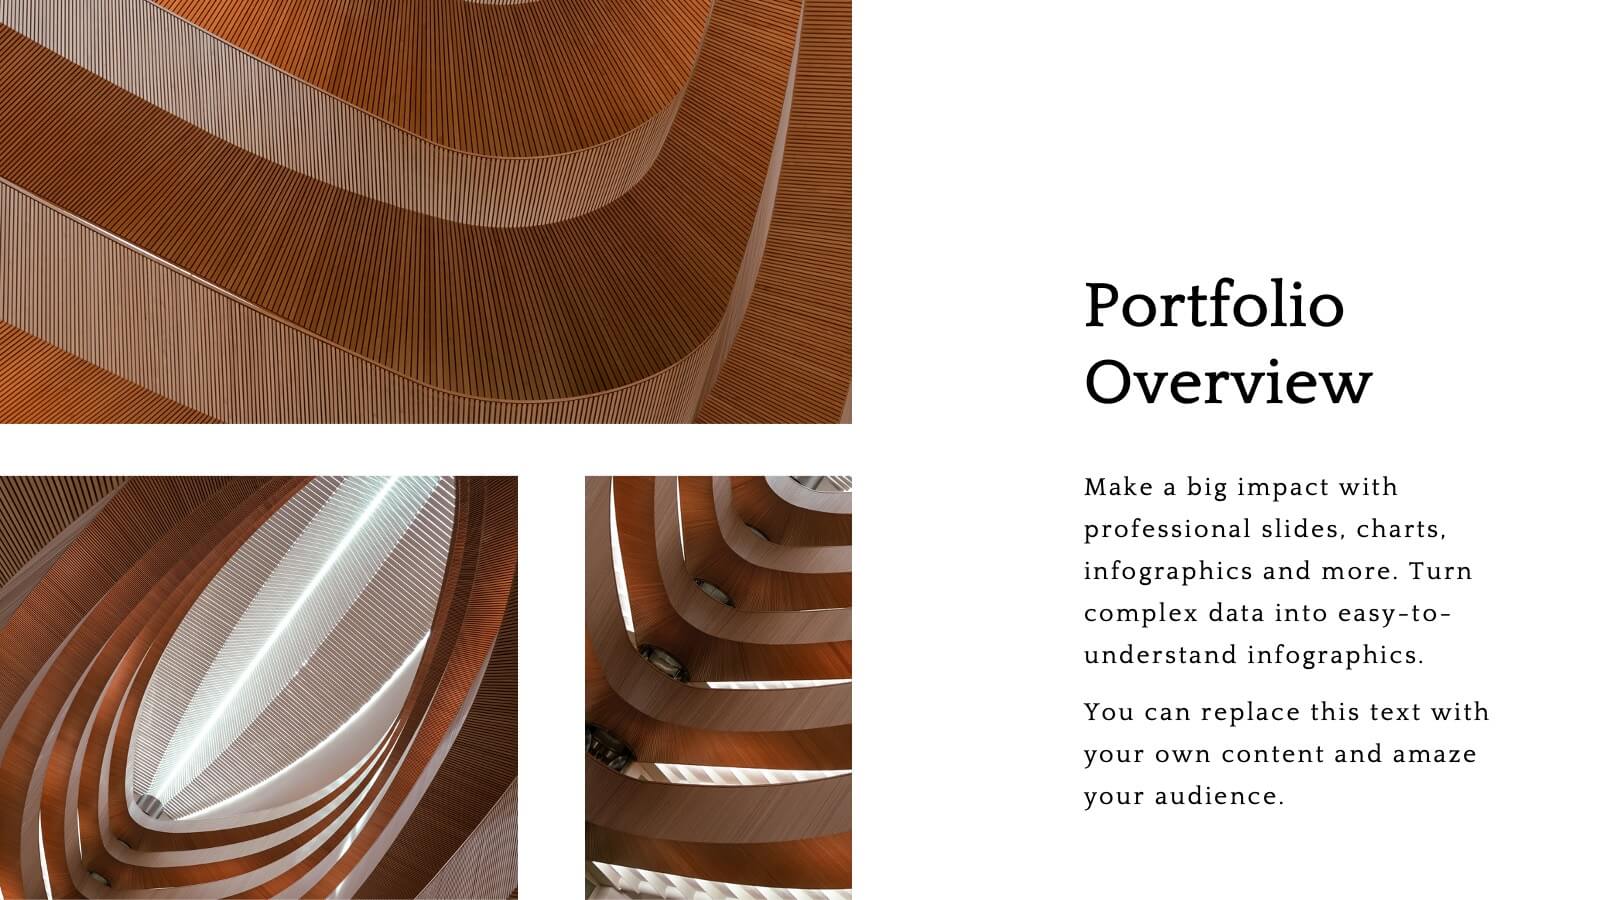
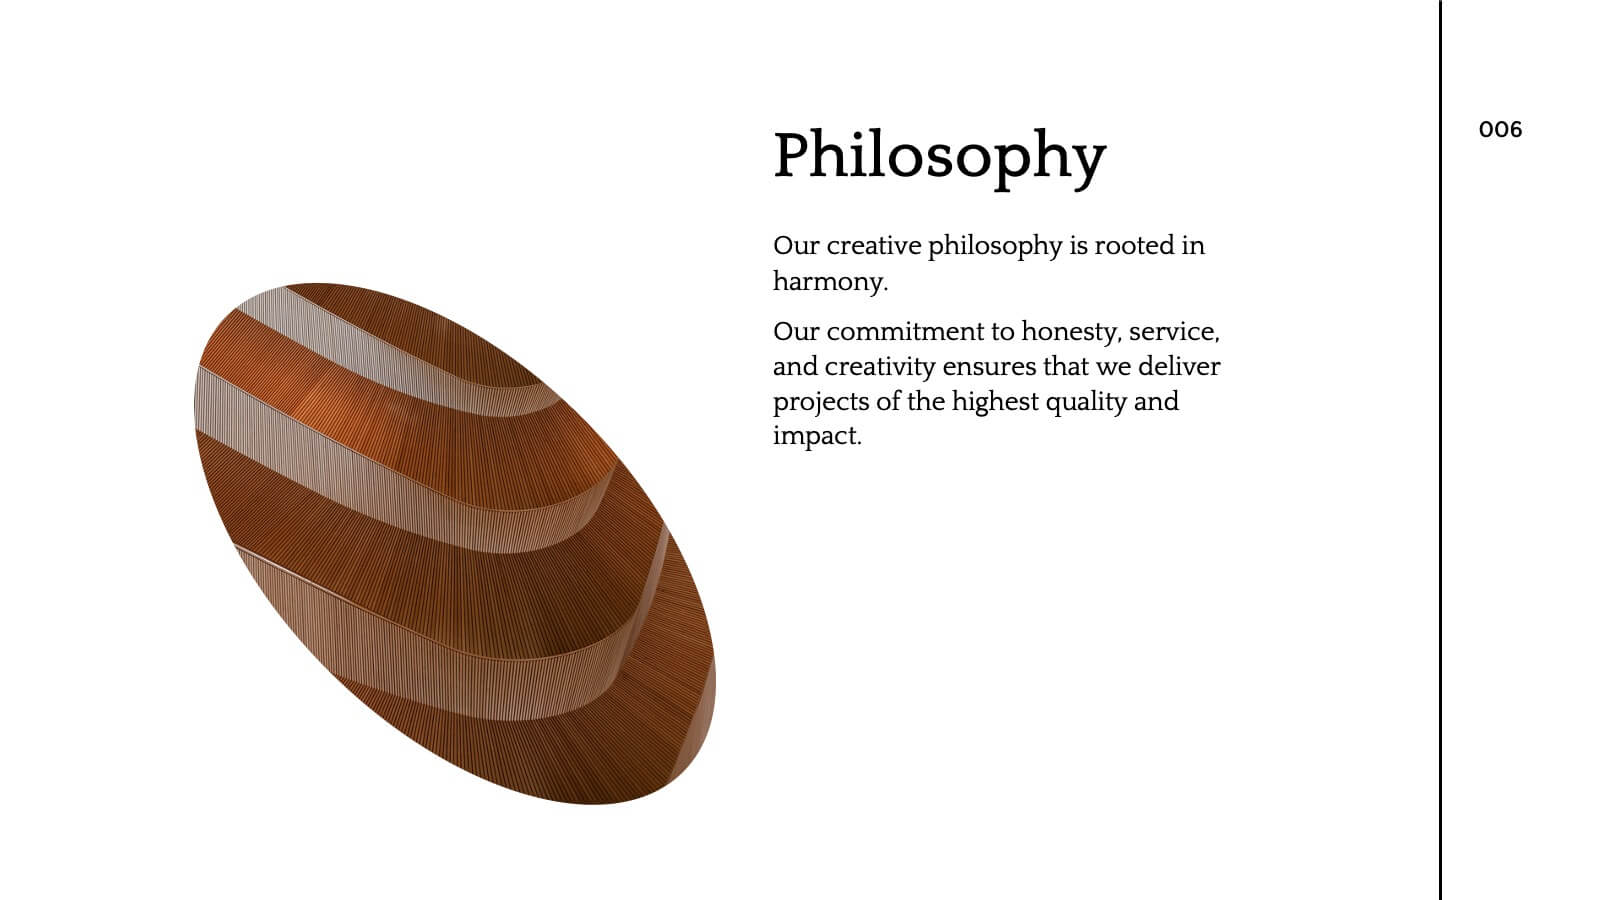
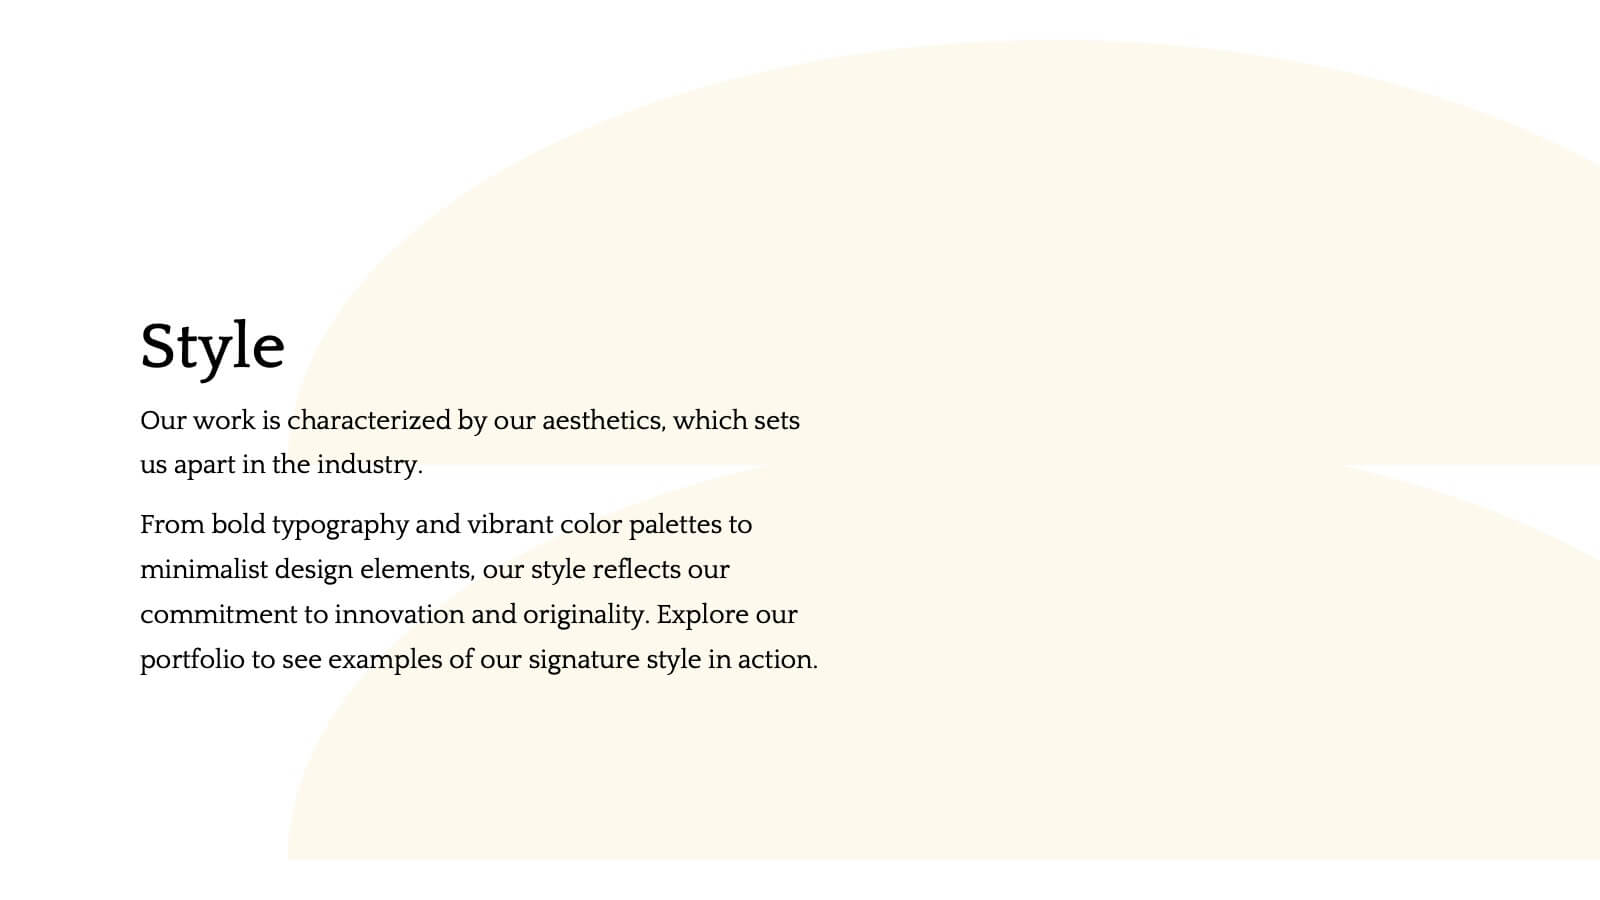
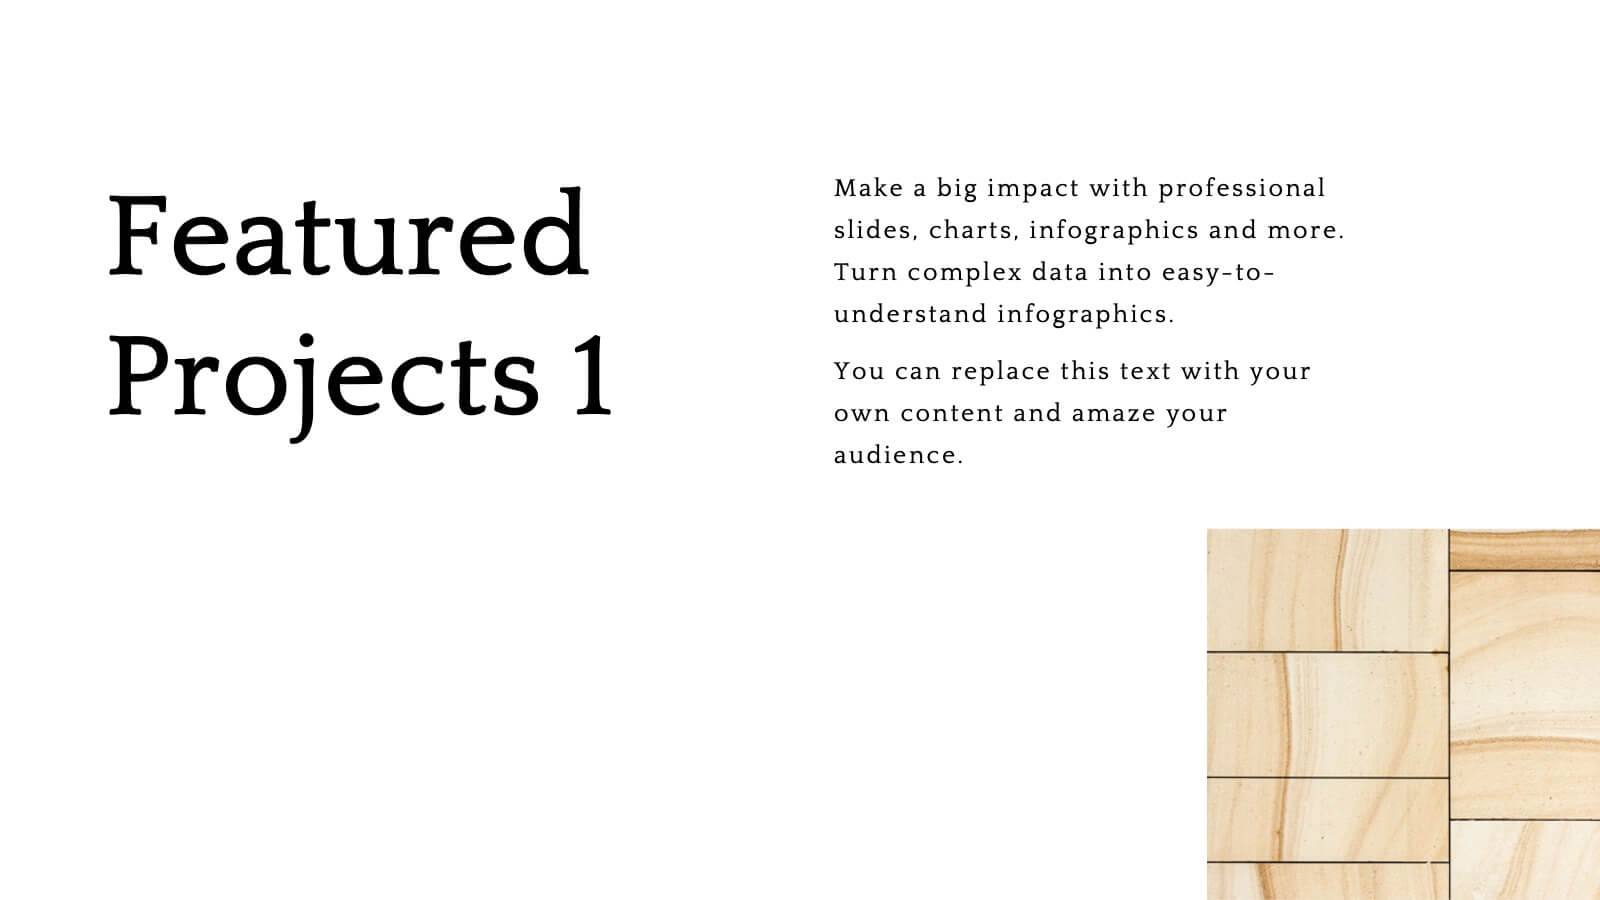
Flare Creative Portfolio Presentation
Showcase your creative work with this elegant portfolio template! Perfect for highlighting projects, client testimonials, and services offered. Ideal for artists, designers, and creatives aiming to impress clients and collaborators. Compatible with PowerPoint, Keynote, and Google Slides, this template ensures your portfolio is clear, professional, and visually stunning. Make your work shine!


5 diapositivas
Dealing With Cyberbullying Infgraphics
Cyberbullying refers to the act of using digital communication platforms such as social media, instant messaging, online forums, or email to harass, intimidate, or harm others. This infographic template is designed to raise awareness about cyberbullying and provide guidance on how to effectively deal with it. This template aims to educate individuals, parents, educators, and organizations about the impact of cyberbullying and empower them to prevent and address this issue. This template can be used by schools, community organizations, or online safety advocates to raise awareness about cyberbullying, and foster a safer online environment.


5 diapositivas
Closing Slide with Key Takeaways Presentation
Conclude your presentation with impact using the Closing Slide with Key Takeaways Presentation. This streamlined design features a bold visual flow to emphasize up to five main points, ensuring your audience walks away with clear, memorable insights. Ideal for summarizing findings, next steps, or action items. Fully customizable and works seamlessly with PowerPoint, Keynote, and Google Slides.


4 diapositivas
30 60 90 Day Plan Goals Presentation
Set your roadmap in motion with a clean, visual timeline that makes each milestone easy to follow and present with confidence. This presentation helps you outline priorities, track progress, and communicate clear goals for the first three months. Fully editable and compatible with PowerPoint, Keynote, and Google Slides.