


Características


¿Tienes alguna pregunta?
Recomendar


7 diapositivas
Business Office Scenes Infographic Presentation
Office Scene Infographics can be a valuable tool for businesses or organizations that want to showcase their workplace culture or attract potential employees by providing a visual representation of what it's like to work at their company. This template is designed to provide a visual representation of different office scenarios and activities. The template is fully customizable and can be used for a variety of purposes, such as internal communication, training, marketing, and educational. It has a unique design, easy customization, and compatibility with Powerpoint, Keynote and Google Slides.


4 diapositivas
4-Quadrant RACI Chart Slide Presentation
Bring structure and clarity to your workflow with a bold, pyramid-style layout that makes responsibilities instantly understandable. This presentation helps teams outline who leads, supports, approves, and informs across key tasks, turning complex processes into a clean visual map. Fully editable and compatible with PowerPoint, Keynote, and Google Slides.


21 diapositivas
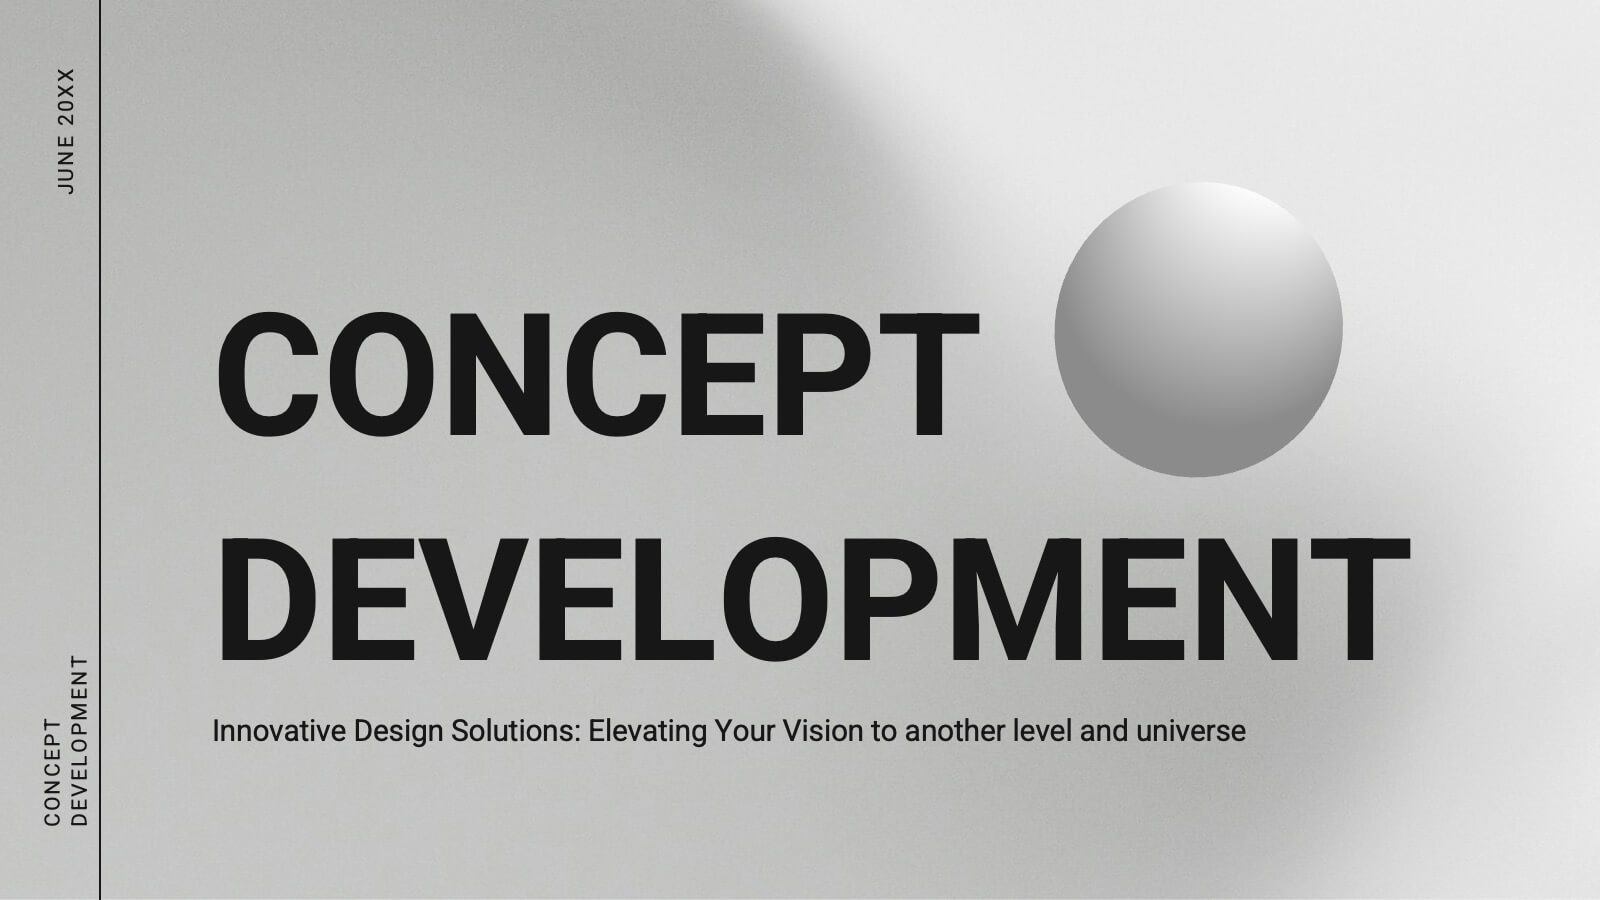
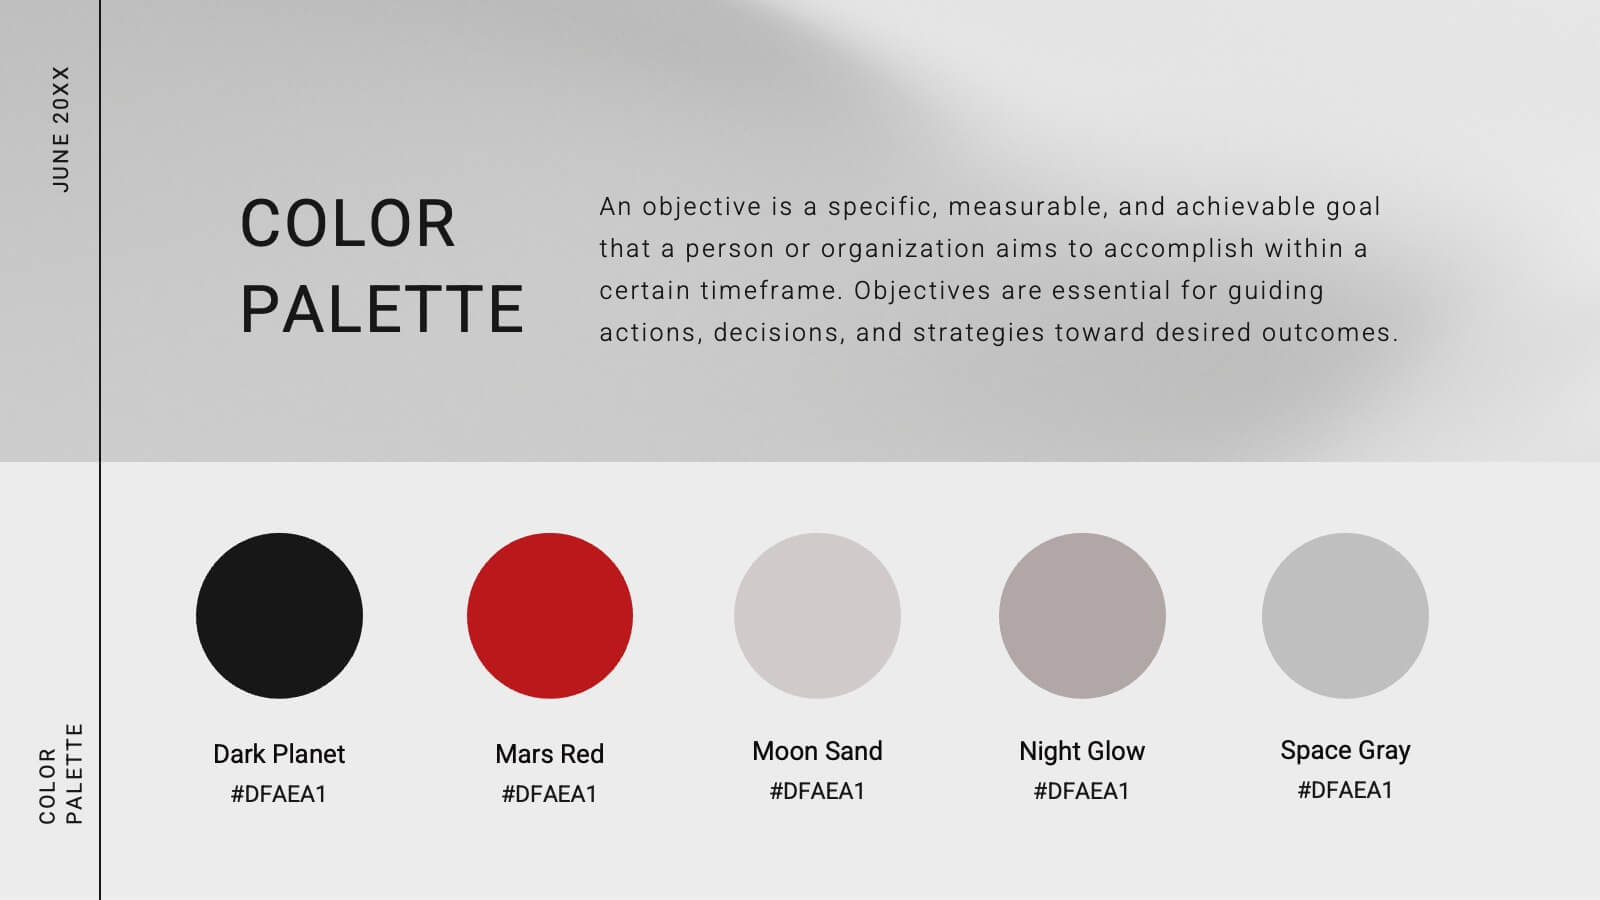
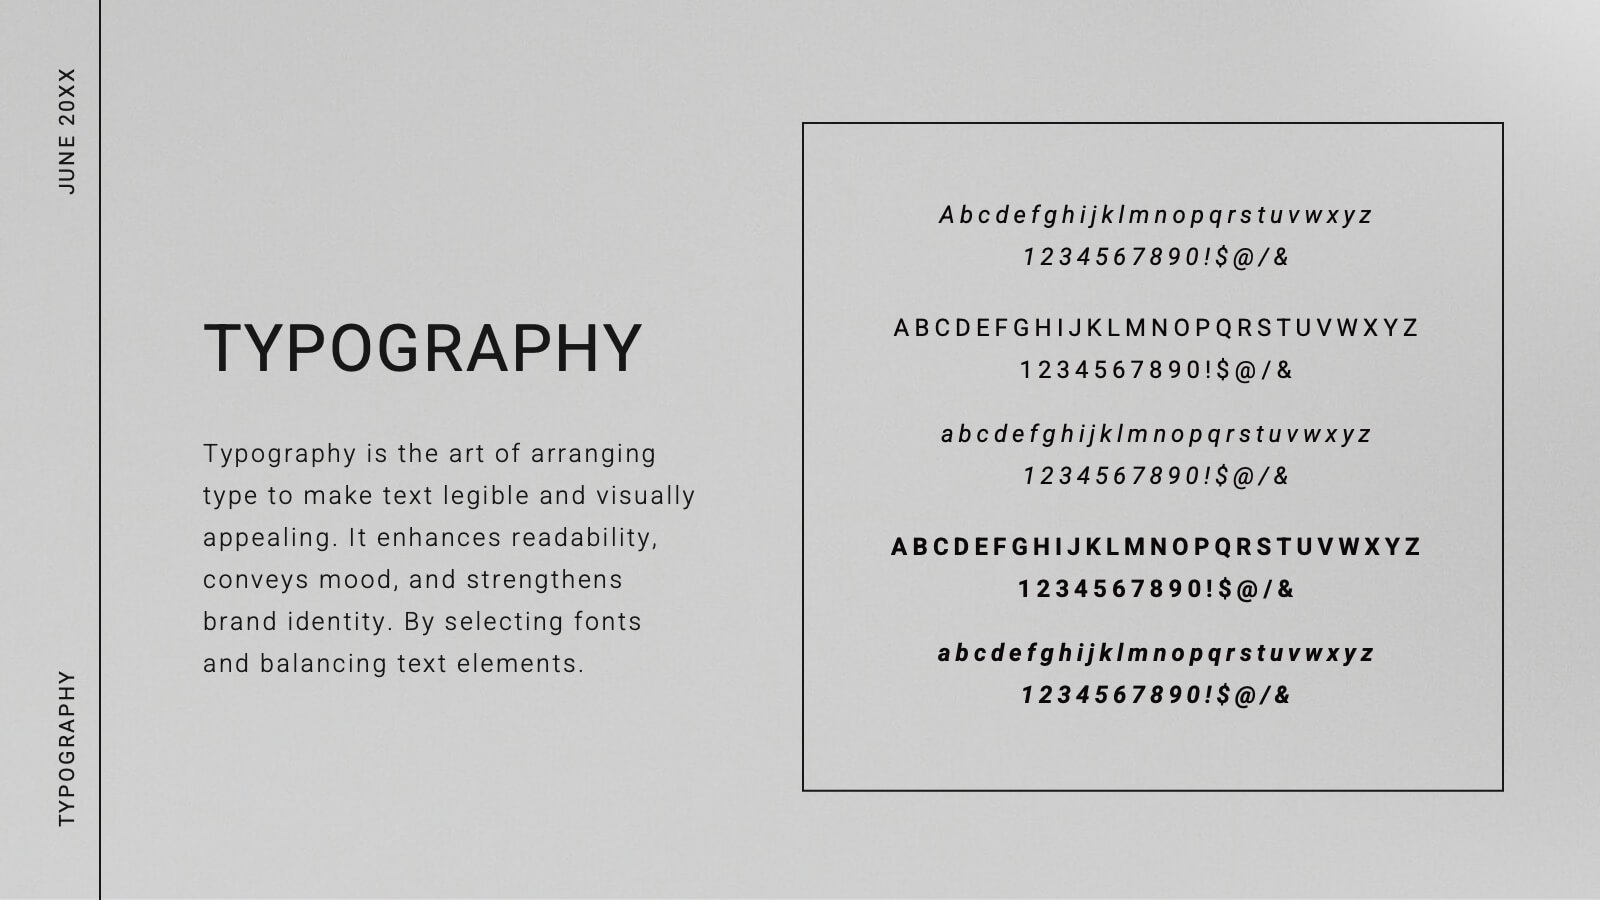
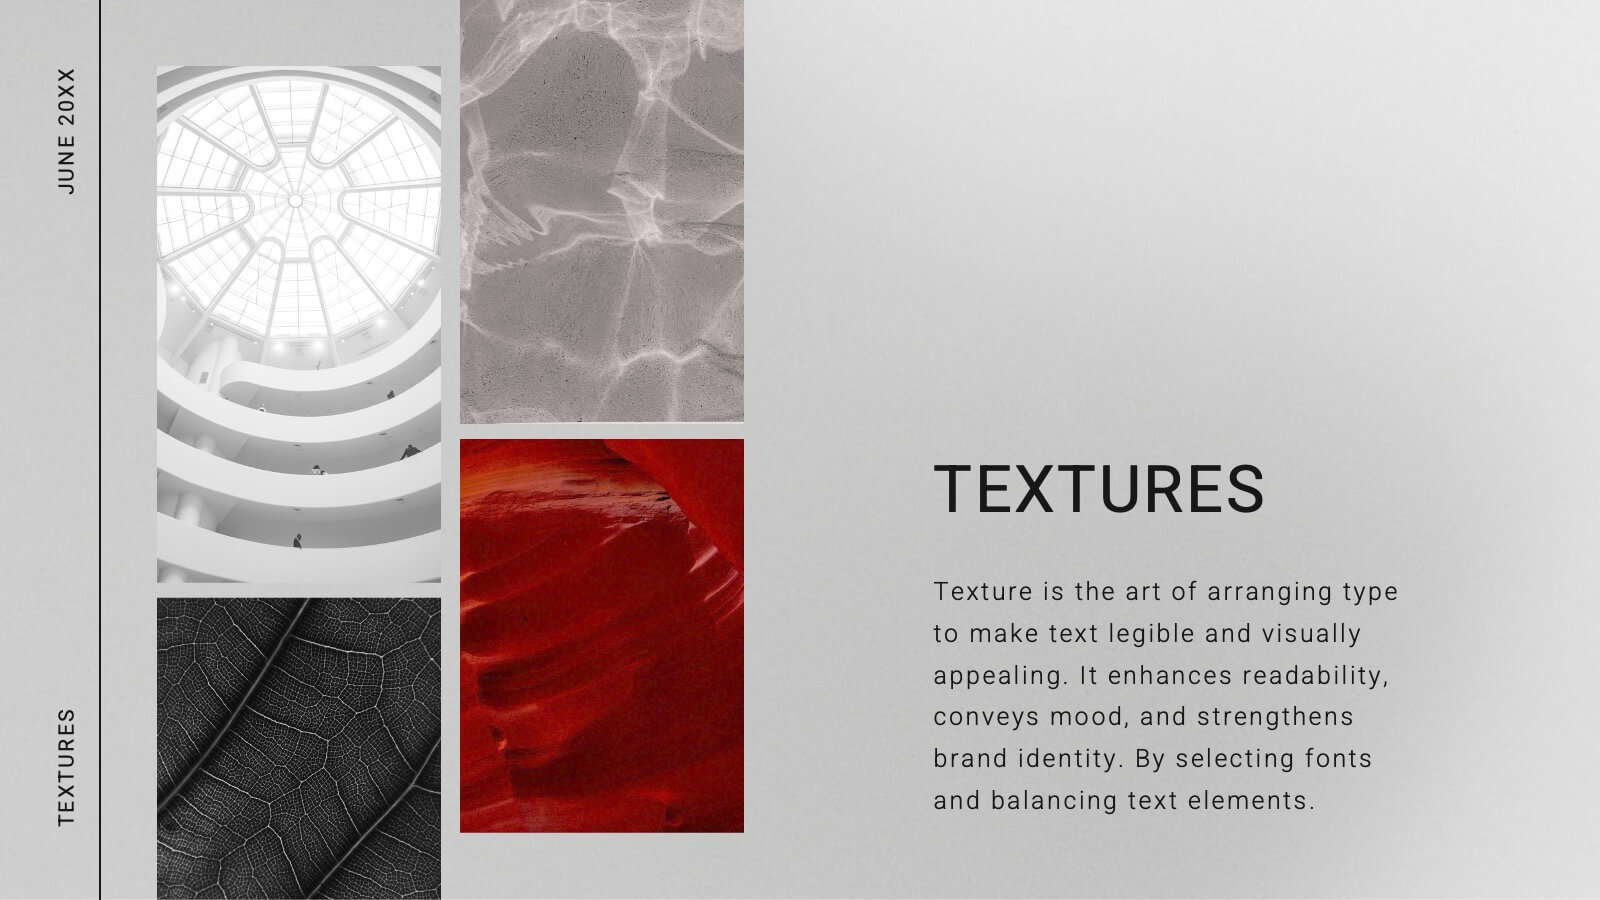
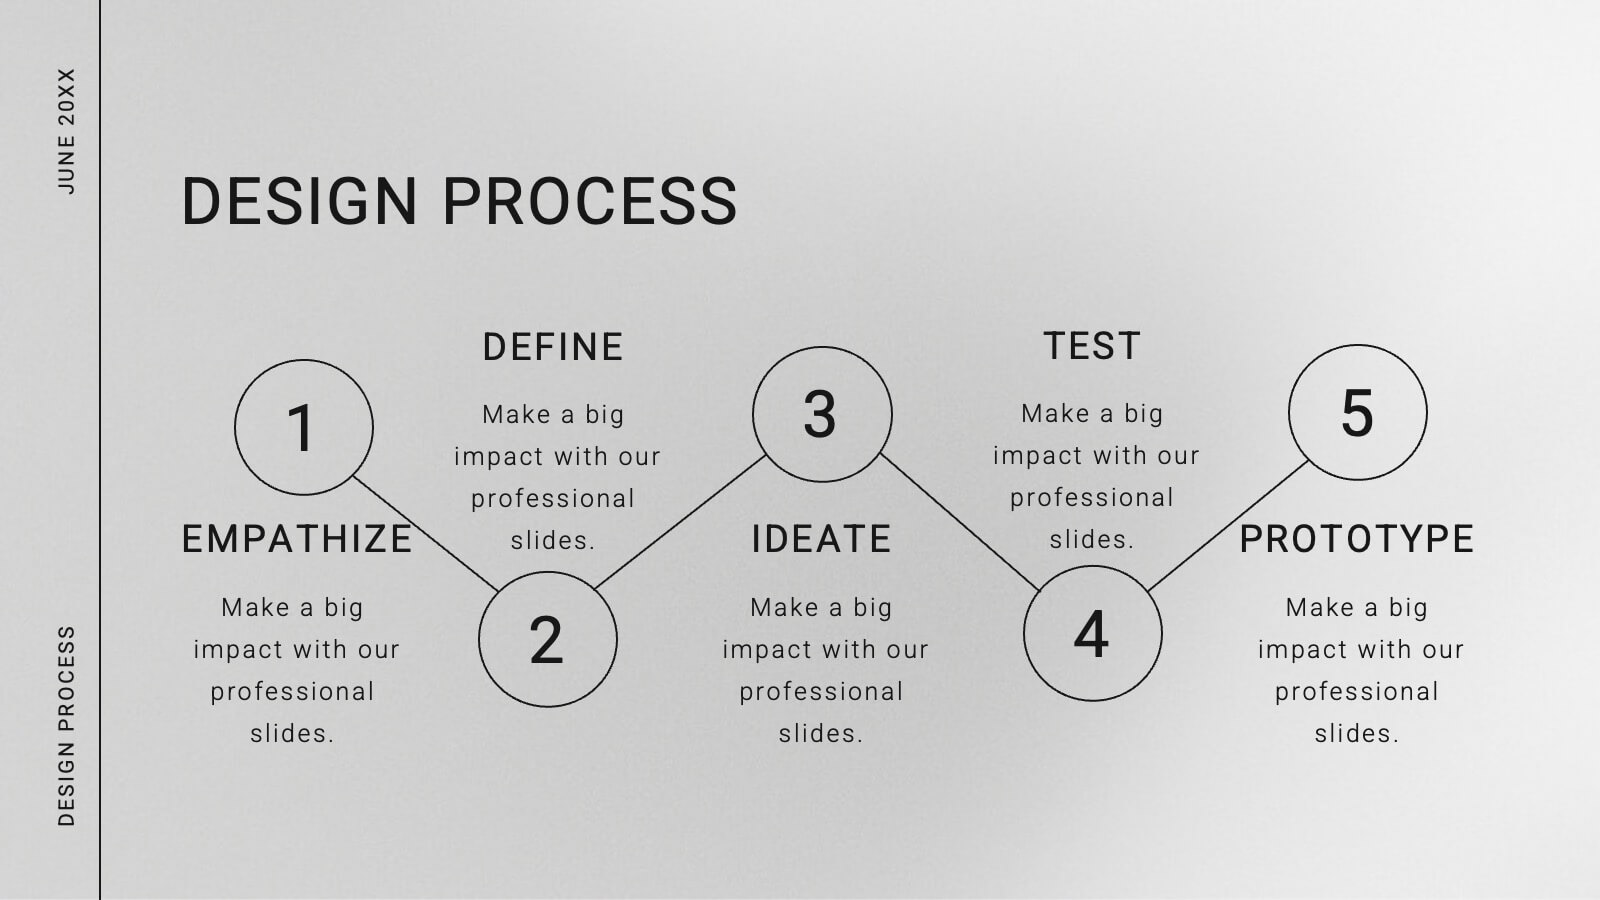
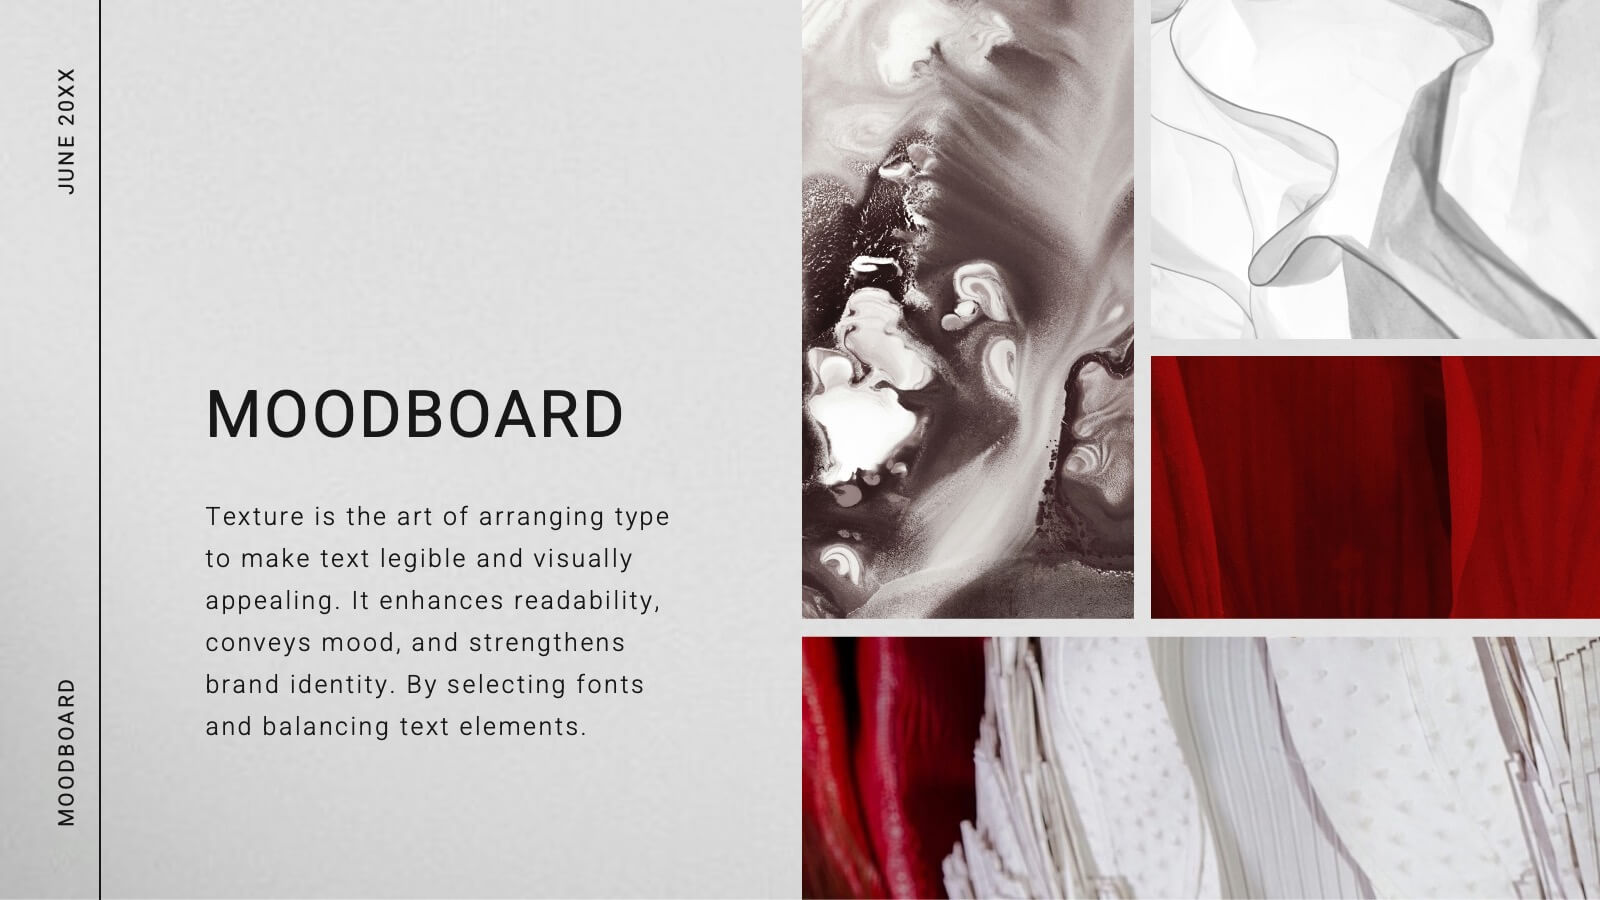
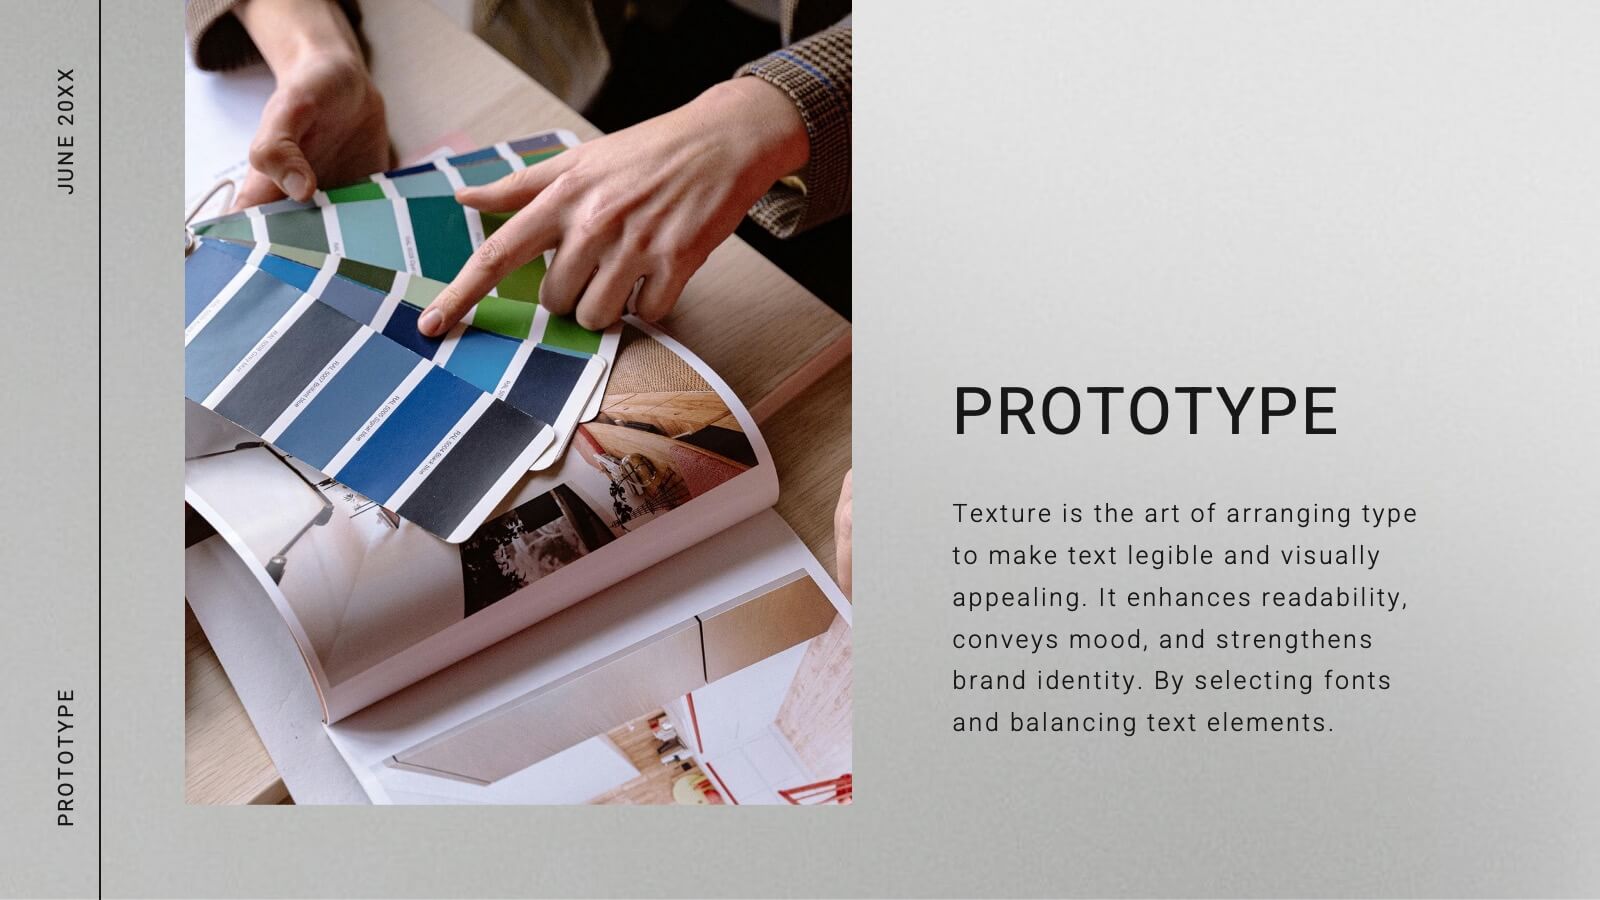
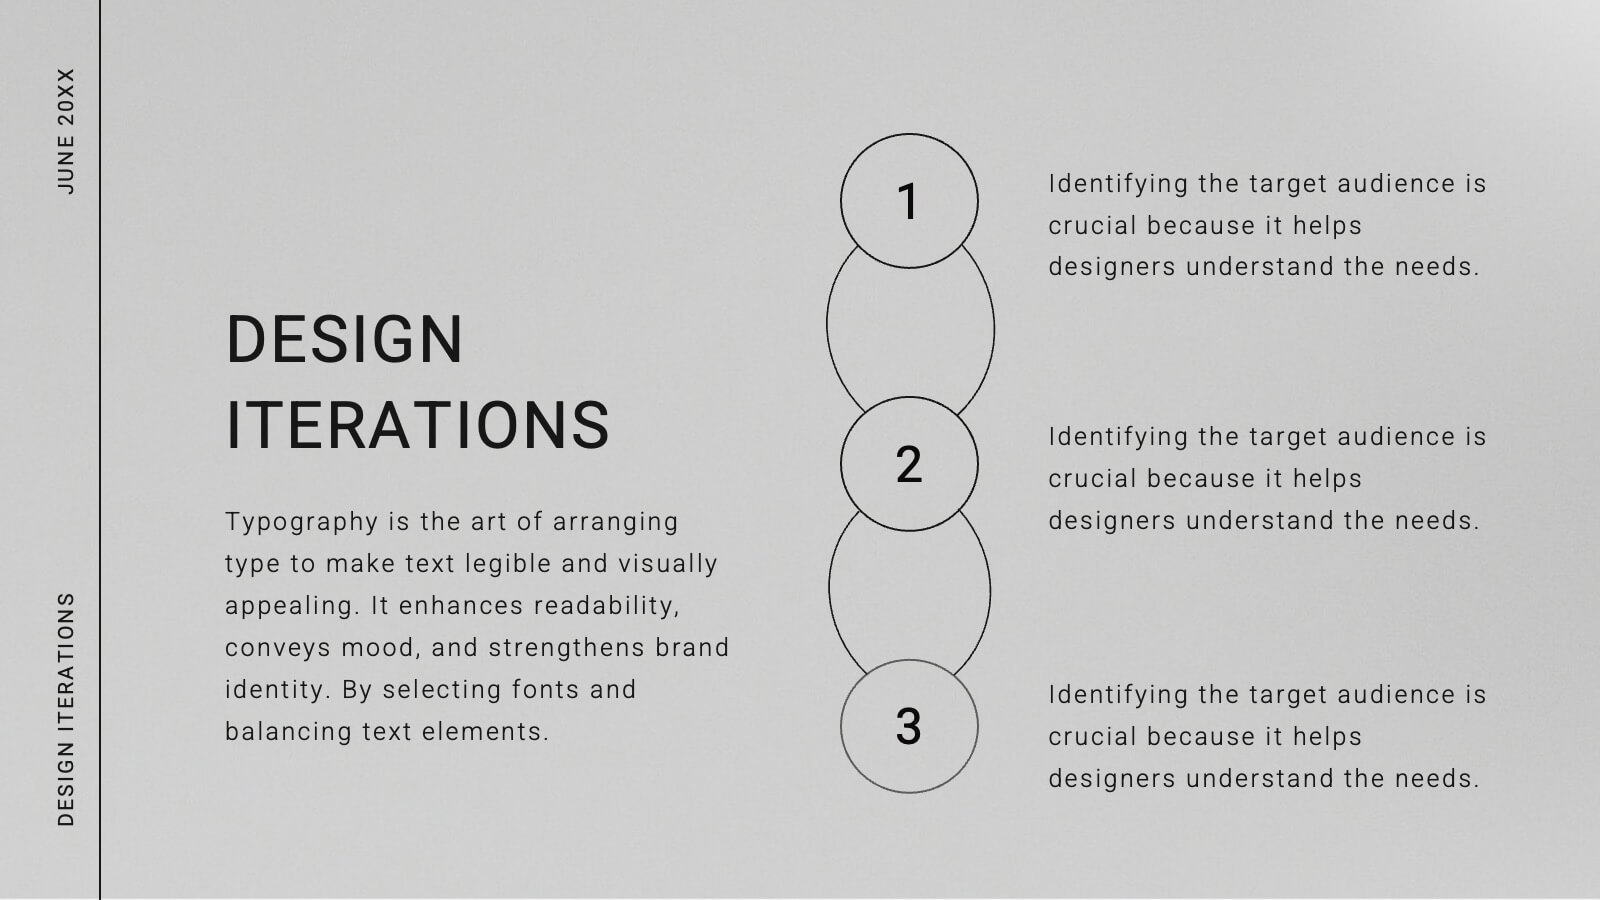
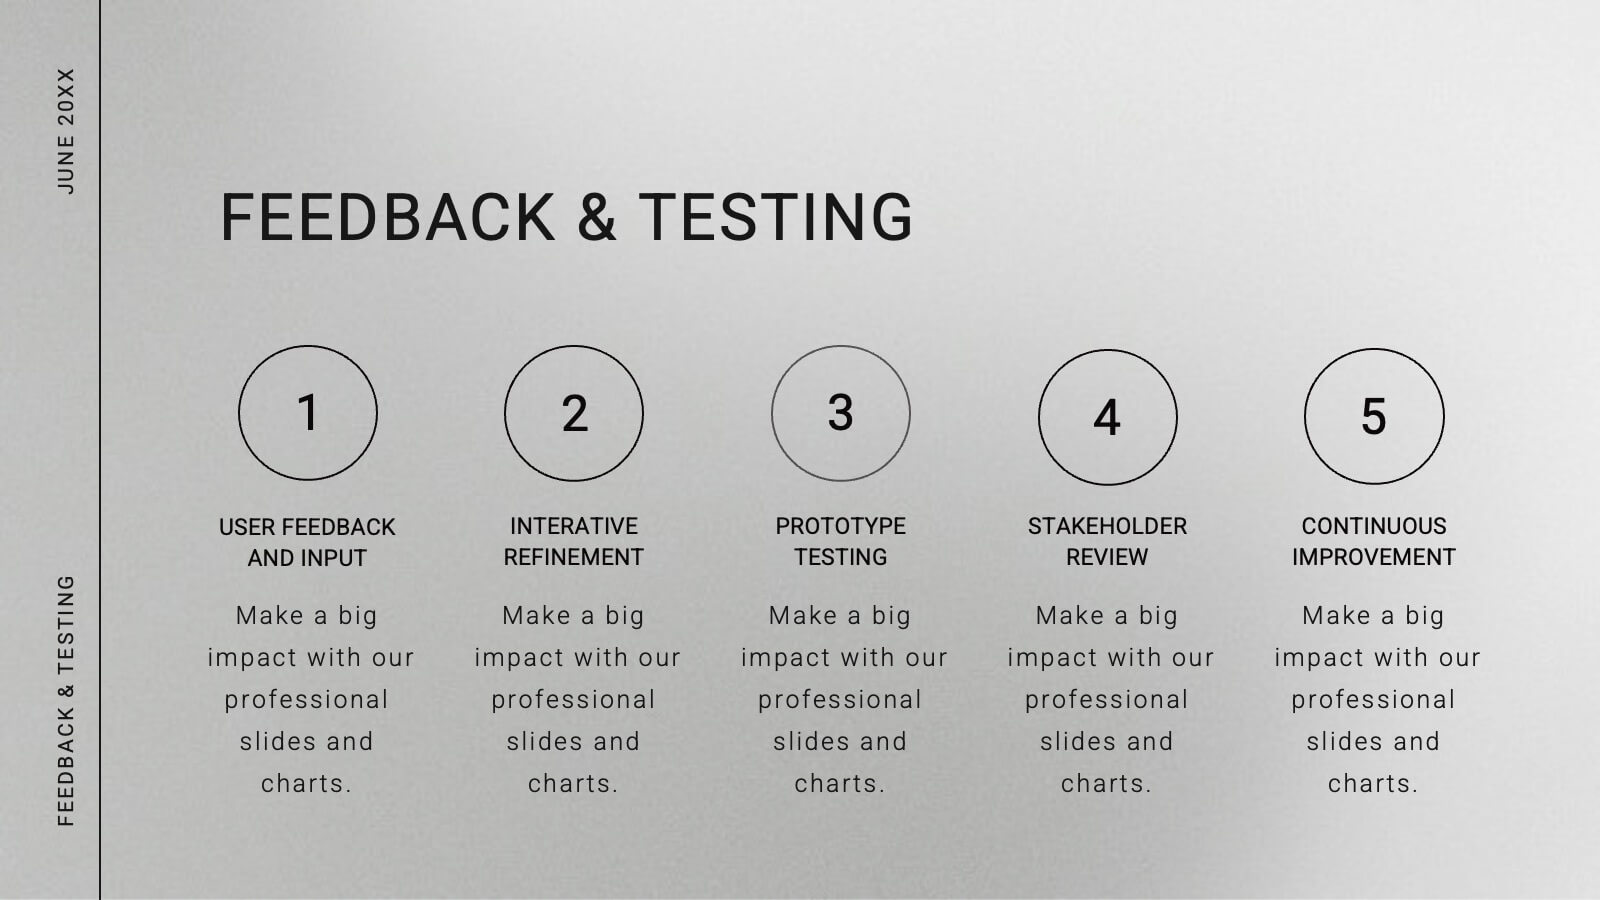
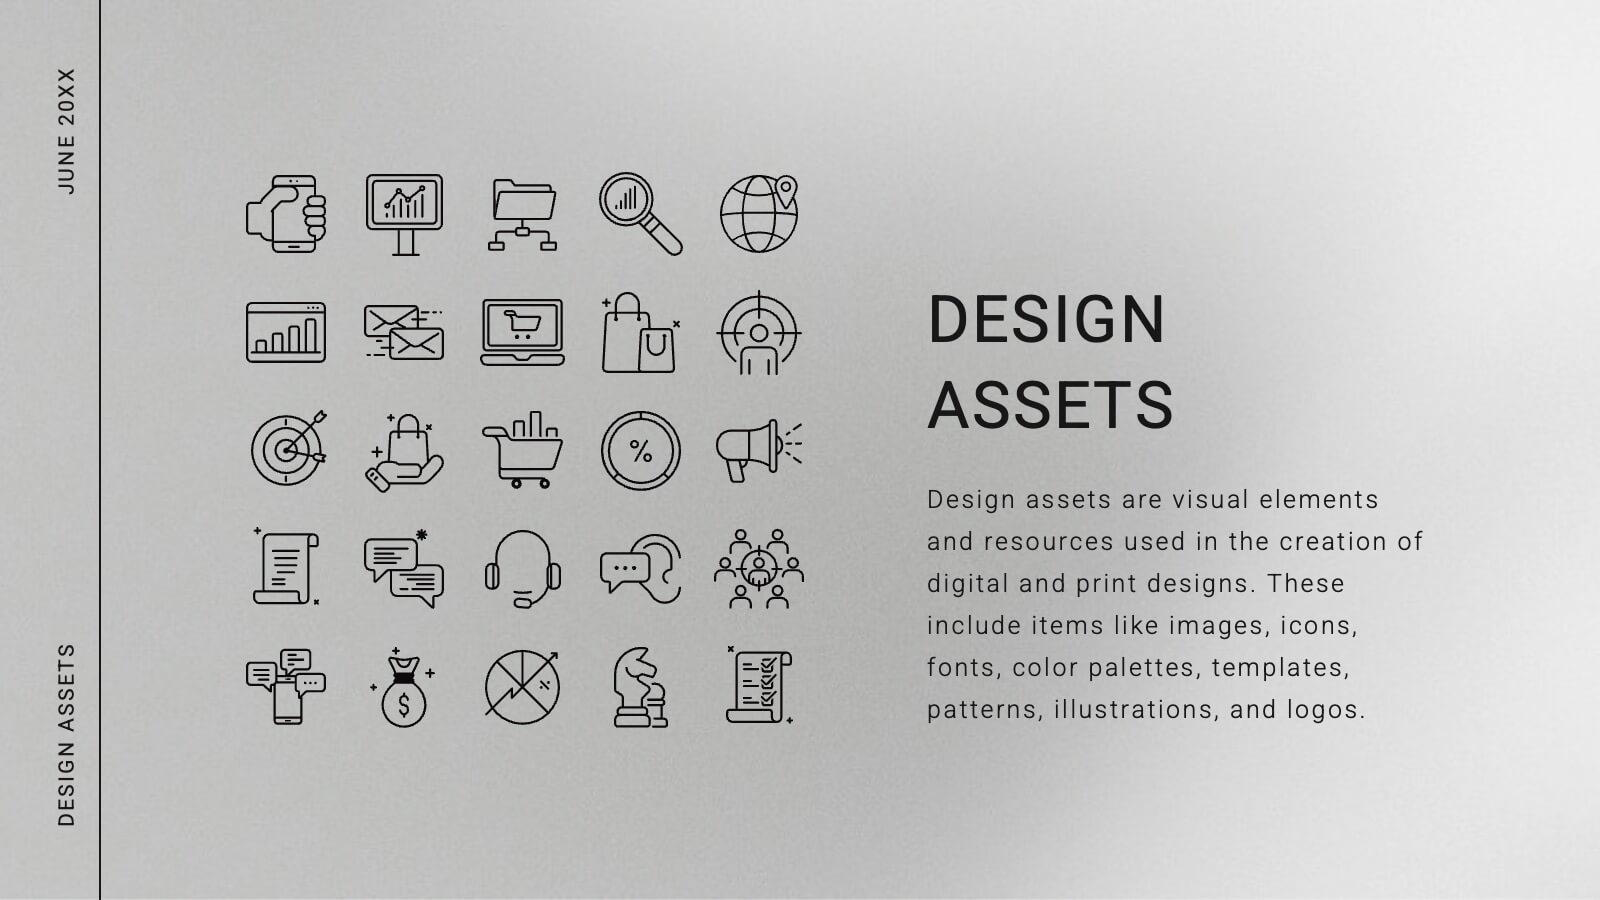
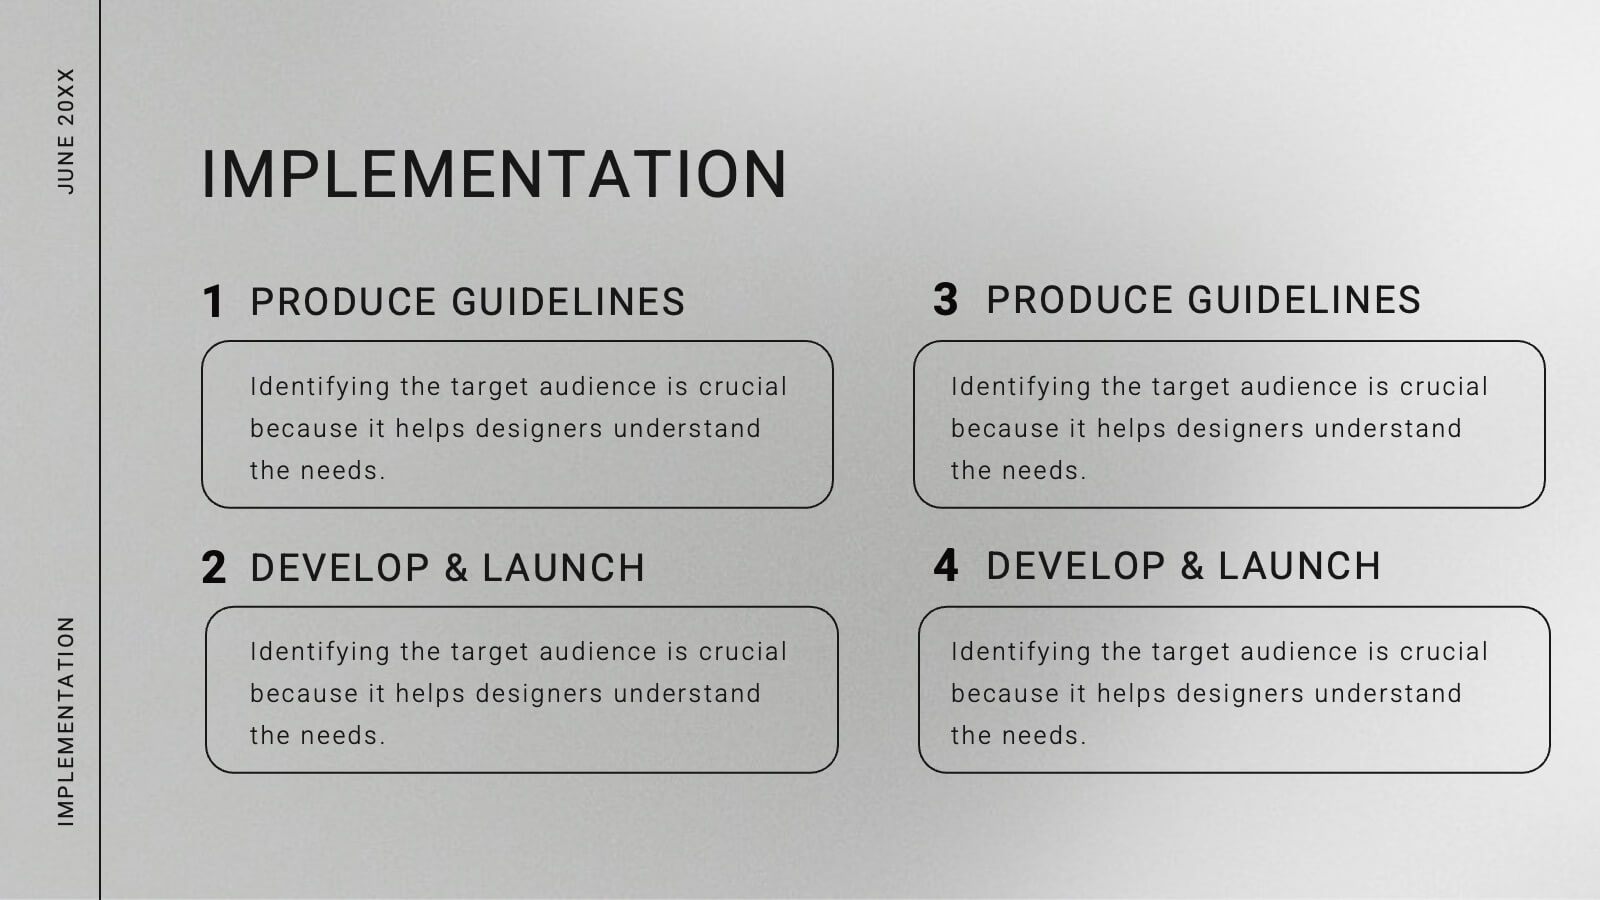
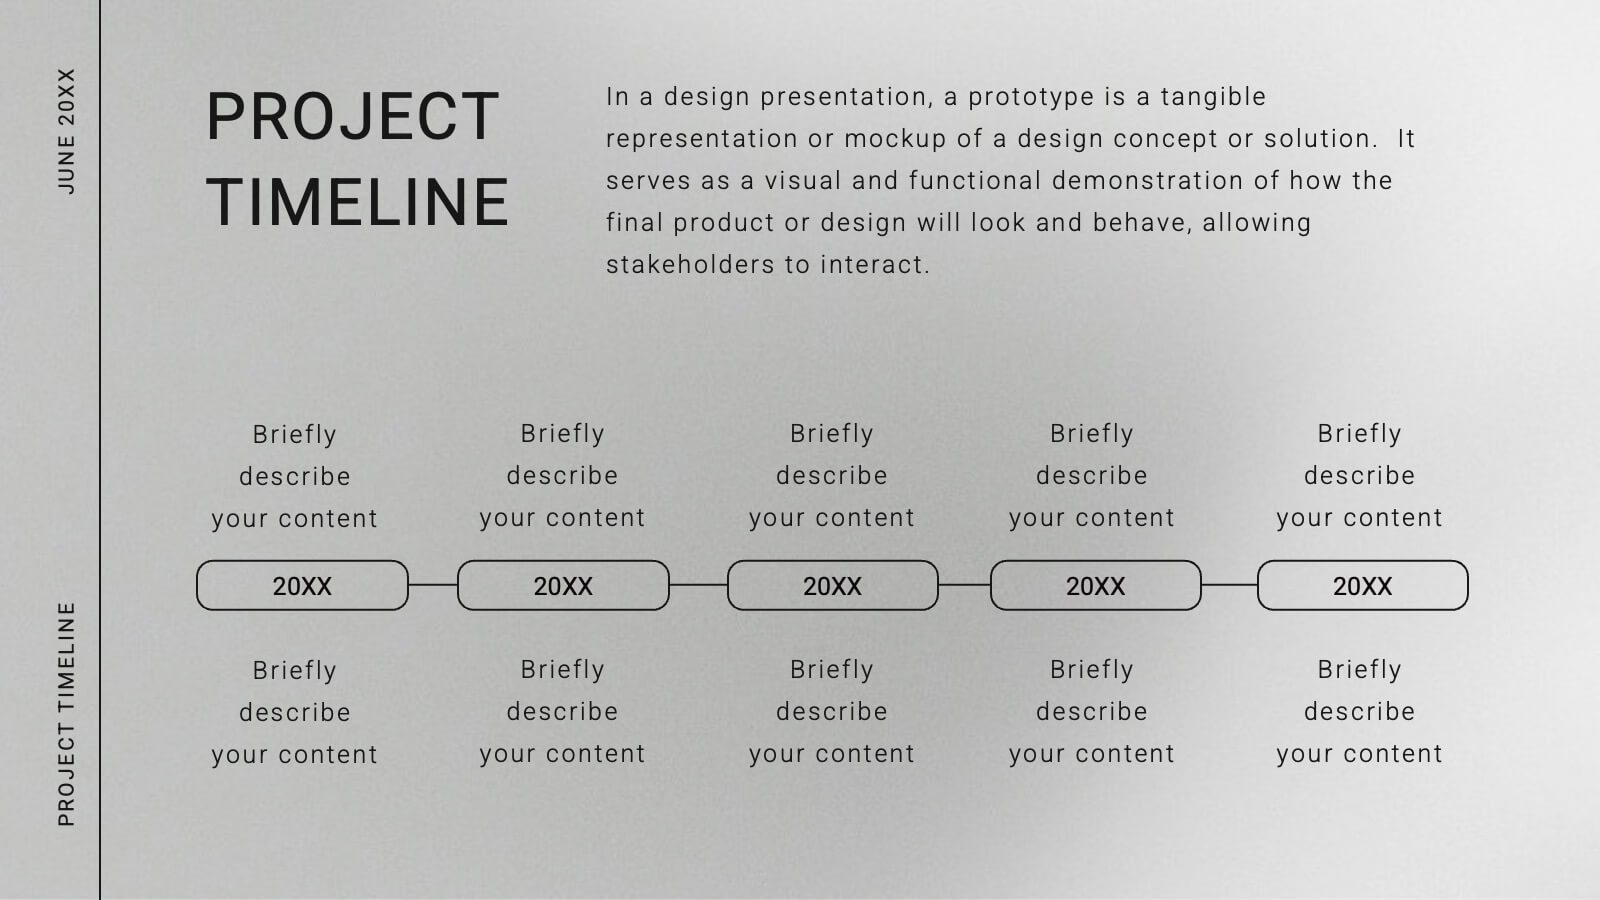
Chimerae Design Portfolio Presentation
Elevate your design portfolio with this modern and visually dynamic template, crafted to showcase your creative process and expertise. This layout includes slides for introduction, concept development, and design elements, allowing you to present your unique approach and attention to detail. Highlight your design process, including research insights, prototypes, and final designs, to demonstrate your workflow and results. Showcase your brand identity with dedicated slides for typography, color palettes, and textures, ensuring a cohesive and professional presentation. This fully customizable template is compatible with PowerPoint, Google Slides, and Keynote, offering versatility for designers, freelancers, and agencies aiming to leave a lasting impression. Tailor the design to match your brand and confidently present your portfolio in style.

20 diapositivas
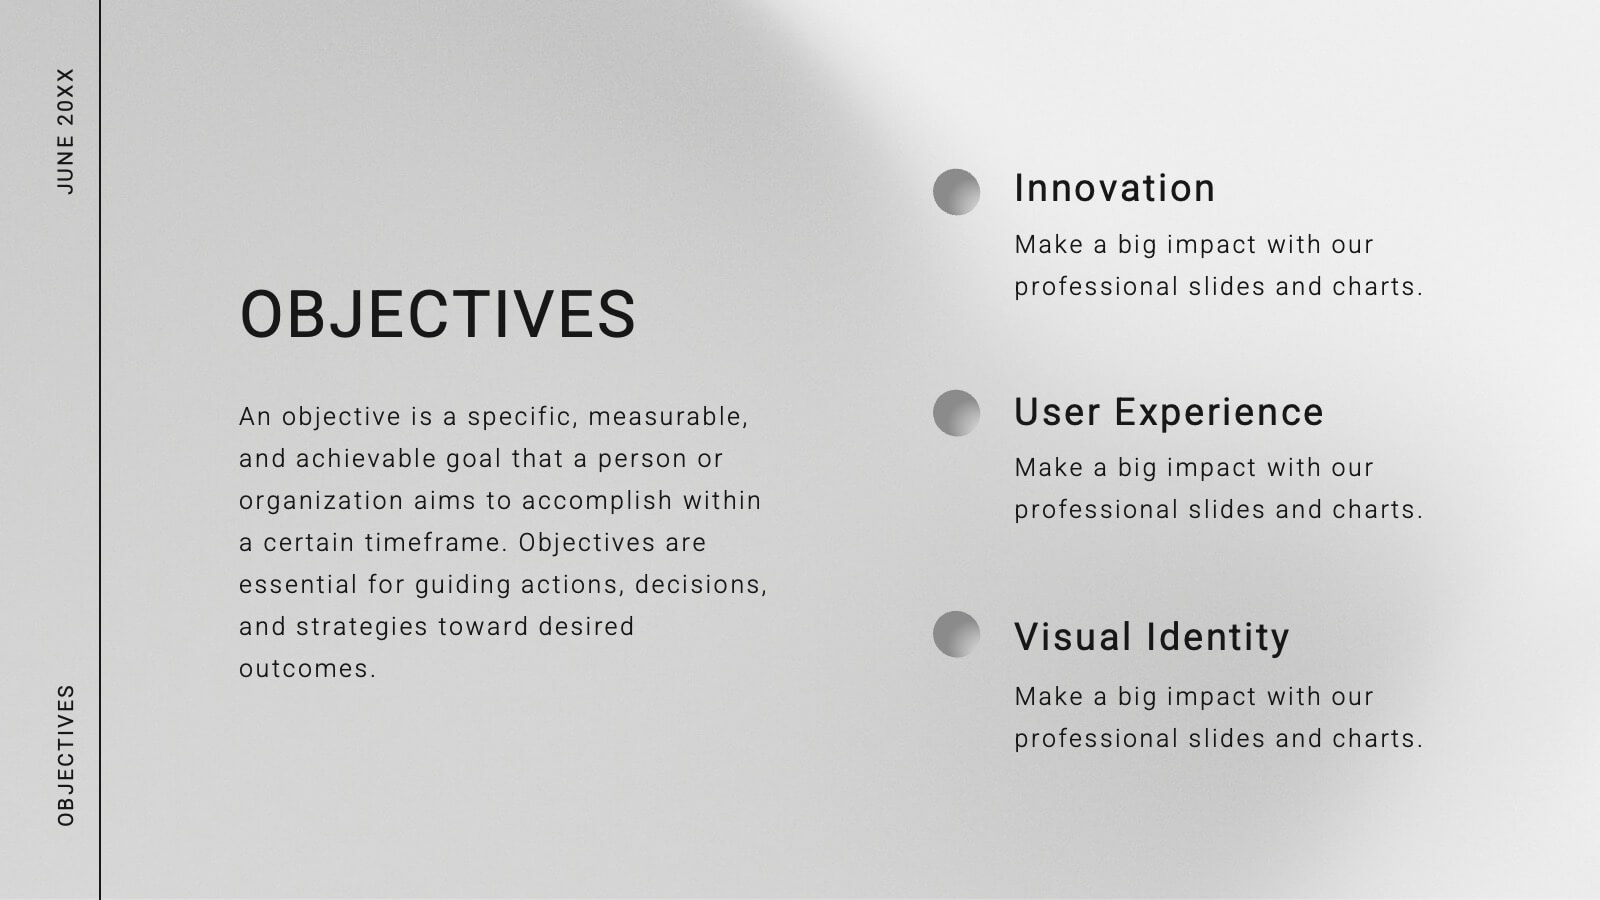
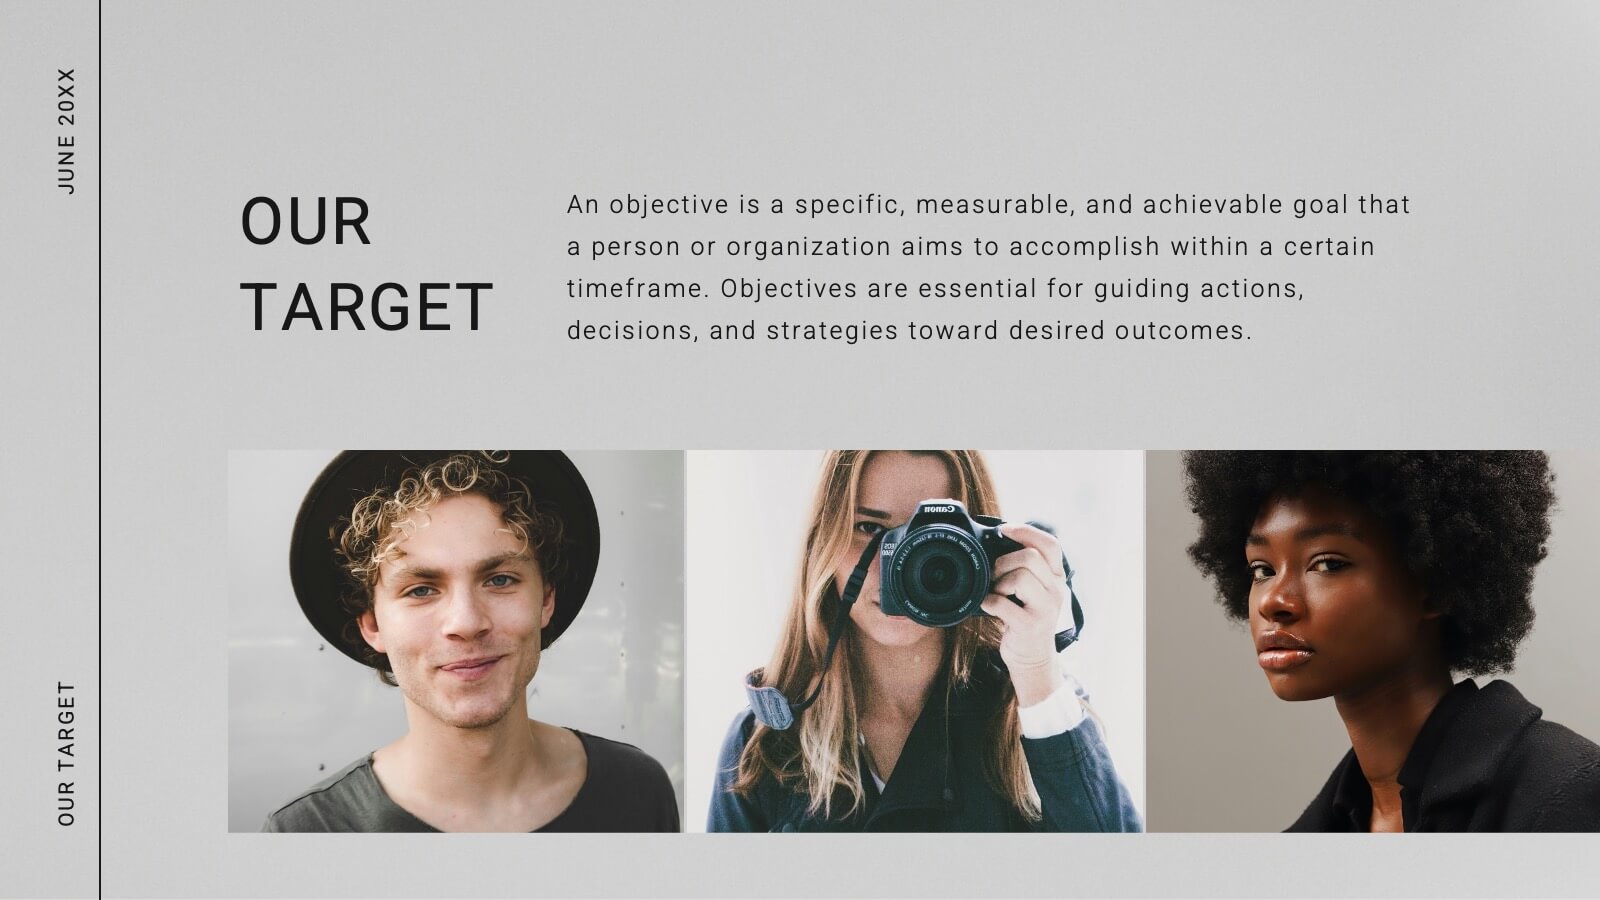
Comet Graphic Design Project Plan Presentation
Craft stunning design project presentations with this elegant template. Showcase objectives, processes, mood boards, and final designs effectively. Ideal for creative teams and clients. Fully compatible with PowerPoint, Keynote, and Google Slides.


6 diapositivas
Asia Market Map Infographic
Asia is the largest and most populous continent on Earth, covering a vast area that includes diverse landscapes, cultures, and countries. This map infographic displays the countries, capitals, major cities, rivers, mountain ranges, and other Asia geographical features. This template can be used for various purposes, such as market research presentations, business reports, and marketing materials. This template showcases the business and economic landscape in the Asian market. This provides valuable insights into the economic landscape of various Asian countries and help businesses make informed decisions for market expansion and opportunities in the region.


5 diapositivas
Logistics Flow Diagram Presentation
Turn complex processes into a clear visual journey with this dynamic presentation design. Ideal for illustrating workflows, delivery systems, or operational stages, it helps simplify how goods or data move from start to finish. Fully editable and compatible with PowerPoint, Keynote, and Google Slides for seamless customization and presentation.


7 diapositivas
Lifecycle Stages in Customer Experience Presentation
Showcase the full customer journey with this Lifecycle Stages in Customer Experience presentation. Featuring a sleek infinity loop layout, this slide is ideal for visualizing cyclical engagement stages—like acquisition, onboarding, retention, and advocacy. Clean design and labeled touchpoints help convey insights clearly. Fully compatible with PowerPoint, Canva, and Google Slides.


12 diapositivas
Investment Strategy Presentation
The "Investment Strategy Presentation" template is designed for effectively mapping out and displaying various investment strategies. It uses a multi-colored light bulb graphic, which symbolizes ideas and innovation in investment planning, making it visually appealing and easy to understand. Each segment of the light bulb is labeled with letters A through F, representing different aspects or phases of an investment strategy that can be tailored to specific objectives or points of discussion. This format helps in presenting complex financial data or strategies in a straightforward manner that can be easily grasped by audiences, making it an ideal choice for financial analysts, investors, or corporate strategy meetings.


6 diapositivas
Enterprise Loyalty Program Infographic
A loyalty program is a structured marketing strategy designed to encourage customers to continue doing business with a company or brand by offering various incentives, rewards, and benefits for their ongoing loyalty and repeat purchases. This infographic template is a visual representation of the key components, benefits, and features of a loyalty program designed for a large-scale business or enterprise. This template visually conveys the value of the program, encourages participation, and showcases the benefits that customers can enjoy by becoming loyal members. This is compatible with Powerpoint, Keynote, and Google Slides.


4 diapositivas
Differentiation through Blue Ocean Framework Presentation
Make waves with this bold, eye-catching layout built to show what sets your strategy apart. This presentation template explores how to stand out in untapped markets using a simple comparison framework, perfect for teams shifting from competition to innovation. Easily editable and ready for PowerPoint, Keynote, and Google Slides.


2 diapositivas
Creative Gratitude Slide Presentation
Express gratitude in style with this creative thank-you slide template! Featuring bold typography and modern geometric elements, this design adds a unique touch to your presentations. Ideal for business pitches, creative projects, and professional meetings. Fully customizable and compatible with PowerPoint, Keynote, and Google Slides for effortless personalization.
6 diapositivas
Performance Tracking Heat Map Presentation
Turn performance data into bold visual stories with a sleek, bubble-style layout that highlights progress and key metrics. Ideal for showcasing results, performance reviews, or KPI tracking, this presentation helps audiences grasp insights quickly. Fully compatible with PowerPoint, Keynote, and Google Slides for seamless editing and customization.


6 diapositivas
Macro Environment PESTEL Framework
Navigate market forces with confidence using this dynamic PESTEL framework layout—designed to help you assess Political, Economic, Social, Technological, Environmental, and Legal factors with clarity. Whether for strategy planning or external analysis, this slide keeps your insights visually organized and easy to explain. Fully compatible with PowerPoint, Keynote, and Google Slides.
6 diapositivas
Sales Activity Tracking Presentation
Stay on top of performance metrics with the Sales Activity Tracking Presentation. This structured table layout helps you display key figures like sales numbers, targets, percentages, and totals with ease. Perfect for performance reviews, sales updates, and executive reports. Fully editable in Canva, PowerPoint, Google Slides, and Keynote.


5 diapositivas
Business Travel Logistics Plan Presentation
Plan and present business travel operations with clarity using this Business Travel Logistics Plan Presentation. Designed around a global layout with visual transport icons, this slide helps outline travel modes, routes, and logistics points. Ideal for corporate travel managers, event organizers, and logistics teams. Fully editable in PowerPoint, Keynote, and Google Slides.


8 diapositivas
Survey Poll Results Visualization Presentation
Easily showcase your survey or poll data with this bold and modern results visualization slide. Designed with eye-catching circular charts, it helps your audience quickly grasp key insights at a glance. Perfect for business reviews, feedback summaries, or internal reports. Compatible with PowerPoint, Keynote, and Google Slides.


21 diapositivas
Sonicwave Market Analysis Report Presentation
A vibrant, modern template designed for market analysis presentations. Covers agenda, key highlights, metrics, financial summaries, competitor insights, and strategic initiatives. Ideal for professionals presenting data-driven insights on trends and performance. Fully customizable in PowerPoint, Keynote, and Google Slides for business, marketing, and analytical reporting needs.