


Features
- 6 Unique slides
- Fully editable and easy to edit in Microsoft Powerpoint, Keynote and Google Slides
- 16:9 widescreen layout
- Clean and professional designs
- Export to JPG, PDF or send by email


Do you have any questions?
Recommend


5 slides
Best Travel Planning Template
Bring wanderlust to life with a slide that turns trip planning into a clear, engaging journey. This presentation breaks down key travel steps—documents, packing, routes, and timing—using simple visuals that keep details organized and easy to follow. Fully customizable and compatible with PowerPoint, Keynote, and Google Slides.


5 slides
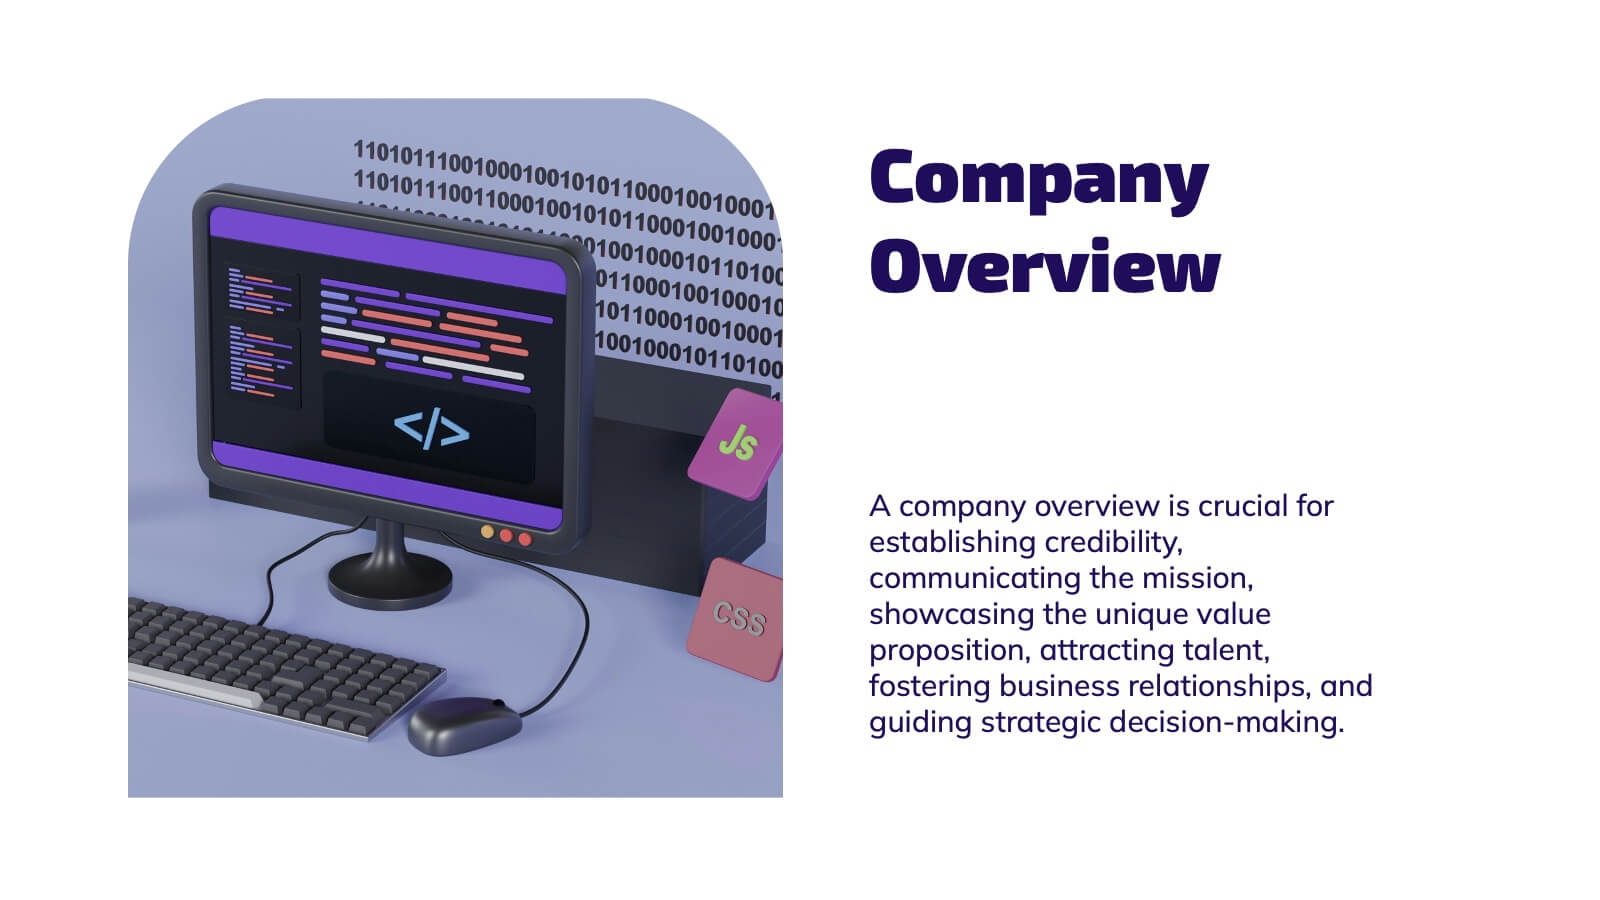
Concise Company Overview Executive Summary Presentation
Present your business snapshot with clarity using this Concise Company Overview Executive Summary Presentation. Featuring a colorful puzzle-style diagram with six customizable titles, this slide is ideal for outlining key departments, initiatives, or functions. Fully editable in PowerPoint, Keynote, Google Slides, and Canva for maximum flexibility.


7 slides
Criminal Law Infographic
The Criminal Law Infographic presents an engaging and informative visual breakdown of key components within the field of criminal law. Each segment highlights different aspects such as crime rates, judicial processes, or enforcement statistics. This template is designed to be user-friendly, making it an ideal choice for legal professionals, or students who need to present complex legal information. Compatible with PowerPoint, Google Slides, and Keynote, it offers a versatile way to communicate legal concepts and data in both educational and professional settings. Its clear structure ensures that viewers can easily follow and comprehend the critical elements of criminal law.


4 slides
Butterfly Comparison Chart Presentation
Bring clarity to your comparisons with a sleek, balanced design that highlights both sides of your data. This presentation is perfect for showing pros and cons, alternatives, or performance metrics in a visually engaging way. Fully customizable and compatible with PowerPoint, Keynote, and Google Slides.


6 slides
Break Even Point Presentation
Turn your data into a story of profit and precision with this clean and modern presentation design. Ideal for showcasing financial performance, cost analysis, or revenue forecasts, it helps visualize where your business meets success. Fully customizable and compatible with PowerPoint, Keynote, and Google Slides for smooth editing.


8 slides
Environmental Impact Reporting Presentation
Showcase sustainability data with clarity using the Environmental Impact Reporting Presentation. Perfect for tracking plastic usage, waste trends, and eco-initiatives. The infographic-style visuals highlight four distinct data points with bold icons and labeled callouts. Fully editable in PowerPoint, Keynote, and Google Slides—ideal for ESG reports, audits, or environmental awareness campaigns.


21 slides
Manticore Financial Report Presentation
This financial report template features a sleek, modern design for presenting key highlights, performance metrics, and financial summaries. It includes sections for market trends, competitor insights, and strategic initiatives. Fully customizable and compatible with PowerPoint, Keynote, and Google Slides, it's perfect for delivering impactful financial presentations with clarity and style.


10 slides
Effective Decision-Making in Five Steps Presentation
Make smarter choices with the Effective Decision-Making in Five Steps presentation. This dynamic template breaks down the key stages of strategic thinking and problem-solving into a clear, engaging framework. Designed for leaders, teams, and consultants, this structured layout helps guide discussions and optimize workflows. Fully editable and available for PowerPoint, Keynote, and Google Slides for seamless customization.


12 slides
Corporate Hierarchy Structure Presentation
Showcase your Corporate Hierarchy Structure with a sleek and professional design. This template helps visualize organizational roles, reporting relationships, and team structures for clear communication. Perfect for HR teams, business leaders, and project managers, it’s fully customizable and compatible with PowerPoint, Keynote, and Google Slides for easy editing.


21 slides
Glimmer Product Roadmap Presentation
Illuminate your product's future with this vibrant glimmer-themed presentation template! Perfect for outlining your product roadmap, it allows you to present key milestones, features, and timelines in a visually engaging way. Captivate your audience and keep them informed about your exciting journey ahead. Compatible with PowerPoint, Keynote, and Google Slides.


6 slides
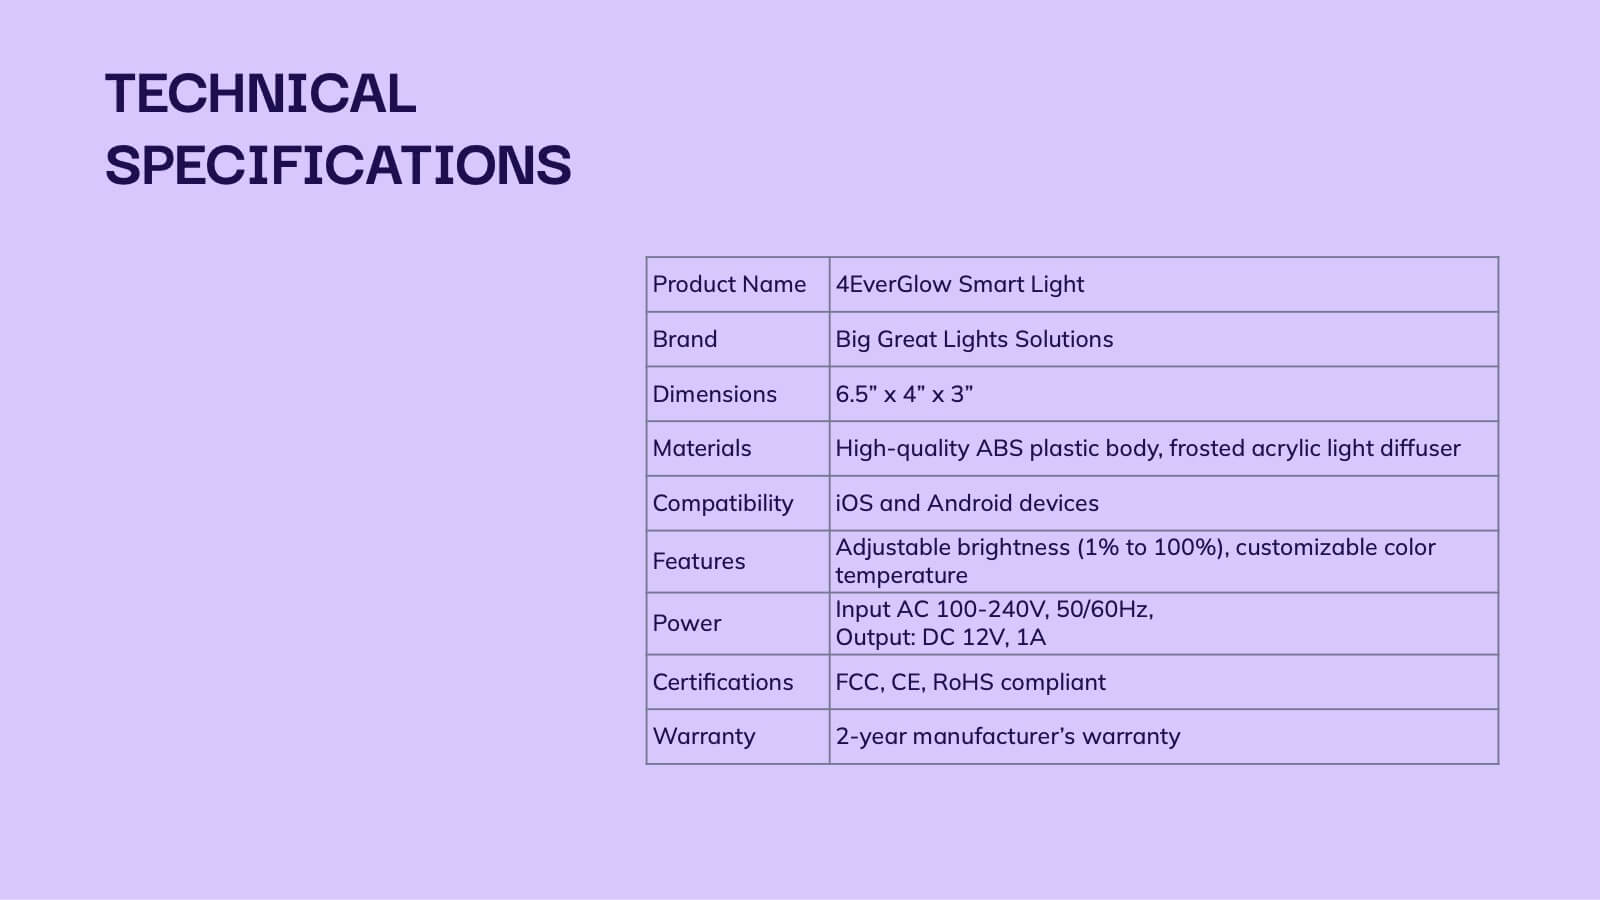
Informational Data Table Overview Presentation
Present your tasks with clarity using this Informational Data Table Overview presentation. Perfect for team planning, status updates, or project management, this slide helps you organize tasks by name, due date, priority, and assignment. Visual indicators make it easy to track progress at a glance. Fully editable in PowerPoint, Canva, and Google Slides.


22 slides
Event Agenda Presentation
Organize your event with precision using this Event Agenda presentation template. Designed for clarity and impact, it includes slides for conference overviews, speaker introductions, session descriptions, and networking opportunities. Perfect for business conferences or workshops, this template is compatible with PowerPoint, Keynote, and Google Slides, ensuring your event runs smoothly and professionally.


23 slides
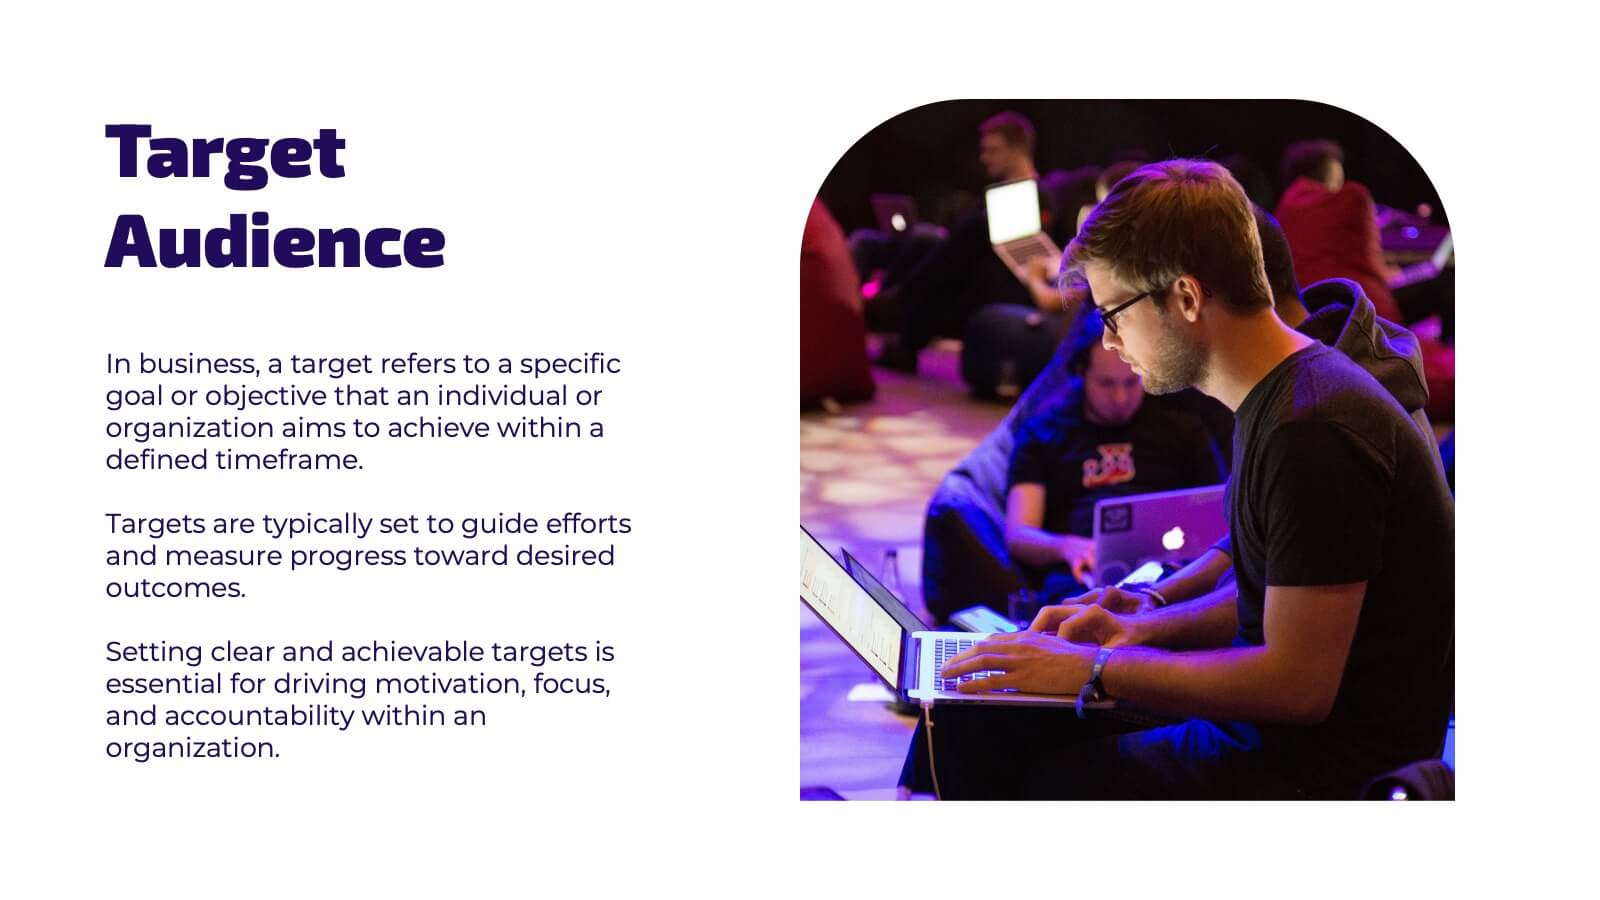
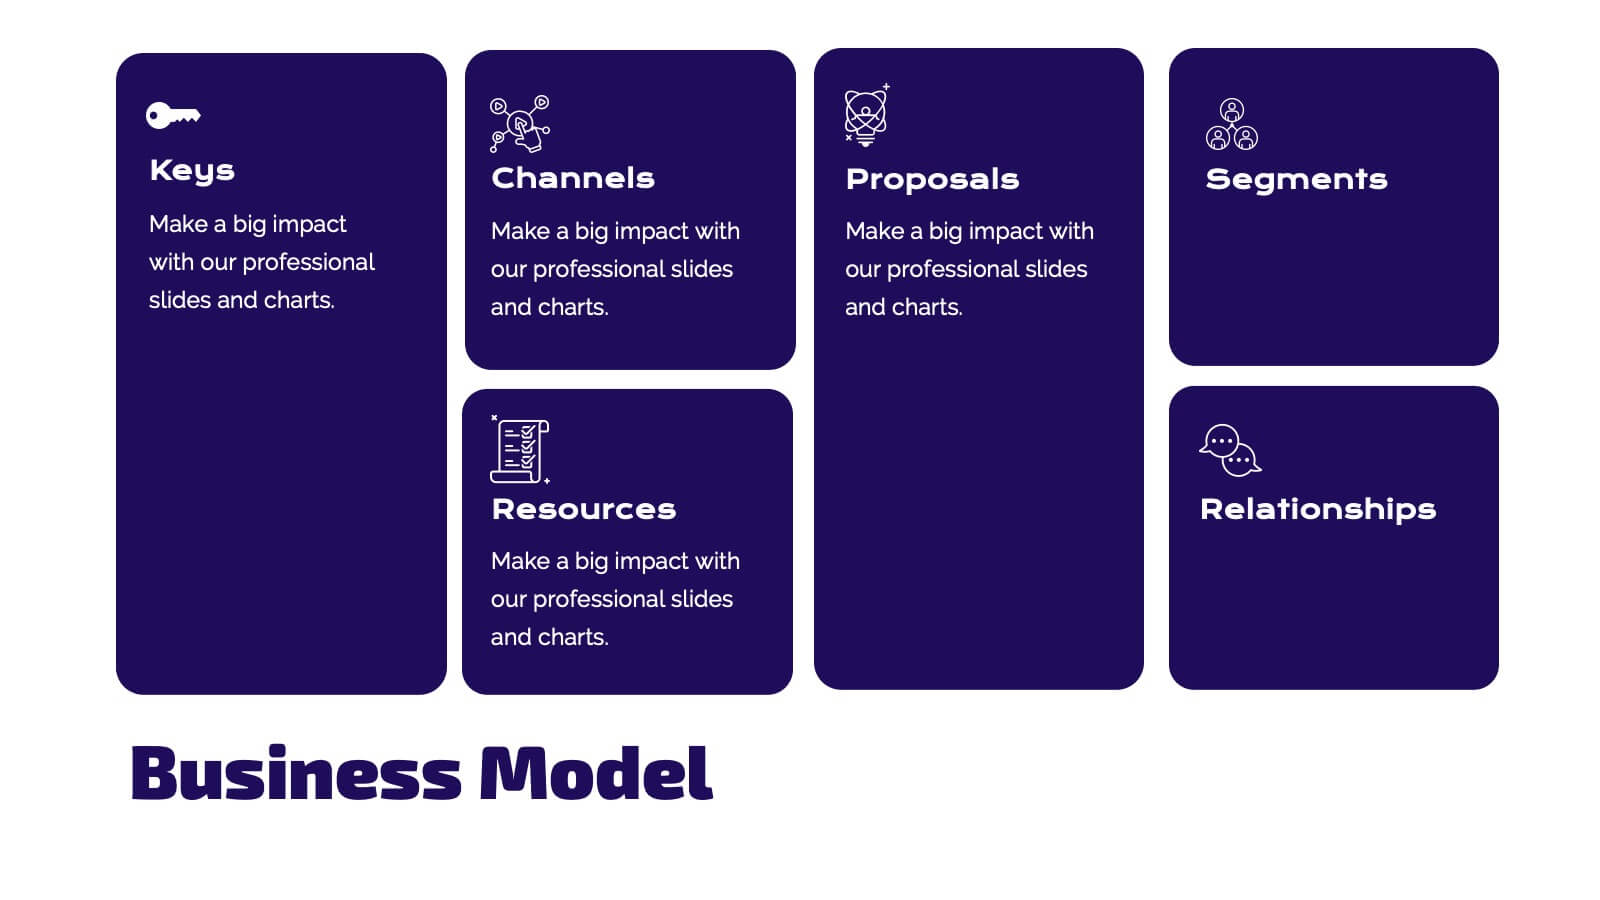
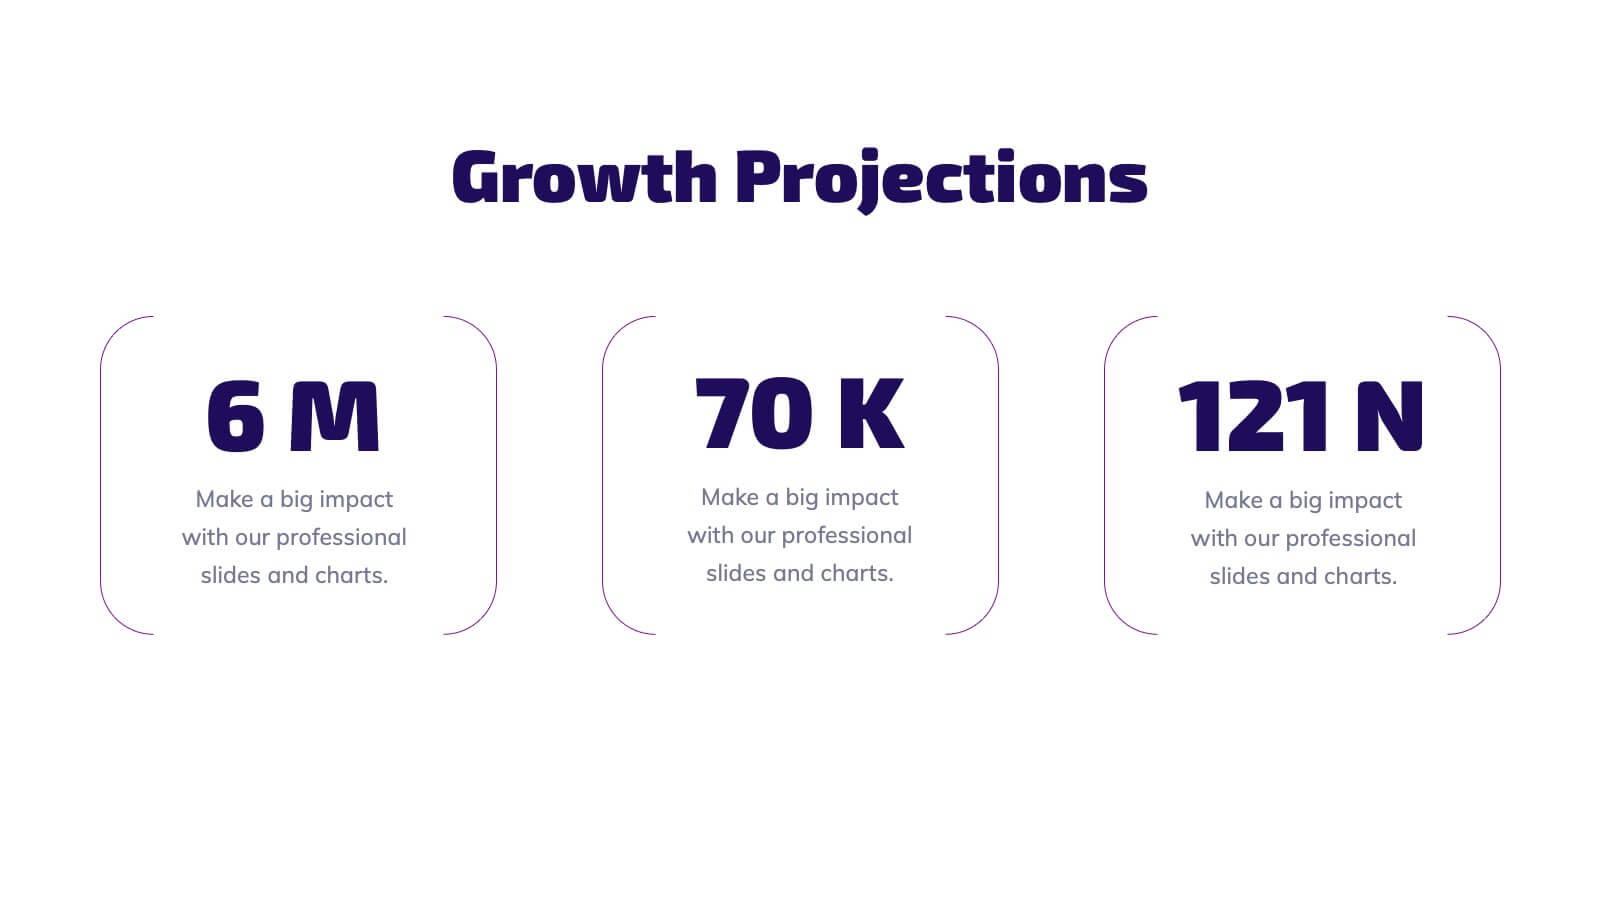
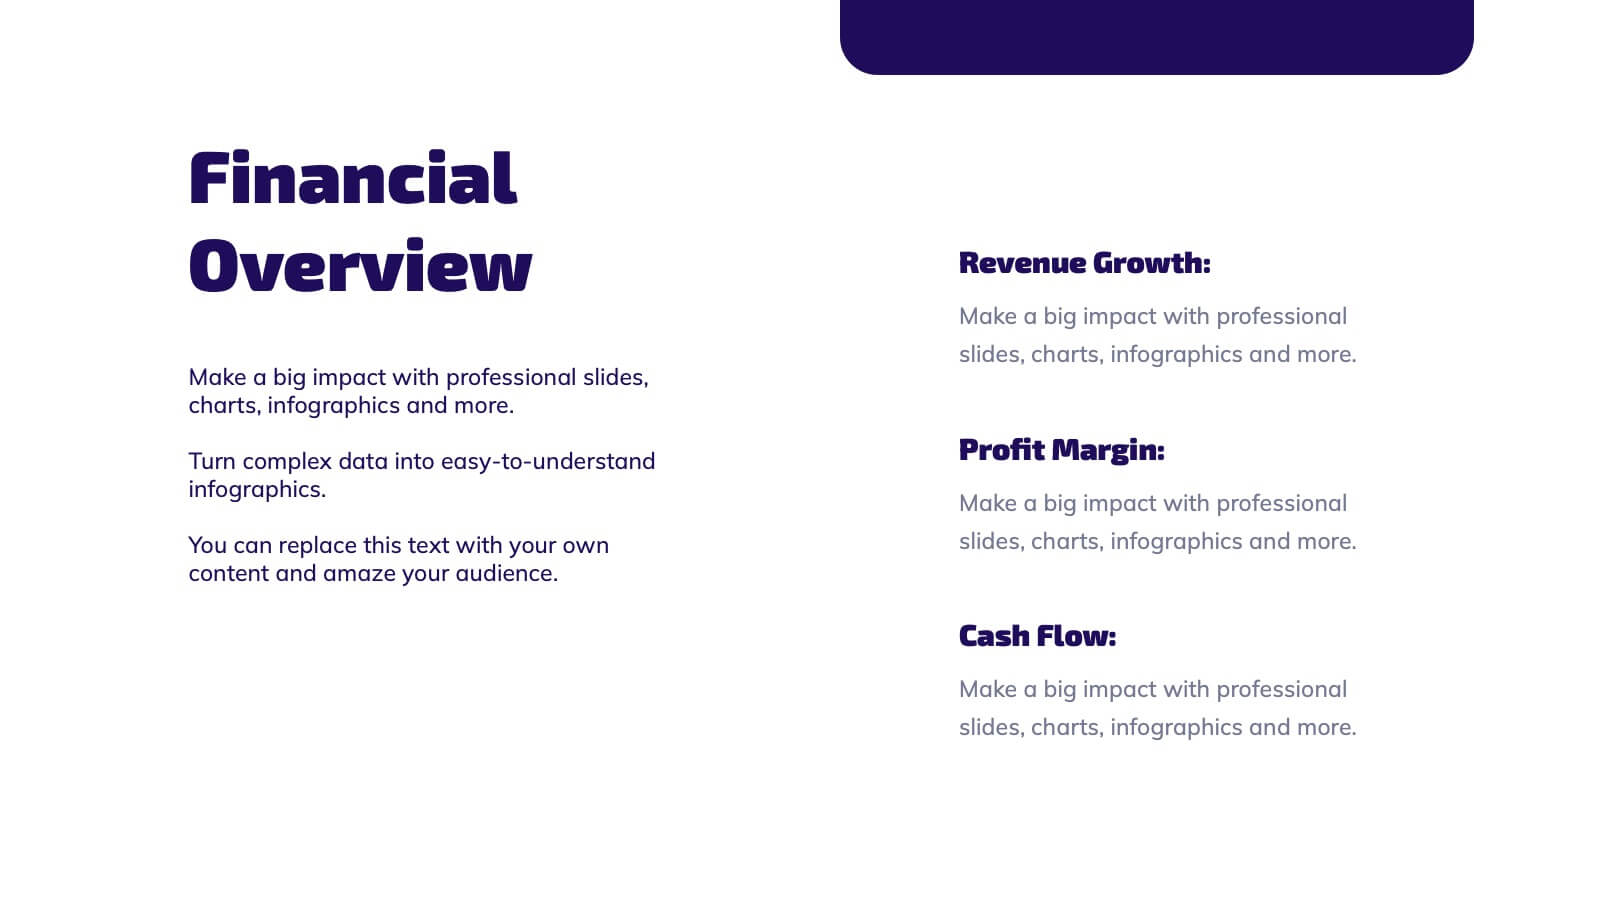
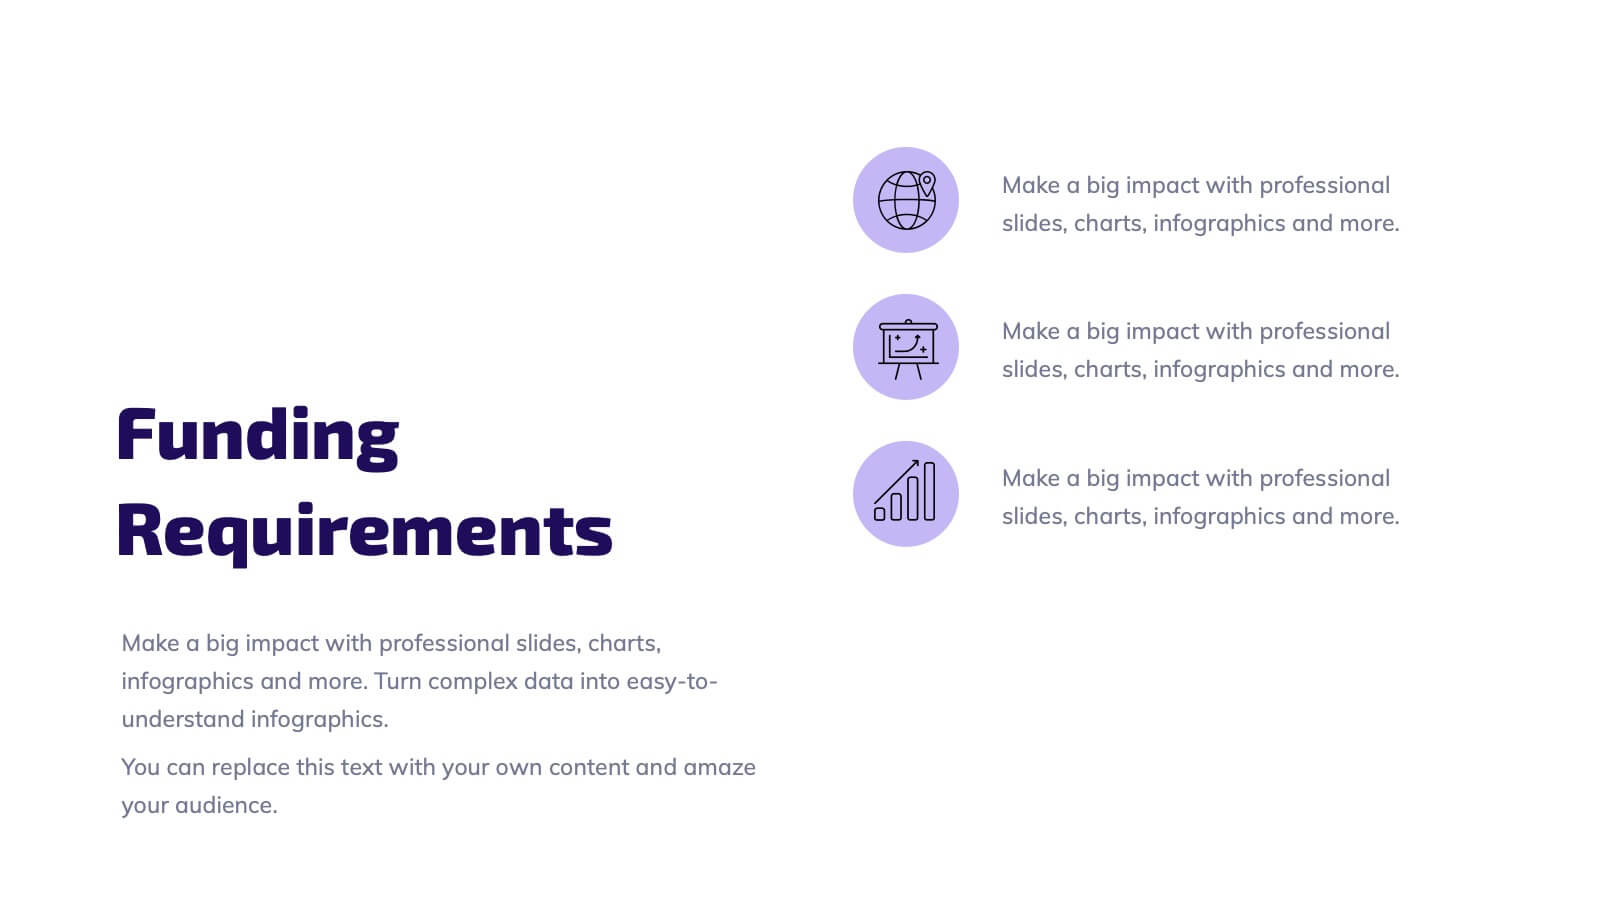
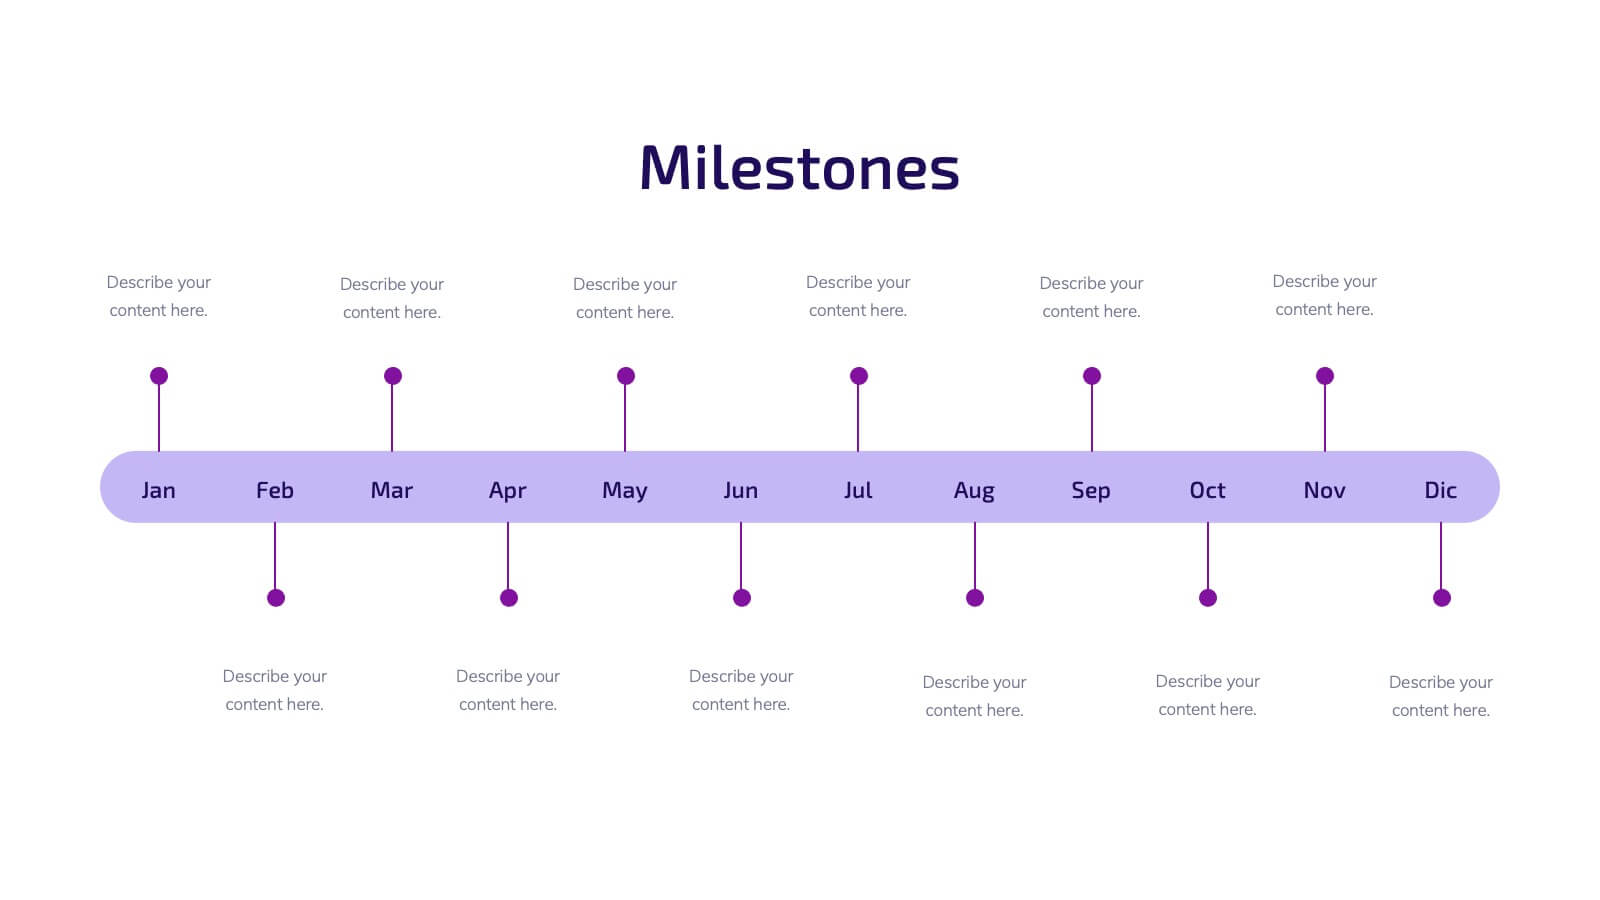
Illume Startup Pitch Deck Presentation
Light up your startup journey with this captivating presentation template! Perfect for pitching your business idea, it guides you through key elements like market analysis, financial projections, and growth strategies. With a modern design that grabs attention, this template will help you shine in front of investors. Compatible with PowerPoint, Keynote, and Google Slides.


6 slides
Travel Tips Infographic
By following travel tips, you can enhance your travel experience, mitigate potential challenges, and make the most of your adventures. This infographic template is designed to provide travelers with essential tips and guidelines for a successful and enjoyable trip. Whether you're planning a vacation, business trip, or backpacking adventure, this infographic offers valuable information to help you make the most out of your travel experience. This template is a valuable tool for enhancing travel experiences and ensuring a smooth and memorable trip. Compatible with Powerpoint, Keynote, and Google Slides.


20 slides
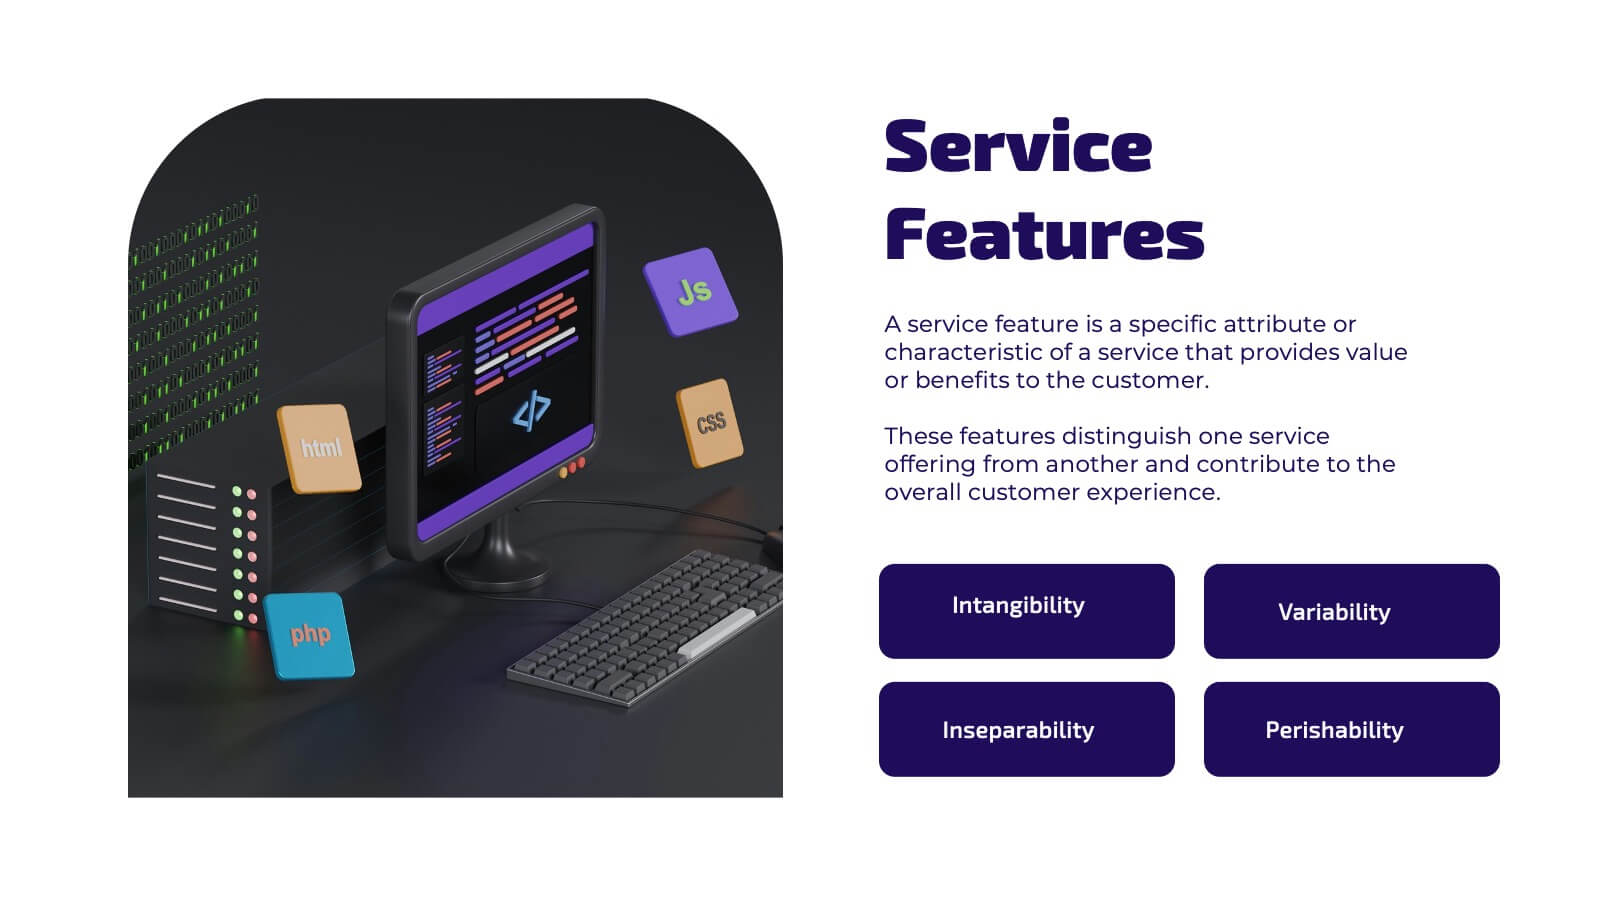
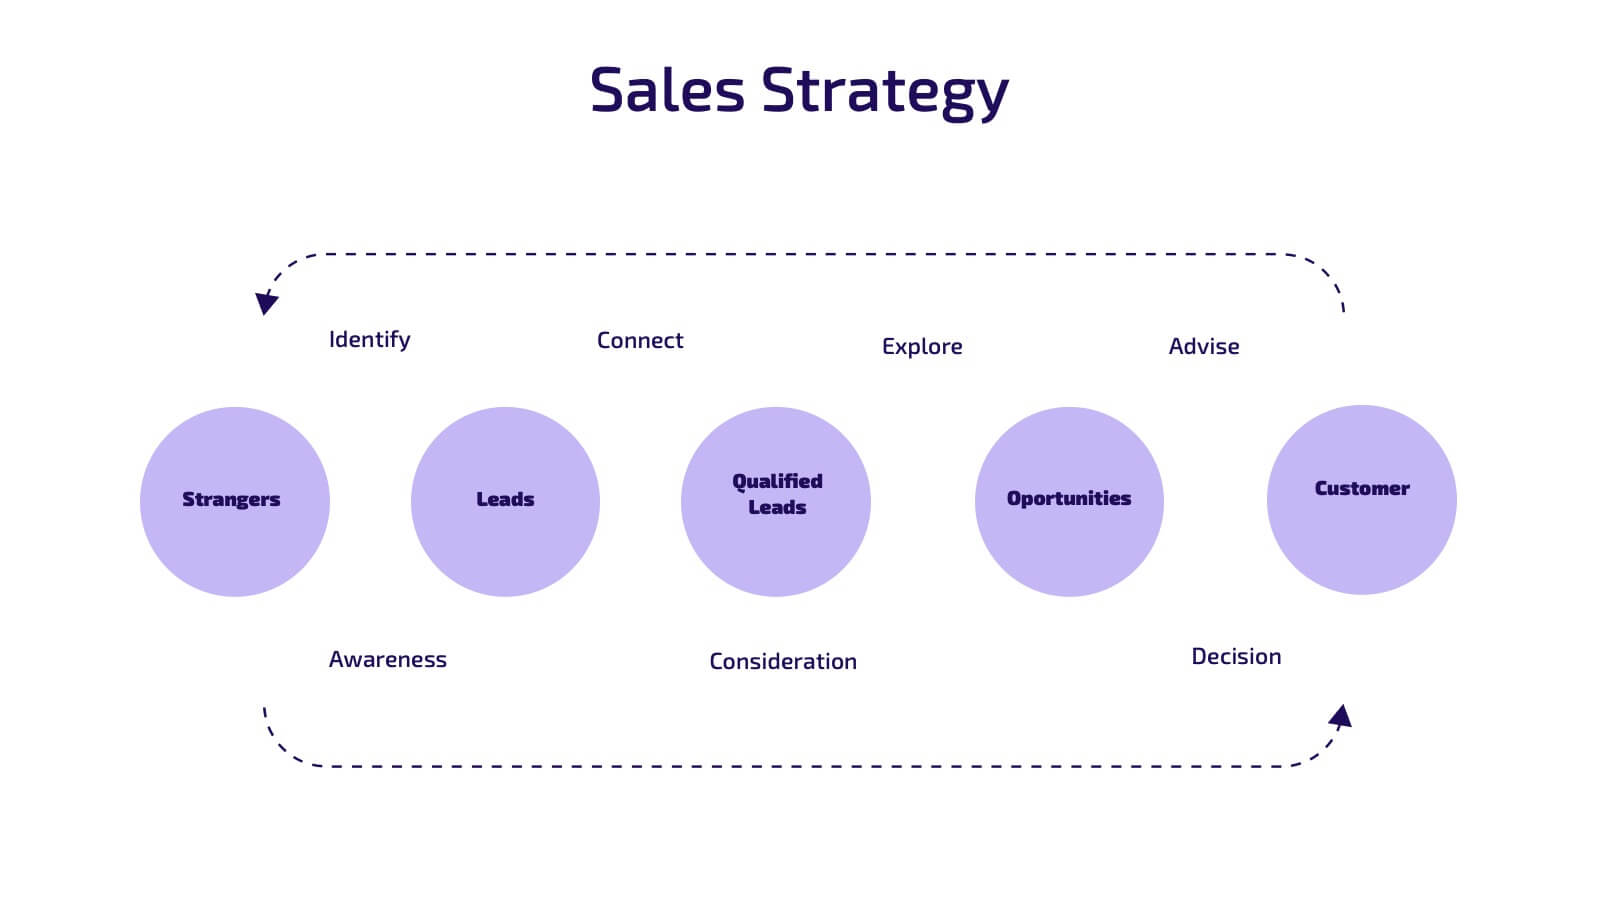
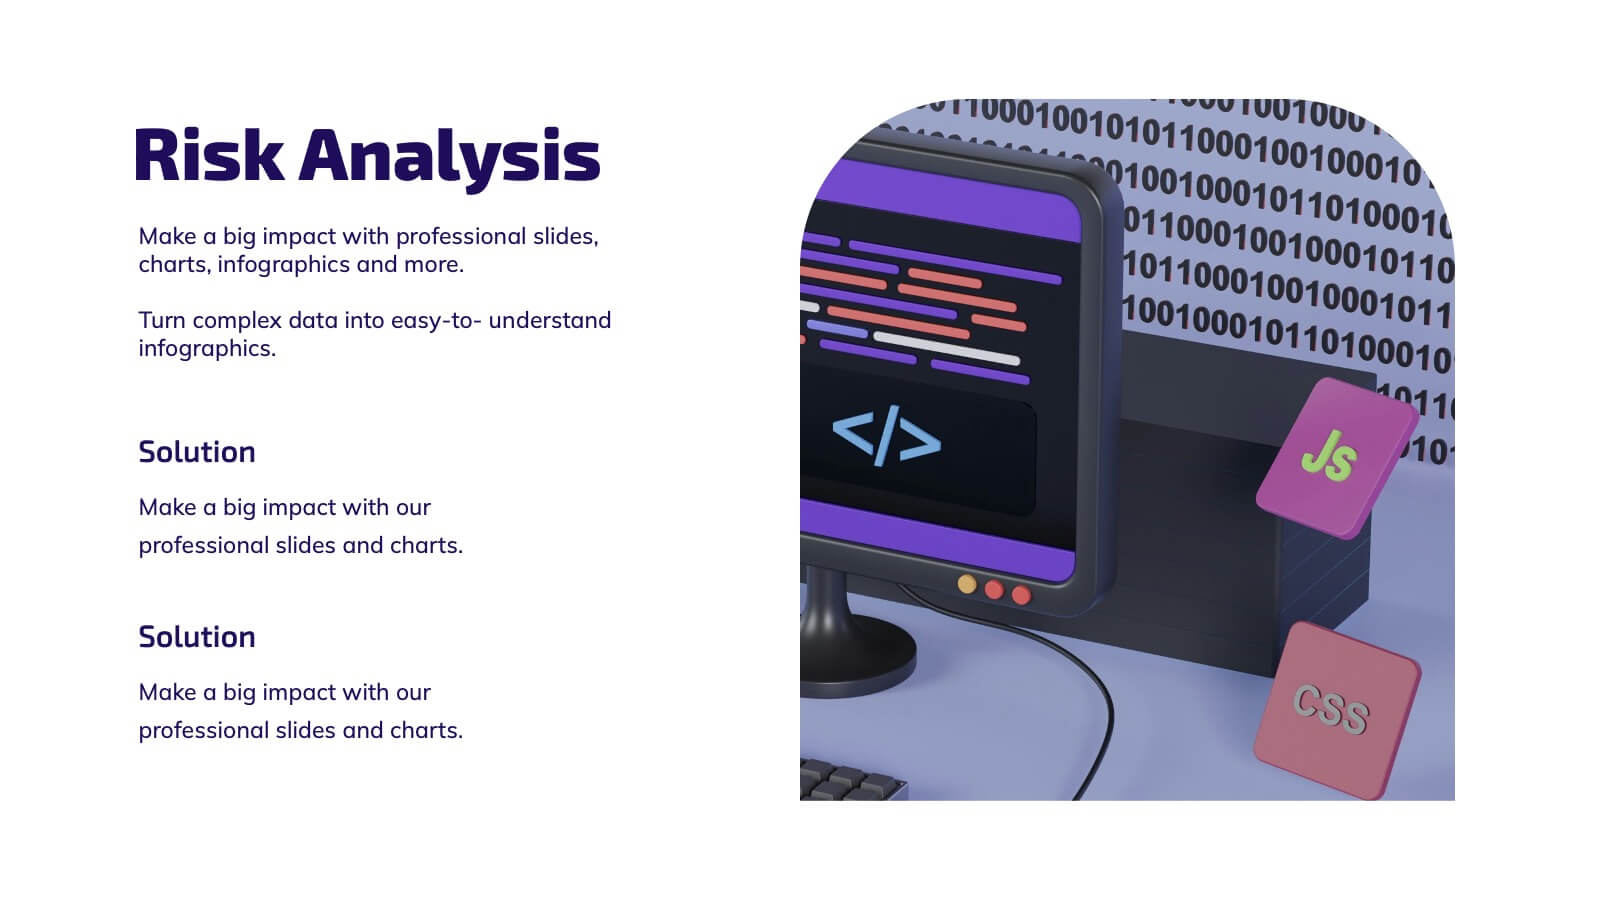
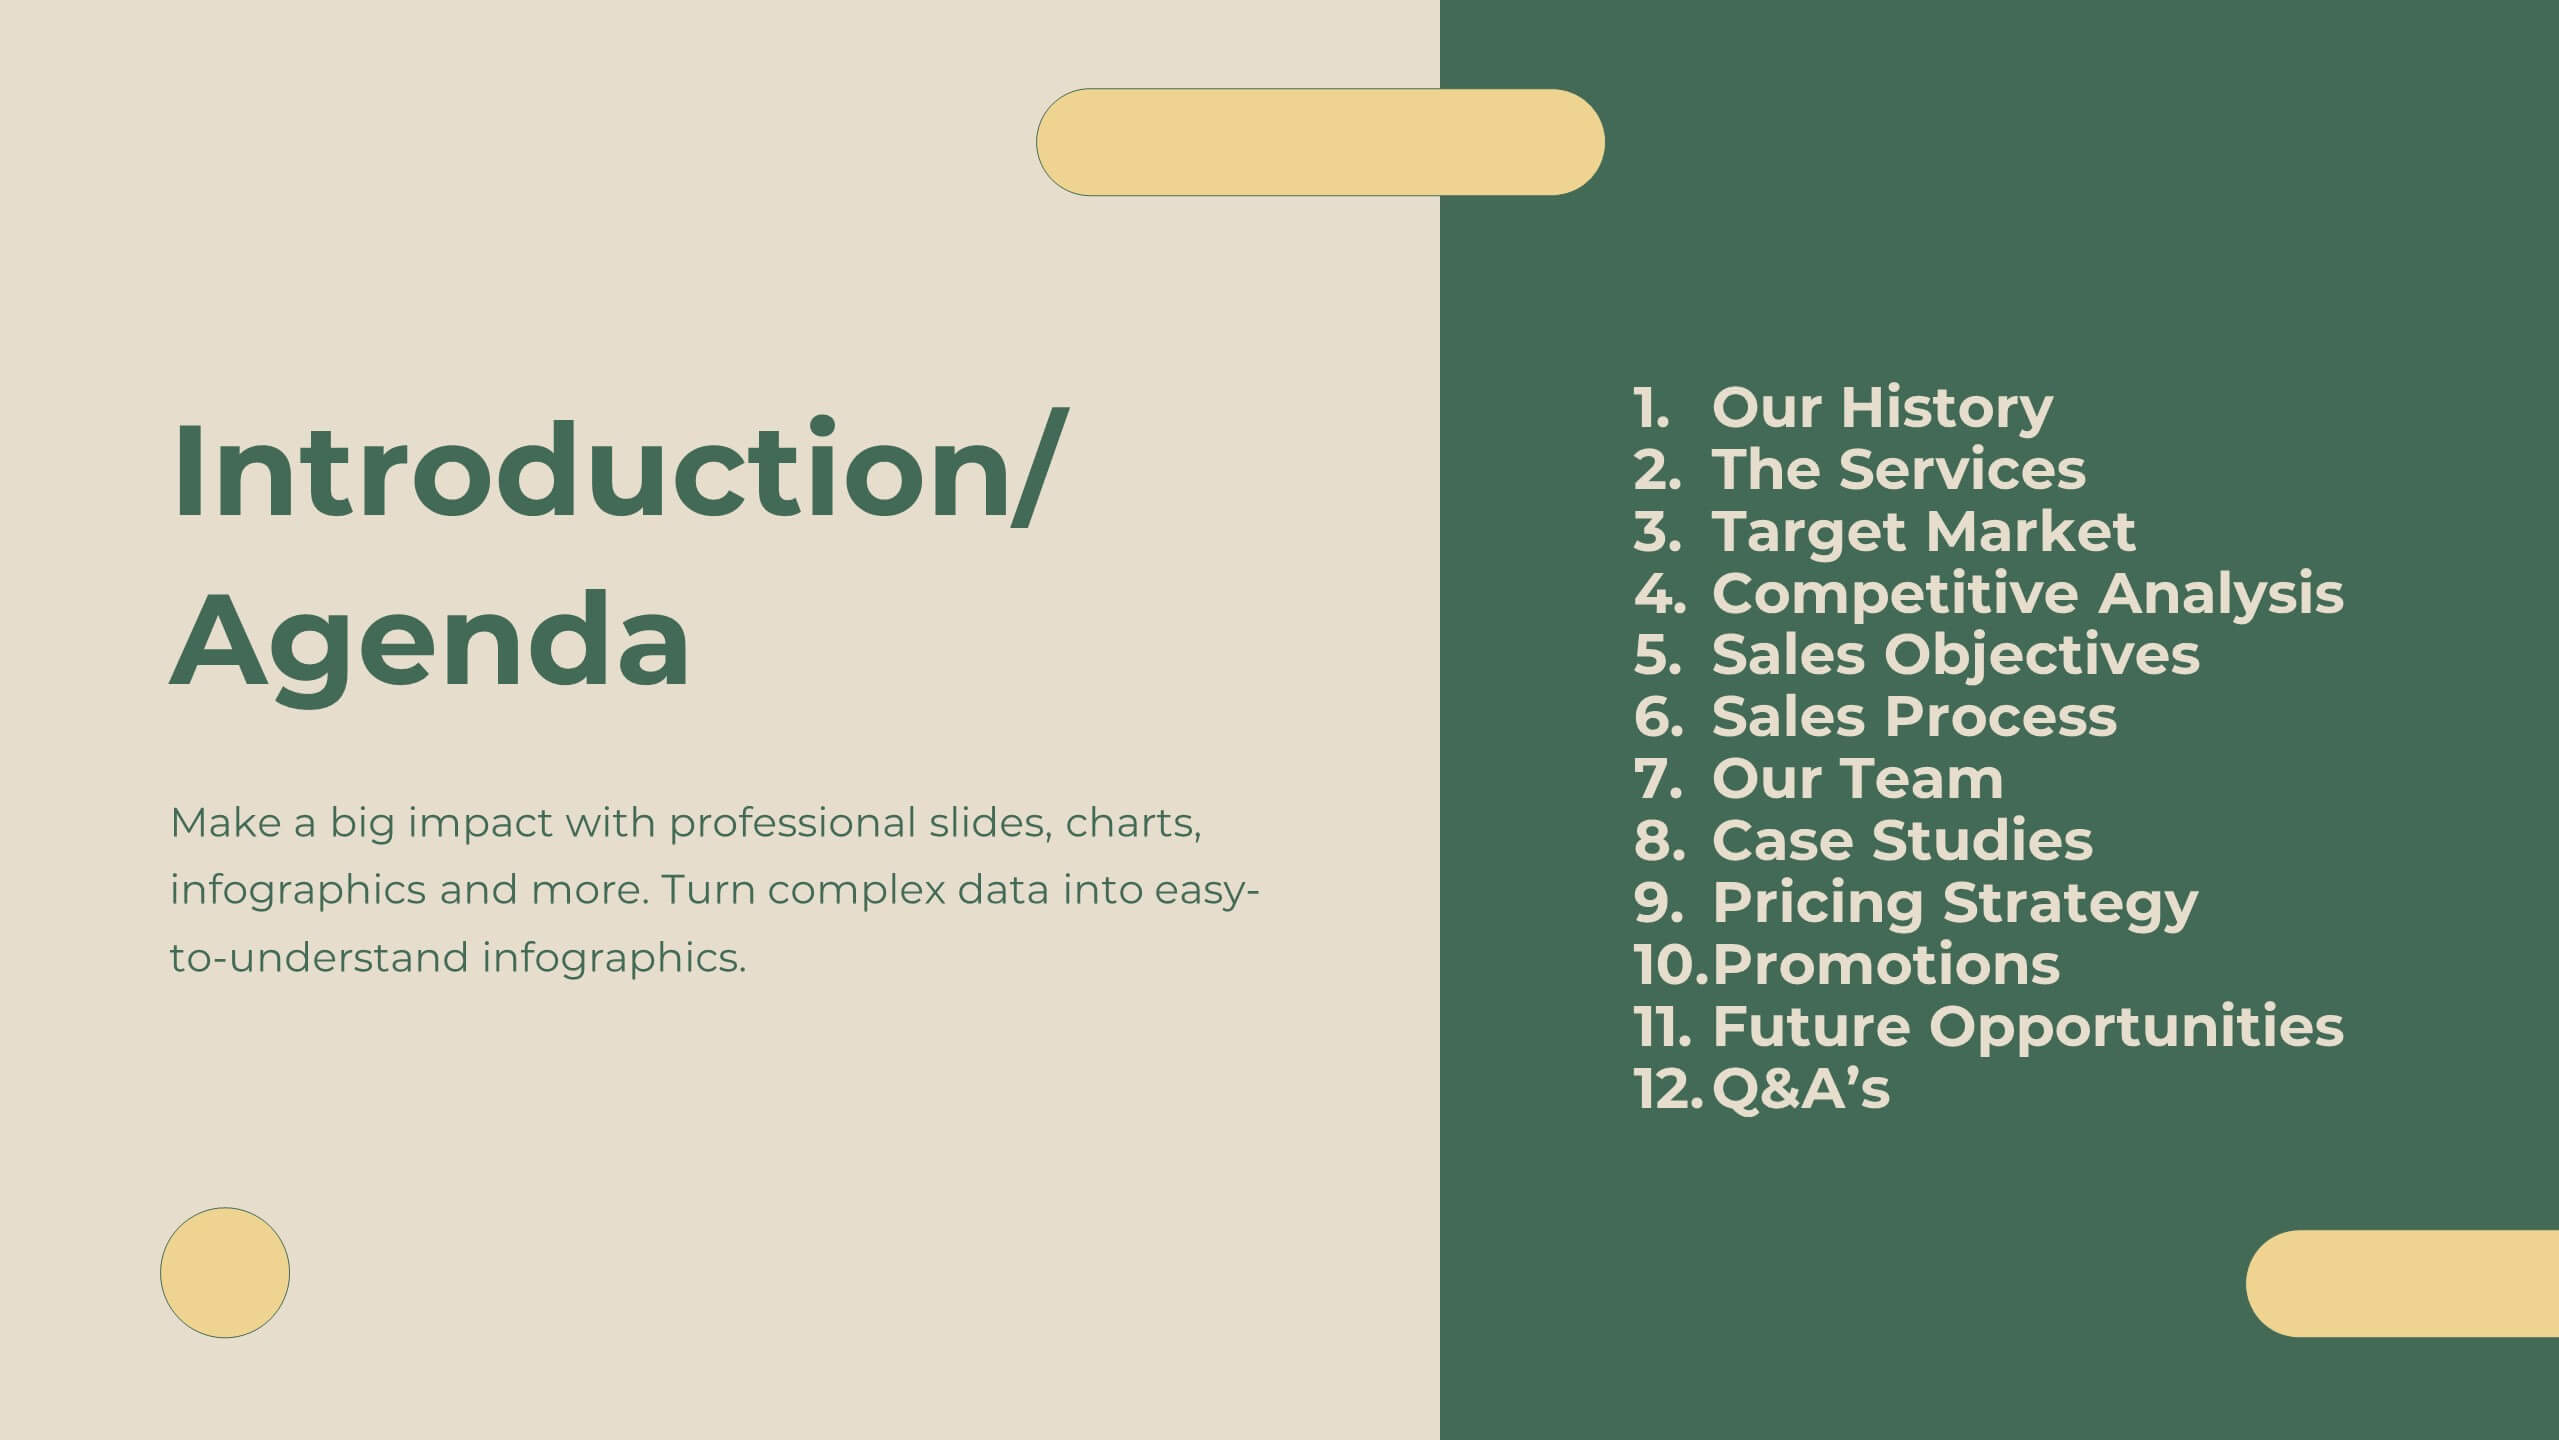
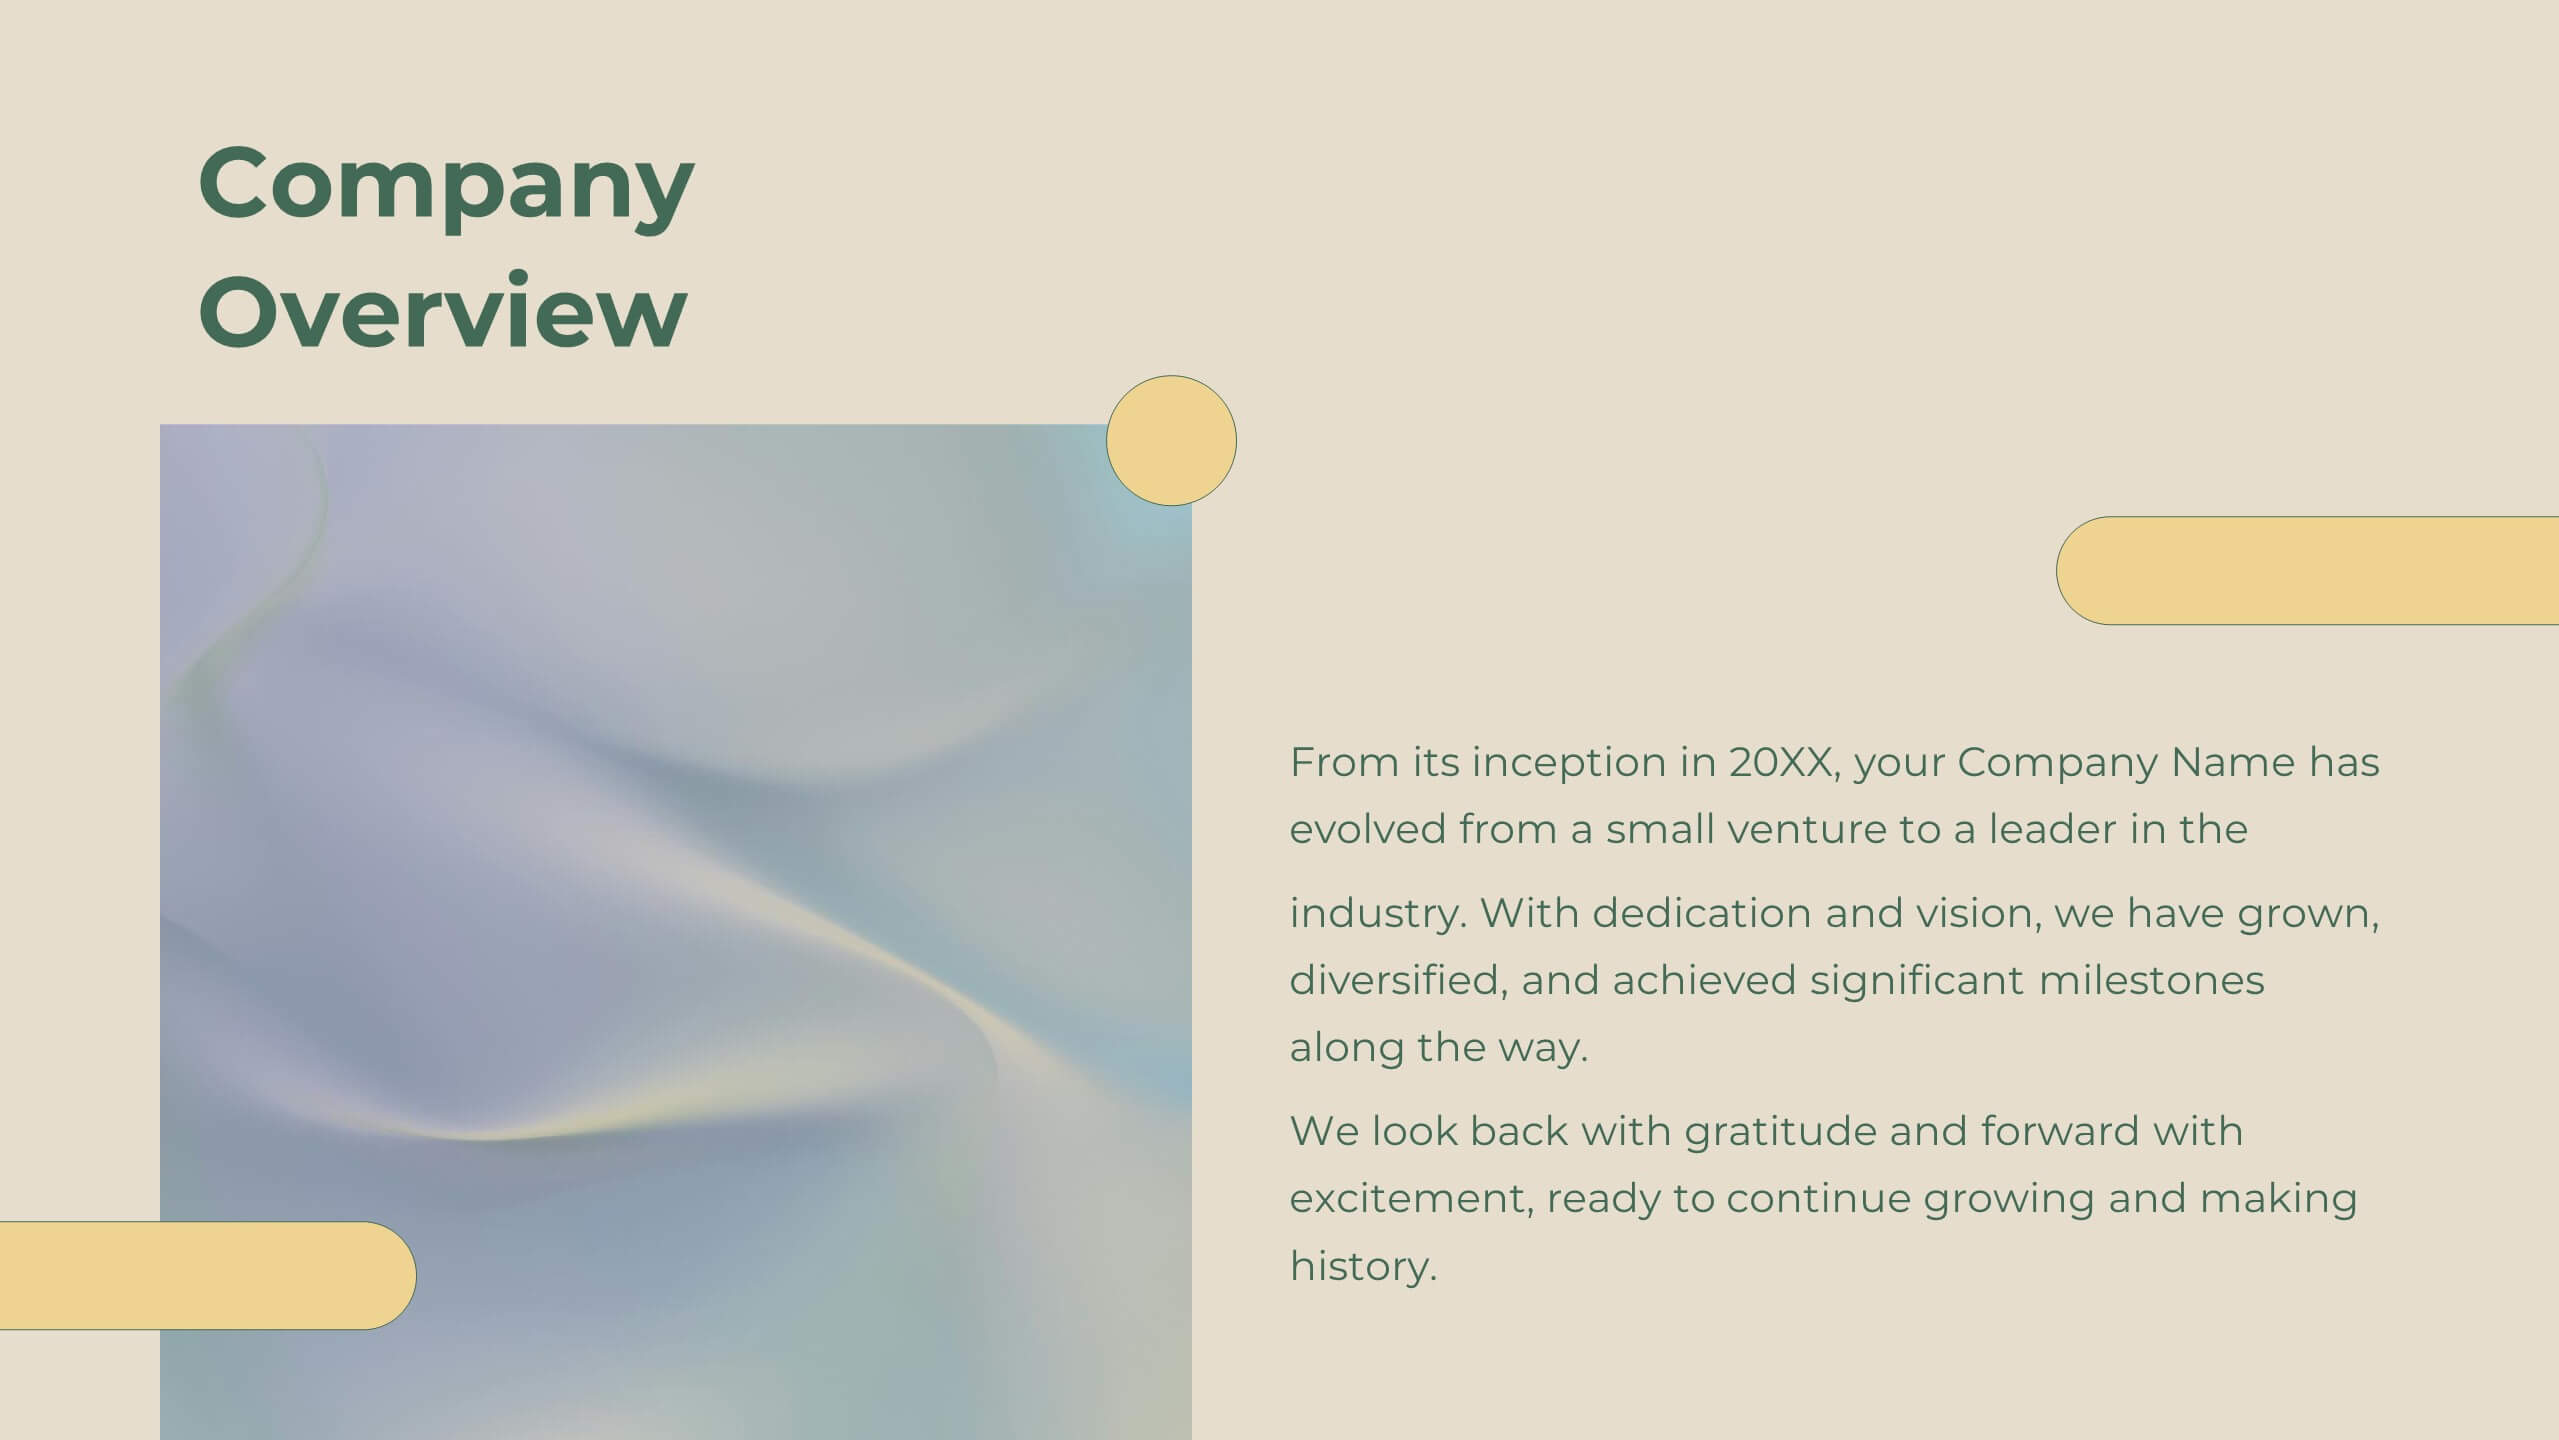
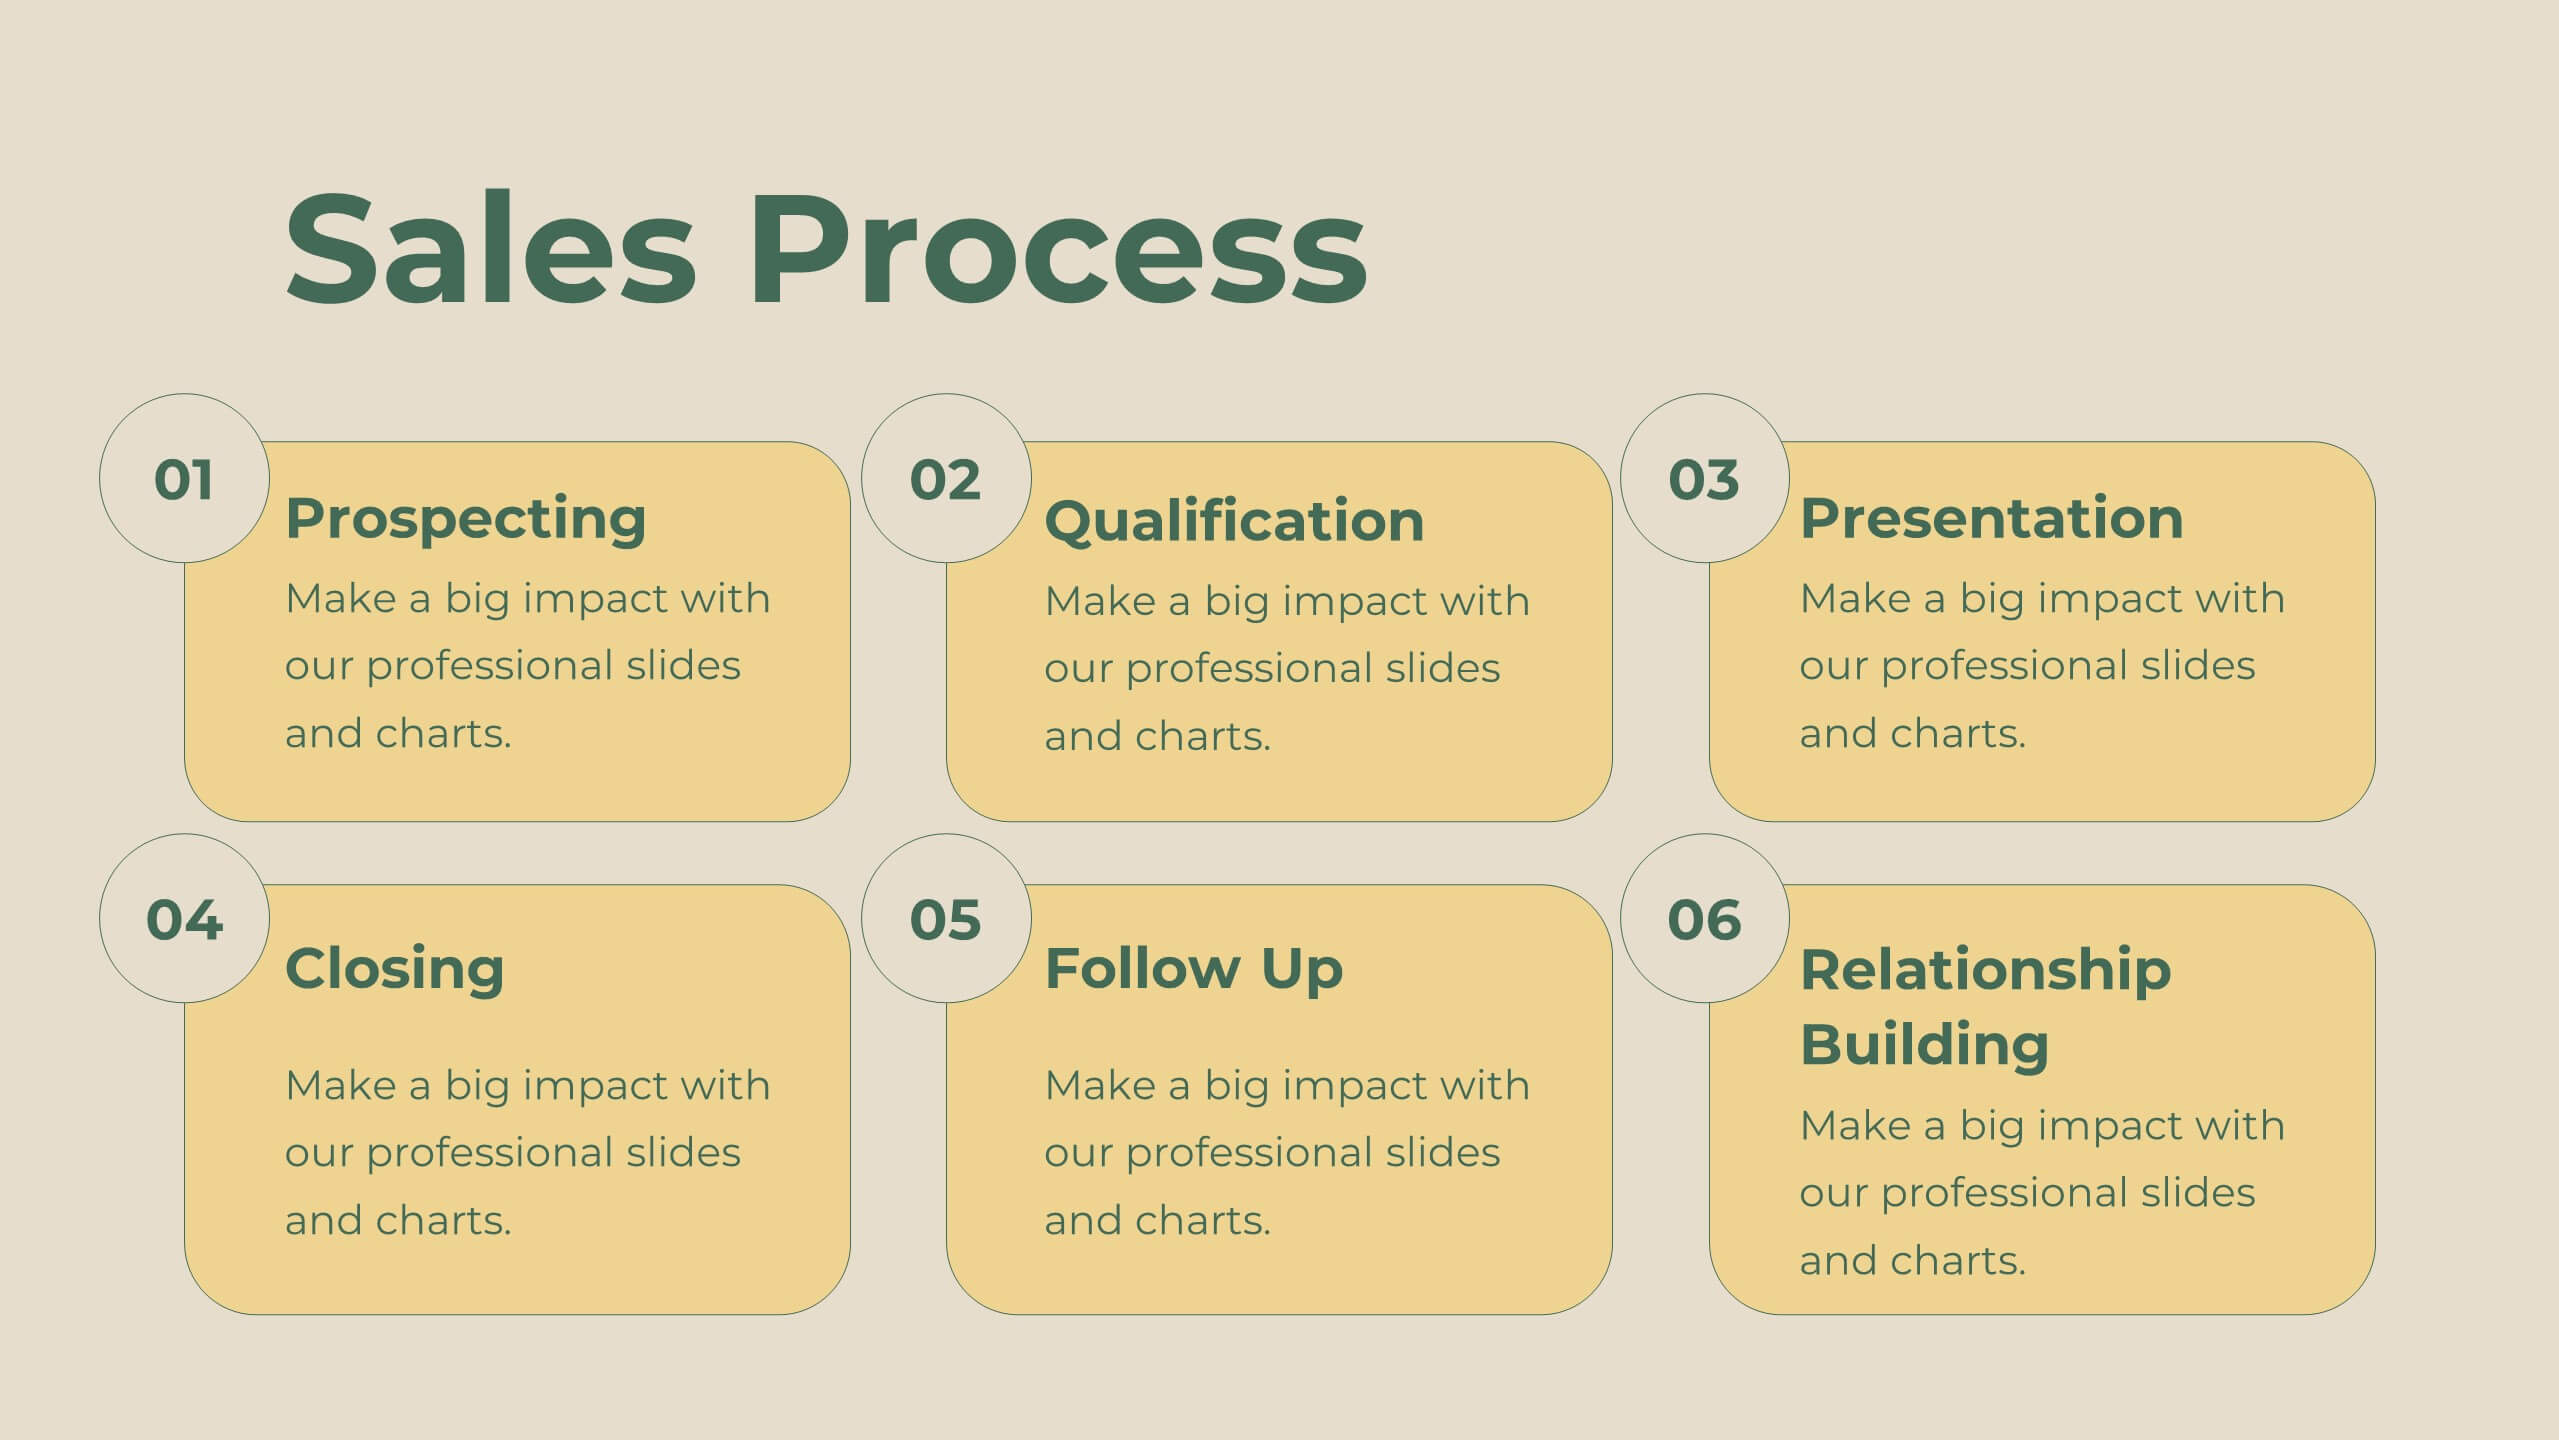
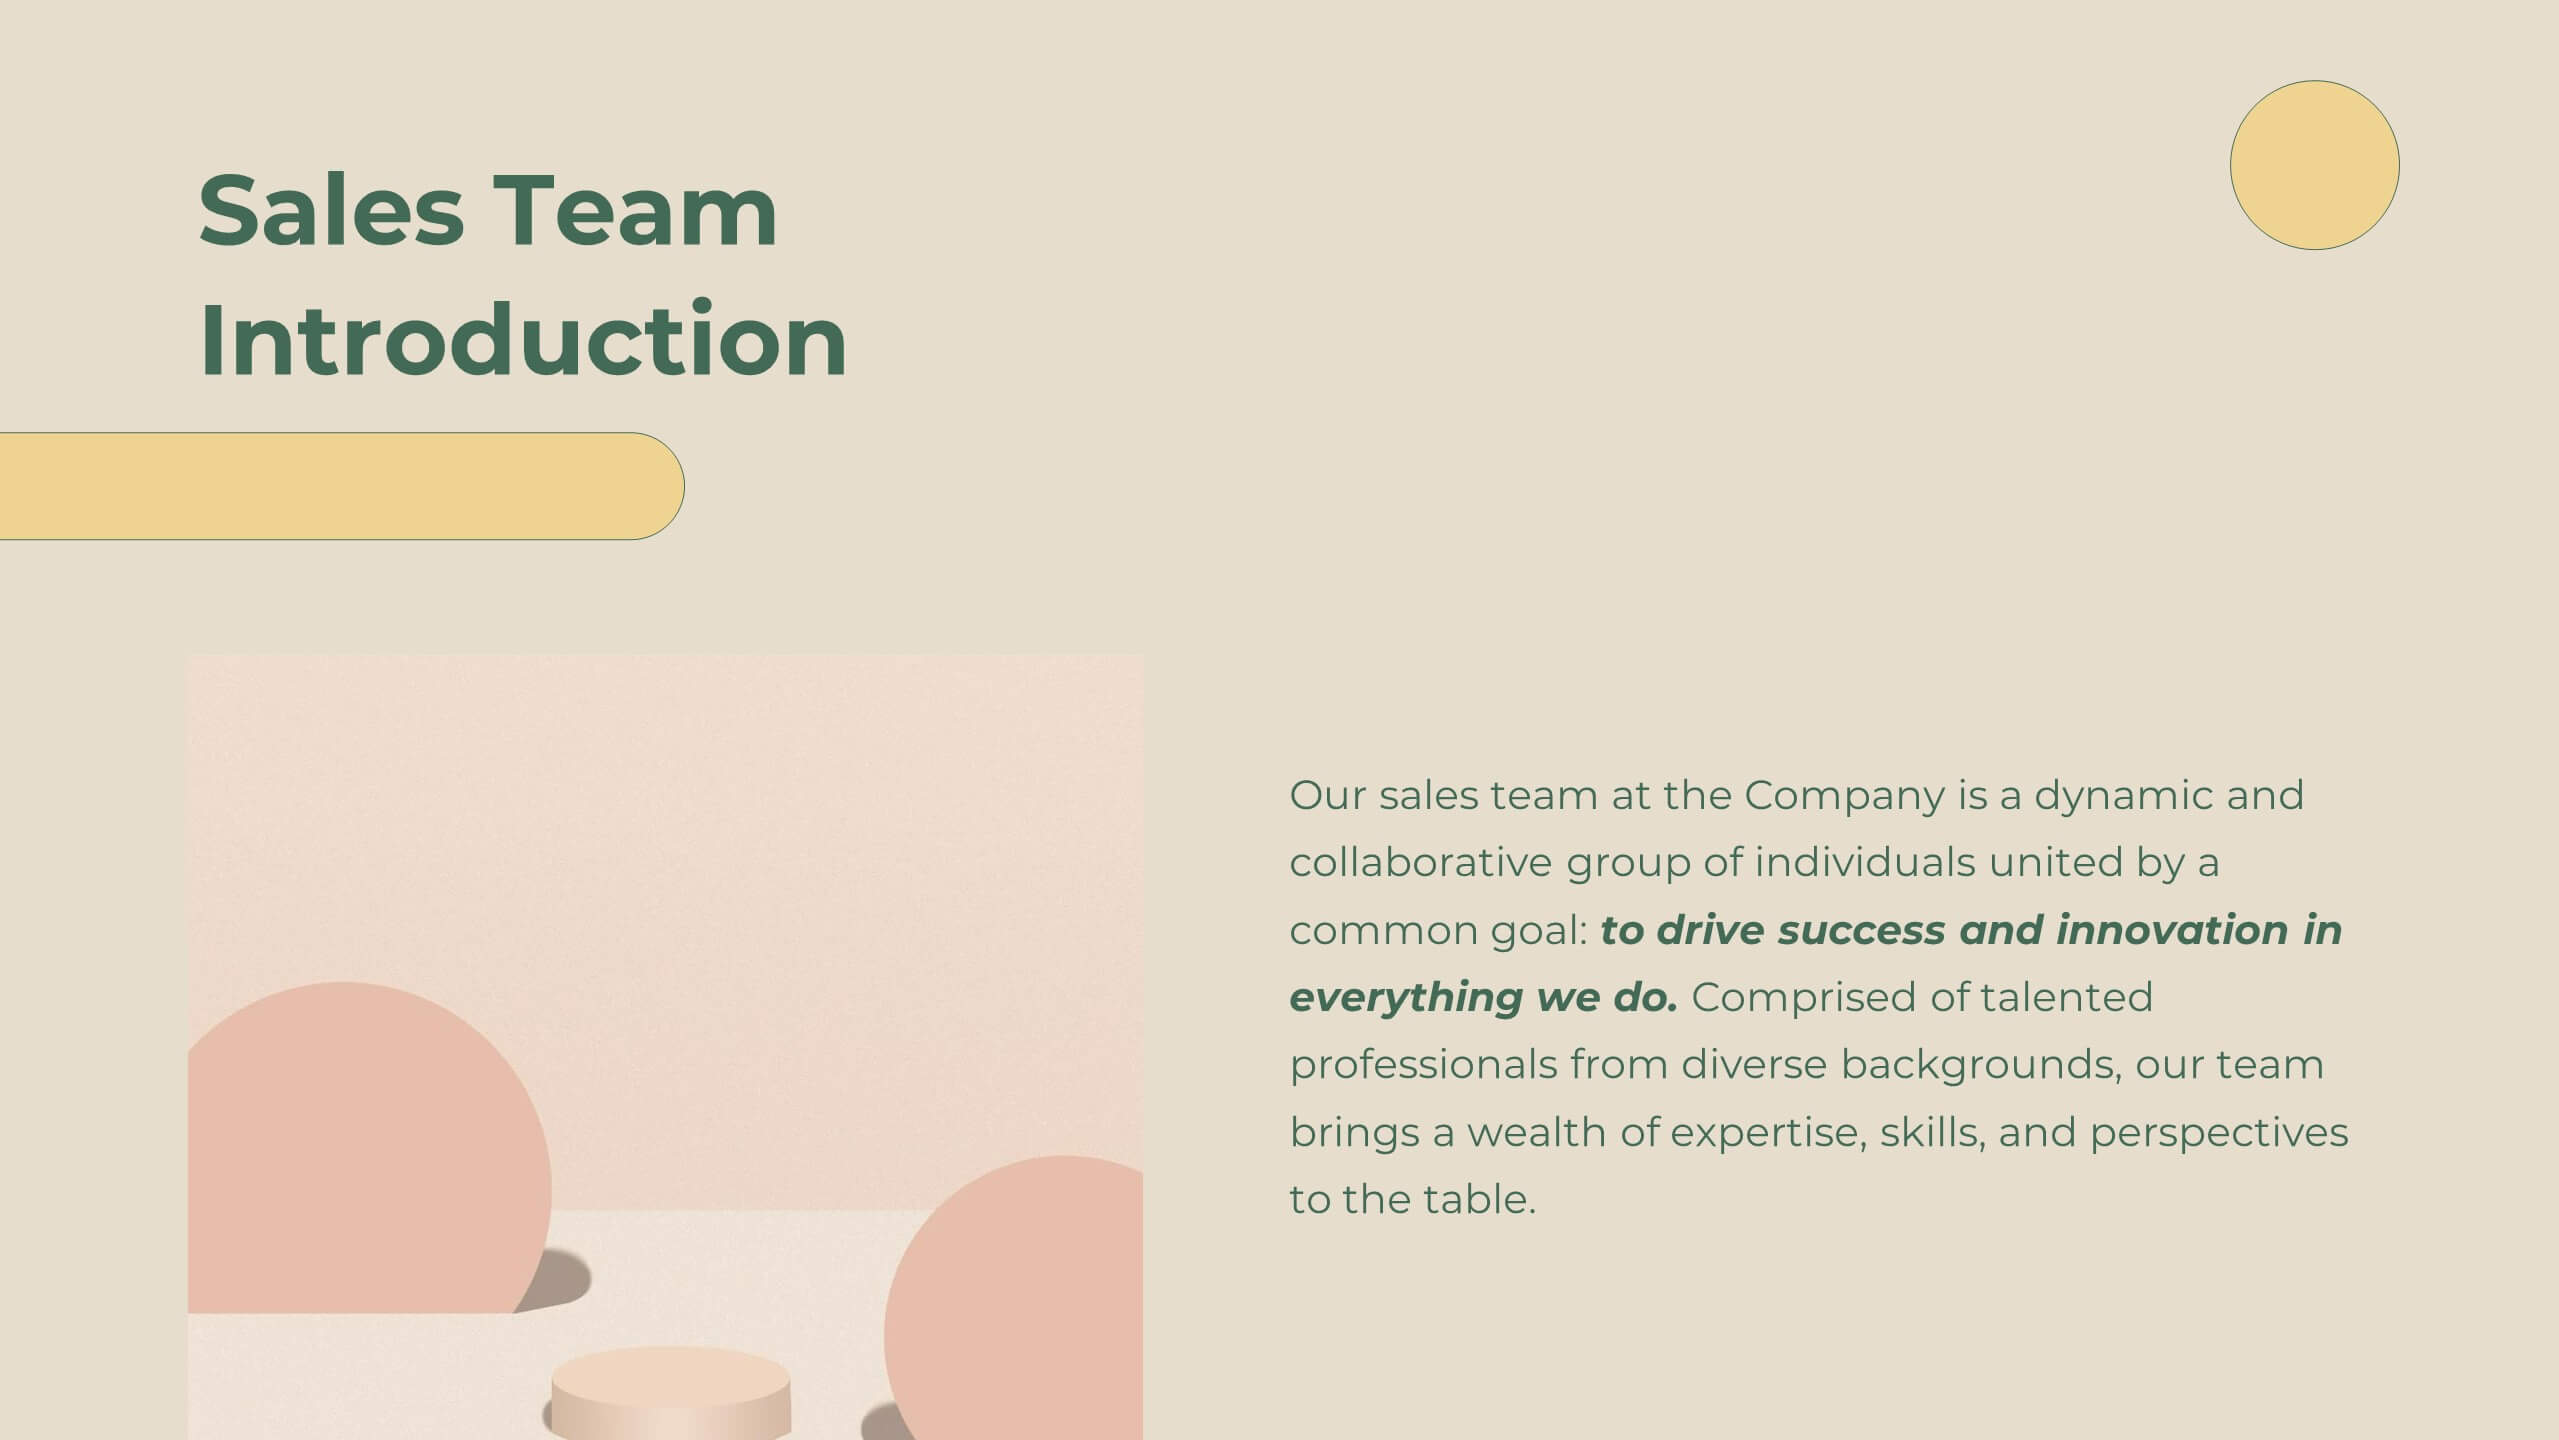
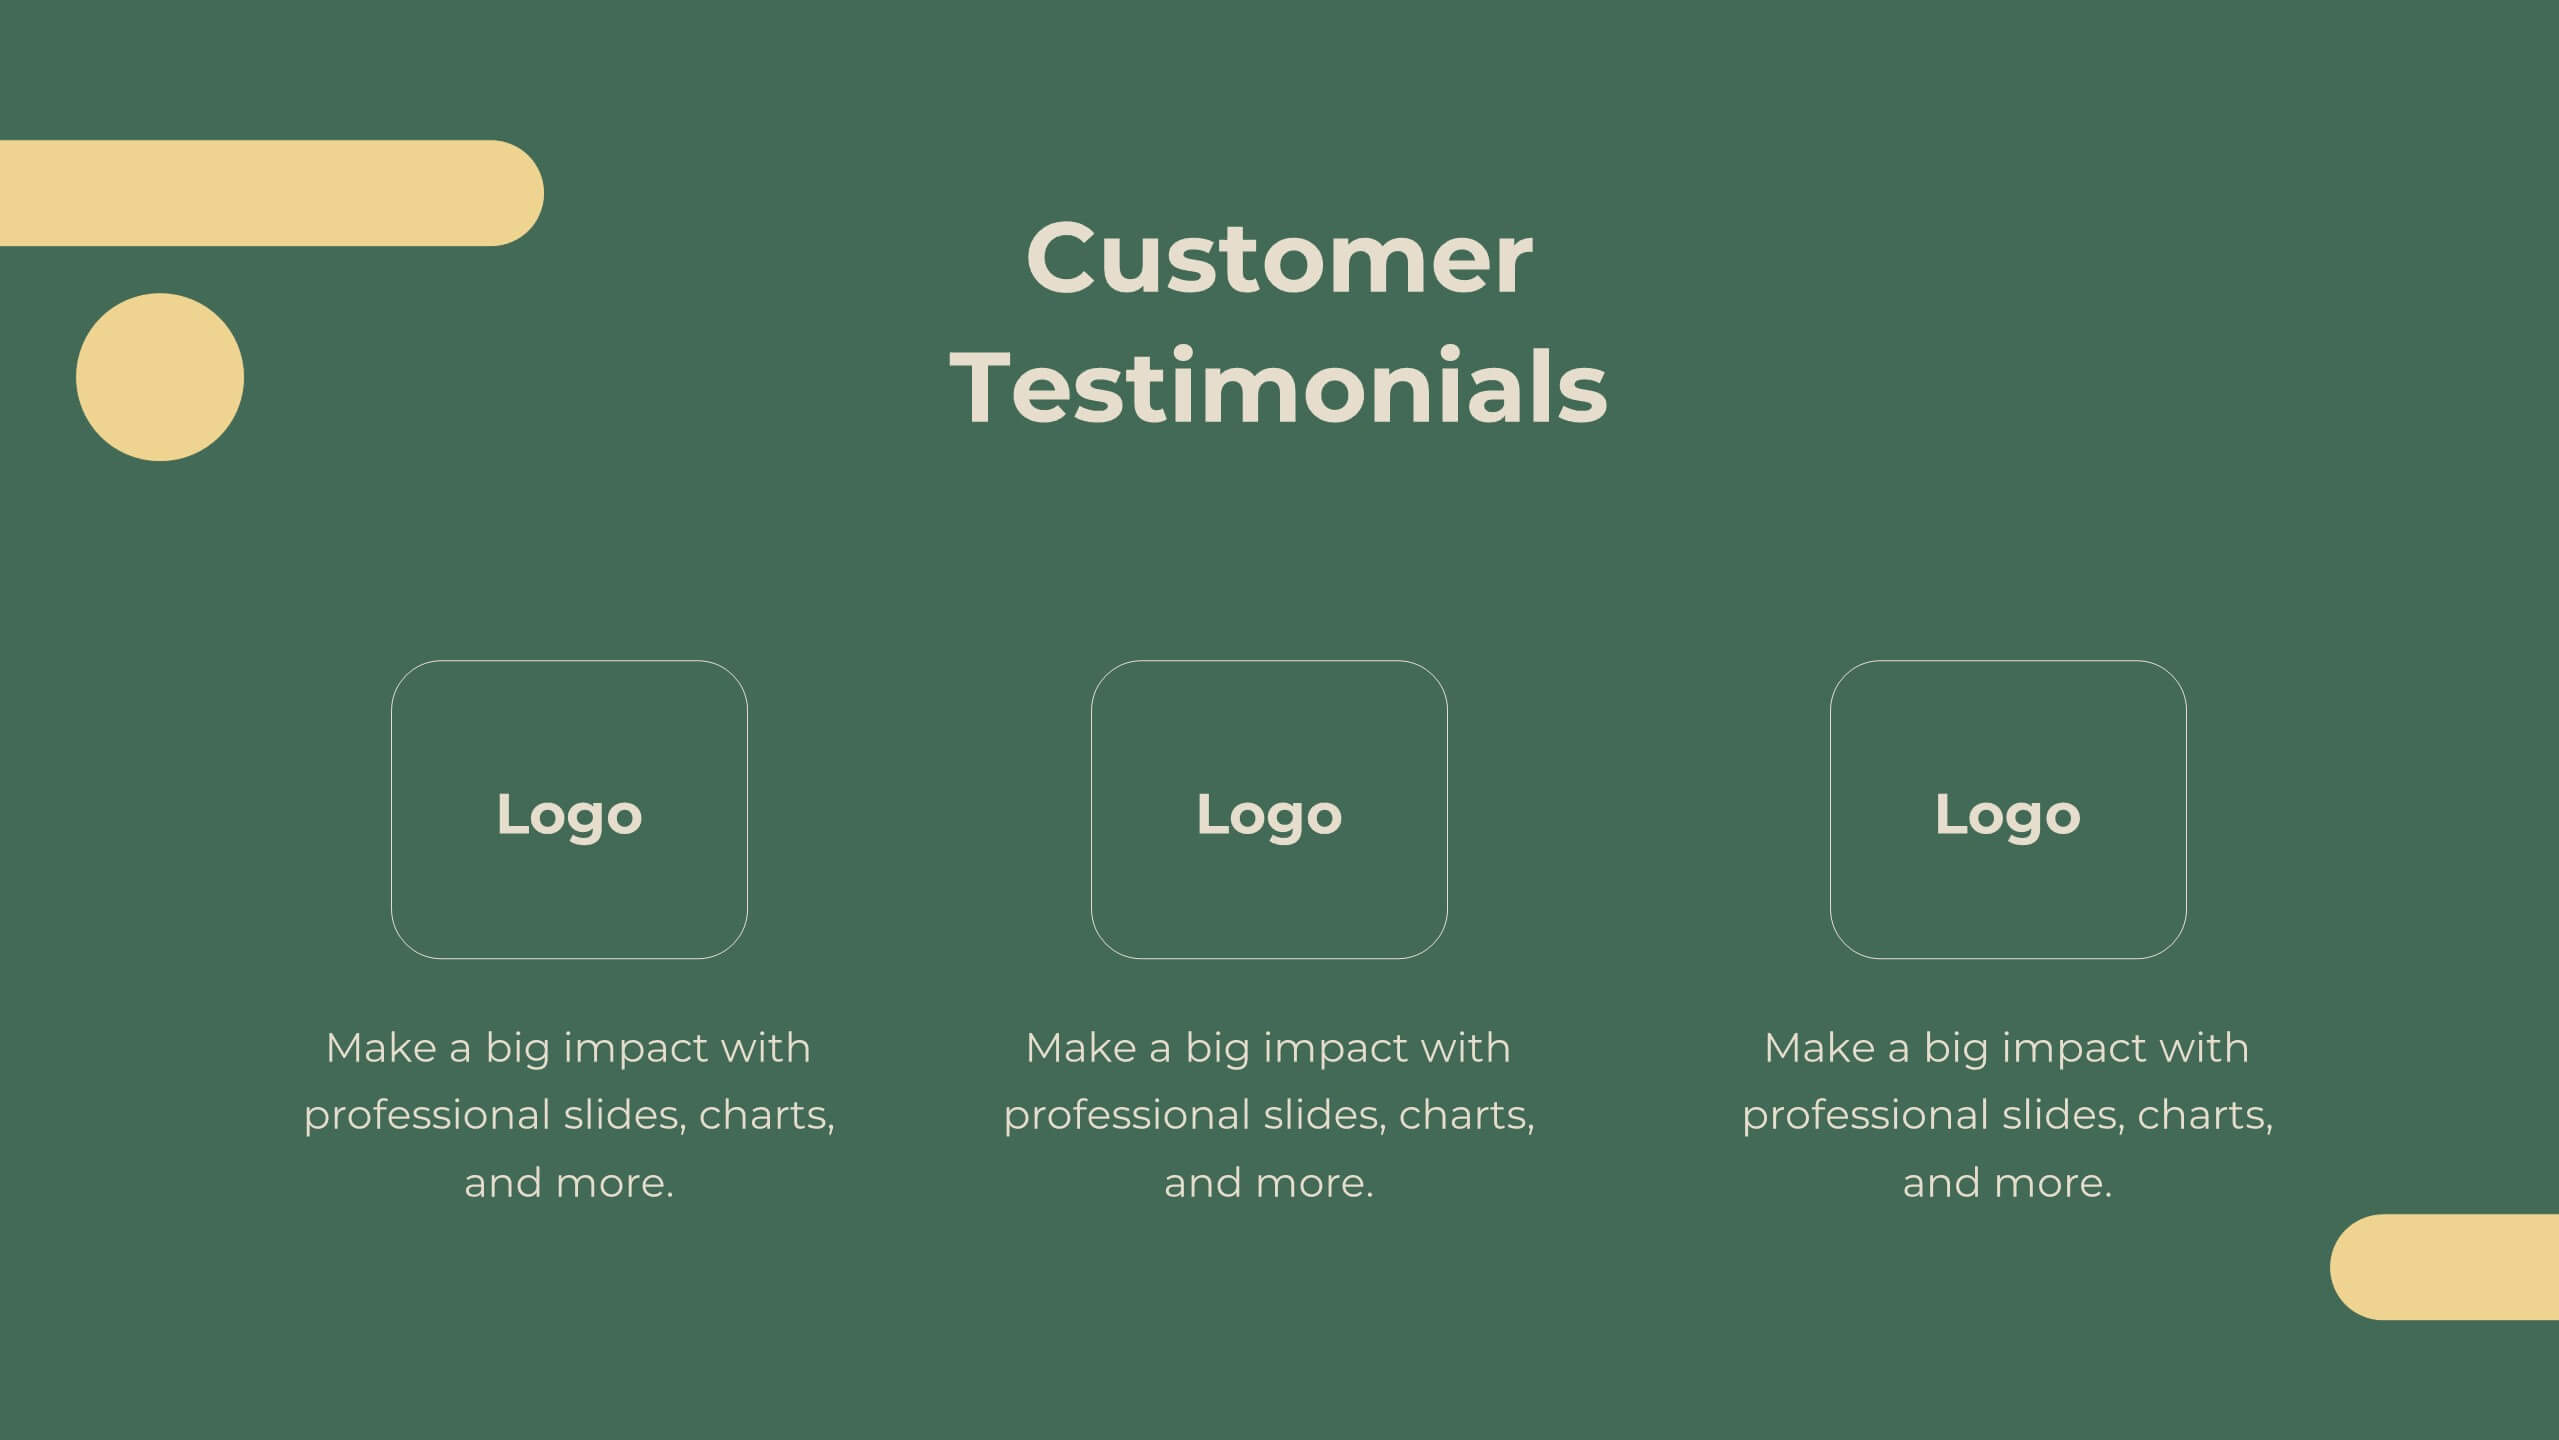
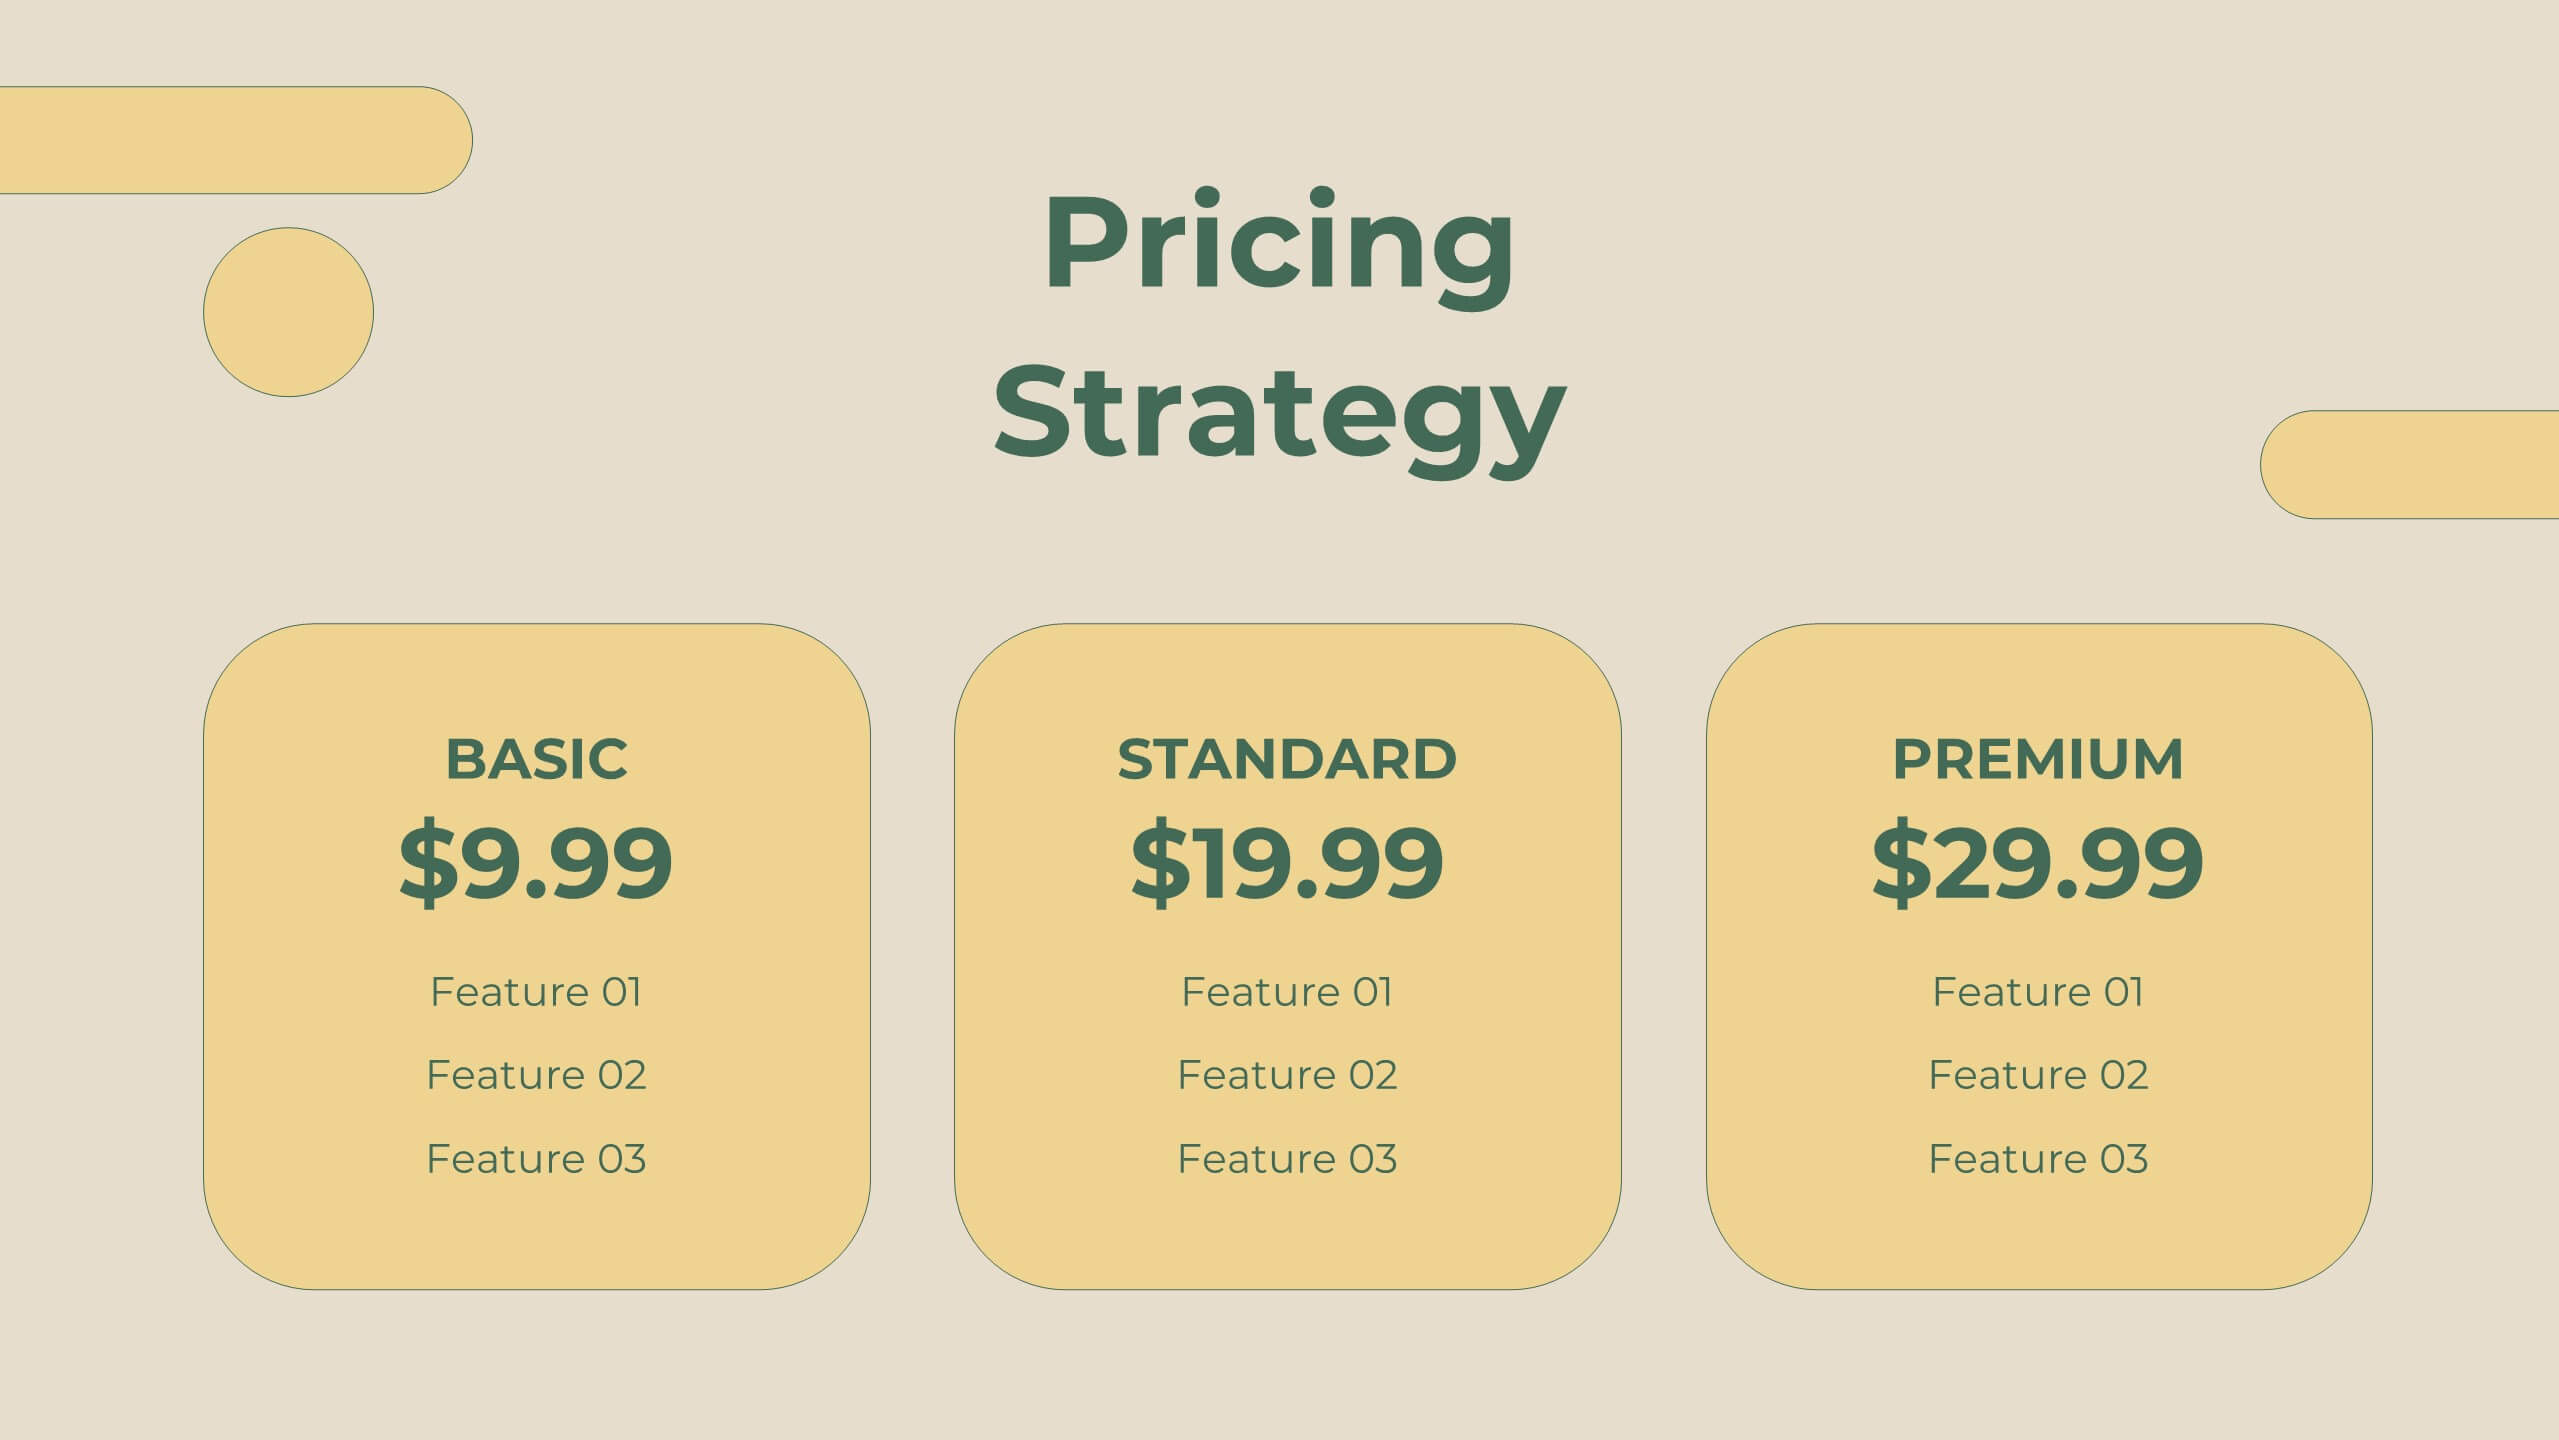
Legacy Sales Strategy Presentation
Boost your sales presentations with this modern template! It features sections for objectives, process, team introduction, customer testimonials, and performance metrics. Ideal for outlining strategies, opportunities, and pricing. Engage your audience with a professional, clean design. Compatible with PowerPoint, Keynote, and Google Slides for seamless integration. Make your sales strategy stand out!


6 slides
Customer Support Team Infographic
The set of slides presented is meticulously designed to encapsulate the essence of customer support team operations, highlighting various key aspects such as teamwork, communication channels, customer interaction points, and support strategies. Each slide utilizes a clean and professional design, integrating soft color palettes and structured layouts to clearly convey complex information in an accessible way. These slides are particularly useful for customer support teams looking to present or revamp their strategy, showcasing how they handle customer queries and feedback across different platforms. The visual elements such as graphs, hierarchical diagrams, and process flows are strategically used to illustrate the team’s structure, response processes, and efficiency metrics, making it easier for stakeholders to grasp the effectiveness of customer support initiatives. Such a collection is indispensable for training new team members, demonstrating the team's impact on customer satisfaction, and internal reviews to improve service delivery. By using these slides, teams can ensure a consistent understanding of goals, roles, and procedures, which is crucial for maintaining high standards of customer service and team alignment.


21 slides
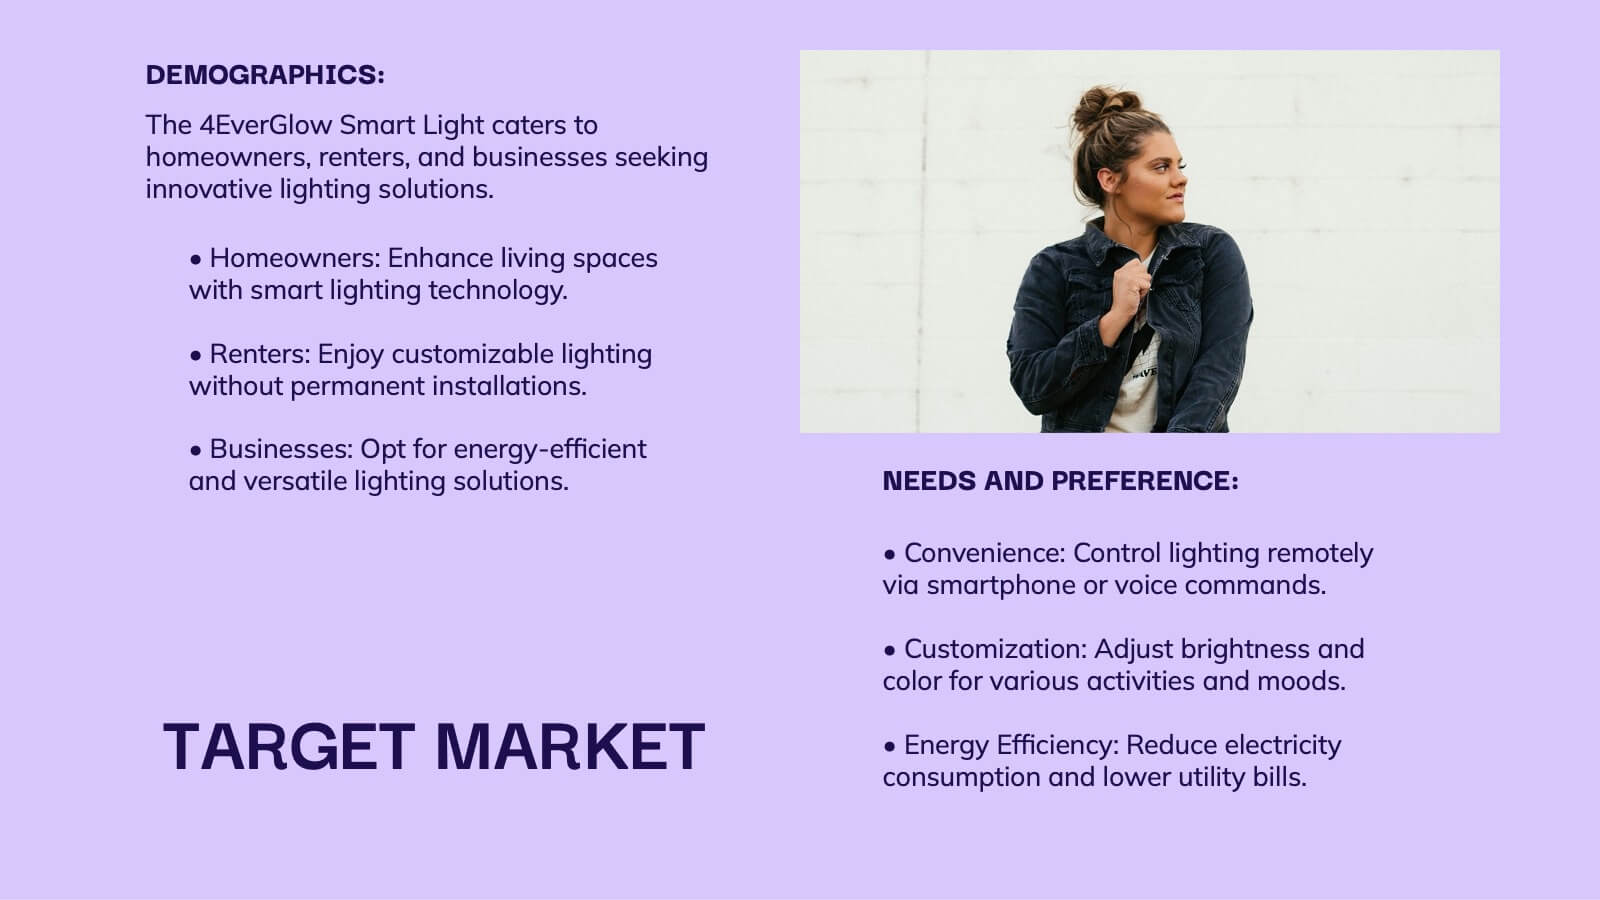
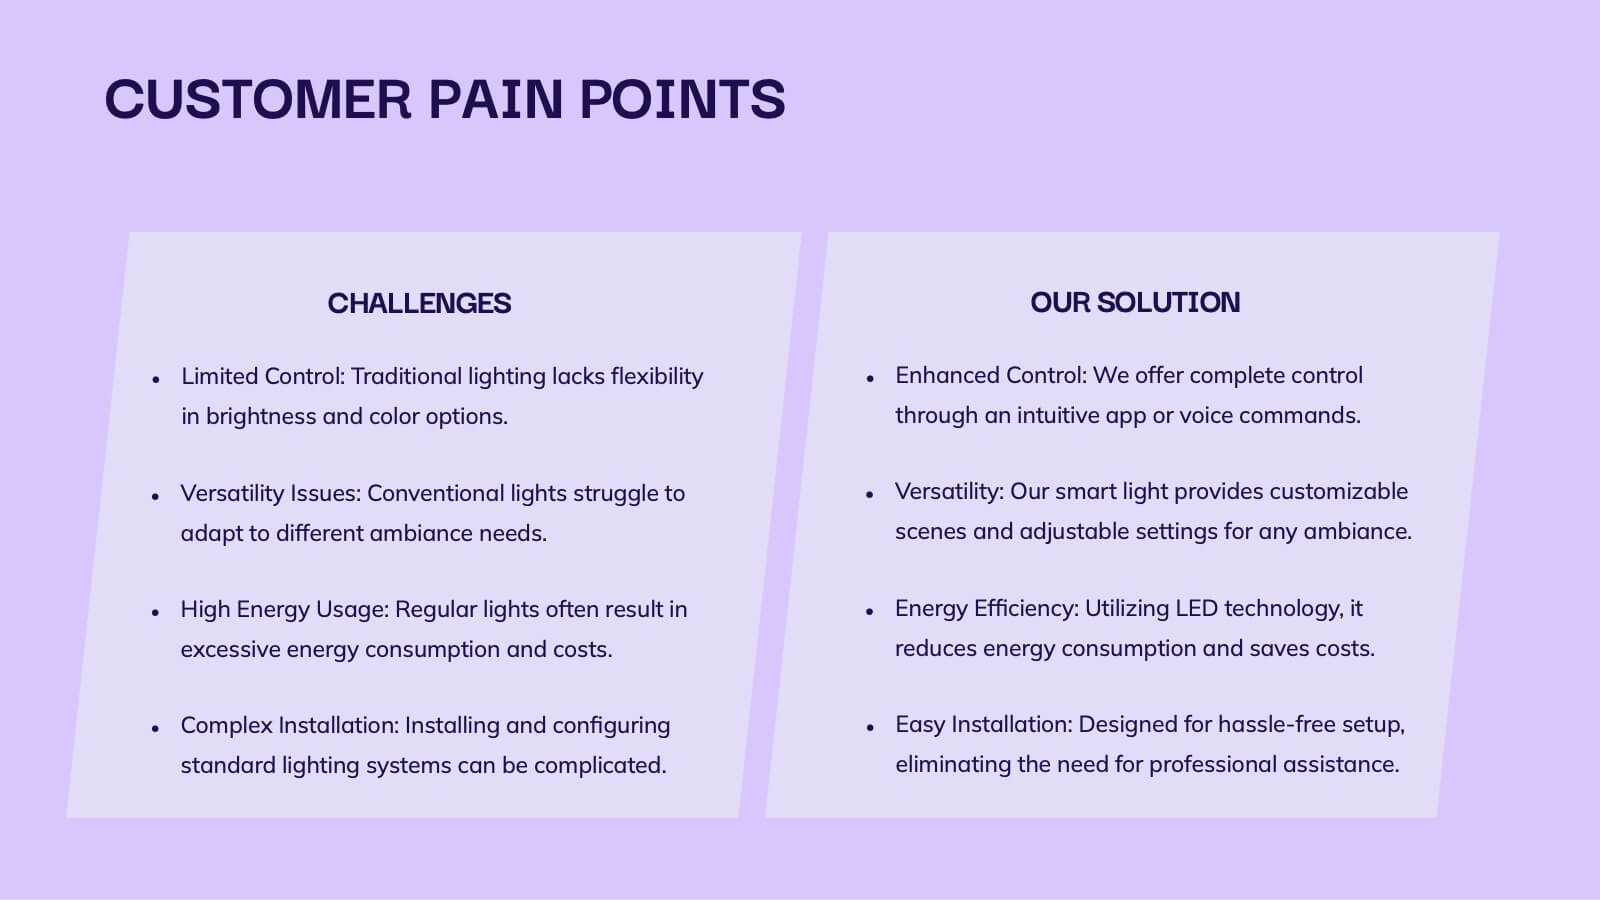
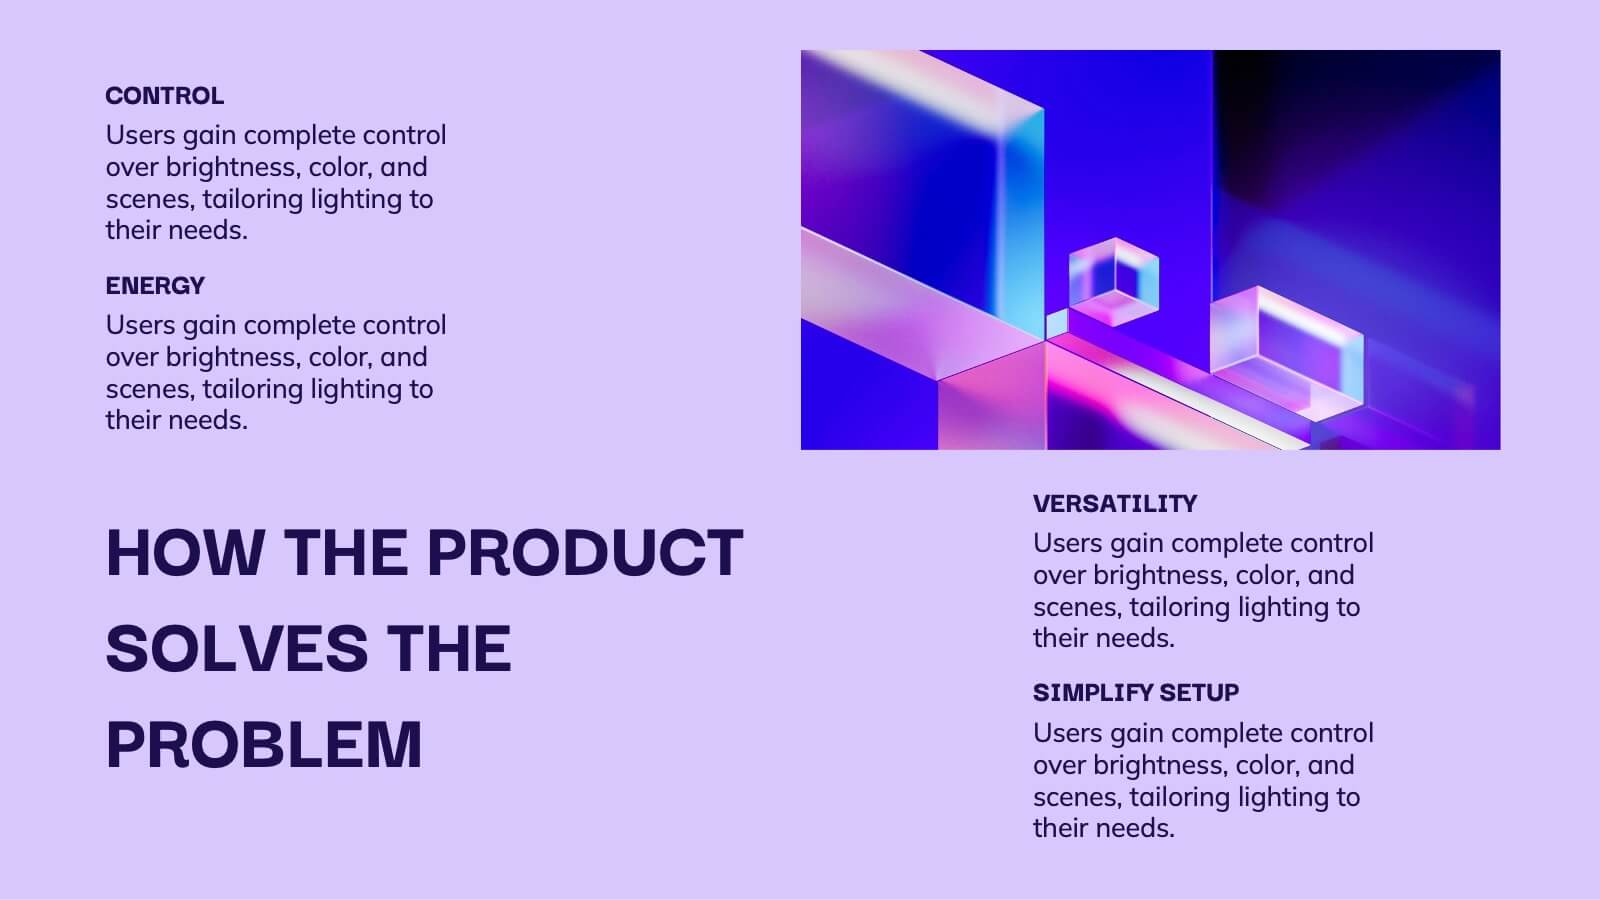
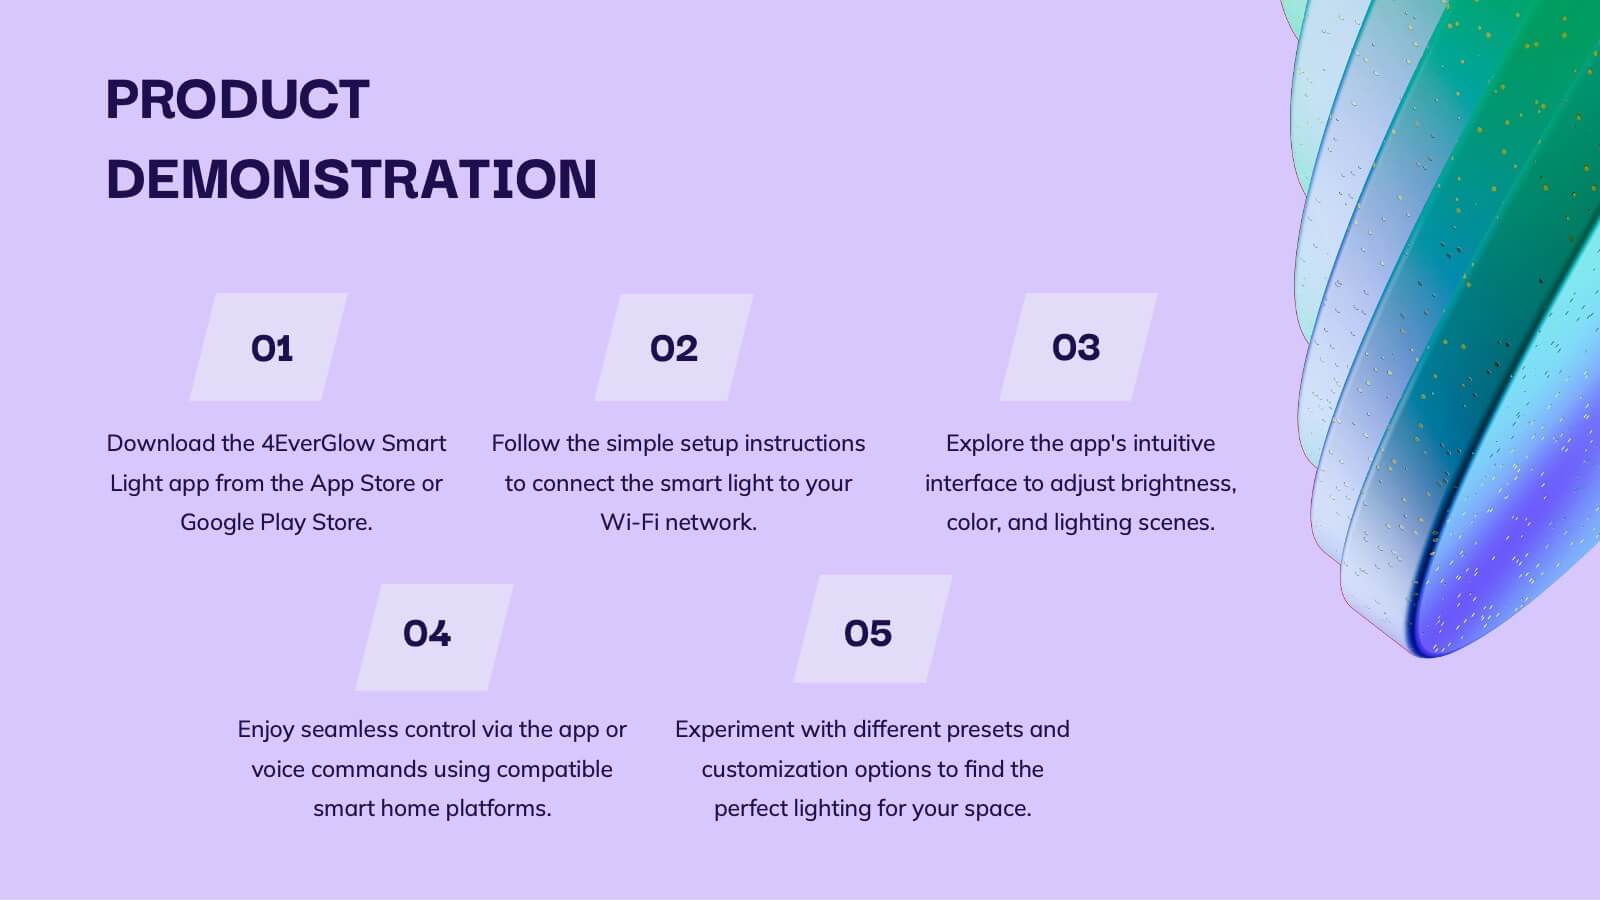
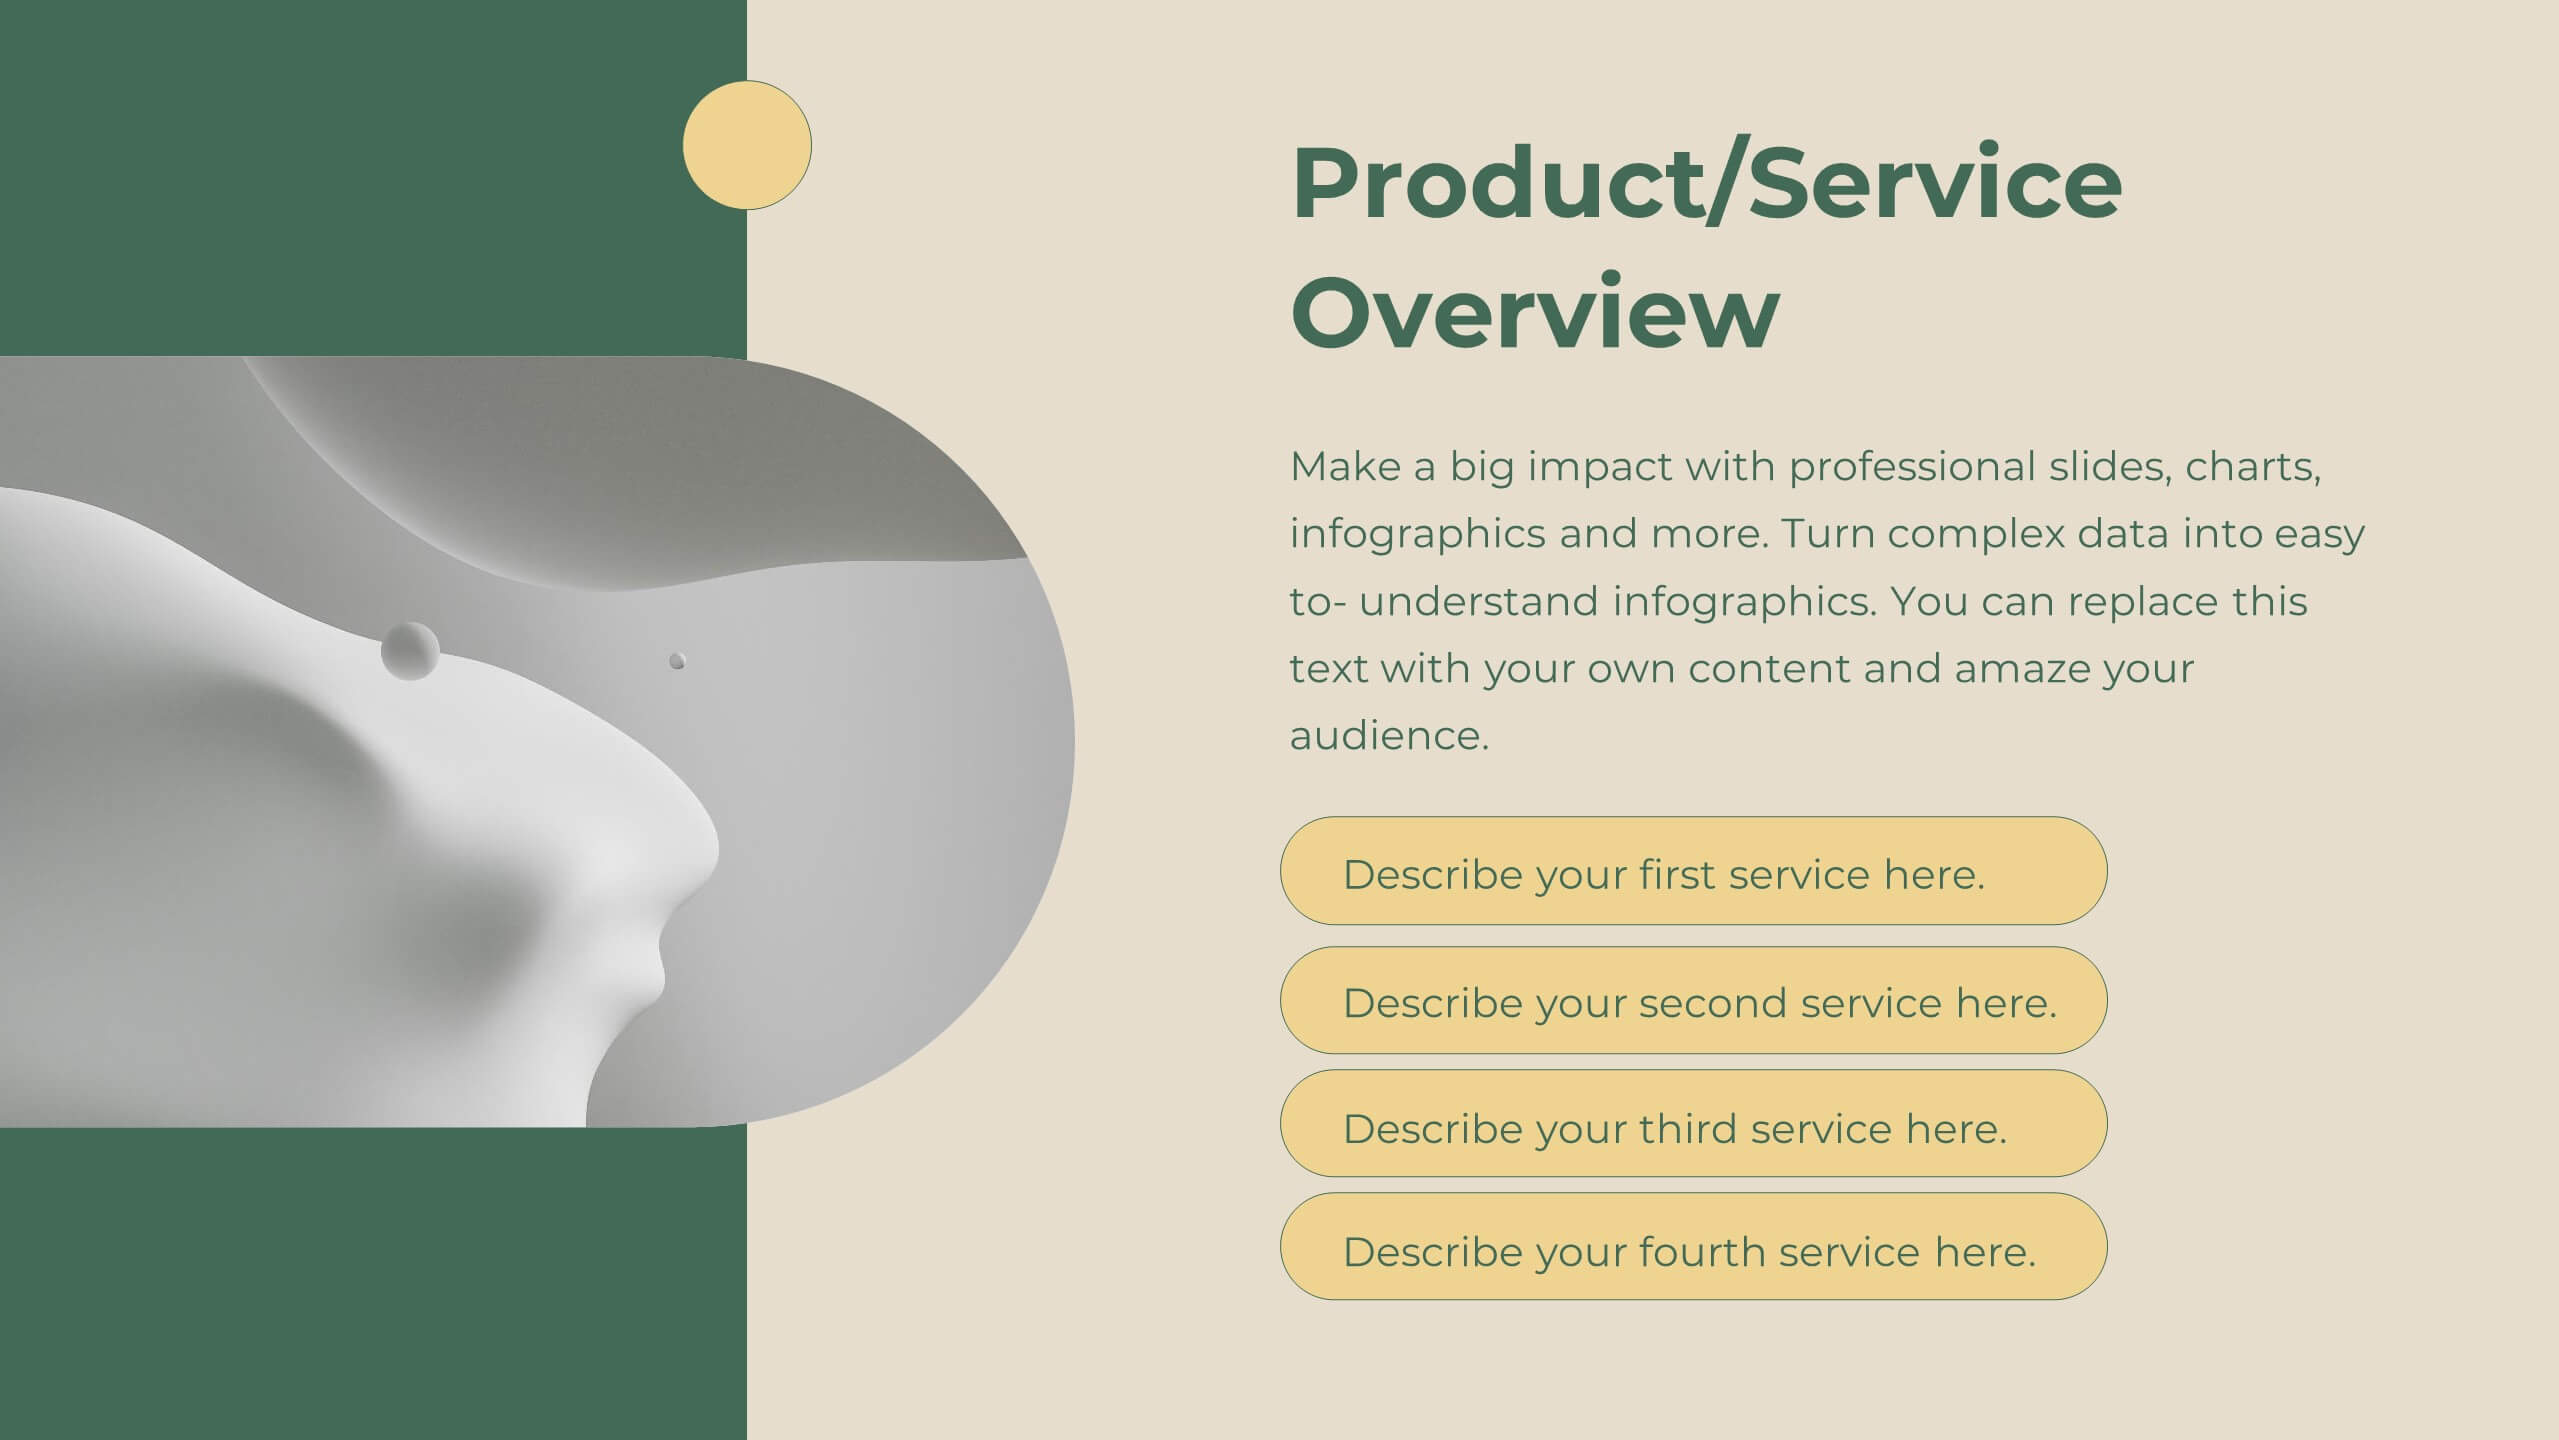
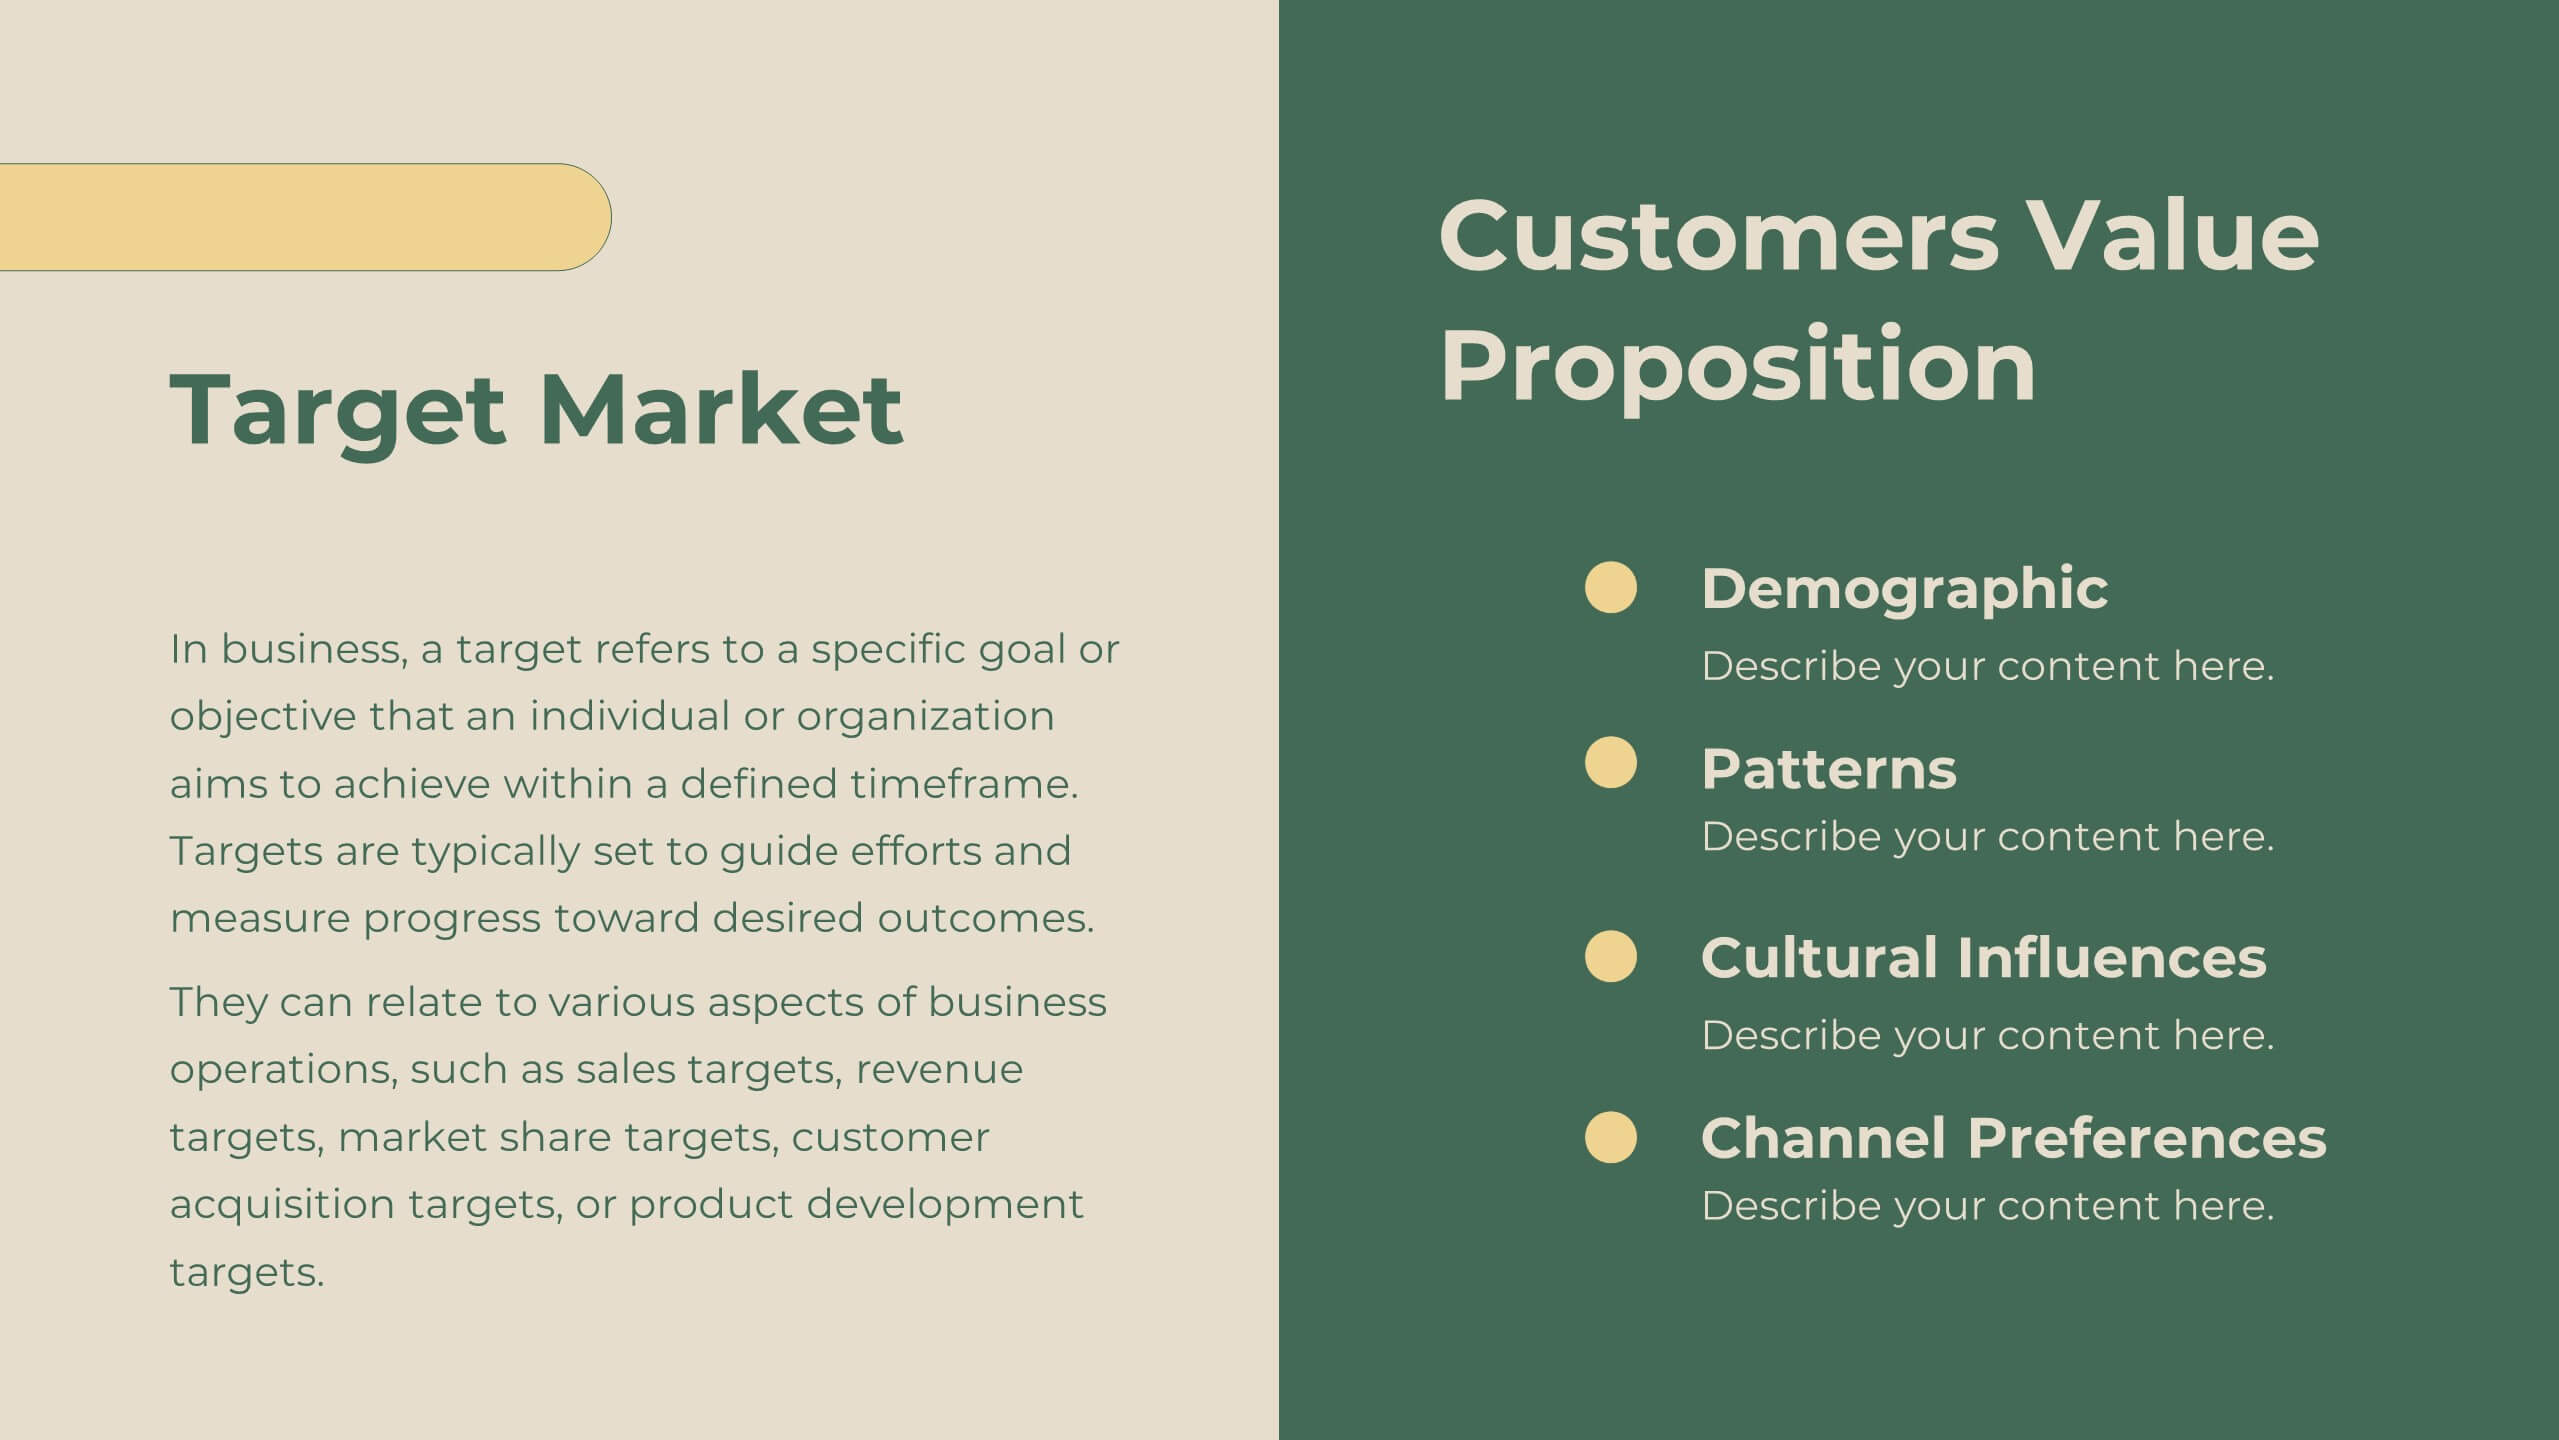
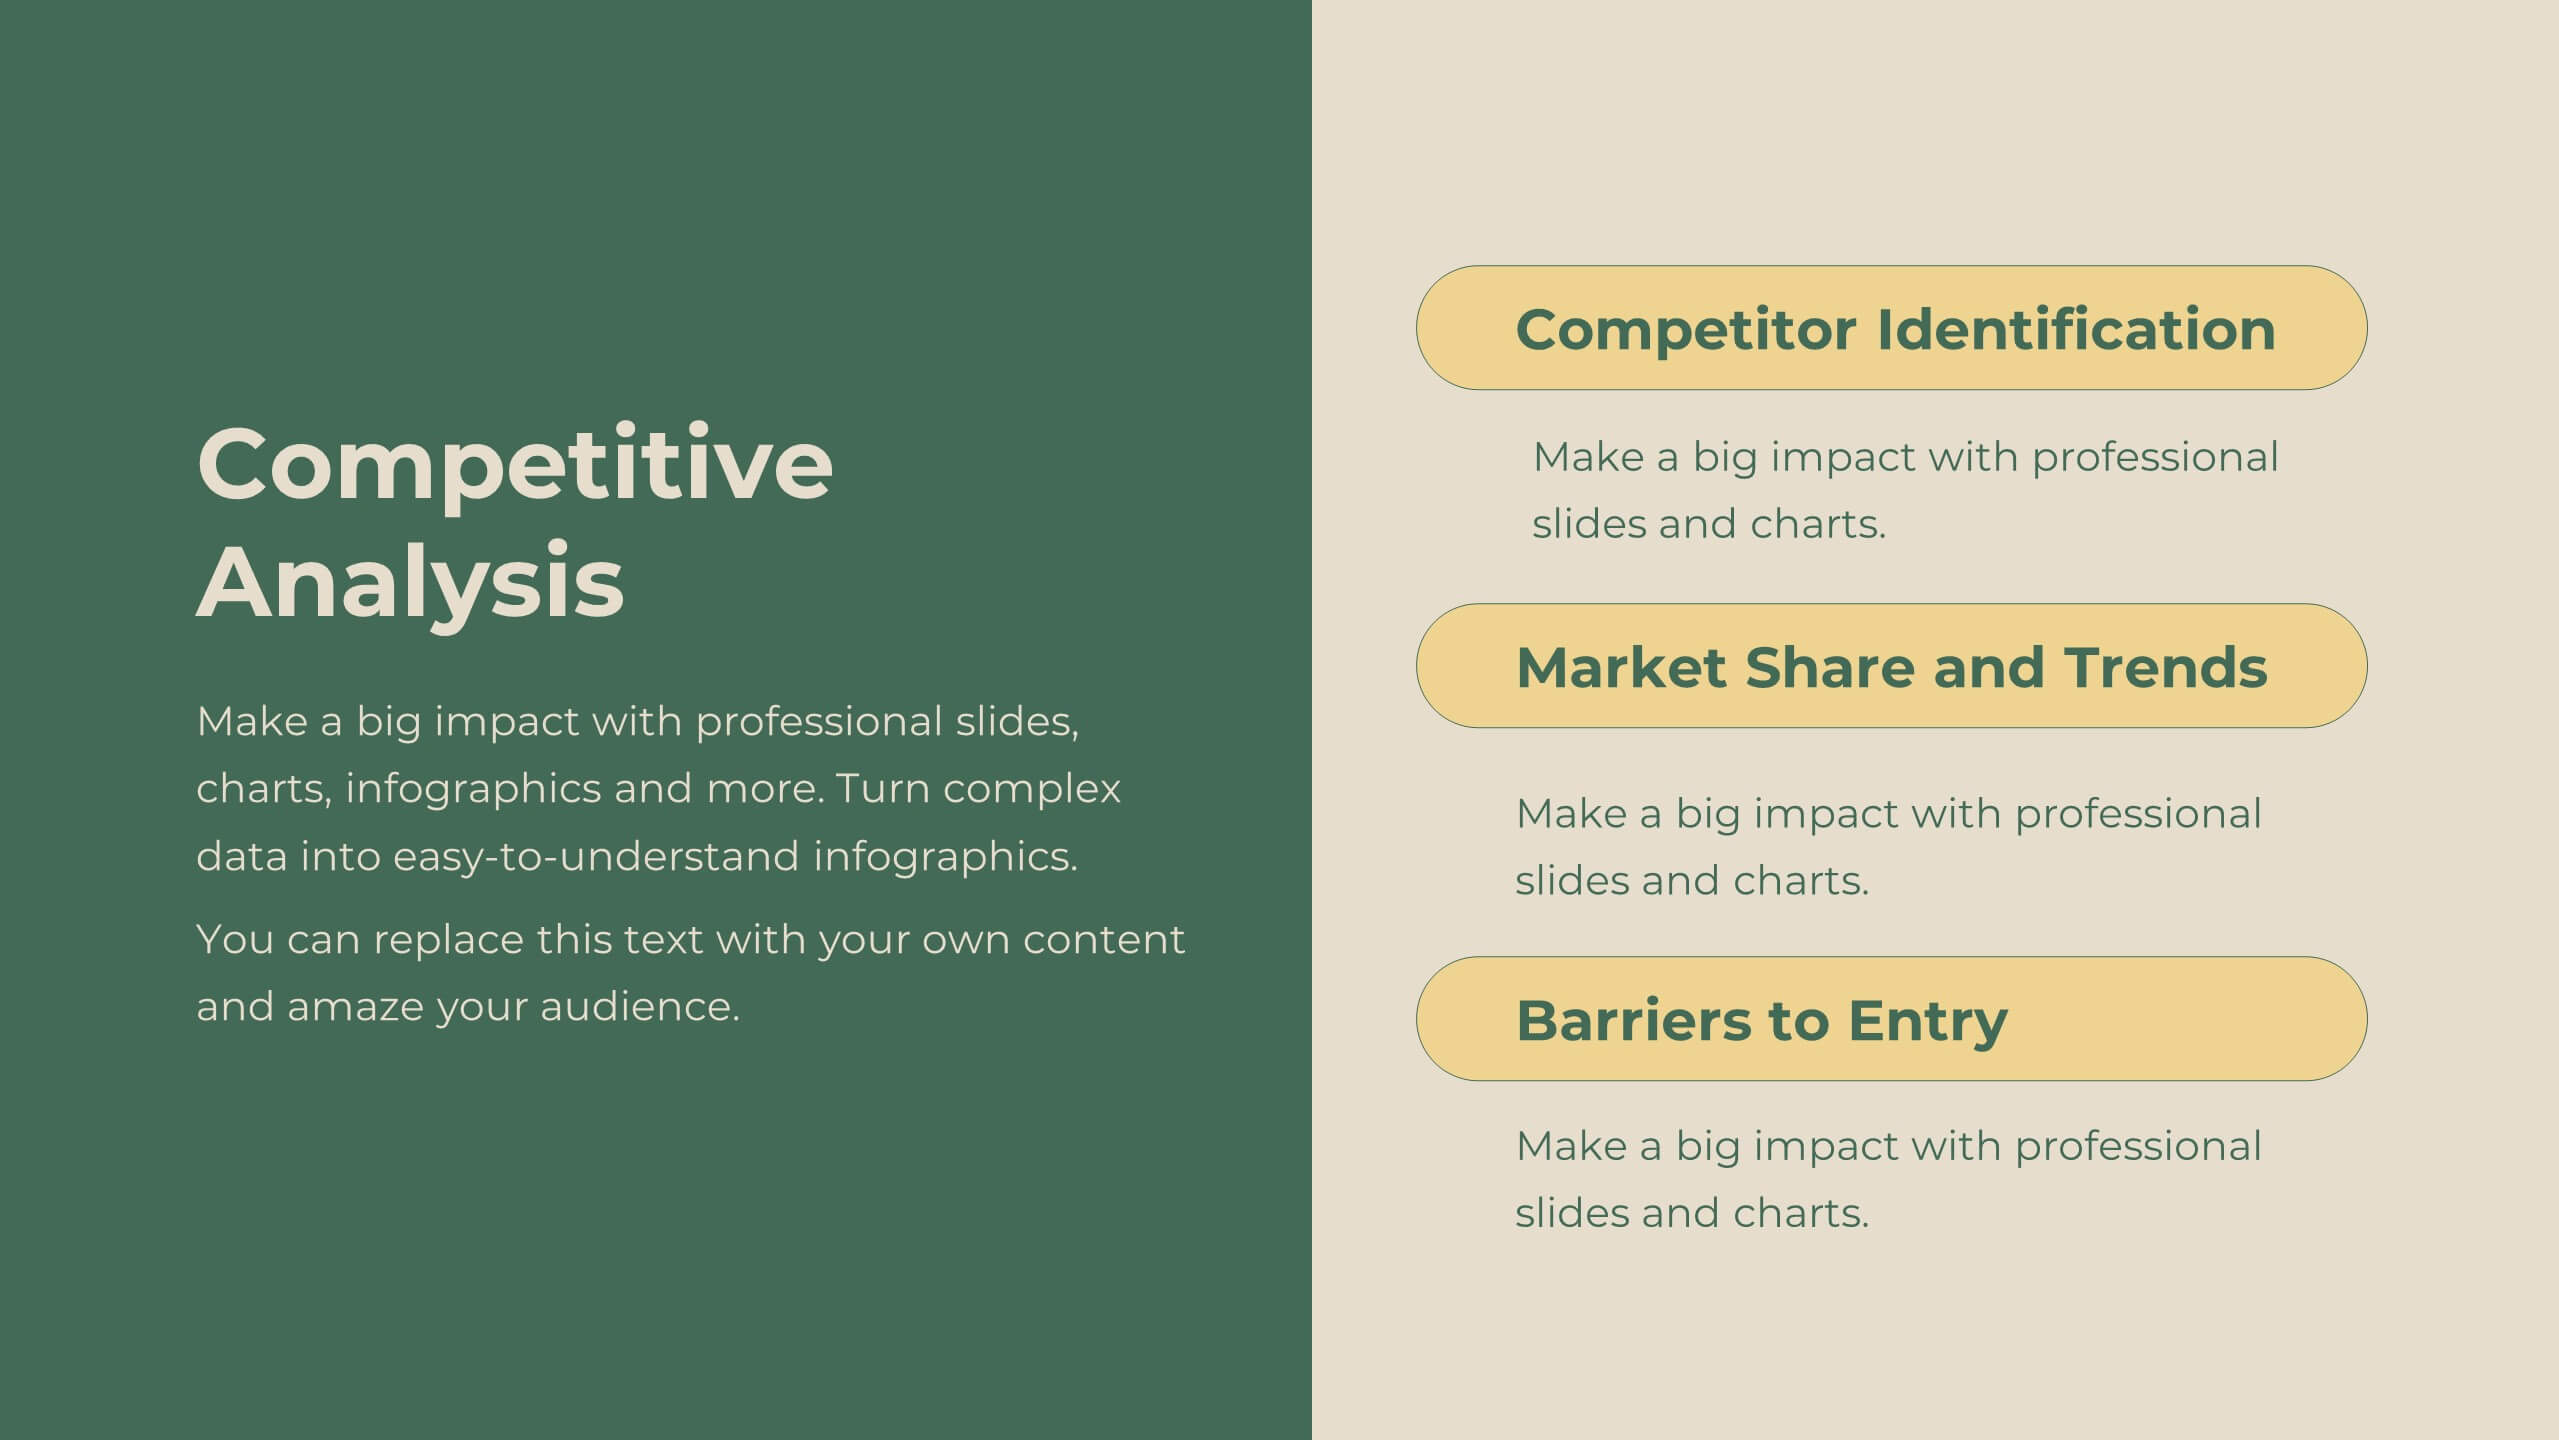
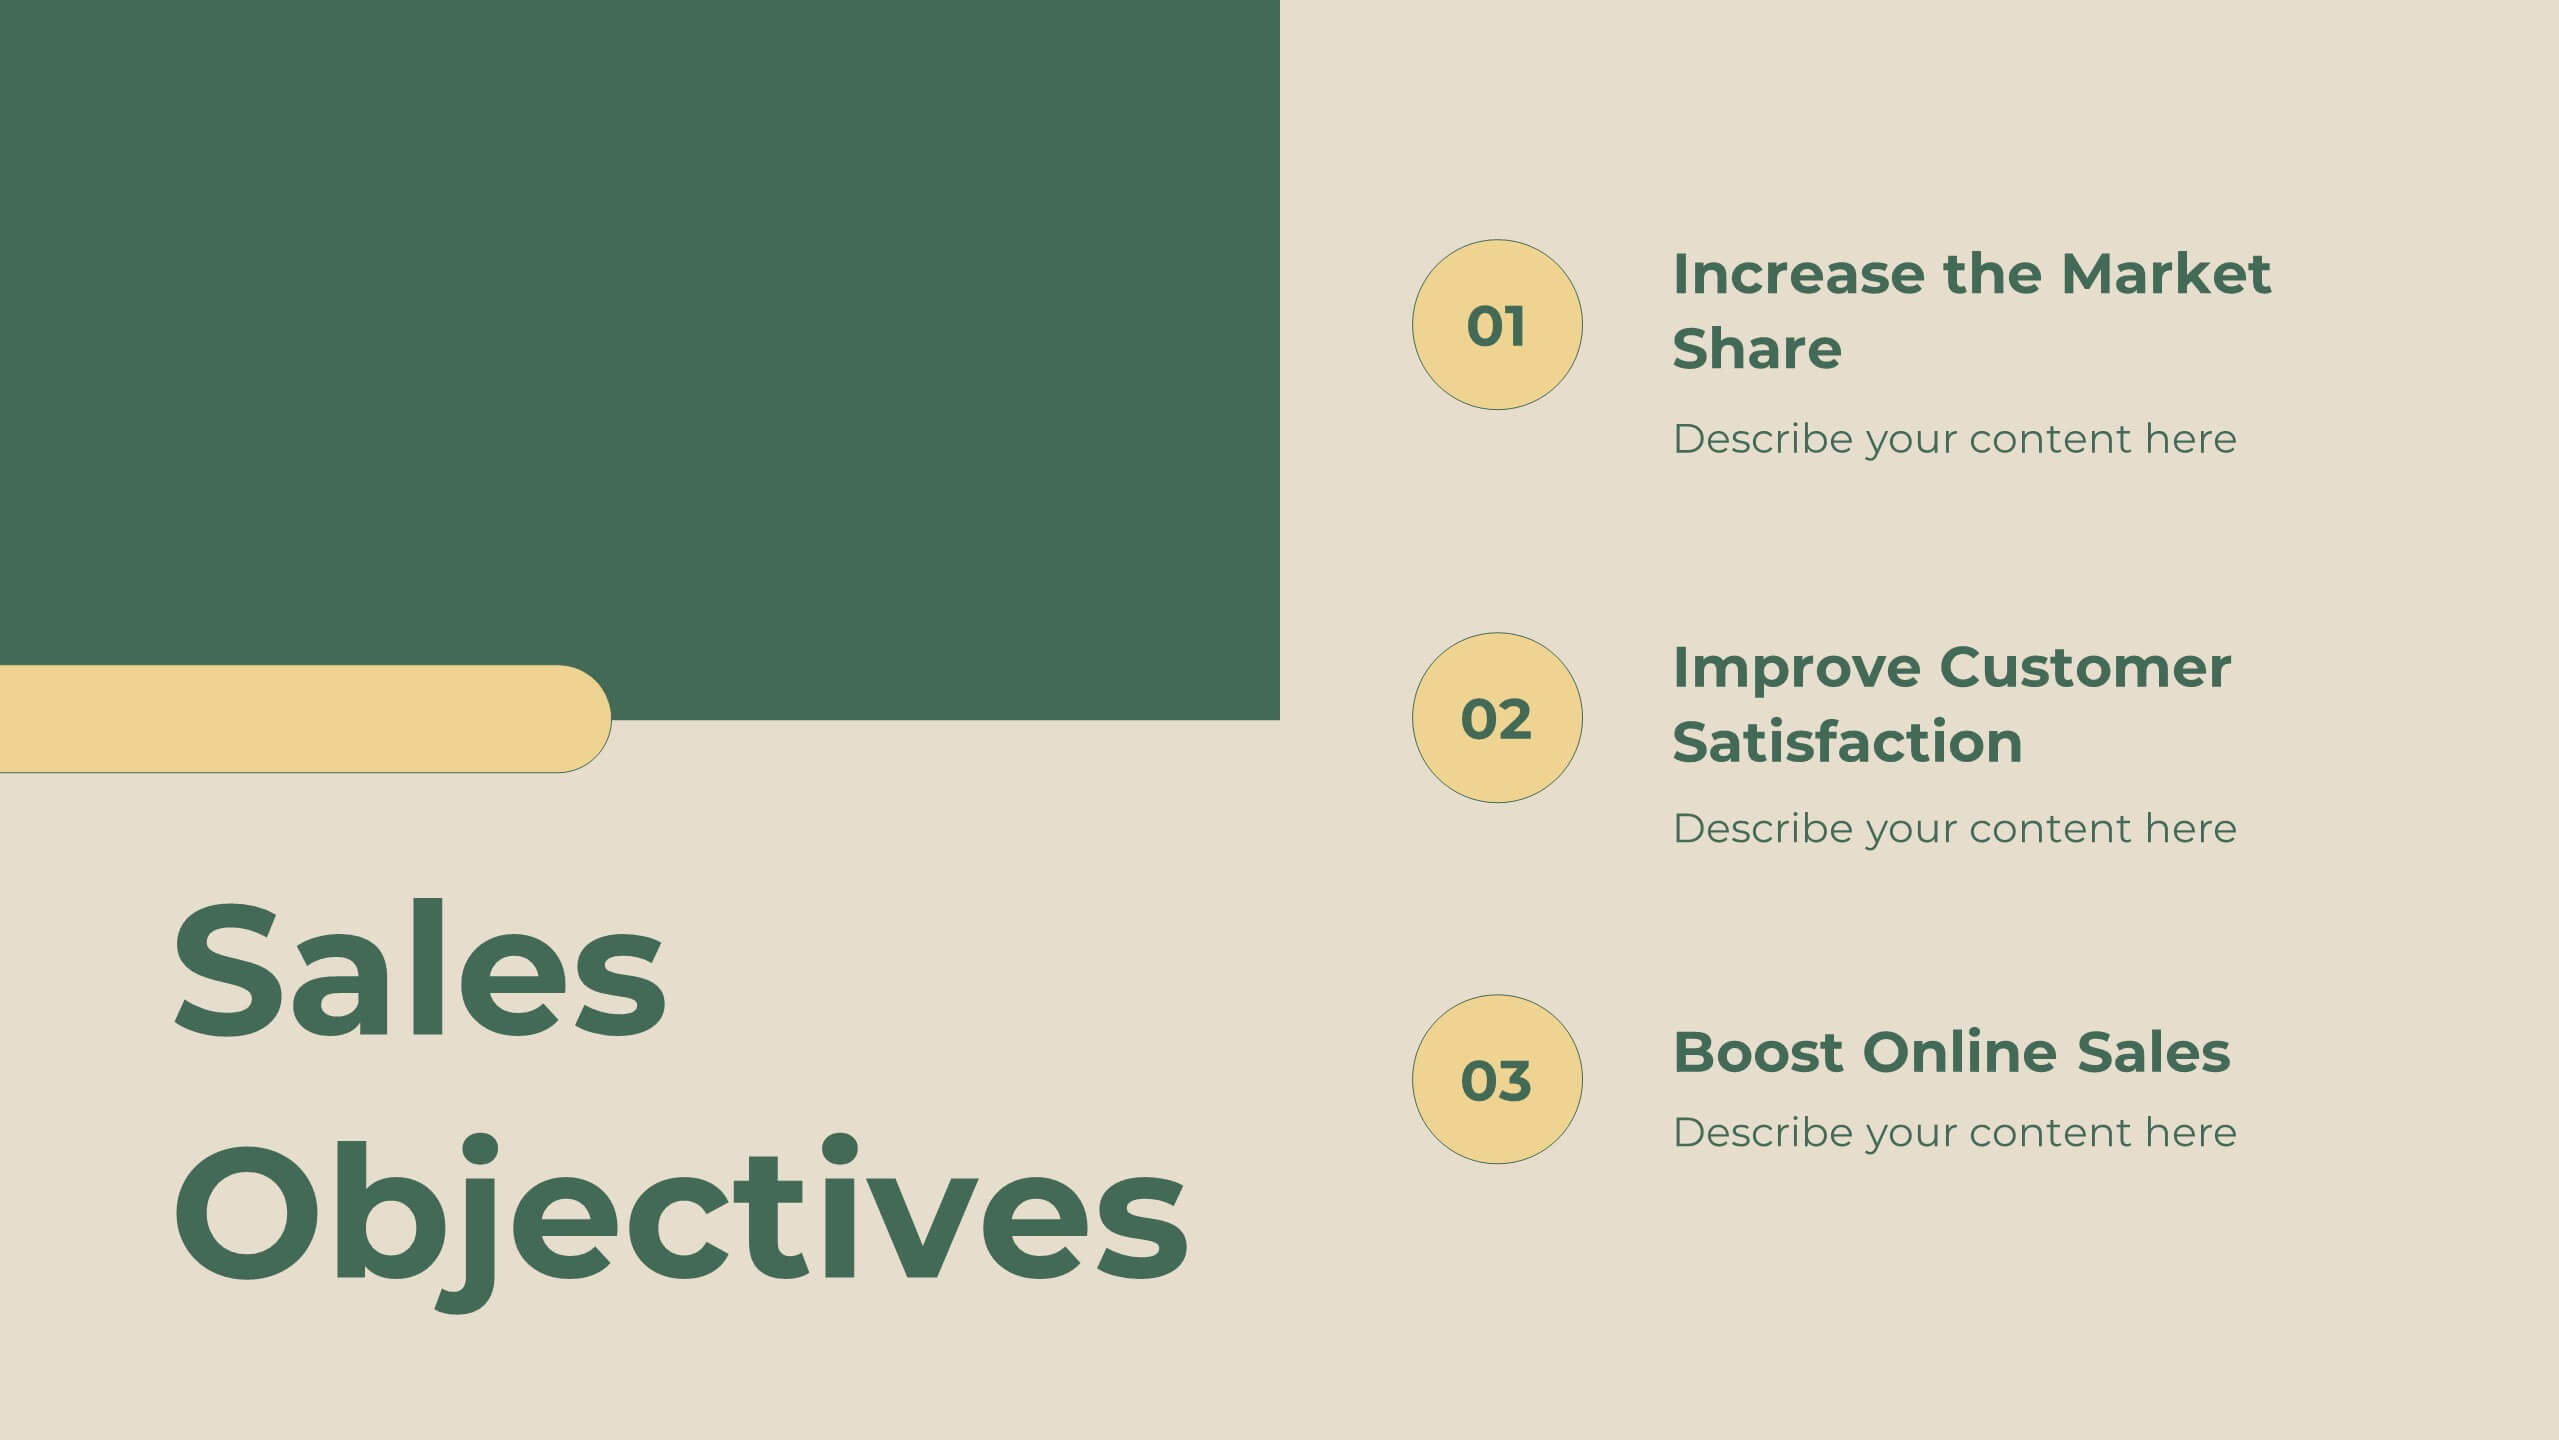
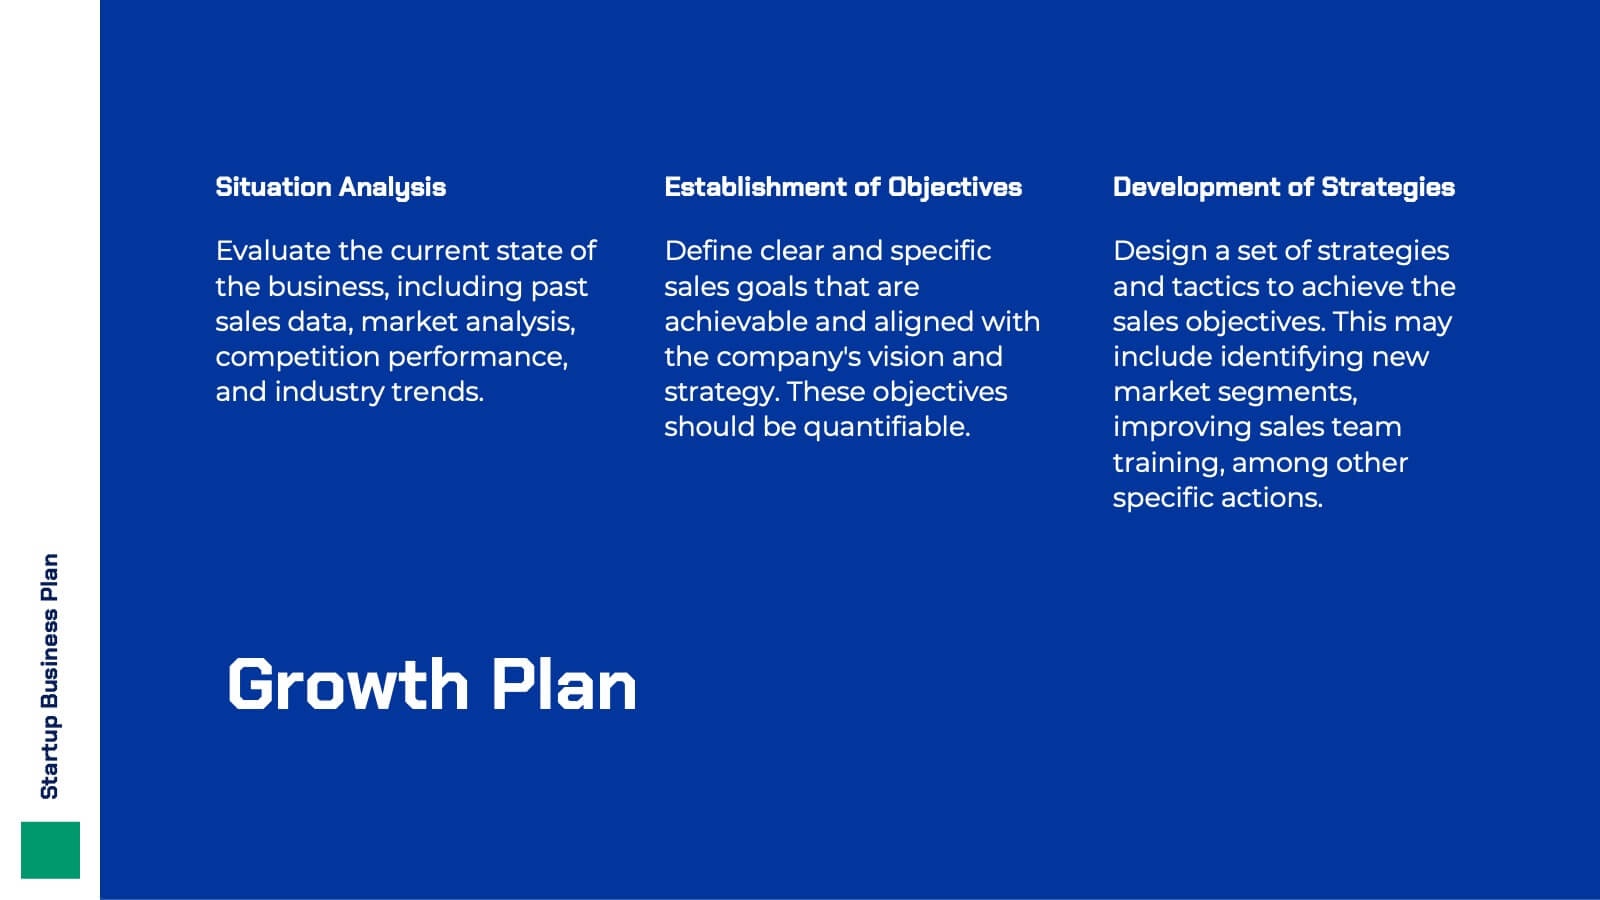
Hyperluma Startup Business Plan Presentation
Launch your vision with this startup business plan template, crafted to communicate your mission, market potential, and growth strategy with clarity and impact. Covering customer needs, unique value propositions, and financial projections, it’s ideal for entrepreneurs and founders. This template is compatible with PowerPoint, Keynote, and Google Slides, ready to fuel your startup’s journey.