


Features
- 7 Unique slides
- Fully editable and easy to edit in Microsoft Powerpoint, Keynote and Google Slides
- 16:9 widescreen layout
- Clean and professional designs
- Export to JPG, PDF or send by email


Do you have any questions?
Recommend


8 slides
Corporate Risk Assessment and Planning Presentation
Navigate business uncertainties with the Corporate Risk Assessment and Planning template, offering a vivid and structured layout designed for professionals to meticulously detail and analyze potential risks in various business scenarios. It uses hexagonal and circular elements to emphasize the interconnectedness of various risk factors, supporting clear visualization and effective strategic planning. This template is compatible with PowerPoint, Keynote, and Google Slides, making it a versatile tool for comprehensive risk management presentations.


5 slides
Visionary Leadership Models in Business
Illustrate transformative leadership approaches with the Visionary Leadership Models in Business Presentation. This slide features a central vertical timeline with bold icons and text areas that highlight four key principles or stages of leadership. Ideal for strategy sessions, keynote addresses, or leadership training programs. Fully compatible with PowerPoint, Keynote, and Google Slides.


5 slides
Organizational Management Frameworks Overview Presentation
Clarify reporting lines and decision-making roles with the Organizational Management Frameworks Overview Presentation. This clean and color-coded hierarchy chart helps visualize team structure, leadership levels, or departmental breakdowns. Ideal for organizational design, onboarding, or strategic alignment discussions, each placeholder is fully customizable to reflect your company’s framework. Compatible with PowerPoint, Keynote, and Google Slides—perfect for HR professionals, managers, and consultants seeking structure and clarity.


7 slides
IT Architecture Infographics Presentation Template
Our IT Architecture Infographic template is designed to help you create a quick, easy and simple-to-understand presentation that explains your IT Architecture. This template will provide you with material to set out your ideas and give an overview of what’s important so that you can rapidly make progress in this area. This is a perfect choice to impress your clients, teachers, students, or employees. This presentation creates an extravagant feeling that will invite investors and clients to become invested in your project. This template is well-organized and perfect for your next presentation!


23 slides
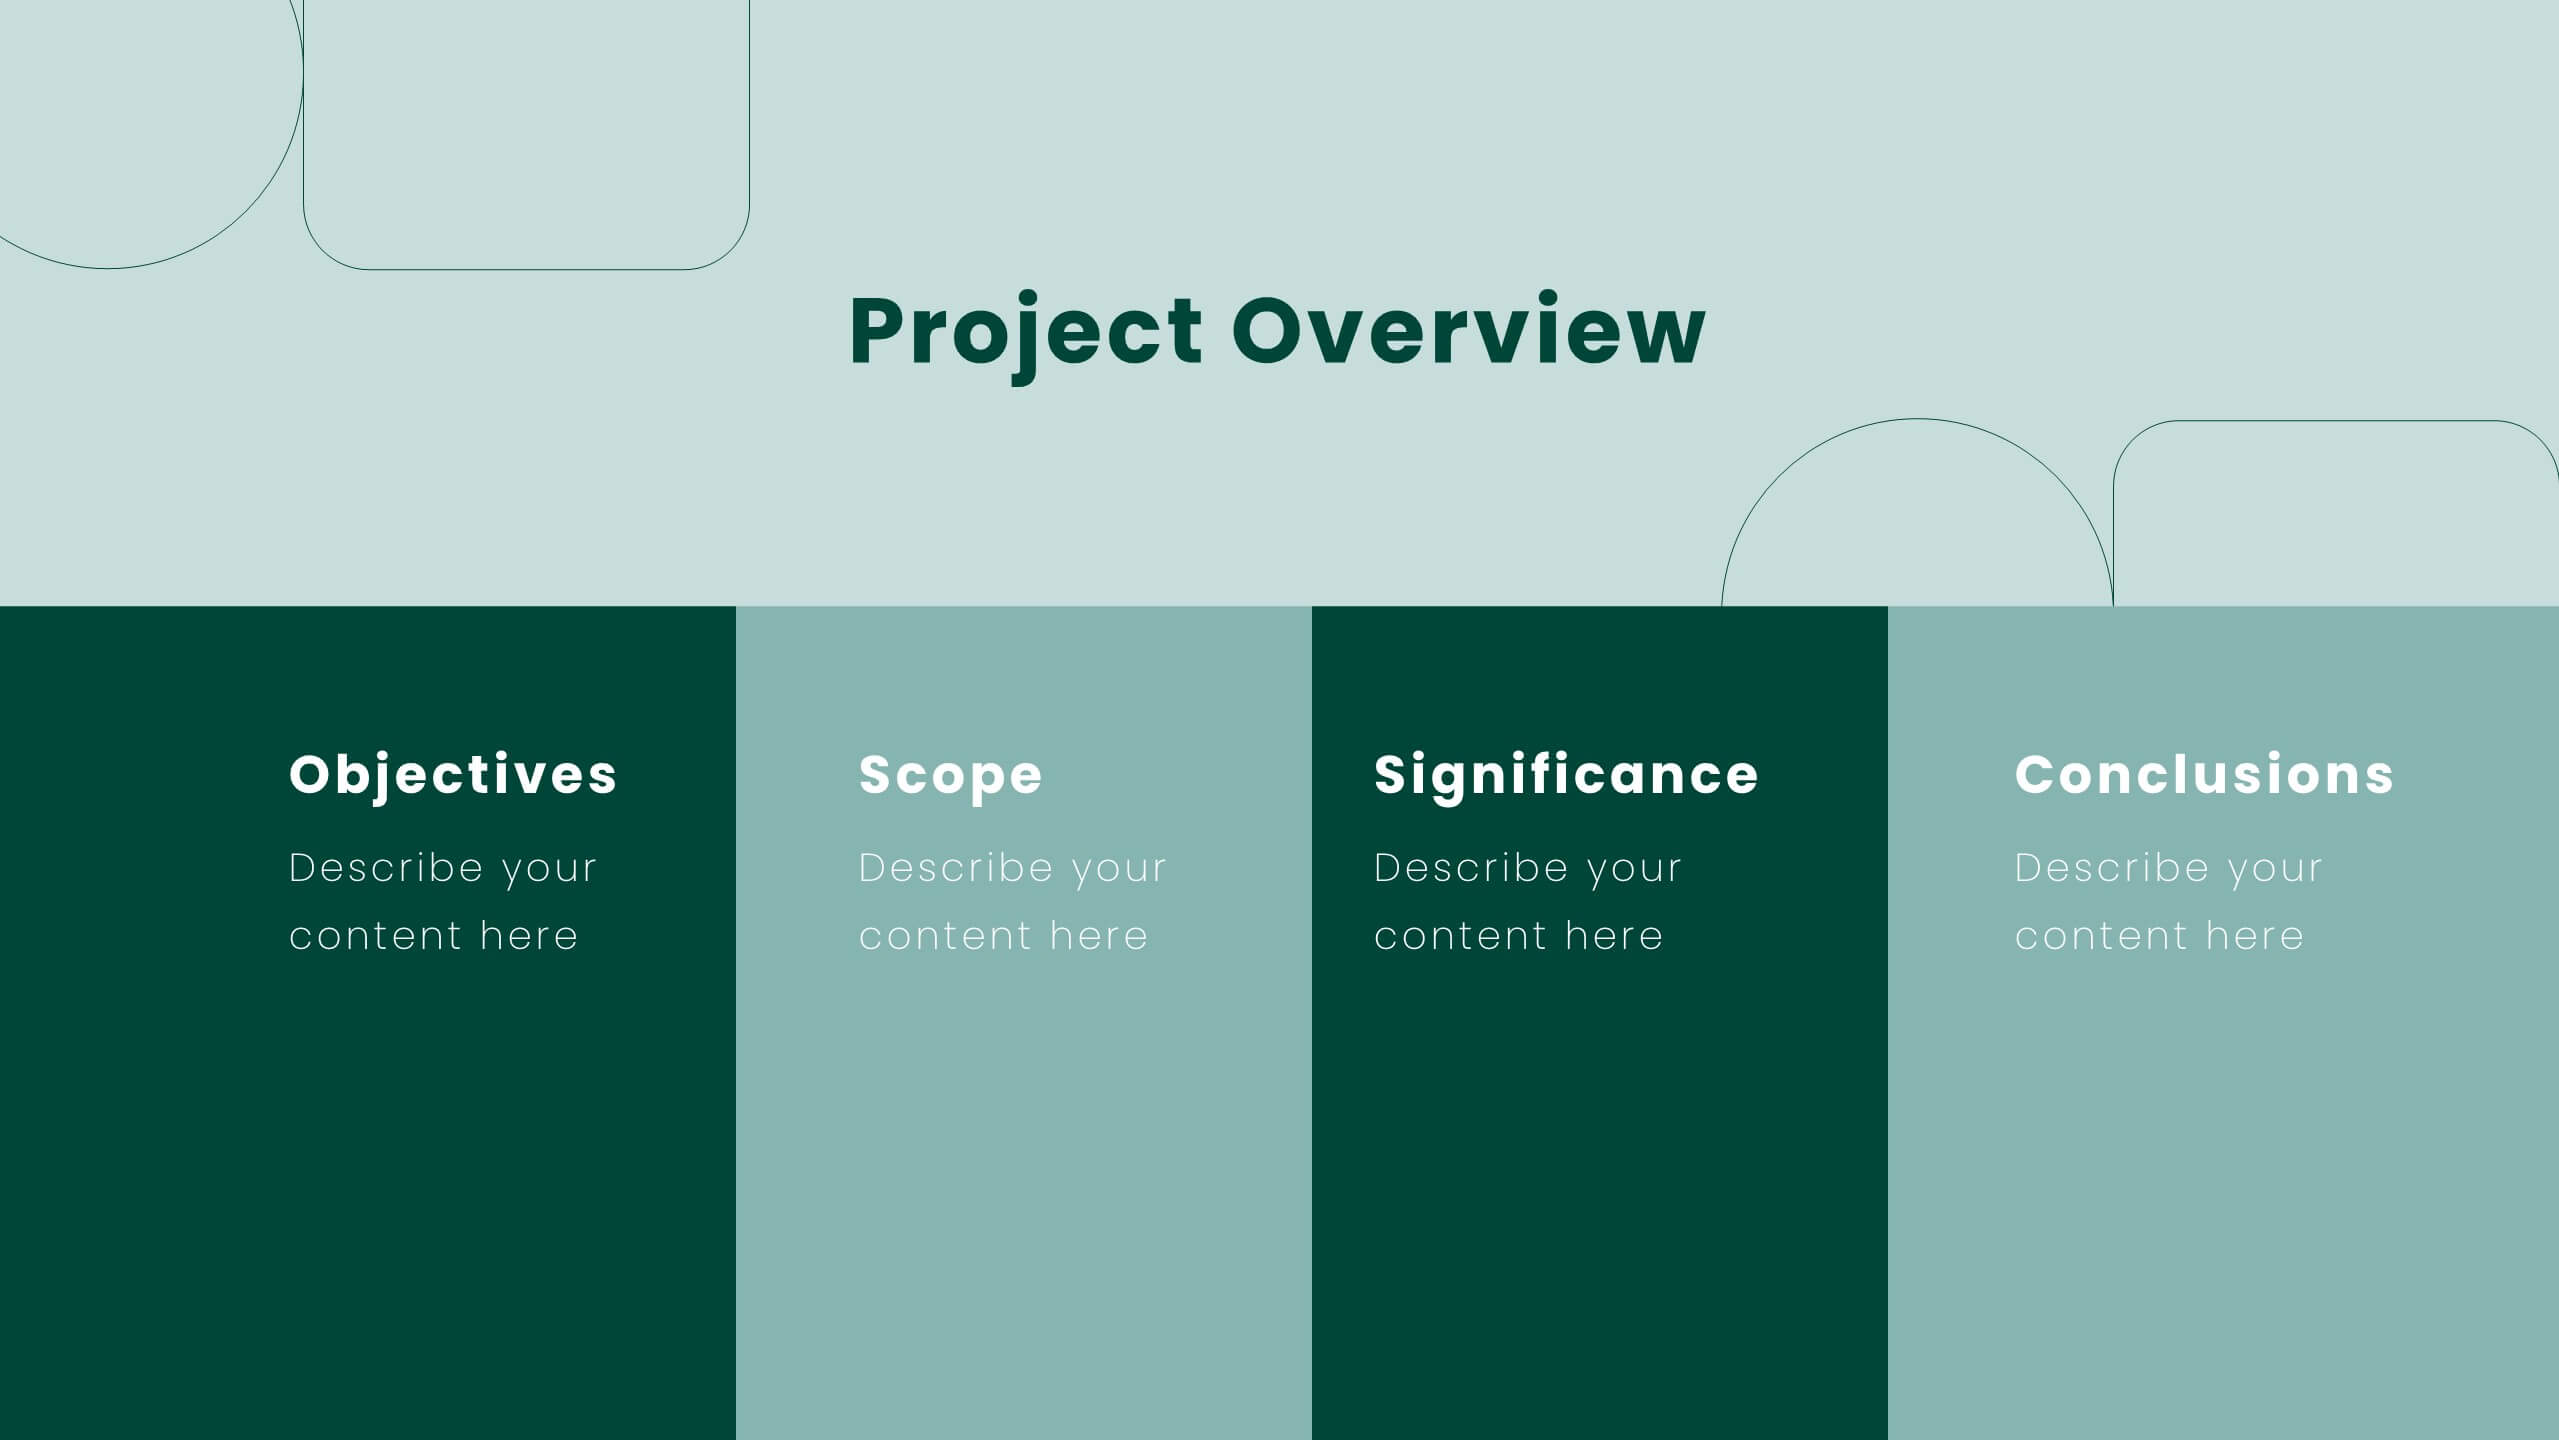
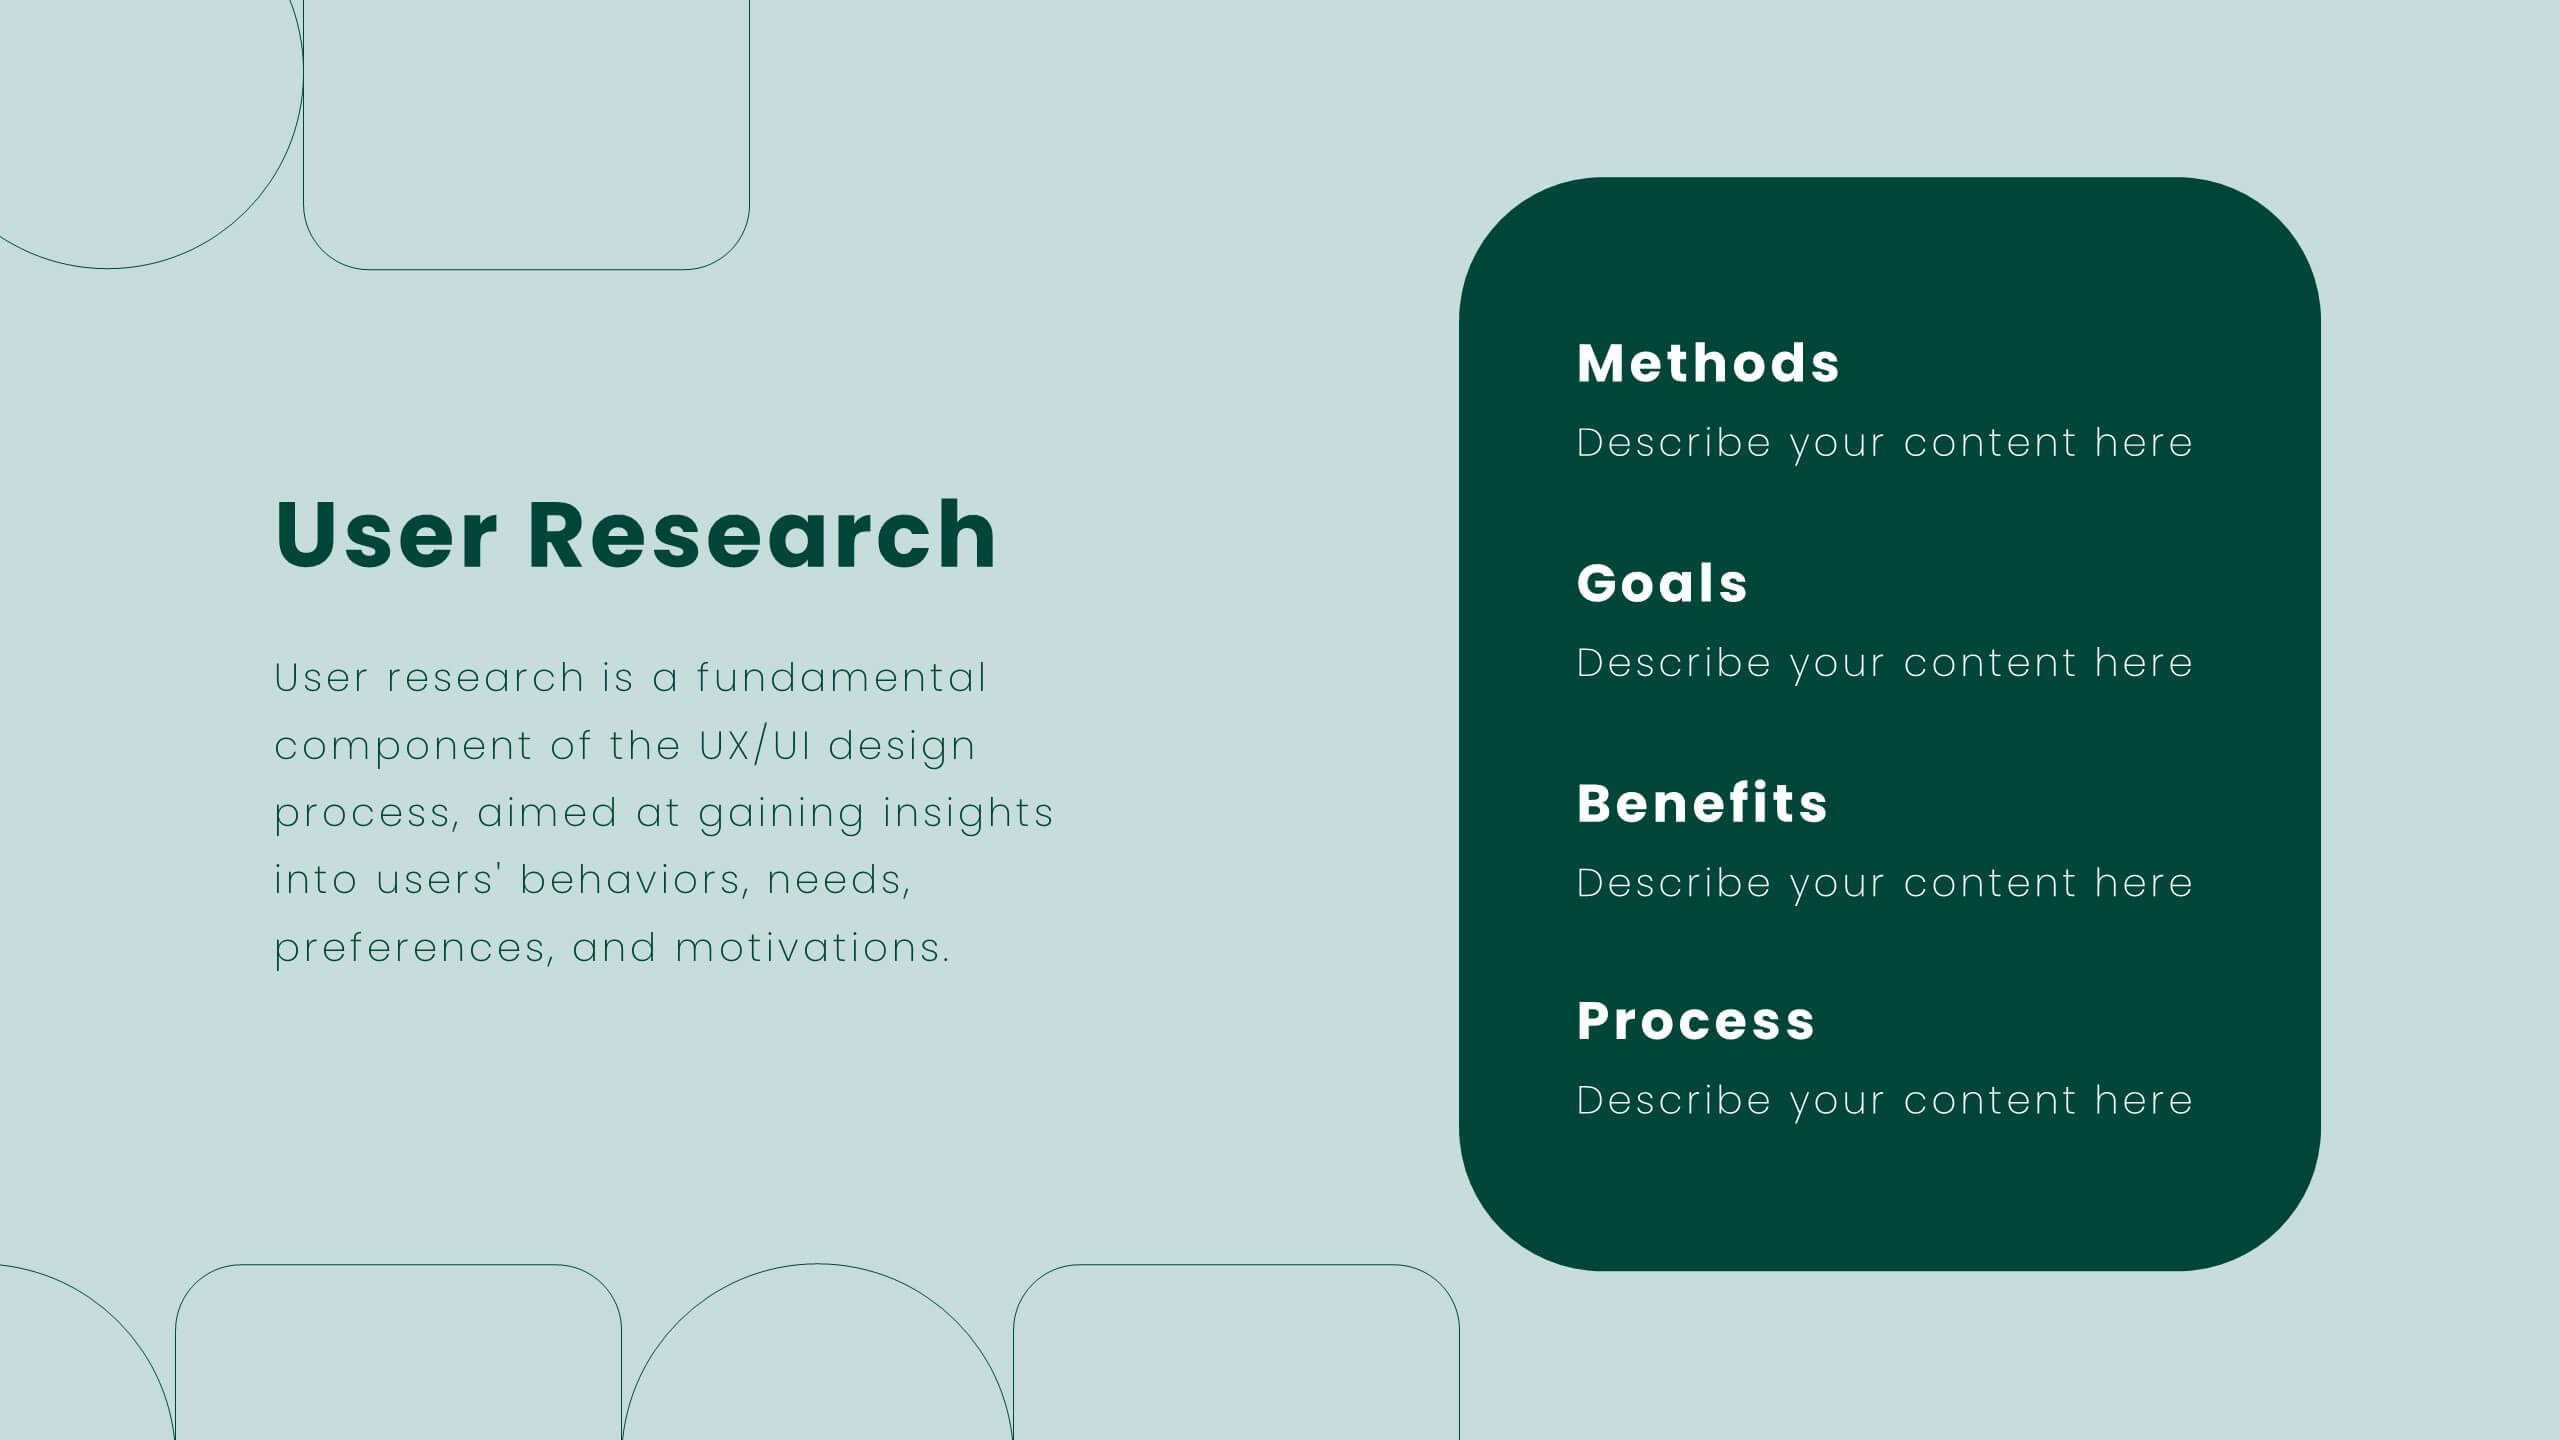
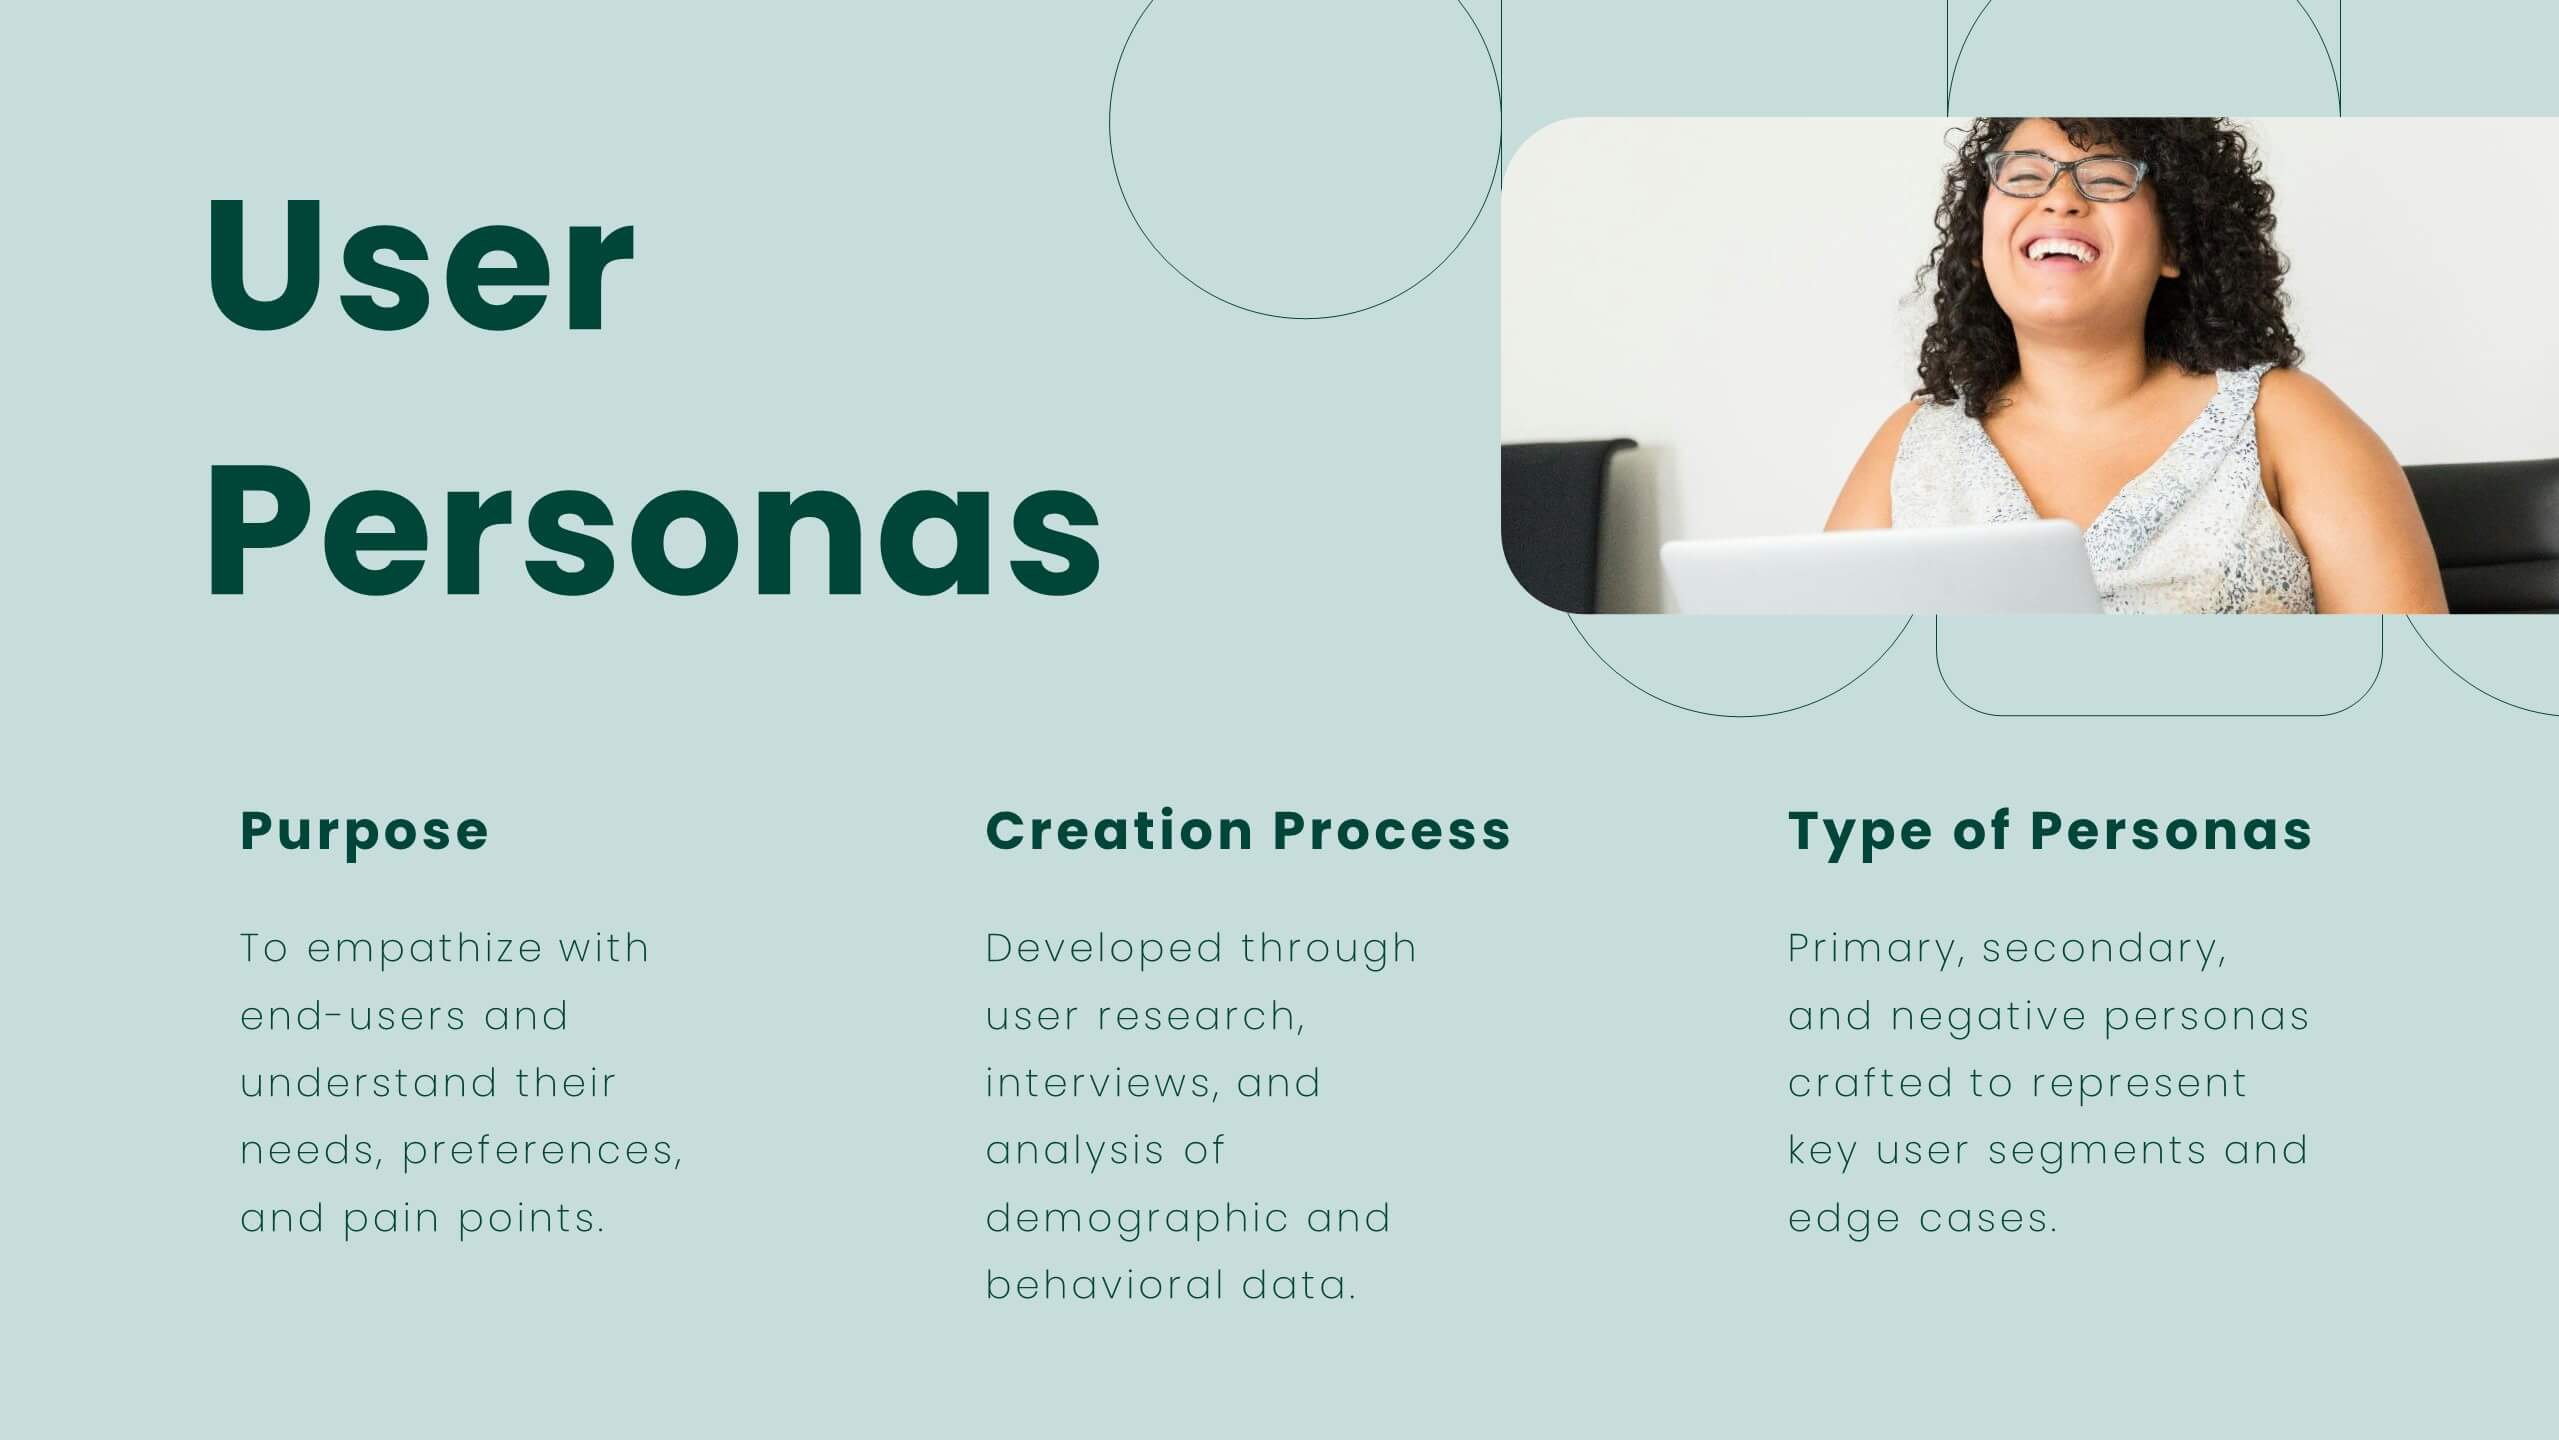
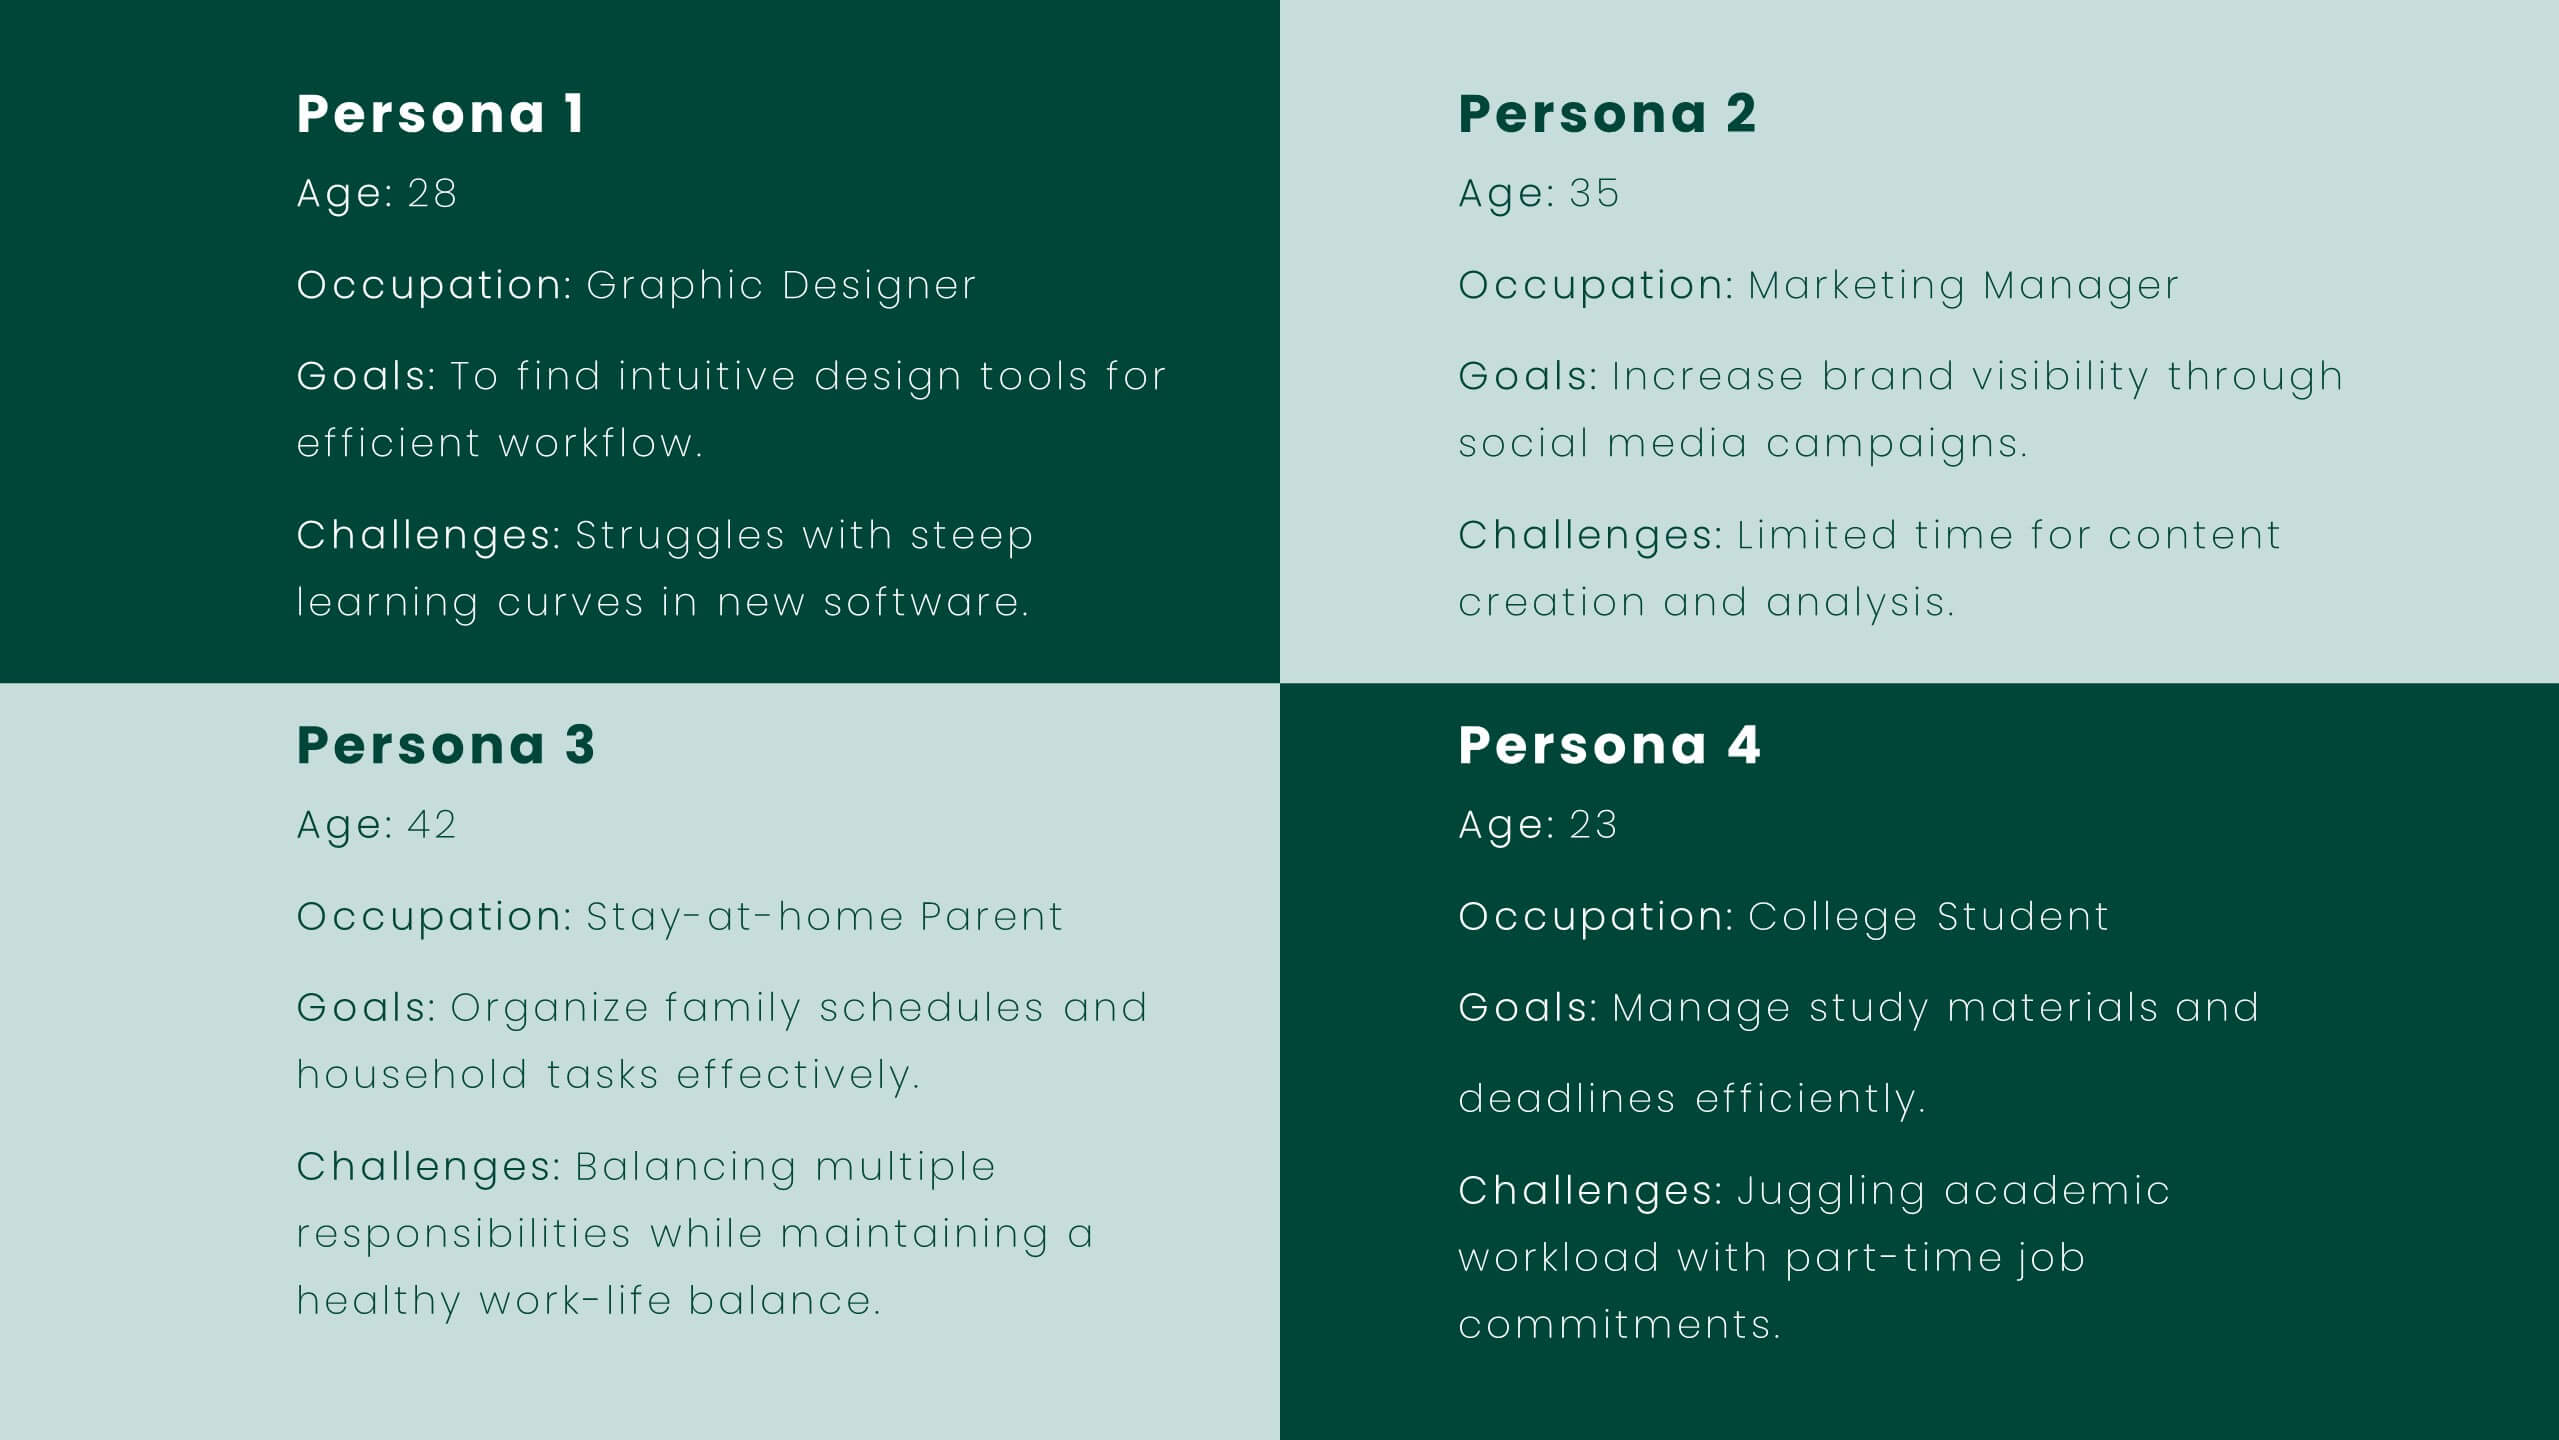
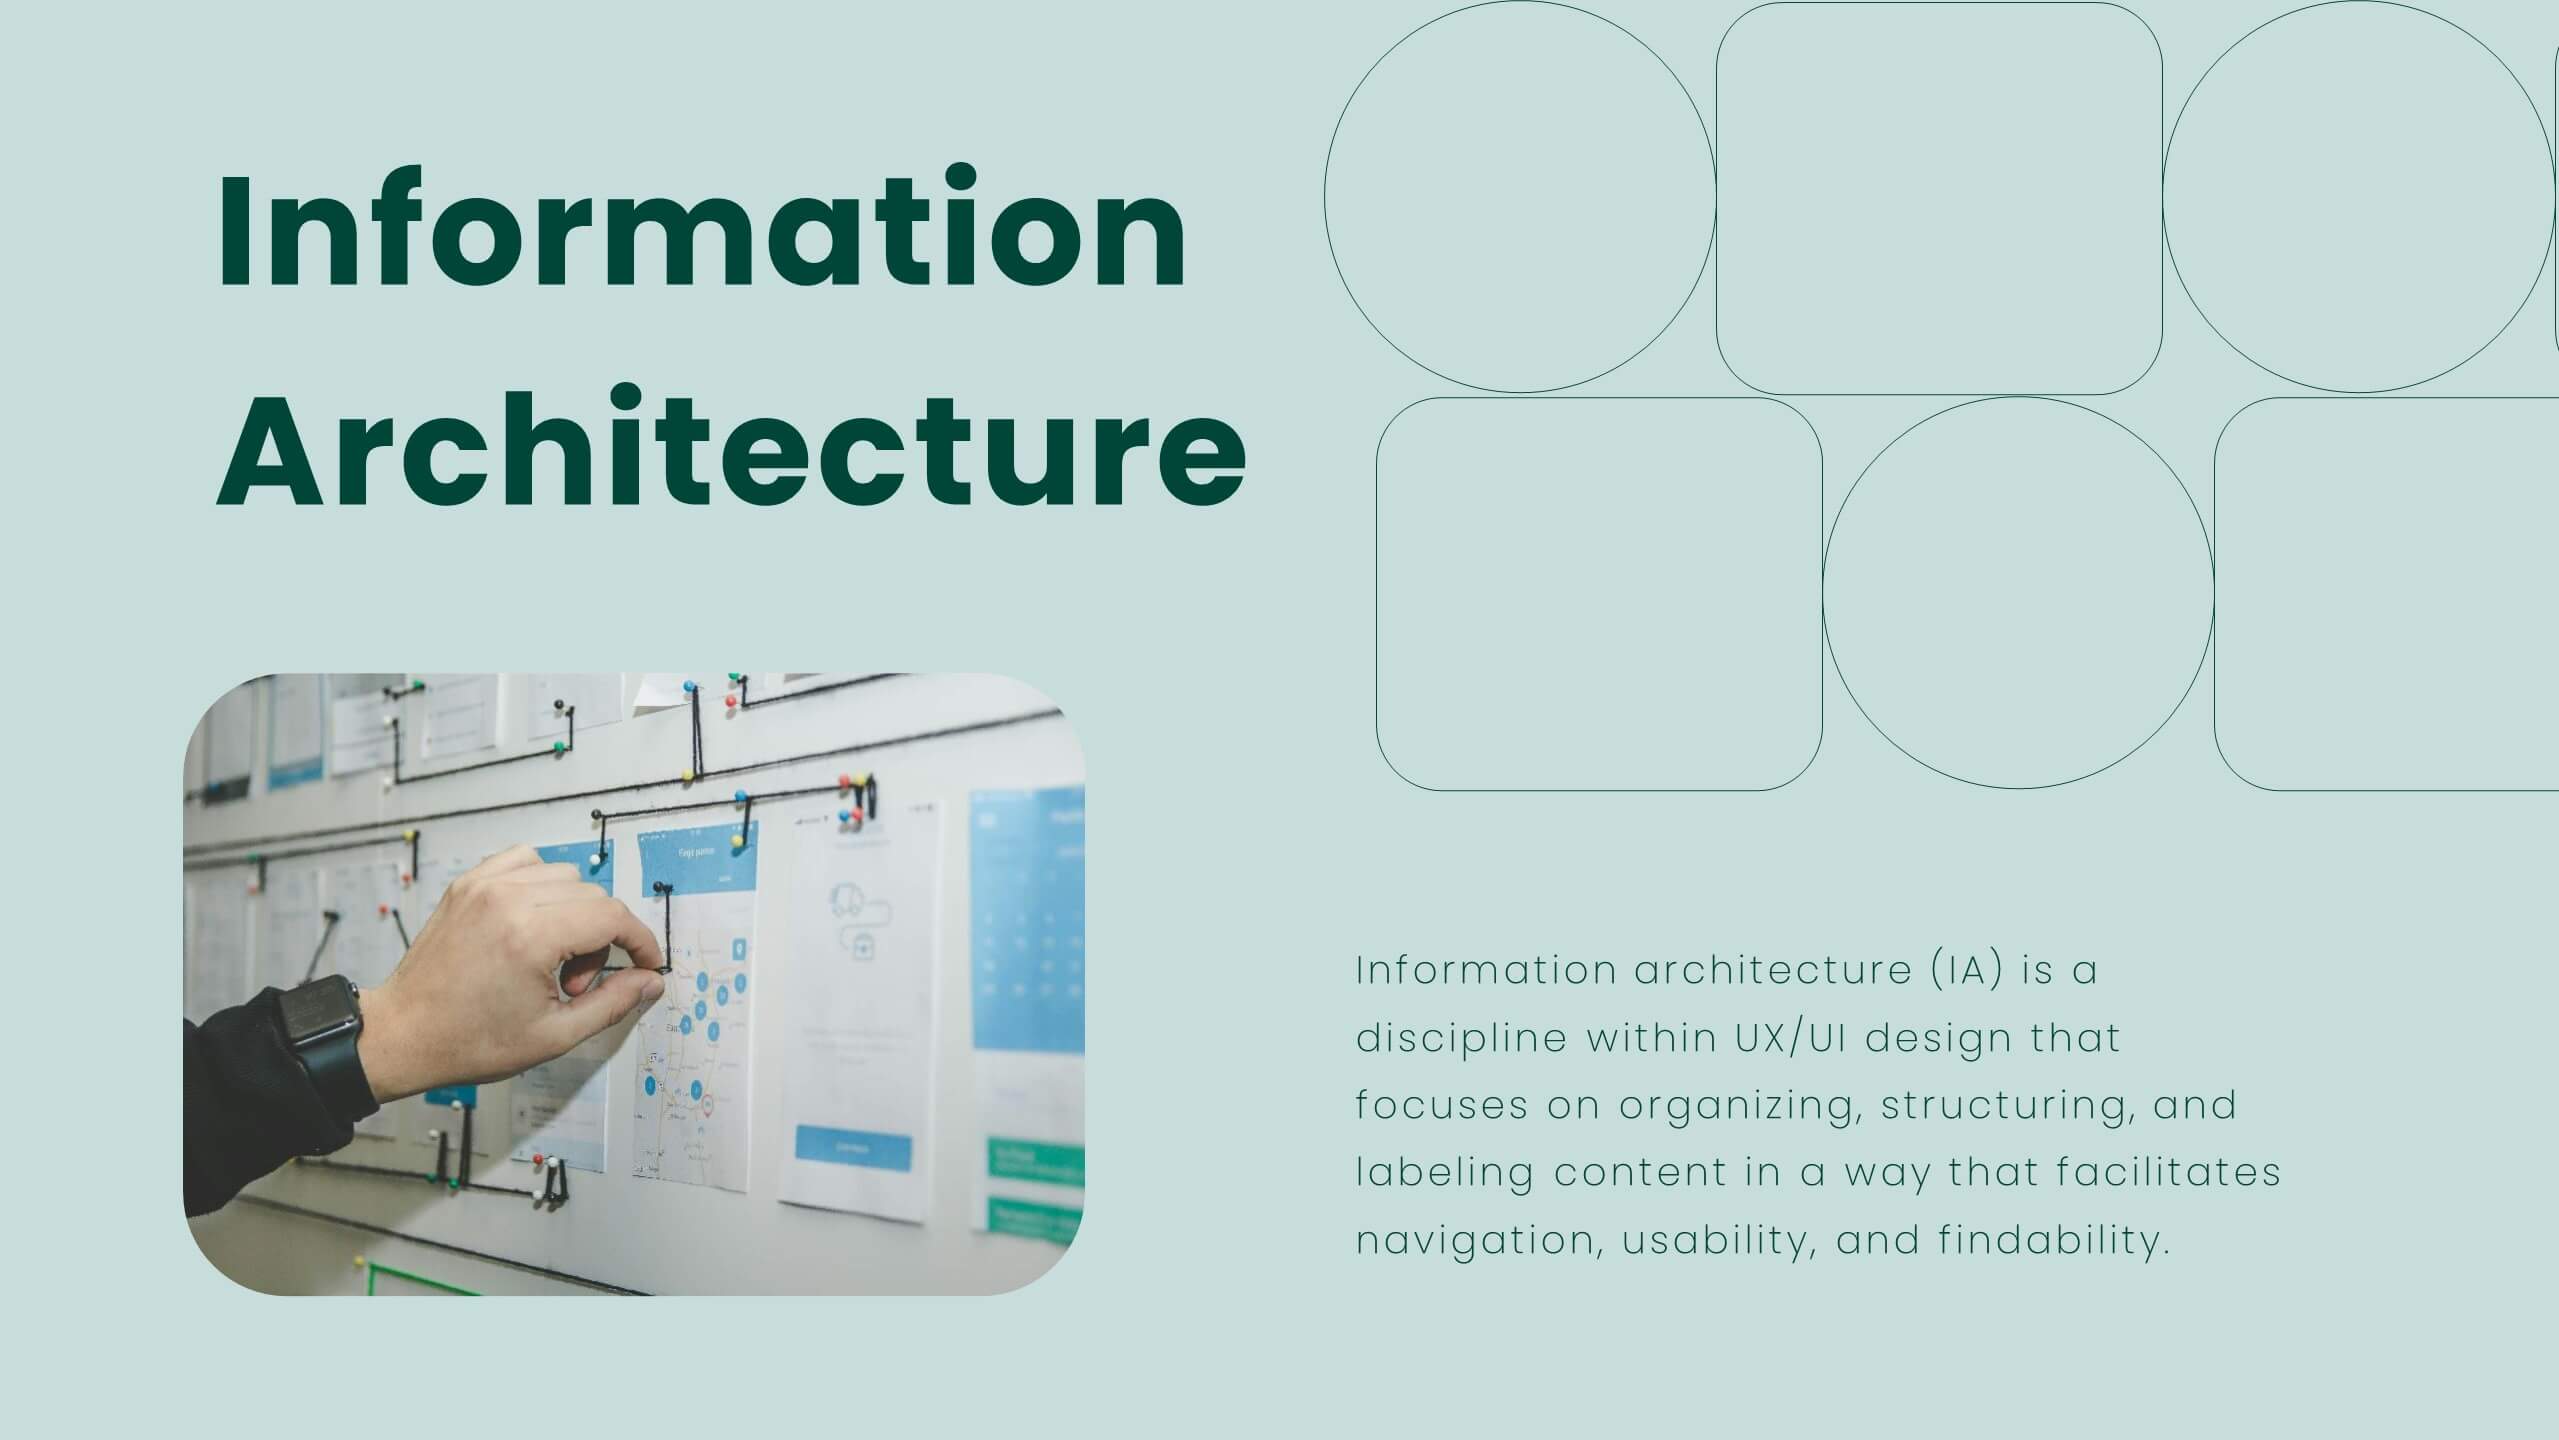
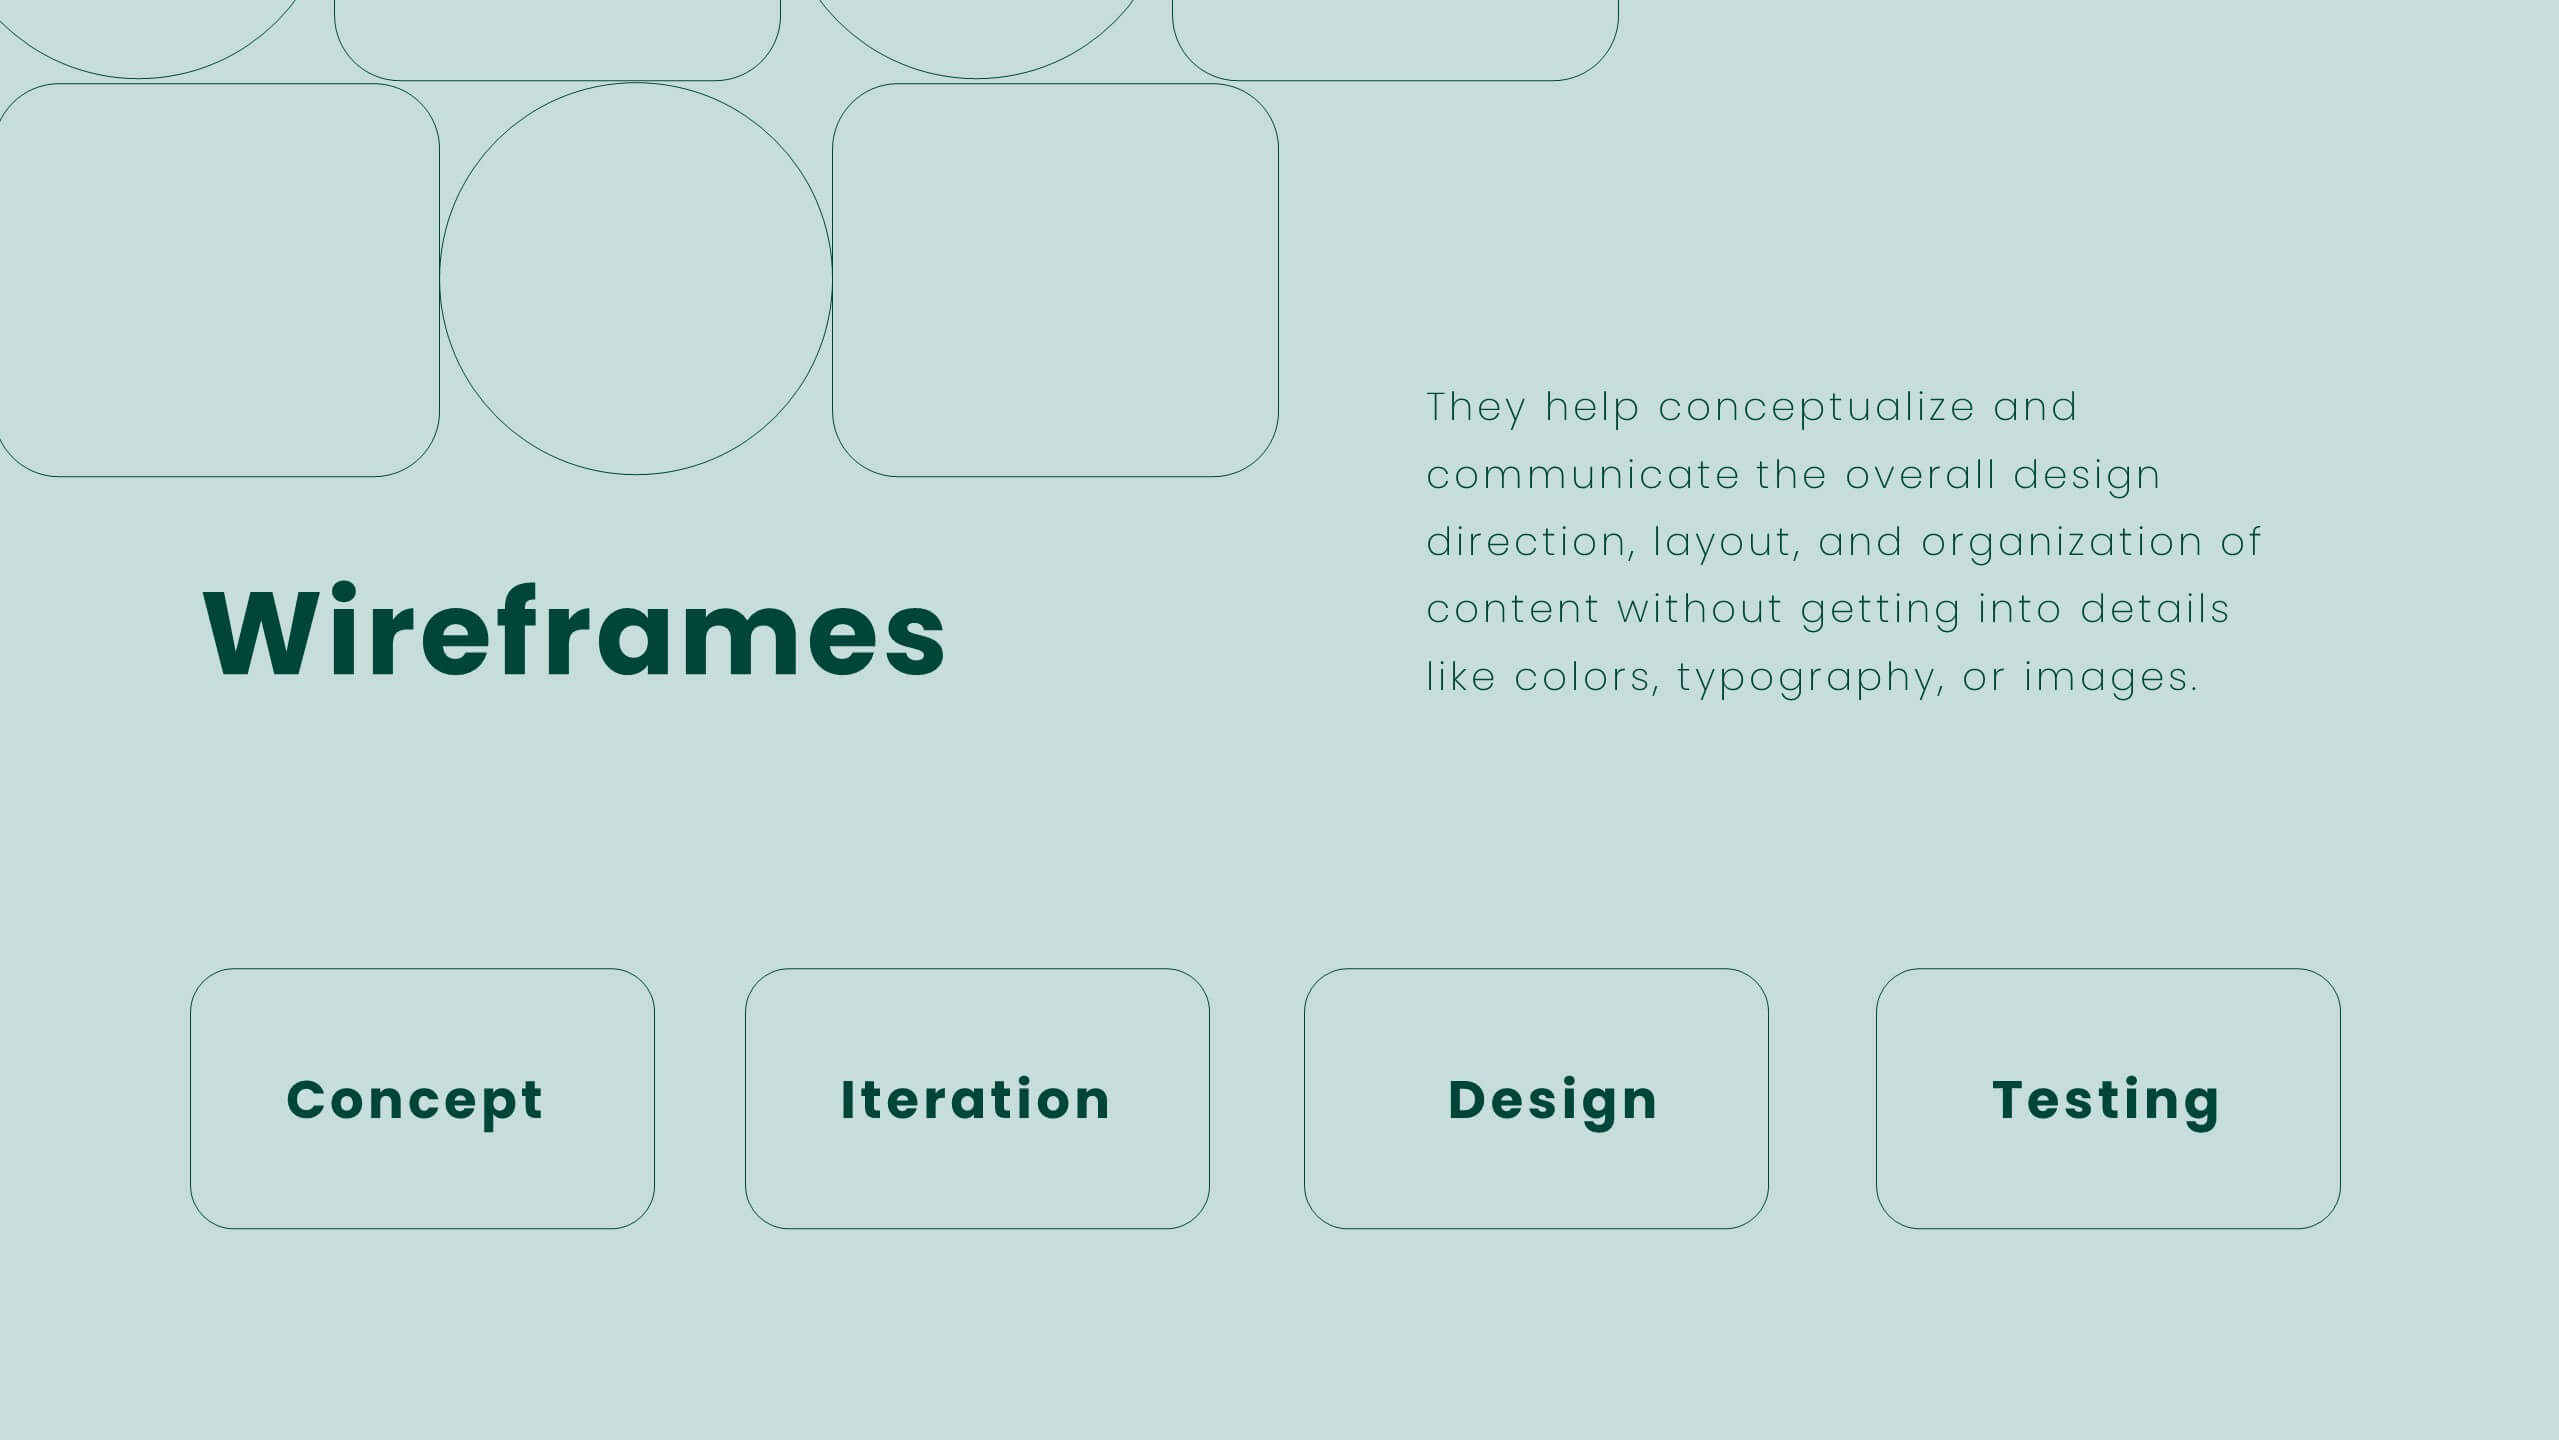
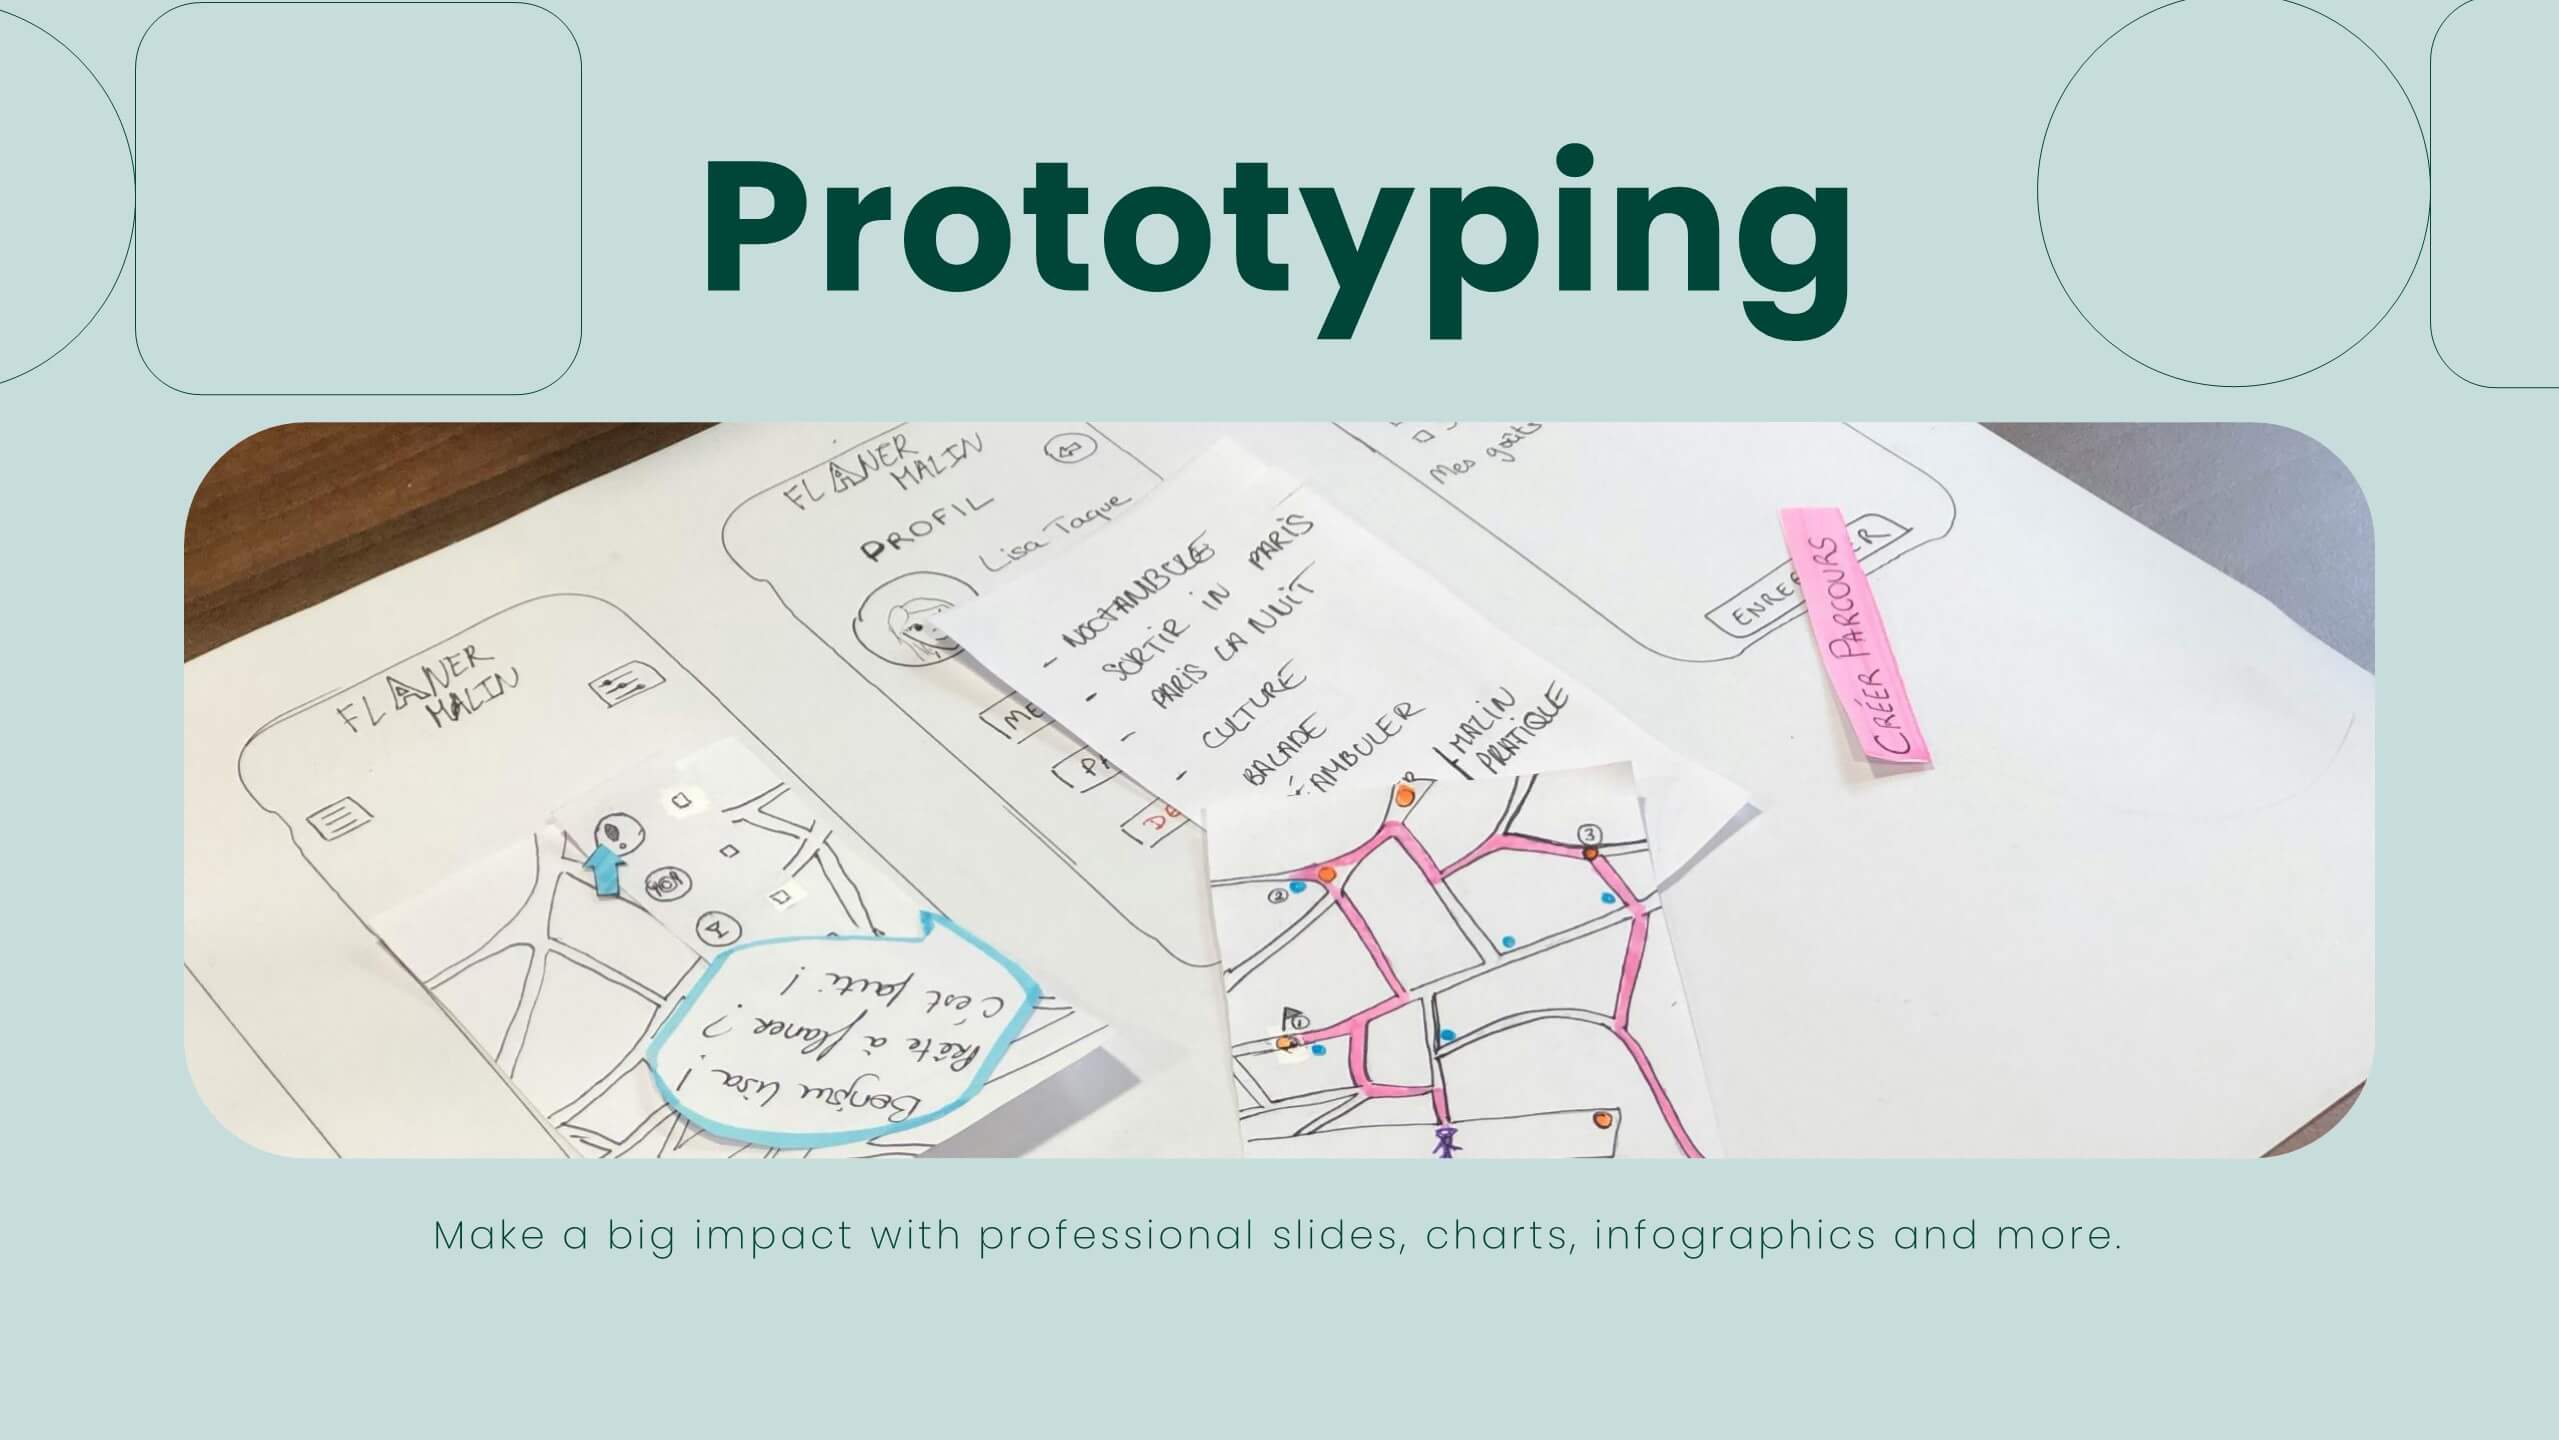
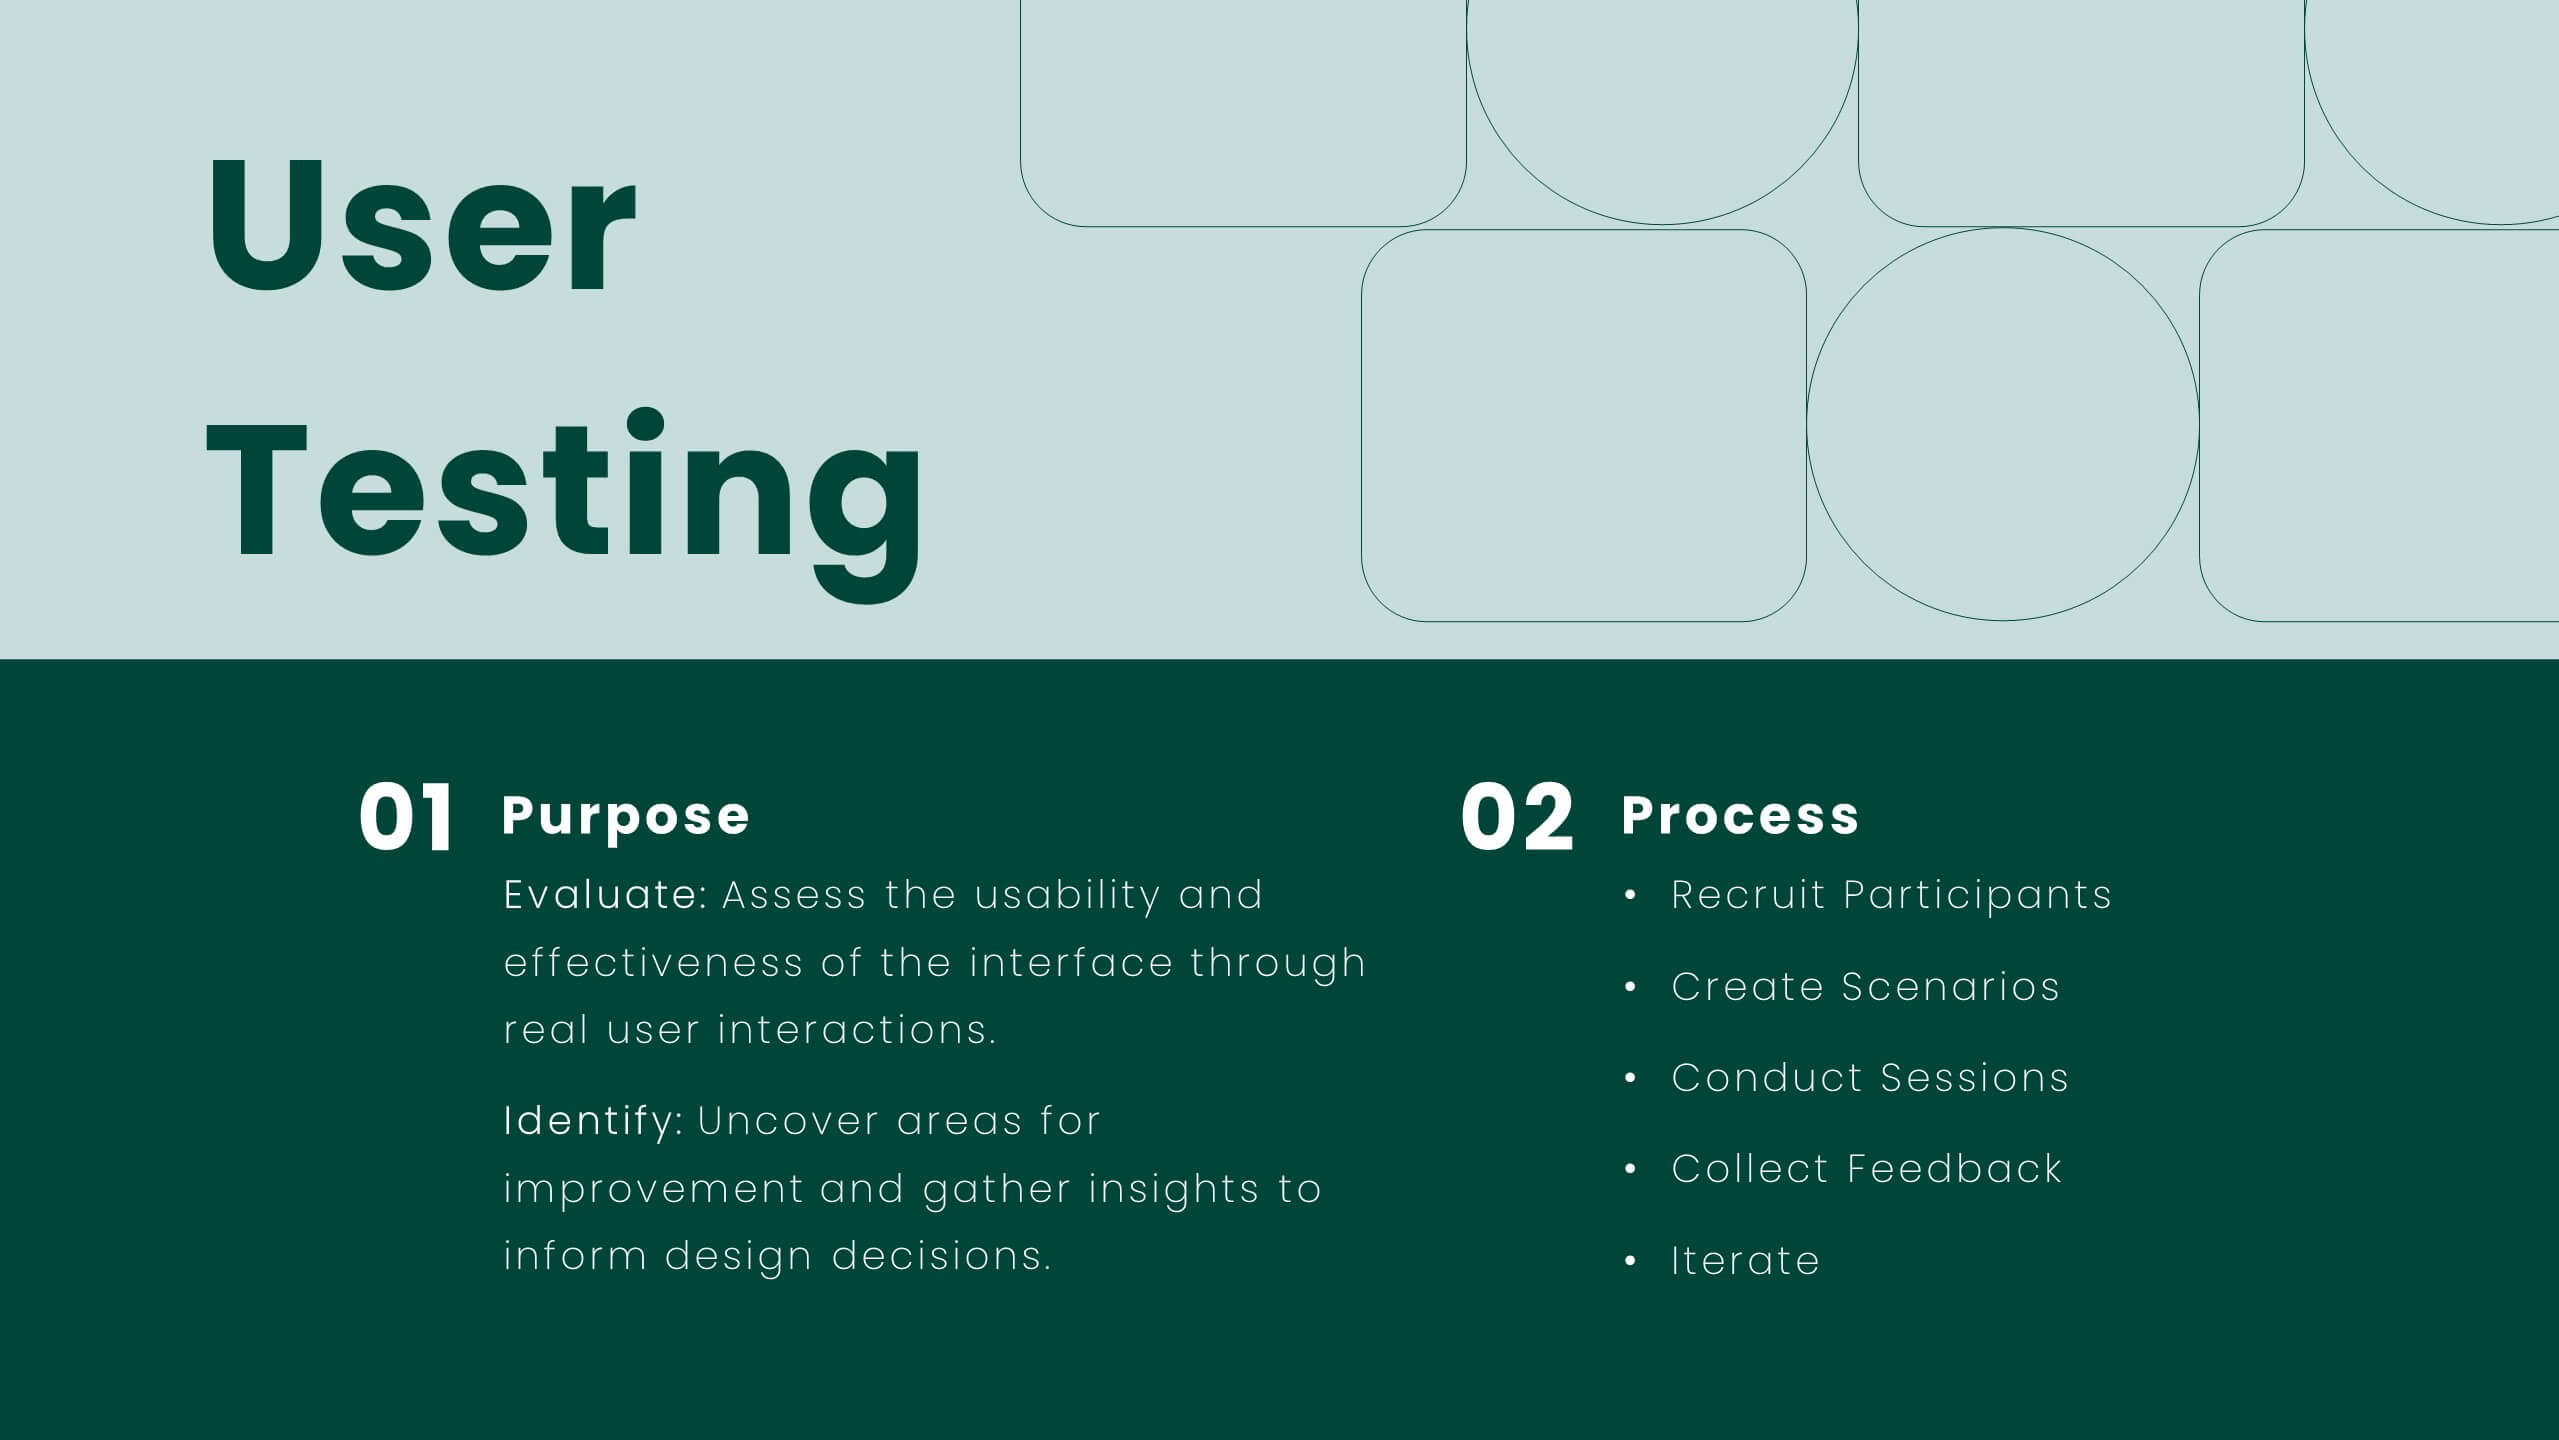
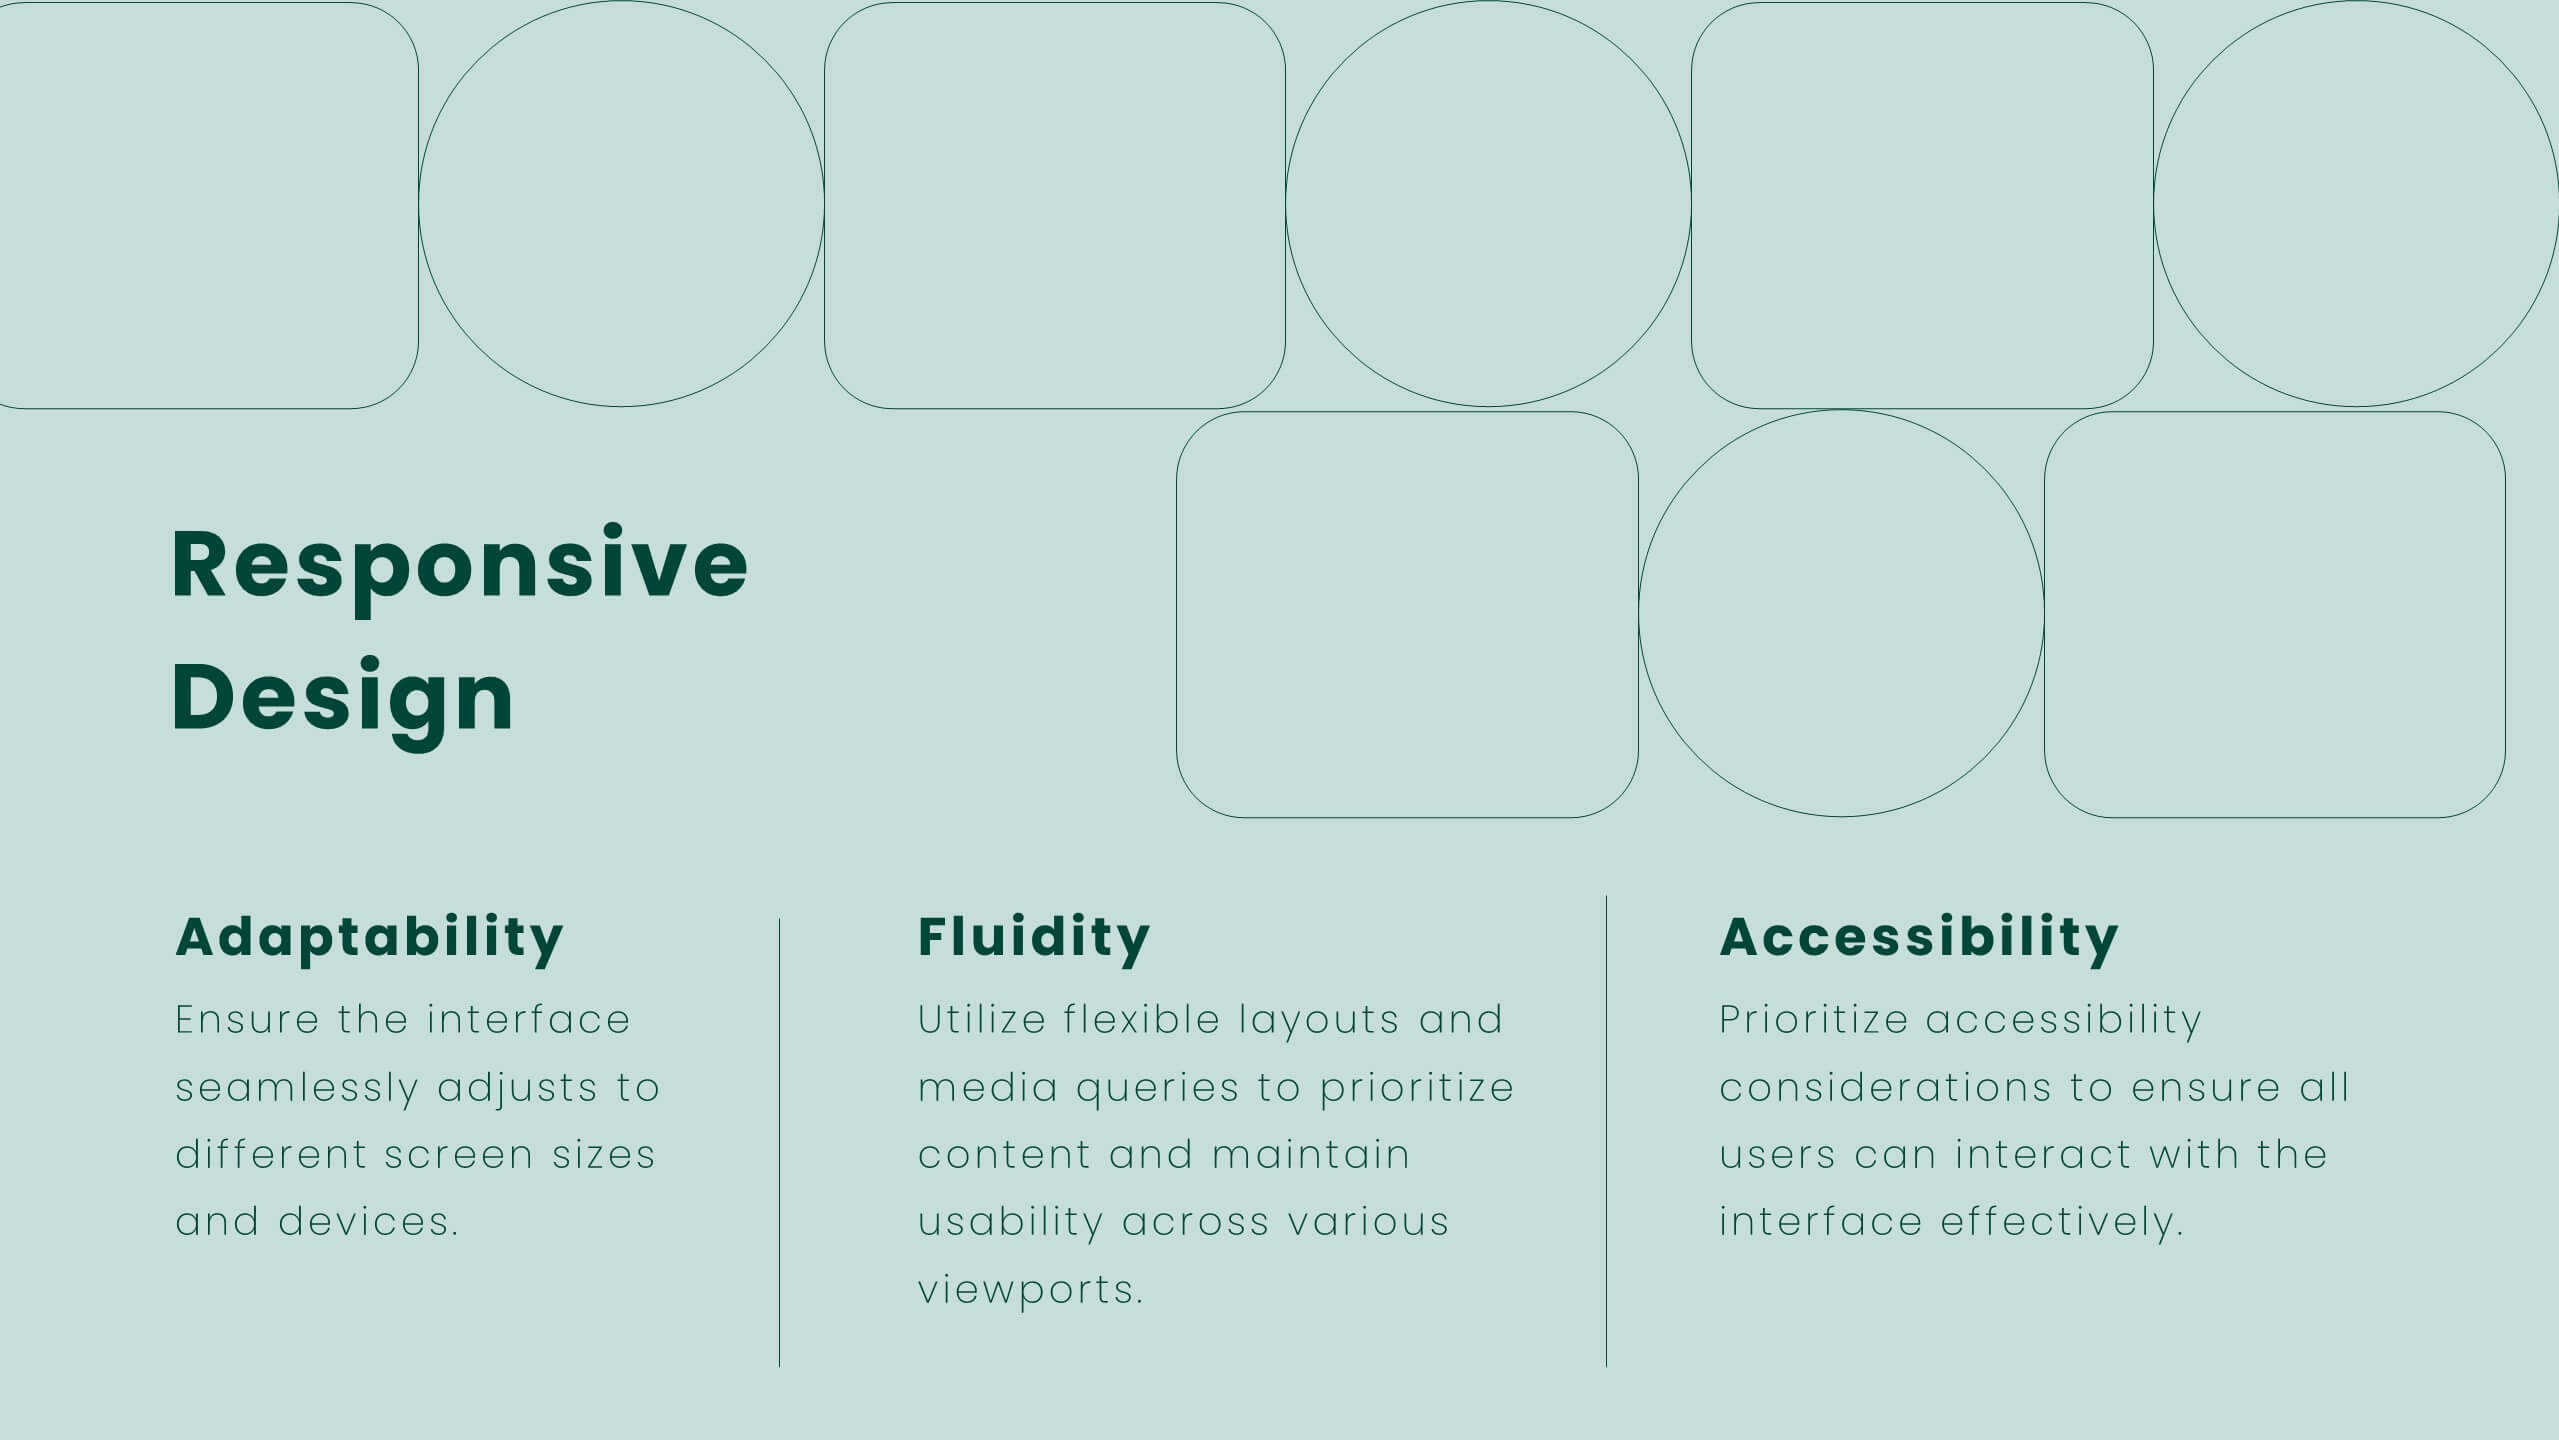
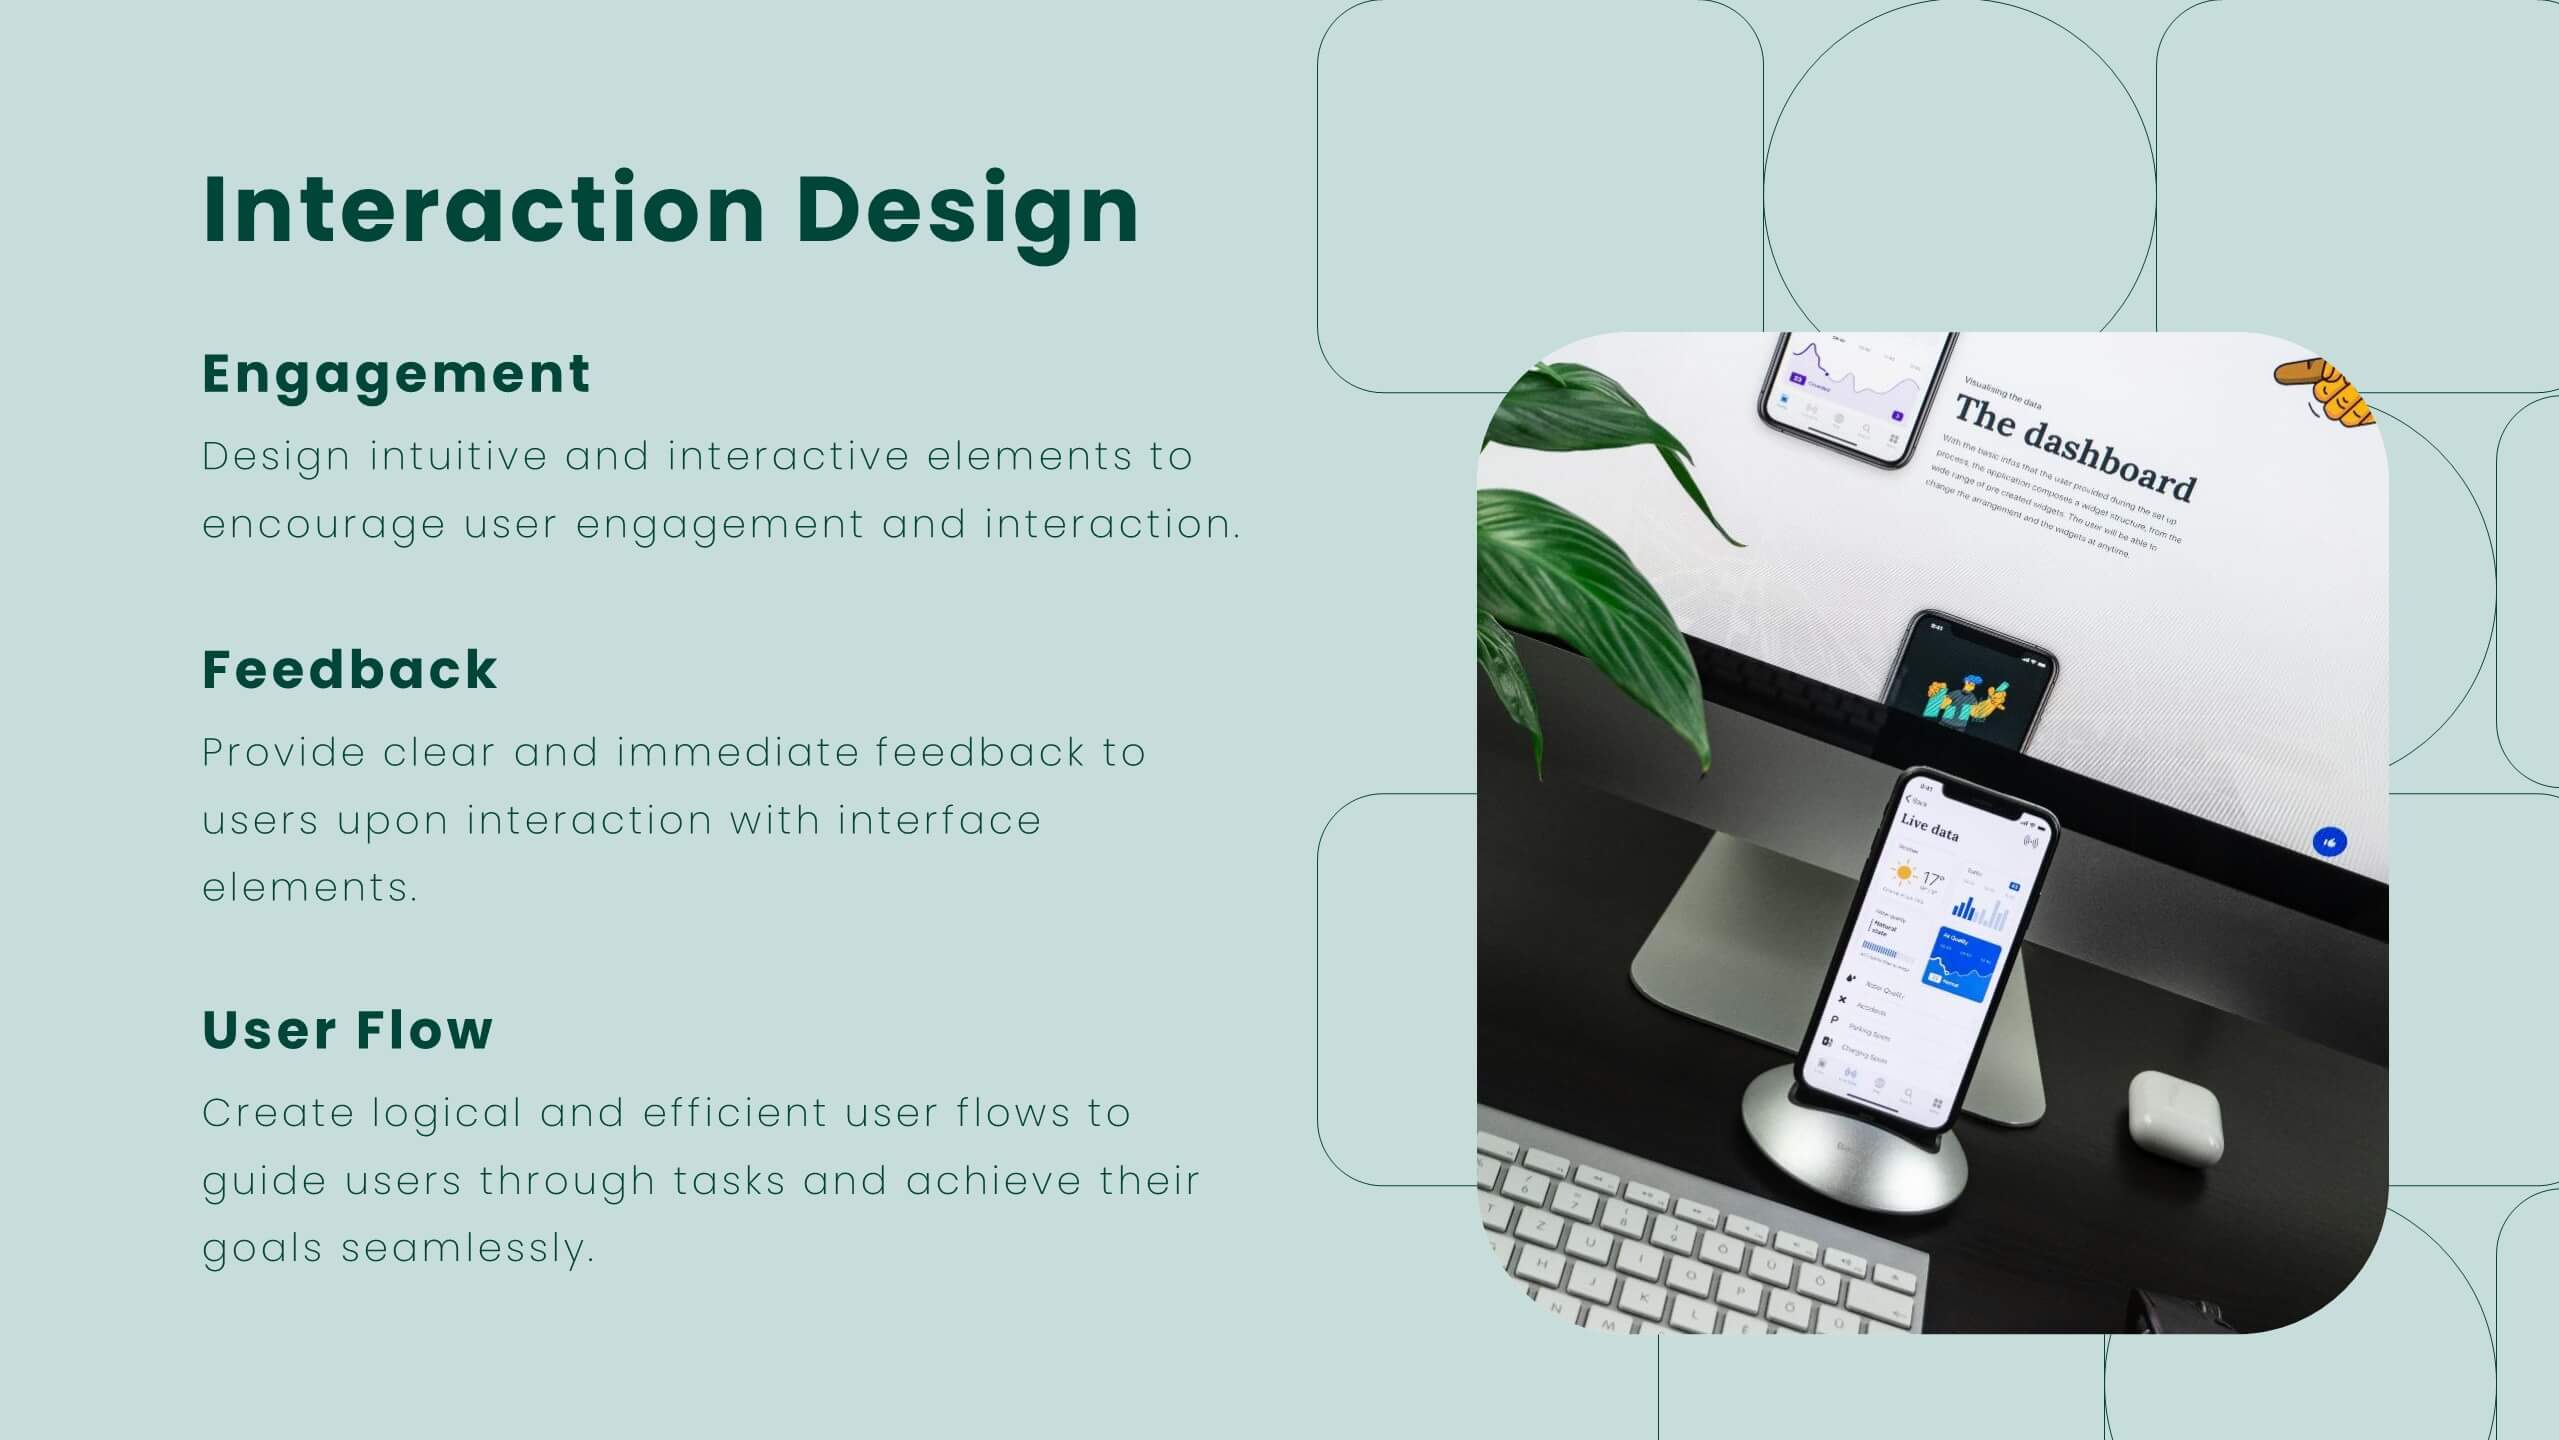
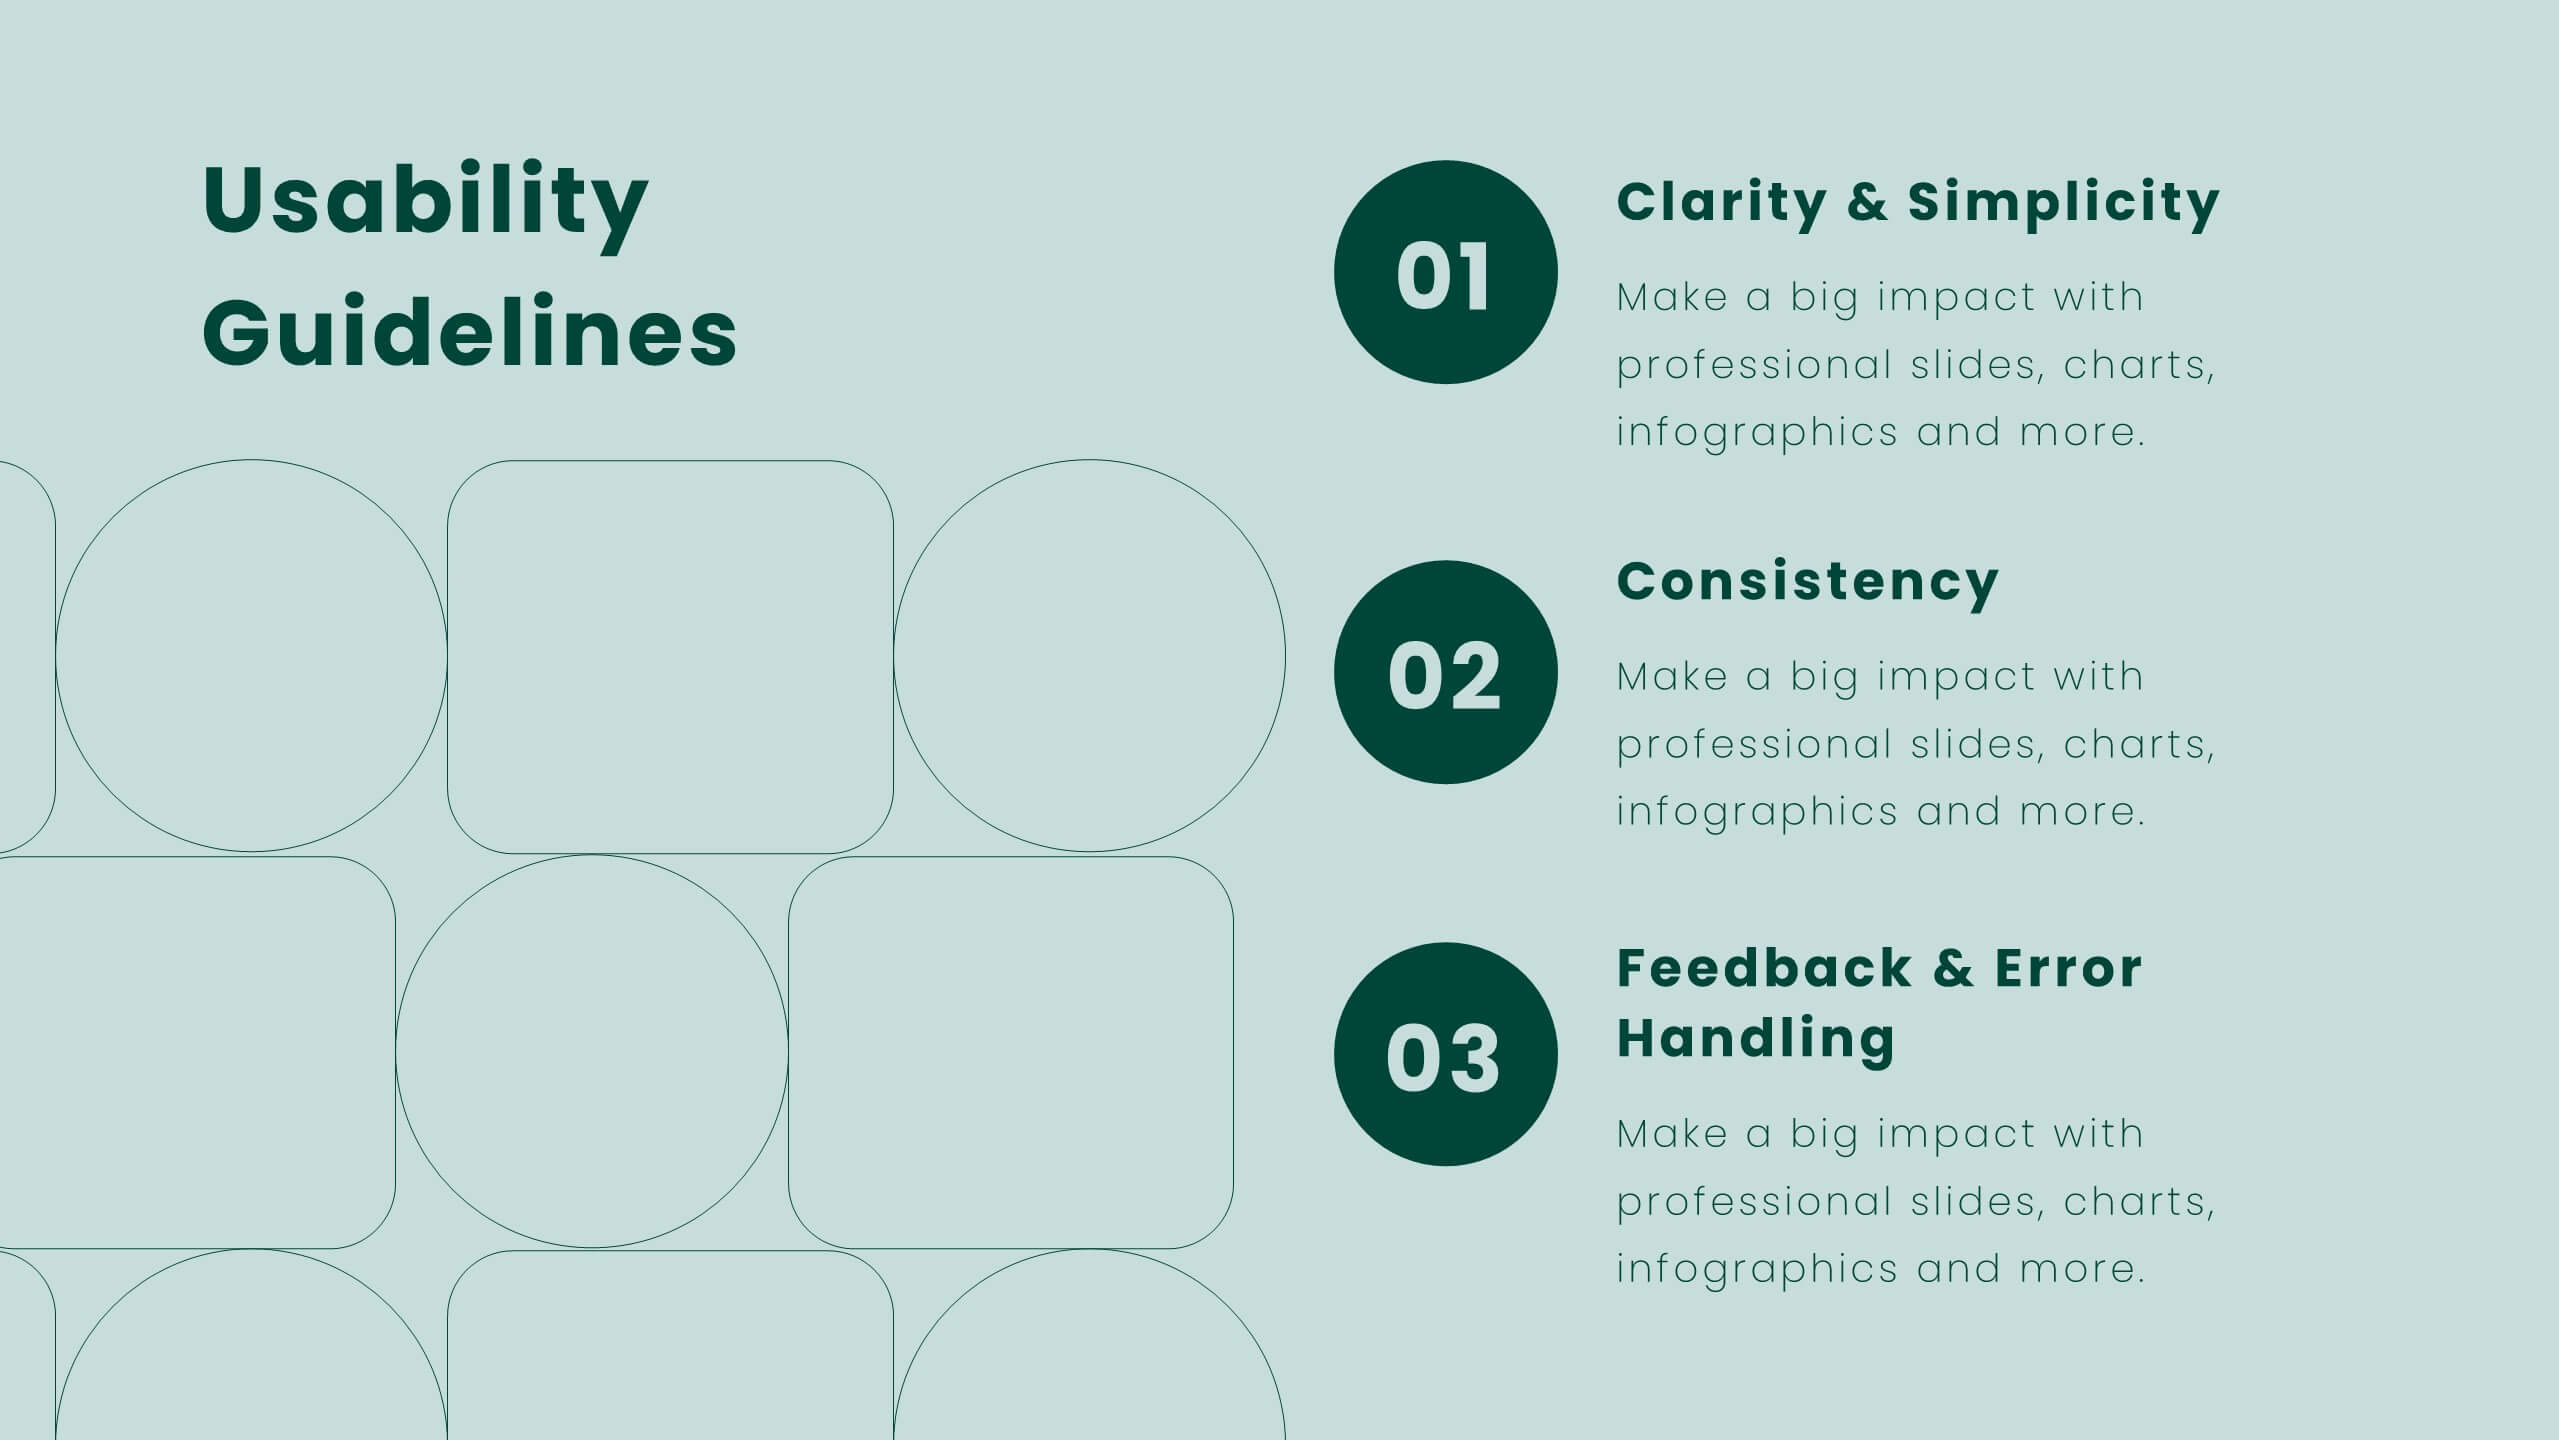
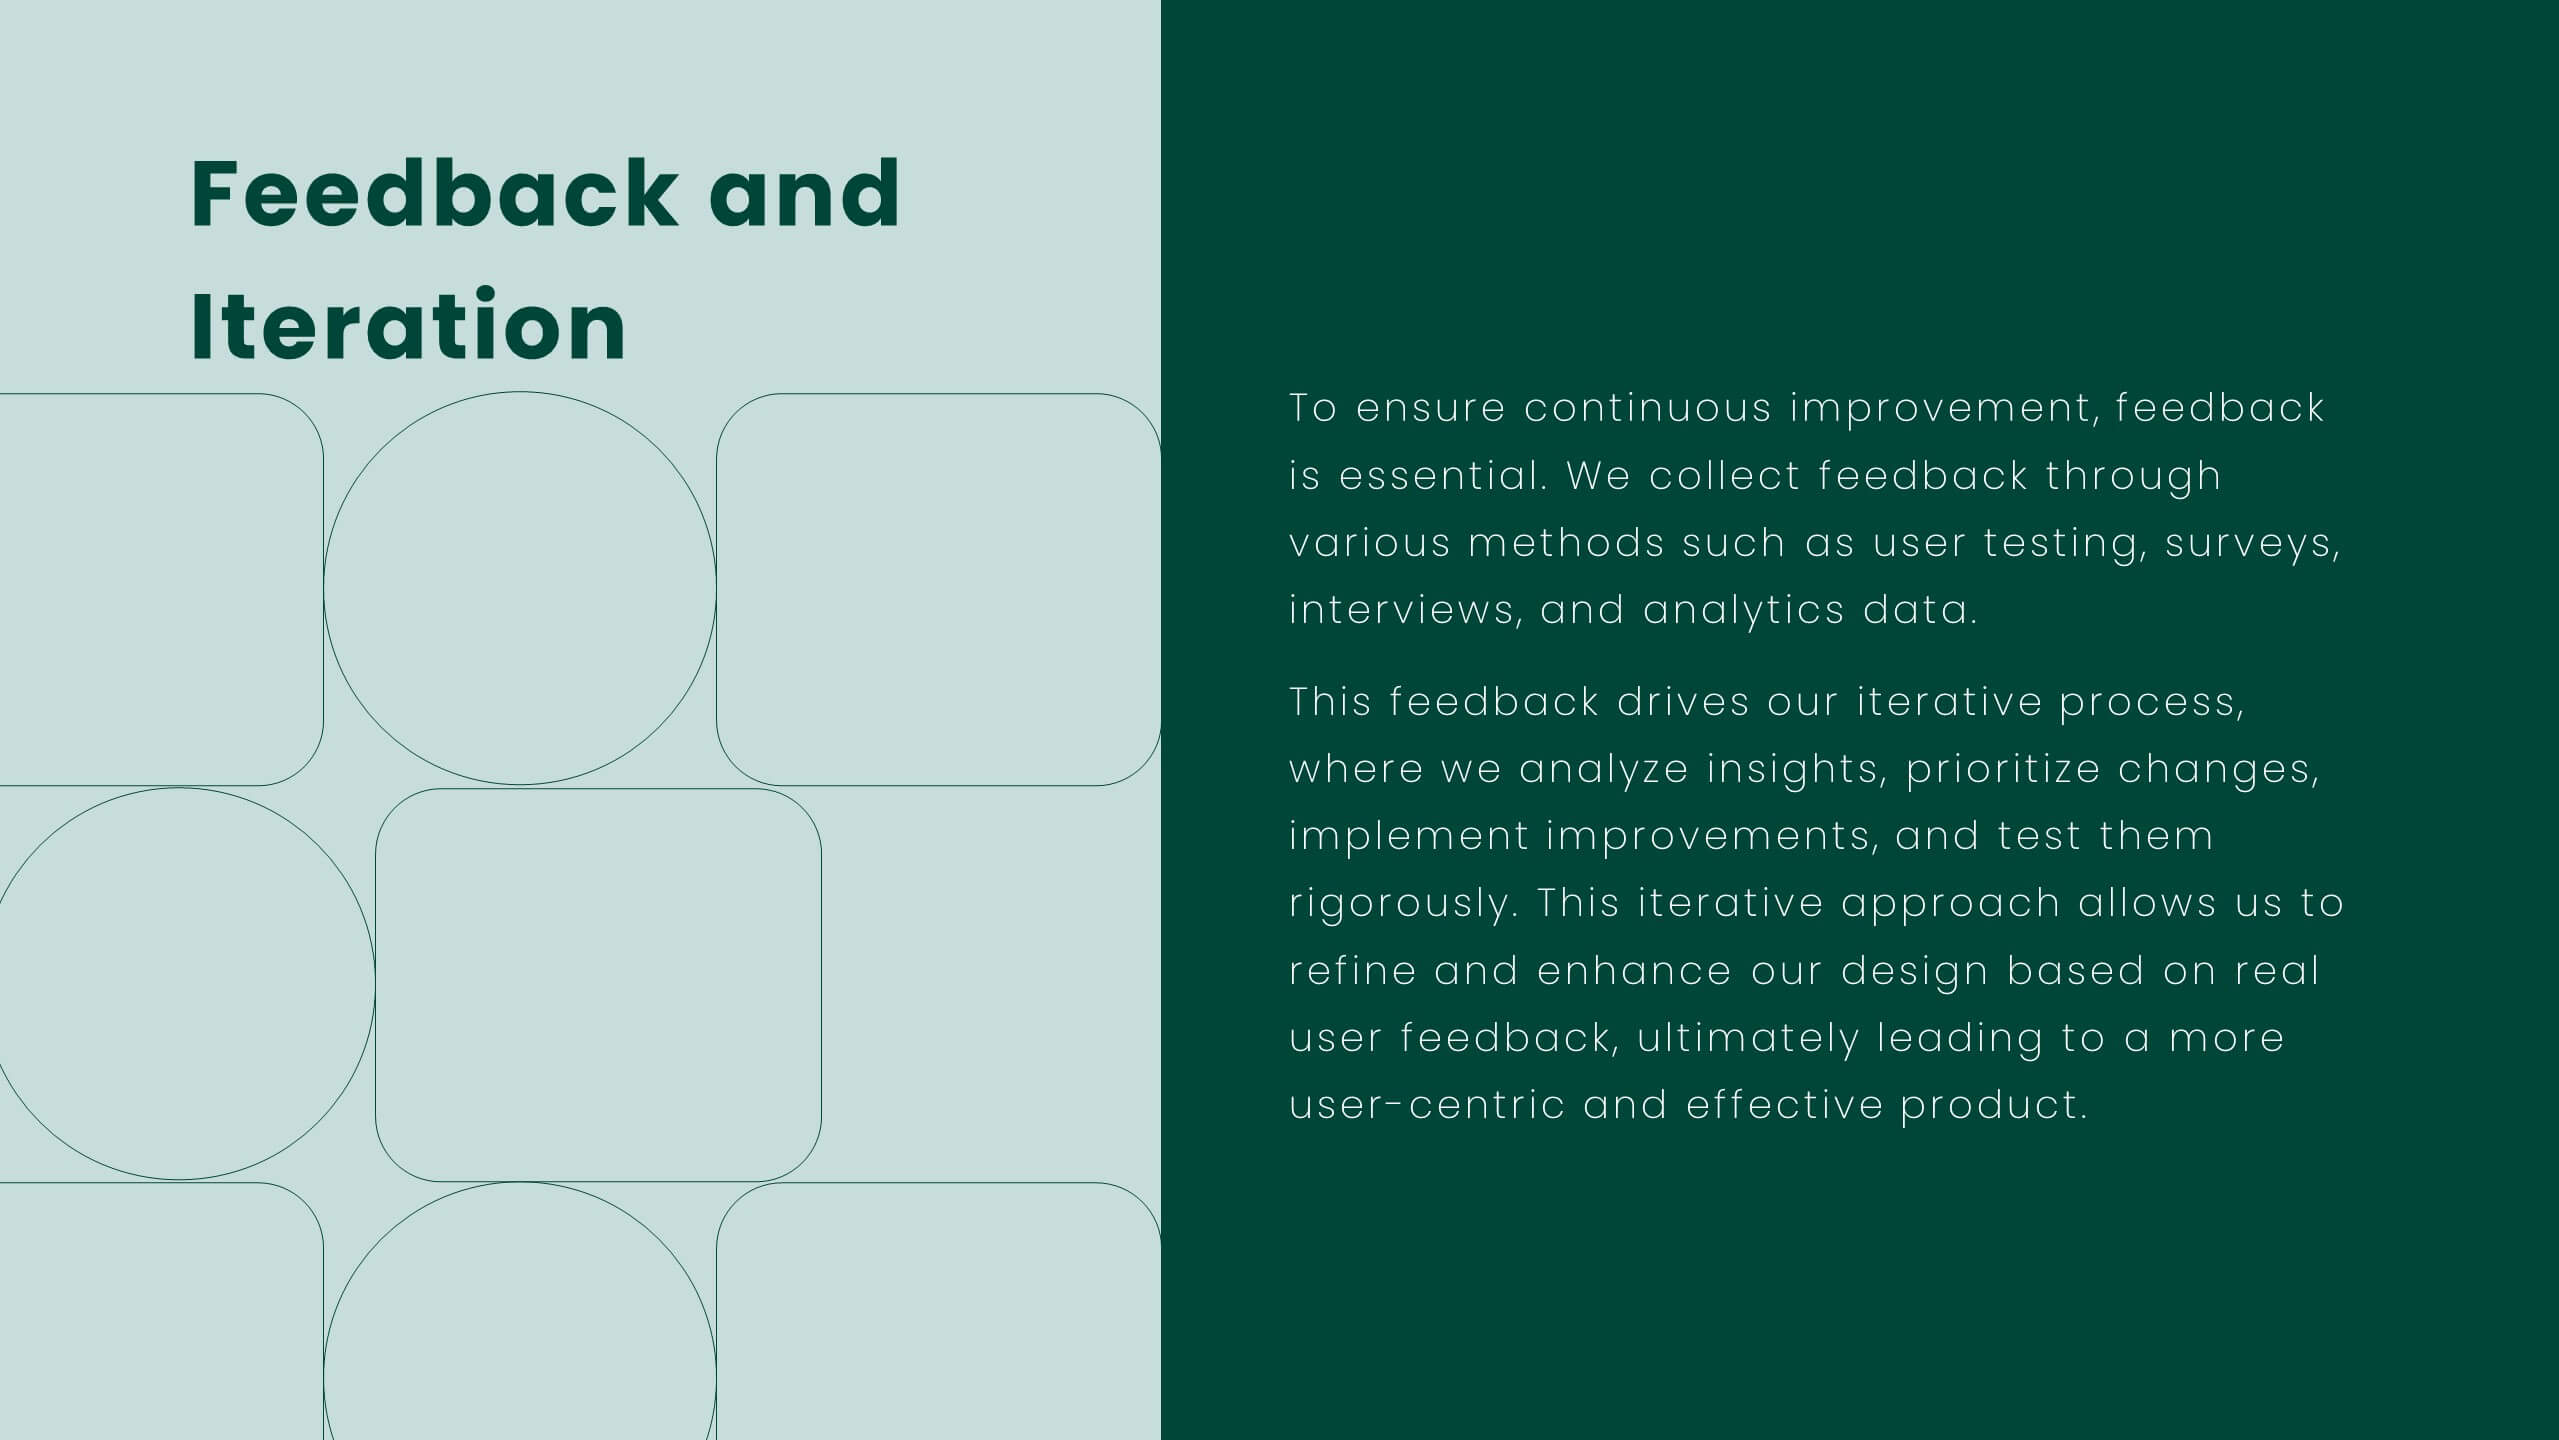
Lumina UX Case Study Presentation
Create compelling UX case studies with this modern template. Cover user research, personas, wireframes, and prototyping. Perfect for showcasing UI design principles, responsive design, and usability guidelines. Highlight feedback, iteration, and project showcase. Compatible with PowerPoint, Keynote, and Google Slides. Elevate your UX presentations and impress stakeholders with clear, detailed insights.


20 slides
Creative Marketing Proposal Presentation
Elevate your business proposals with this sleek marketing proposal template, designed in dynamic purple tones. It comprehensively covers everything from company overview to pricing structures, making it perfect for detailing your marketing strategies effectively. Compatible with PowerPoint, Google Slides, and Keynote, it's ideal for professionals aiming to impress clients and secure projects.


6 slides
Annual Scheduling with Calendar Milestones Presentation
Make your year feel like a well-oiled machine with this bold, color-coded visual layout. It helps you map out project phases, monthly milestones, and long-term plans with clarity and structure. Ideal for strategy meetings or annual reviews, this editable template works seamlessly in PowerPoint, Keynote, and Google Slides.


4 slides
Side by Side Comparison Presentation
Enhance your presentations with our "Side by Side Comparison Presentation" template. Designed for clarity, this infographic facilitates effective comparison of key business insights across multiple categories using a side-by-side layout. Color-coded arrows distinctly mark each comparison point, ensuring easy navigation and comprehension. Ideal for strategic reviews, product comparisons, or competitive analyses, this template helps present complex data clearly and engagingly. Its structured format is perfect for professionals looking to articulate differences and similarities effectively. Fully compatible with PowerPoint, Keynote, and Google Slides, it's an indispensable tool for those needing to present comparative data succinctly and persuasively.


6 slides
Problem-Solving Framework for Business Success Presentation
Streamline your approach to complex challenges with this 6-step business problem-solving framework. This professional slide layout clearly separates each stage—from identifying the issue to implementing solutions—using easy-to-edit circular markers and concise content boxes. Ideal for consulting pitches, internal planning, or strategy development, this slide is fully customizable in PowerPoint, Keynote, and Google Slides.


5 slides
Ishikawa Fishbone Diagram Presentation
Bring clarity to problem-solving with a visual that makes root-cause analysis feel simple and intuitive. This presentation helps you map issues, organize insights, and highlight contributing factors with clean, structured design. Perfect for workshops, audits, and process improvement. Fully compatible with PowerPoint, Keynote, and Google Slides.


23 slides
Wave Small Business Pitch Deck Presentation
This business pitch deck is your key to winning over investors! It covers everything from company background and product overview to SWOT analysis and market opportunity. With clear visuals of financial performance and strategic goals, this deck provides the perfect roadmap for success. Ideal for PowerPoint, Keynote, and Google Slides presentations!


5 slides
Key Business Question Breakdown Presentation
Present critical insights with this keyhole-themed layout, perfect for outlining strategic business questions or core decision points. The six-segment format allows you to break down complex topics into clear, actionable areas. Fully customizable in Canva, PowerPoint, or Google Slides—ideal for planning, workshops, or stakeholder presentations.


8 slides
Leadership and Management Presentation
The "Leadership and Management" presentation template uses a mountain metaphor to visually depict the challenges and achievements in leadership and management roles. Each slide features a series of peaks, symbolizing different stages or goals within a project or initiative. The climbers on various parts of the mountain can represent team members or leaders at different phases of their tasks. This template is versatile, suitable for presentations aimed at discussing strategies, milestones, or team dynamics in corporate settings. It offers a clear and engaging way to present complex information through a straightforward visual narrative.


3 slides
Financial Planning and Budget Forecast Presentation
Present your financial goals with clarity using the Financial Planning and Budget Forecast Presentation. This modern, minimalist layout helps you break down percentage allocations, forecast future spending, and visualize budget insights with eye-catching graphics. Perfect for finance teams, startups, and consultants. Fully customizable in PowerPoint, Google Slides, Keynote, and Canva.


7 slides
Bubble Map Diagram Presentation
A Bubble Map Infographic is a visual representation that uses bubbles to convey information. It is used to display geographic data, such as population density, sales figures, or distribution of resources. In this template the size of the bubbles represents the value of the data being presented, with larger bubbles indicating a higher value. The color of the bubbles may also be used to indicate different categories or levels of the data. This infographic can be customized with different colors, fonts, graphics, text boxes, charts, and other visual aids to suit all your needs.


5 slides
Banking Services Infographics
Banking Services refer to the financial and investment services provided by banks to individuals, businesses, and other organizations. These Infographics are visual representations of information about different types of banking services provided by various financial institutions. This infographic provides an overview of the key features, benefits, and drawbacks of each service, such as checking/saving accounts, credit cards, and online banking. Included are statistics, charts, and other visual aids to convey data more effectively. The aim is to help individuals make informed decisions about the right banking services for their needs.


4 slides
Root Cause Analysis for Problem Solving
Tackle problems from the inside out with this structured and easy-to-follow layout. This root cause analysis template helps you clearly map out underlying issues and visualize their impact in one slide. Ideal for team discussions, audits, and presentations—fully editable in PowerPoint, Keynote, and Google Slides for maximum flexibility.