


Features
- 8 Unique slides
- Fully editable and easy to edit in Microsoft Powerpoint, Keynote and Google Slides
- 16:9 widescreen layout
- Clean and professional designs
- Export to JPG, PDF or send by email


Do you have any questions?
Recommend


8 slides
Cloud Data Storage and Security Presentation
Visualize cloud security effortlessly with this Cloud Data Storage and Security template. Designed for IT teams, cybersecurity professionals, and cloud architects, this slide simplifies complex data protection strategies, storage models, and access controls. Featuring a modern cloud-based layout with clear, structured elements, it ensures easy interpretation of key security components. Fully editable and compatible with PowerPoint, Keynote, and Google Slides for seamless presentations.


4 slides
Project Task Ownership with RACI Chart Presentation
Assign roles clearly with the Project Task Ownership with RACI Chart Presentation. This template simplifies responsibility mapping across tasks using the RACI framework (Responsible, Accountable, Consulted, Informed). With a clean matrix layout, it's perfect for project planning, stakeholder alignment, and workflow transparency. Fully editable in PowerPoint, Canva, and Google Slides.


7 slides
North America Political Map Infographic
This North America Political Map infographic template provides a visual representation of various data points across the continent. It is compatible with PowerPoint, Google Slides, and Keynote, making it versatile for different presentation platforms. The template includes different styles of maps and charts, such as population statistics, demographic data, and economic indicators. Color-coded for easy interpretation, it allows presenters to highlight specific regions and data with clarity. The design is clean and professional, with icons and graph elements that enhance the presentation of geographical and statistical information.


10 slides
Farming Technologies and Crop Management
Present cutting-edge insights with the Farming Technologies and Crop Management Presentation. This visually compelling slide uses wind turbine illustrations to symbolize innovation in agriculture. Ideal for showcasing smart farming tools, sustainable practices, and crop optimization strategies. Fully editable and compatible with PowerPoint, Keynote, and Google Slides.


6 slides
Seven Factors for Business Success Presentation
Present key drivers of business success with this visually balanced 7-element diagram. Featuring Systems, Structure, Strategy, Skills, Staff, Style, and Shared Value, this slide is ideal for strategic planning and leadership presentations. Fully customizable in PowerPoint, Keynote, and Google Slides to match your branding and presentation objectives.


22 slides
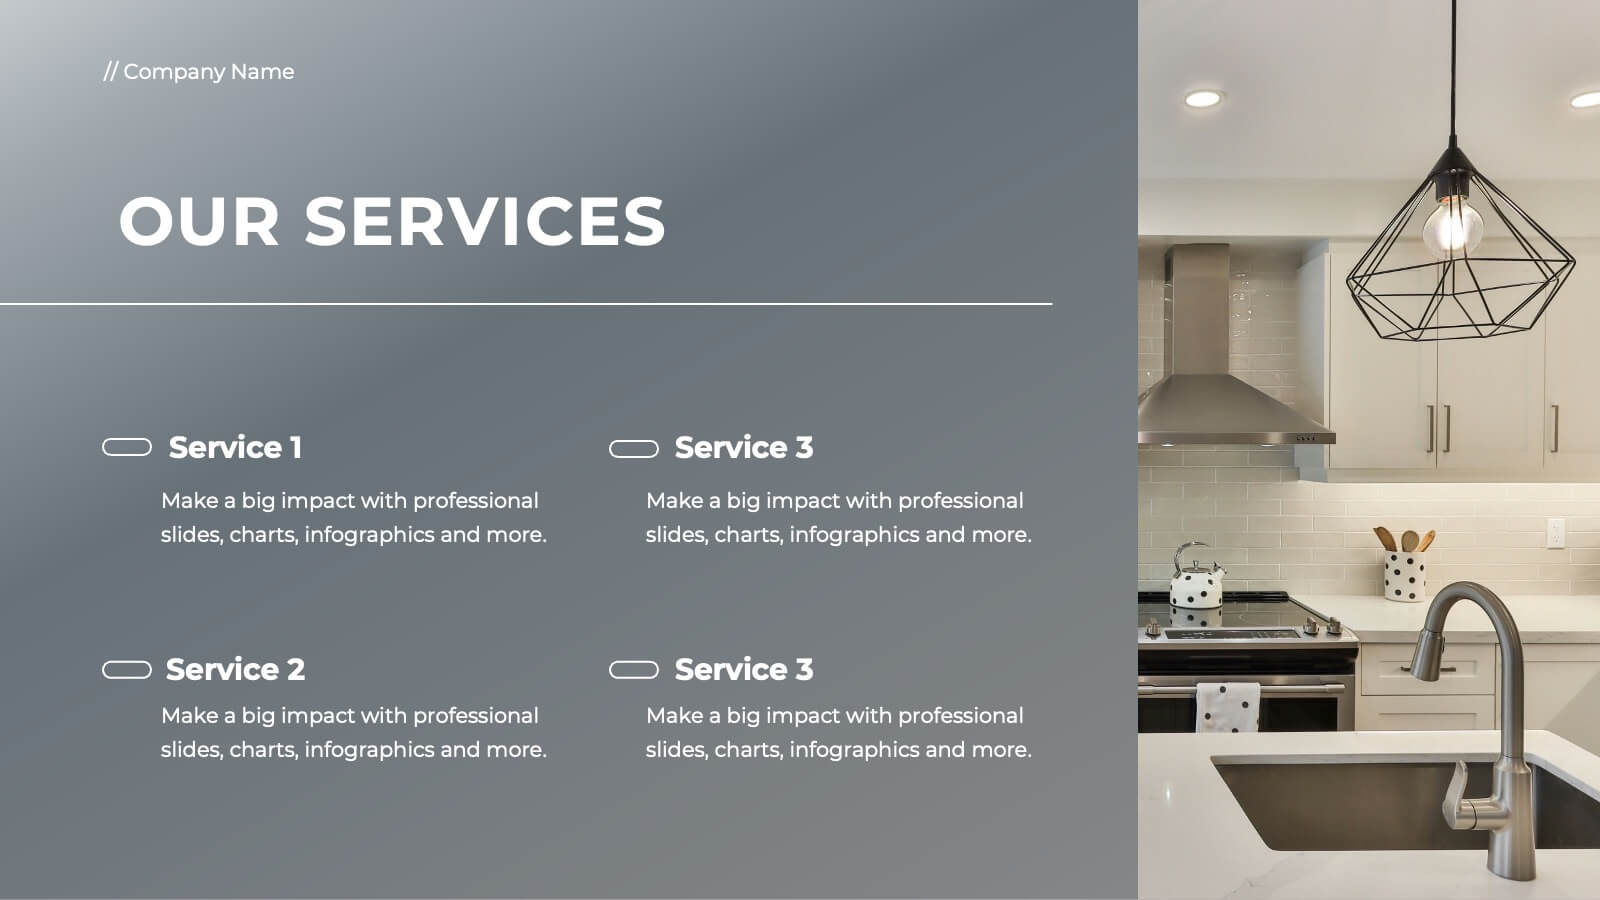
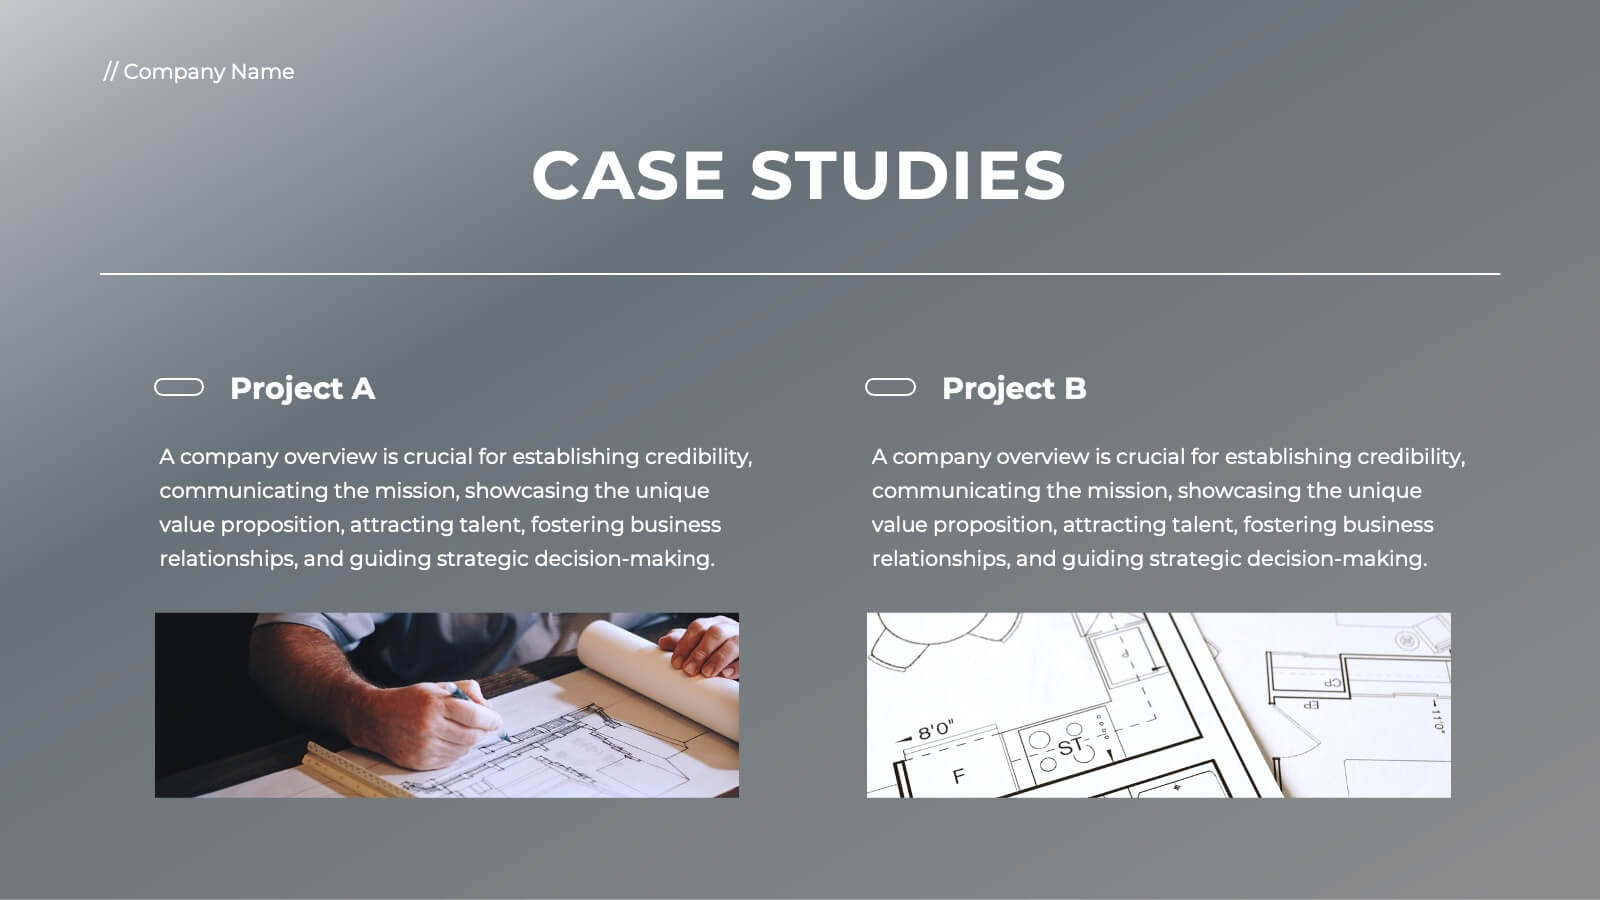
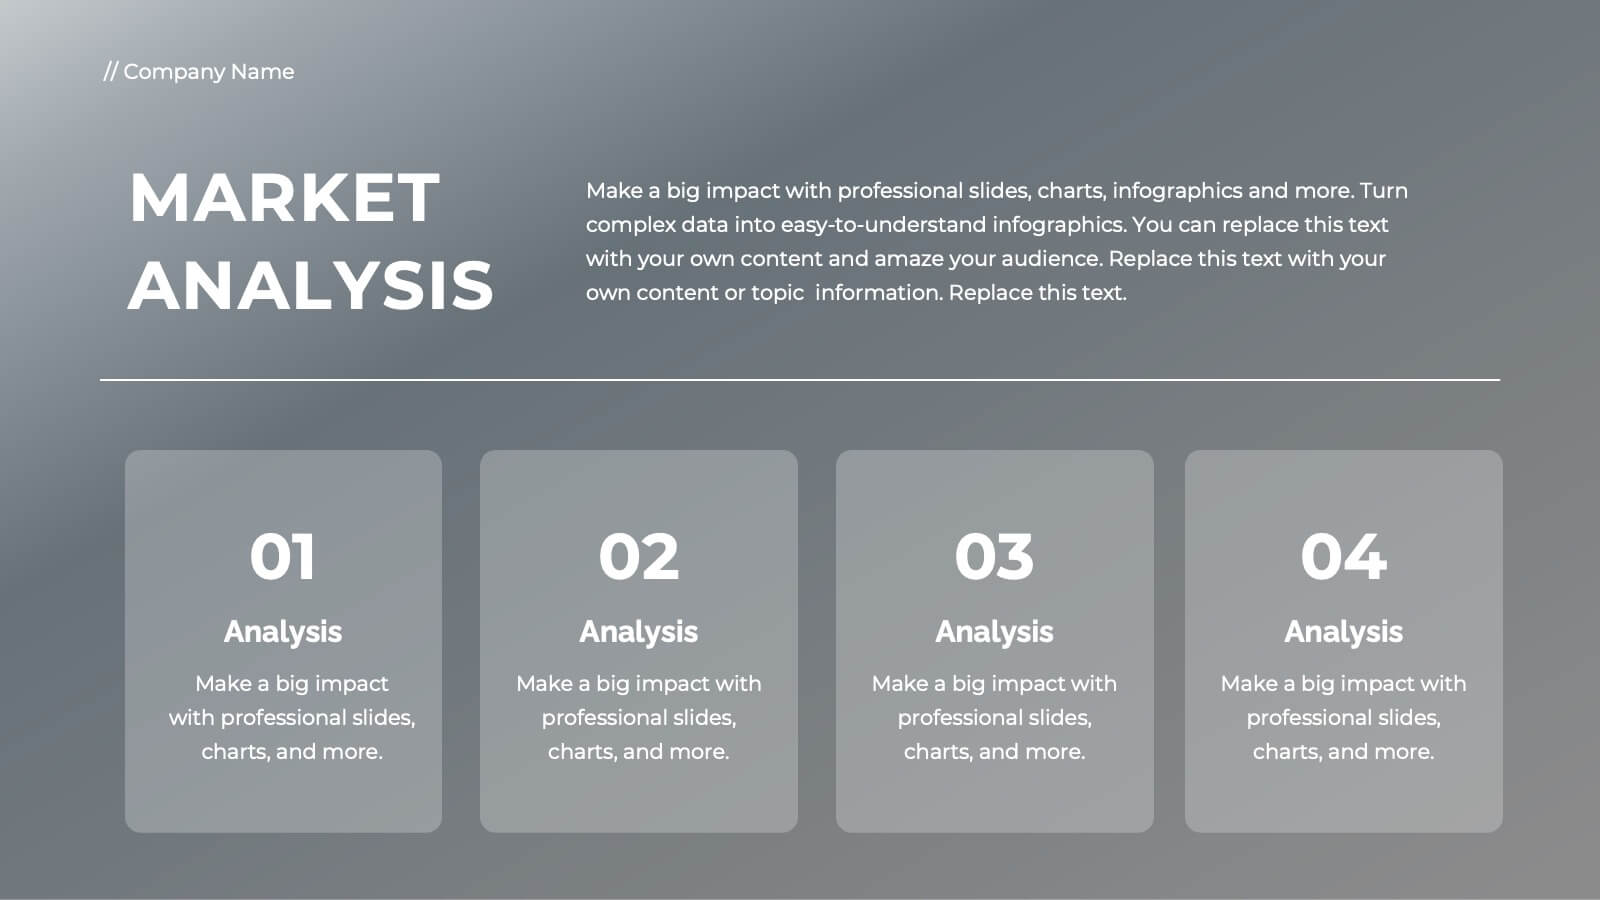
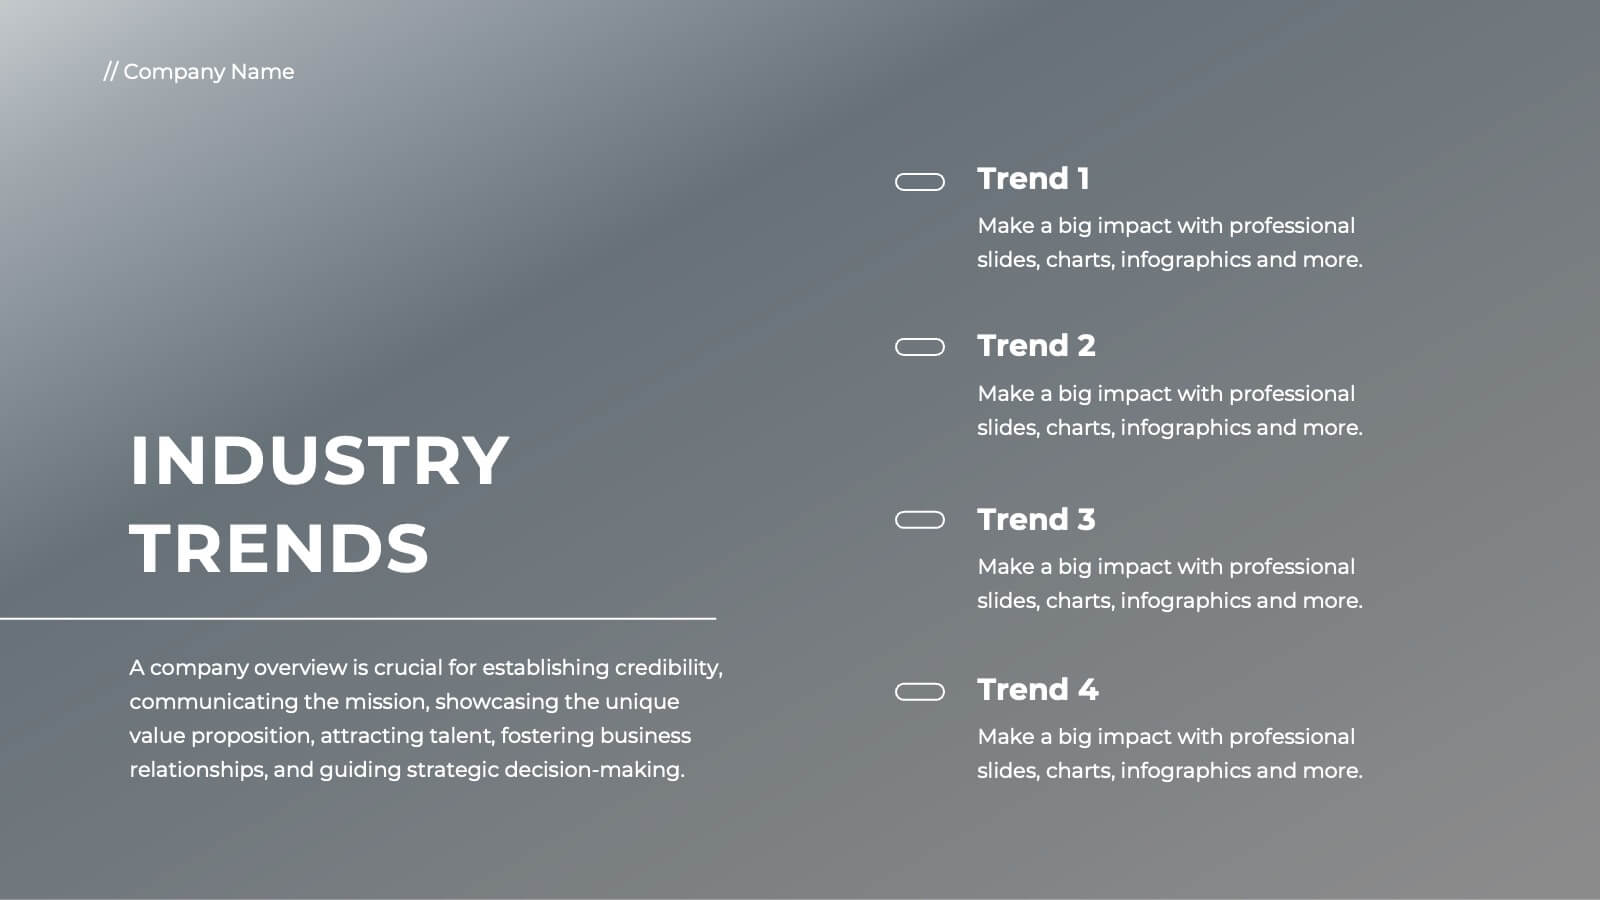
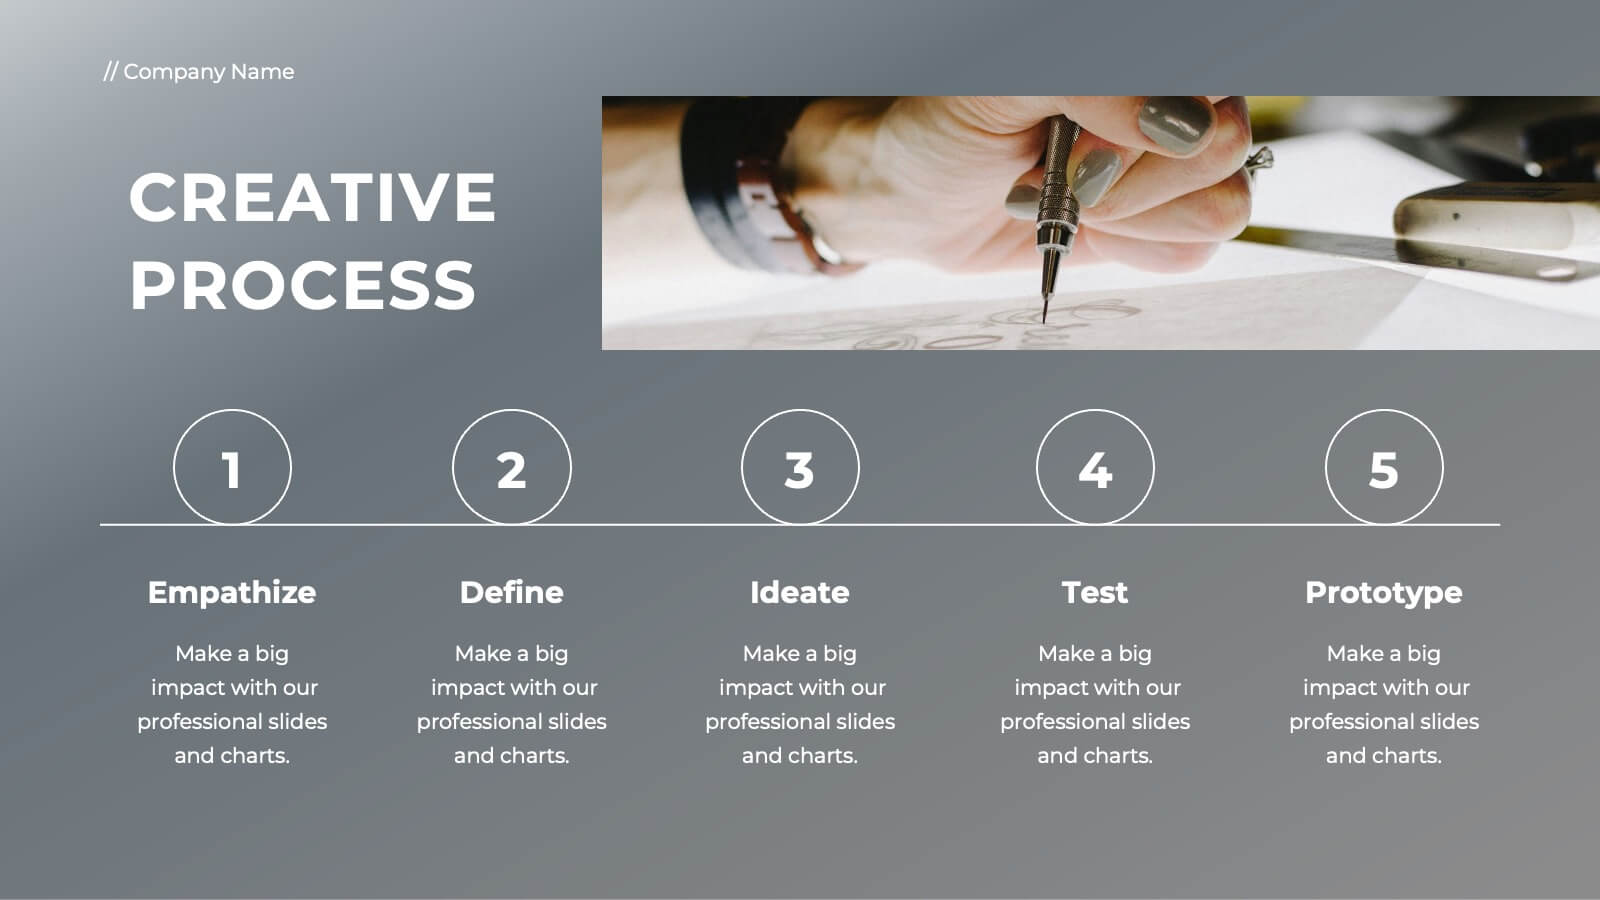
Ember Full-Service Agency Project Plan Presentation
Elevate your agency's presentation with this sleek project plan template! Ideal for showcasing your team's vision, market analysis, and client success stories, it includes slides for strategic development, campaign execution, and partnerships. Impress clients and stakeholders with professional visuals and detailed content. Compatible with PowerPoint, Keynote, and Google Slides for seamless presentations on any platform.


5 slides
Cost Analysis and Budgeting
Visualize financial shifts with clarity using the Cost Analysis and Budgeting Presentation. This slide template uses a dual-stack design to contrast cost reductions against budget increases, supported by percentage change labels and layered visual elements. Ideal for finance teams, operations reviews, or executive summaries, this layout highlights five customizable categories per stack. Compatible with PowerPoint, Keynote, and Google Slides, it's fully editable to match your company branding and color palette.


5 slides
Vegan Guide Infographics
A Vegan Guide is a comprehensive resource that provides information about a plant-based diet that excludes all animal products, including meat, dairy, eggs, and honey. These Vegan Guide Infographics are visual representations of information related to the vegan lifestyle. Cover a wide range of topics, including the benefits of veganism, how to transition to a vegan diet, common misconceptions about veganism, ethical and environmental considerations, and the nutritional requirements of a vegan diet. This can be used by individuals who are interested in adopting a vegan lifestyle, and educators who want to provide information about veganism to their clients and students.


5 slides
Risk and Return Investment Presentation
Navigate the high seas of finance with our captivating infographic presentation template, designed to visually break down the complex relationship between risk and return in investments. This template simplifies presenting key data points, making it ideal for financiers and investors looking to make informed decisions. Each slide is meticulously crafted to ensure clarity and impact, highlighting the balance of potential rewards against possible risks. Perfect for use in PowerPoint, Keynote, and Google Slides, this template is a must-have tool for anyone in the financial sector aiming to convey their strategy with precision and flair.


5 slides
Feedback Assessment with Smile Ratings Presentation
Visually capture user sentiment with this Feedback Assessment with Smile Ratings slide. Featuring a curved layout with emoticons ranging from happy to unhappy, it’s ideal for showcasing satisfaction levels, survey results, or evaluation stages. Fully customizable in Canva, PowerPoint, or Google Slides—perfect for reports, workshops, or performance reviews.


6 slides
Project Roadmap with Strategic Phases Presentation
Visually guide your team through every phase with the Project Roadmap with Strategic Phases Presentation. This template features a curved arrow layout to illustrate project milestones, making it perfect for planning, strategy, or progress updates. Fully customizable in PowerPoint, Google Slides, and Canva for seamless integration into any workflow.


3 slides
Sustainabilitiy Management Plan Framework Presentation
Turn your sustainability goals into a clear, actionable plan with this dynamic presentation design. Ideal for showcasing environmental strategies, performance metrics, and corporate responsibility initiatives, it combines clarity with visual balance to engage audiences. Fully editable and compatible with PowerPoint, Keynote, and Google Slides for seamless customization and delivery.


7 slides
Breast Cancer Day Infographic Presentation Template
National breast cancer day is on October 13th. Every October, people all over the world show their support for everyone affected by breast cancer. This template was designed to help inspire, support and bring awareness to breast cancer. This presentation template was made to help promote the cause and bring awareness to breast cancer. With a focus on pink, this template has lots of space for messaging, as well as opportunities for brand exposure. Easy to modify, and perfect for your next project this template is inspiring to use on your personal website, blog and more to show others.


4 slides
Business KPI Metrics Dashboard Presentation
Track and present your key performance indicators clearly with this Business KPI Metrics Dashboard Presentation. Featuring modern gauge visuals, color-coded performance bars, and sectioned data blocks, this template helps you showcase financial, customer, and operational KPIs in a single glance. Fully editable and ideal for business reviews, team updates, and performance reports. Compatible with PowerPoint, Keynote, and Google Slides.


6 slides
Budget and Expense Breakdown Presentation
Kickstart your financial story with a clean, energetic visual that makes every cost and category instantly understandable. This presentation helps you break down spending, compare expenses, and highlight key budget insights using a simple, structured layout. Perfect for reports and planning meetings. Fully compatible with PowerPoint, Keynote, and Google Slides.


6 slides
Deluxe Loyalty Program Infographics
Explore the Deluxe Loyalty Program with our customizable infographic template. This template is fully compatible with popular presentation software like PowerPoint, Keynote, and Google Slides, allowing you to easily customize it to showcase the features, benefits, and advantages of the Deluxe Loyalty Program. The Deluxe Loyalty Program infographic template offers a visually engaging platform to highlight the rewards, incentives, and exclusive offers available to members of the program. Whether you're a business owner, marketer, or customer relations specialist, this template provides a user-friendly canvas to create informative presentations and promotional materials for your loyalty program. Optimize your loyalty program's visibility and appeal with this SEO-optimized infographic template, thoughtfully designed for clarity and ease of use. Customize it to showcase program tiers, benefits, points accumulation, and member testimonials, ensuring that your audience understands the value of participating in the Deluxe Loyalty Program. Start crafting your personalized infographic today to promote customer loyalty and engagement effectively.


6 slides
Value Chain Management Infographics
Optimize your business operations with our Value Chain Management infographic template. This template is fully compatible with popular presentation software like PowerPoint, Keynote, and Google Slides, enabling you to effortlessly customize it to visualize and improve your value chain. The Value Chain Management infographic template offers a visually engaging platform to depict the various activities and processes involved in creating value for your customers. Whether you're a supply chain professional, business owner, or manager, this template provides a user-friendly canvas to create informative presentations and strategies for value chain optimization. Boost your business's efficiency and competitiveness with this SEO-optimized Value Chain Management infographic template, thoughtfully designed for clarity and ease of use. Customize it to highlight key components of your value chain, identify areas for improvement, and streamline your operations for enhanced value creation. Start crafting your personalized infographic today to excel in value chain management.