


Características


¿Tienes alguna pregunta?
Recomendar


6 diapositivas
DMAIC Six Sigma Framework Presentation
Dive into process perfection with our DMAIC Six Sigma Framework template! This visually appealing guide breaks down each phase—Define, Measure, Analyze, Improve, and Control—making it easier to streamline operations and enhance quality. Fully compatible with PowerPoint, Keynote, and Google Slides, it's designed for professionals dedicated to operational excellence and continuous improvement.


6 diapositivas
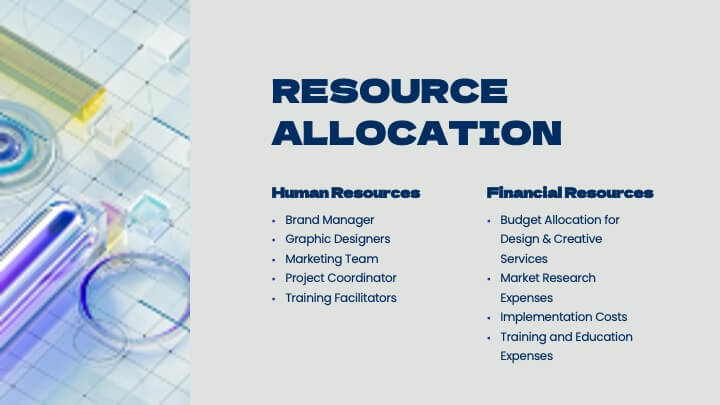
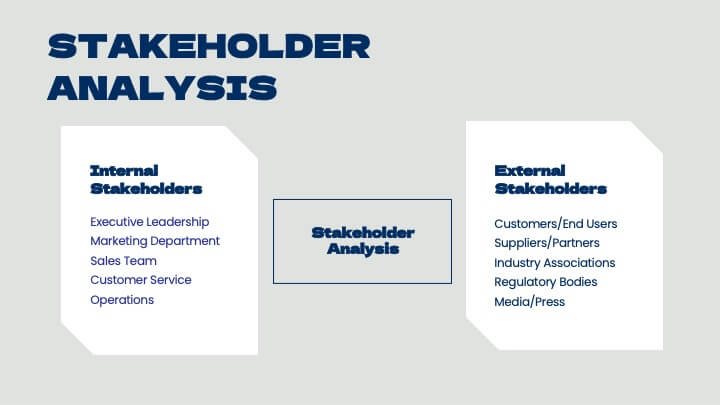
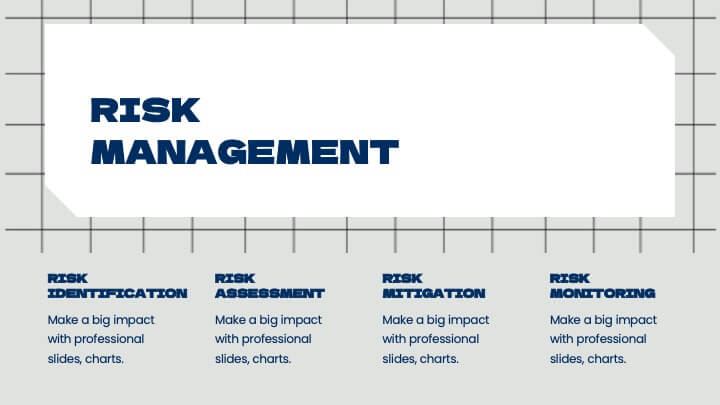
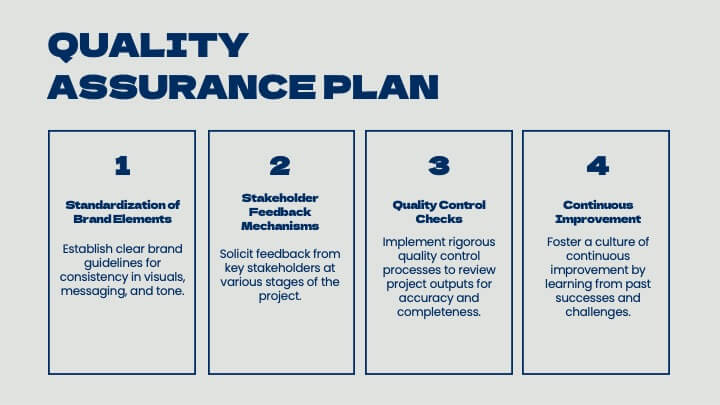
Go-to-Market Launch Plan Presentation
Launch with confidence using this Go-to-Market Launch Plan Presentation. This clean, step-by-step visual framework highlights each phase of your GTM strategy—from market research to execution metrics. Ideal for startups, product managers, and marketing teams. Fully customizable in PowerPoint, Keynote, and Google Slides.


5 diapositivas
Cryptocurrency Market Infographic
Cryptocurrency Infographics can help explain the benefits and risks of investing in cryptocurrency, as well as provide valuable information about different types of crypto and their market trends. You can use this infographic to cover a range of topics related to cryptocurrencies, such as its history, how they work, the different types of crypto, the advantages and disadvantages, and the potential risks and challenges associated with investing. This fully customizable template feature eye catching color schemes along with icons and diagrams to illustrate complex concepts related to cryptocurrencies.


7 diapositivas
Growth Mindset Infographic Presentation
A Growth Infographic is a visual representation of data that displays the growth of a particular business, industry, or market over time. It can be used to illustrate growth in areas such as revenue, profits, customer base, or market share. This growth template includes a timeline and graphs that shows the change in data over time, presented in a visually appealing way using icons, symbols, and color-coding. Use this infographic to include additional information such as industry trends, key drivers of growth, and future projections. Easily edit in Powerpoint, Keynote, and Google Slides.


21 diapositivas
Veridia Academic Research Report Presentation
Present your academic research findings with confidence using this sleek and modern presentation template. Covering essential sections such as research objectives, data analysis, key findings, and recommendations, it provides a structured approach to showcasing your study. Perfect for students and professionals. Compatible with PowerPoint, Keynote, and Google Slides for seamless customization.


21 diapositivas
Minoan Project Timeline Presentation
Step back in time with this beautifully crafted Minoan-inspired presentation, perfect for outlining your project timeline! With an elegant design and clear structure, this template helps you showcase key milestones, deadlines, and deliverables in a visually stunning way. Keep your project on track. Compatible with PowerPoint, Keynote, and Google Slides.


4 diapositivas
Task Delegation via RACI Model
Simplify task delegation and boost accountability with this clean RACI-based layout—perfect for clarifying roles and responsibilities across teams. Whether you're planning a project or tracking execution, this slide makes it easy to map who’s in charge, consulted, or informed. Fully compatible with PowerPoint, Keynote, and Google Slides.


28 diapositivas
Pitch Deck Entrepreneur's Canvas Presentation
Sharpen your business presentation with this Pitch Deck template. It covers essential areas such as market opportunity, business model, and competitive analysis, designed for startups and entrepreneurs. Fully customizable and compatible with PowerPoint, Keynote, and Google Slides, it's ideal for impressing investors and partners with your business vision.


6 diapositivas
Pillar Ideas Infographic
"Pillar ideas" usually refer to the fundamental principles, concepts, or key components that form the foundation of a particular topic, strategy, or framework. This infographic template outlines and explains the core pillars or key principles of a particular topic, concept, or strategy. These pillars are essential for understanding and implementing the core aspects of that subject. The pillars included in the infographic provide structure and a clear understanding of the foundational elements that contribute to the success and effectiveness of various endeavors. This template is compatible with Powerpoint, Keynote, and Google Slides.


26 diapositivas
Saam Presentation Template
Are you looking for a way to make your food presentation more fun and yummy-looking? Well, look no further! Our Saam food presentation template is just what you need. It's packed full of fun graphics and pictures of your food that will make your presentation look super tasty. And the best part? You can customize the photo layouts and charts to make your presentation look exactly how you want it with all the important information. So whether you're presenting your new restaurant to your investor, or showing your friends what you cooked for dinner this week, this template has got you covered.


5 diapositivas
Defining Project Scope Presentation
Clearly outline project goals with the Defining Project Scope Presentation template. This step-by-step visual guide helps teams map out project objectives, key milestones, and deliverables in an organized manner. Perfect for project managers, business analysts, and consultants looking to present scope definitions effectively. Fully editable in PowerPoint, Keynote, and Google Slides for easy customization.


21 diapositivas
Oslo Design Strategy Proposal Presentation
This design strategy proposal template is tailored to present your creative process with bold colors and clean layouts. It includes sections like overview, design brief, concept development, design process, mood board, and project timeline, giving you a comprehensive structure for showcasing your approach. Compatible with PowerPoint, Keynote, and Google Slides, it ensures seamless presentations.


9 diapositivas
Sales Pitch Proposal Presentation
Win over your prospects with our Sales Pitch Proposal presentation template, crafted to highlight the strengths of your product or service compellingly and convincingly. The template opens with a bold title slide, immediately capturing attention, followed by a well-organized agenda that outlines the flow of your pitch. Dive into the 'Problem' slide to articulate the challenges your target audience faces, followed by the 'Solution - Steps' slide where you can break down how your offering addresses these challenges in phases. Showcase the 'Key Features' of your product, highlighting the unique benefits that set you apart from the competition. The 'Target Audience' slide allows you to visually represent the demographics of your ideal customer, making your proposal more relatable. The 'Pricing' slide is neatly designed for a clear display of your pricing tiers, ensuring transparency. Conclude with a 'Thank You' slide that leaves a lasting impression and a 'Credits' slide for due diligence. This template is adaptable for PowerPoint, Keynote, and Google Slides, ensuring a seamless presentation experience.


5 diapositivas
Student Progress Report Presentation
Track academic milestones with this Student Progress Report Presentation. Featuring a stair-step puzzle layout topped with a graduation cap, it visually represents growth across four key areas. Ideal for educators, counselors, or school administrators. Fully editable in PowerPoint, Keynote, and Google Slides.


4 diapositivas
Digital Payment and Card Services Presentation
Step into the world of contactless commerce with this clean, modern slide design. It’s built to help you present how digital payment systems and card-based services are transforming transactions in today’s economy. Perfect for fintech updates, product walkthroughs, or training decks. Fully compatible with PowerPoint, Keynote, and Google Slides.


6 diapositivas
Creative Alphabetic Infographic
Bring your message to life with a bright, alphabet-inspired layout that turns simple letters into eye-catching storytelling elements. This presentation is perfect for organizing steps, categories, or key ideas in a memorable way while keeping everything clear and structured. Fully editable and compatible with PowerPoint, Keynote, and Google Slides.


4 diapositivas
Highlighting Key Business Benefits Presentation
Unlock your brand's value with the Highlighting Key Business Benefits Presentation. This modern slide layout uses a visual key concept to emphasize four essential advantages, helping your audience quickly grasp your core offerings. Ideal for sales pitches, service overviews, or value proposition discussions. Fully editable and compatible with PowerPoint, Keynote, and Google Slides.