
Características


¿Tienes alguna pregunta?
Recomendar


7 diapositivas
Personal Roadmap Infographic
A personal roadmap infographic is a visual representation of an individual's goals, plans, achievements, and milestones over a specific period. Embark on a transformative journey through your life with our personal roadmap infographic template. This is a grand adventure, and this visually engaging template is your map to navigate it with purpose and direction. This template is a graphical and often chronological display that helps an individual outline and track their personal development, progress, and objectives. This infographic is fully customizable and compatible with Powerpoint, Keynote, and Google Slides.


5 diapositivas
IT Technology Revolution Infographics
Navigate the digital wave with our IT technology revolution infographics. Crafted in a sleek blue and white palette, this template is a nod to the informational era's sophistication. It's an essential tool for IT professionals, educators, tech enthusiasts, or students stepping into the world of informational technology. Compatible with Powerpoint, Keynote, and Google Slides. With a design that speaks innovation, it features cutting-edge graphics, icons, and image placeholders, tailored to dissect complex tech jargons into digestible visuals. Engage your audience with data and trends that encapsulate the IT landscape's ever-evolving nature.


5 diapositivas
Traveling Needs Infographics
Travel Infographics play an important role in providing valuable and engaging information to travelers. These infographics are visual representation of the essential items and considerations for travelers. This template is designed to provide travelers with an overview of what they need to pack, plan, and prioritize before a trip. This consists of customizable elements such as icons and illustrations that visually depict different categories of traveling needs. These categories can include clothing and accessories, travel documents, health, and more. This template will help you convey the essential items and tips for a successful and enjoyable trip.


4 diapositivas
Business Communication Strategy
Visualize communication channels with this walkie-talkie themed strategy layout. Each section represents a key step in your communication plan—ideal for internal operations, team workflows, or stakeholder messaging. Easily editable in PowerPoint, Keynote, and Google Slides.


7 diapositivas
Vacations Travel Infographic
Are you ready to embark on a journey around the world? Our Vacations Travel Infographic is your ultimate guide to thrilling destinations, exotic experiences, and memorable adventures. Whether you're a passionate traveler seeking new horizons or an explorer at heart, this infographic is designed to ignite your wanderlust and set your vacation dreams on fire. Compatible with Powerpoint, Keynote, and Google Slides. Dive into the world of travel with this vivid infographic that sparks excitement and eagerness to discover what lies beyond. This template is not just a visual delight, it's a roadmap to your dream vacation!


24 diapositivas
Momentum Investor Pitch Presentation
The Momentum Pitch Deck is your ultimate tool for propelling your business ideas into action! This vibrant and dynamic template is crafted to captivate your audience and clearly convey your company's vision, strategy, and growth potential. Start with an engaging overview, followed by a problem statement that pinpoints the core challenges your solution addresses. Use the market opportunity and competitive landscape slides to showcase the potential for success. The business model canvas and unique selling proposition sections help illustrate how your business stands out from the competition. Highlight your revenue model, marketing strategy, and sales approach to show your path to profitability. Additionally, the template includes sections for technology and innovation, team introduction, and risk analysis, ensuring a comprehensive presentation. Whether you're pitching to investors or stakeholders, this template is fully compatible with PowerPoint, Keynote, and Google Slides, making it the perfect choice for any pitch deck.


20 diapositivas
Amethyst Marketing Proposal Template Presentation
Bring your marketing ideas to life with this eye-catching amethyst-themed presentation! Tailored for presenting your marketing proposals, this template helps you outline key strategies, campaigns, and target audiences in a sleek, professional design. Its bold layout ensures your message shines through. Compatible with PowerPoint, Keynote, and Google Slides.


26 diapositivas
Crypto Currency Dark Presentation
Navigate the dynamic world of digital finance with our Crypto Currency presentation template, compatible with PowerPoint, Keynote, and Google Slides. This template is an invaluable tool for financial analysts, crypto enthusiasts, and educators in the realm of digital currencies. The design boasts a bold and modern aesthetic, with cryptocurrency motifs that capture the essence of this revolutionary market. With this template, you can present complex financial data and crypto concepts with clarity. Its range of slides includes comparative analyses, timeline infographics, and process diagrams, enabling a thorough exploration of the cryptocurrency landscape. The vibrant colors and creative graphics make it easy to highlight market trends, investment opportunities, and the technology behind cryptocurrencies. By using our Crypto Currency template, you'll engage and educate your audience on the nuances of blockchain and digital assets. Download it today to deliver a presentation that's as innovative and forward-thinking as the topic itself.


23 diapositivas
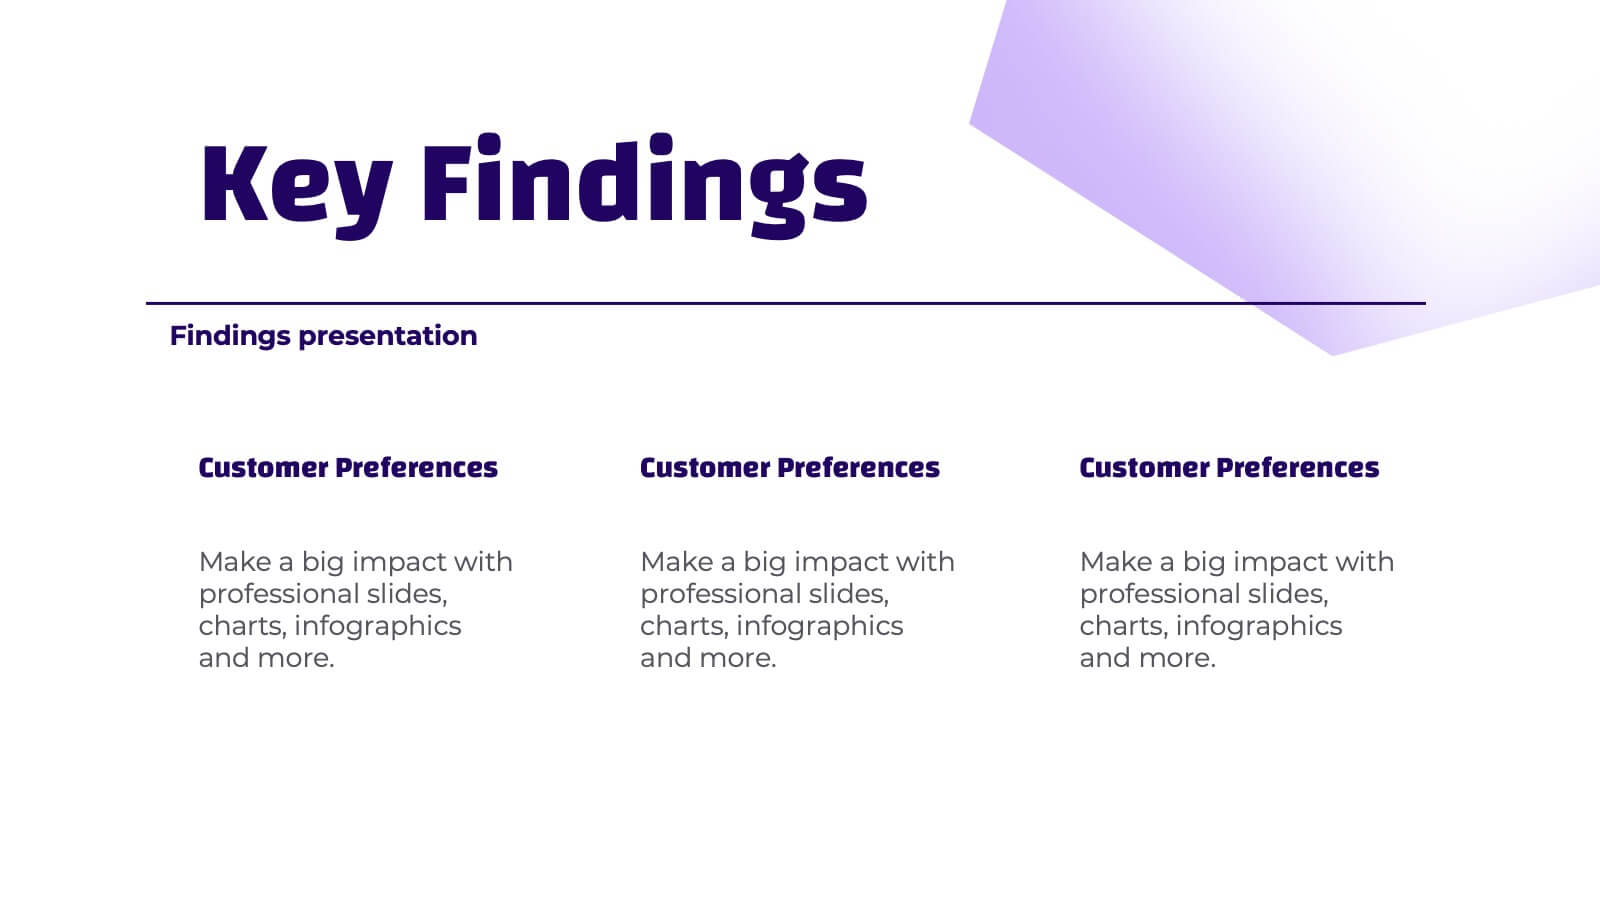
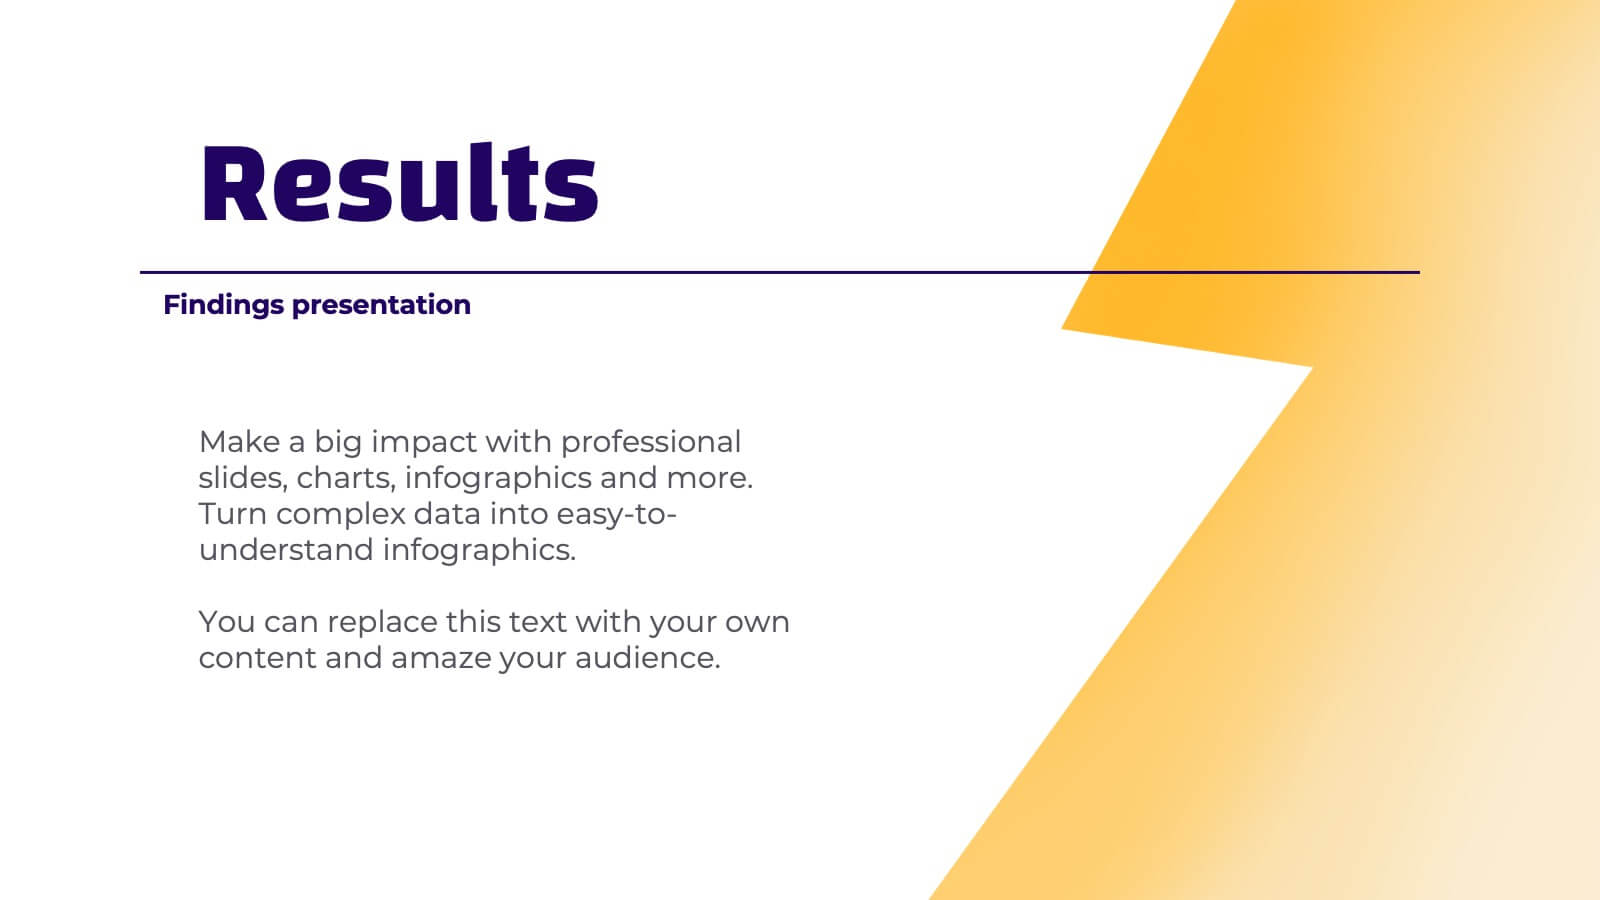
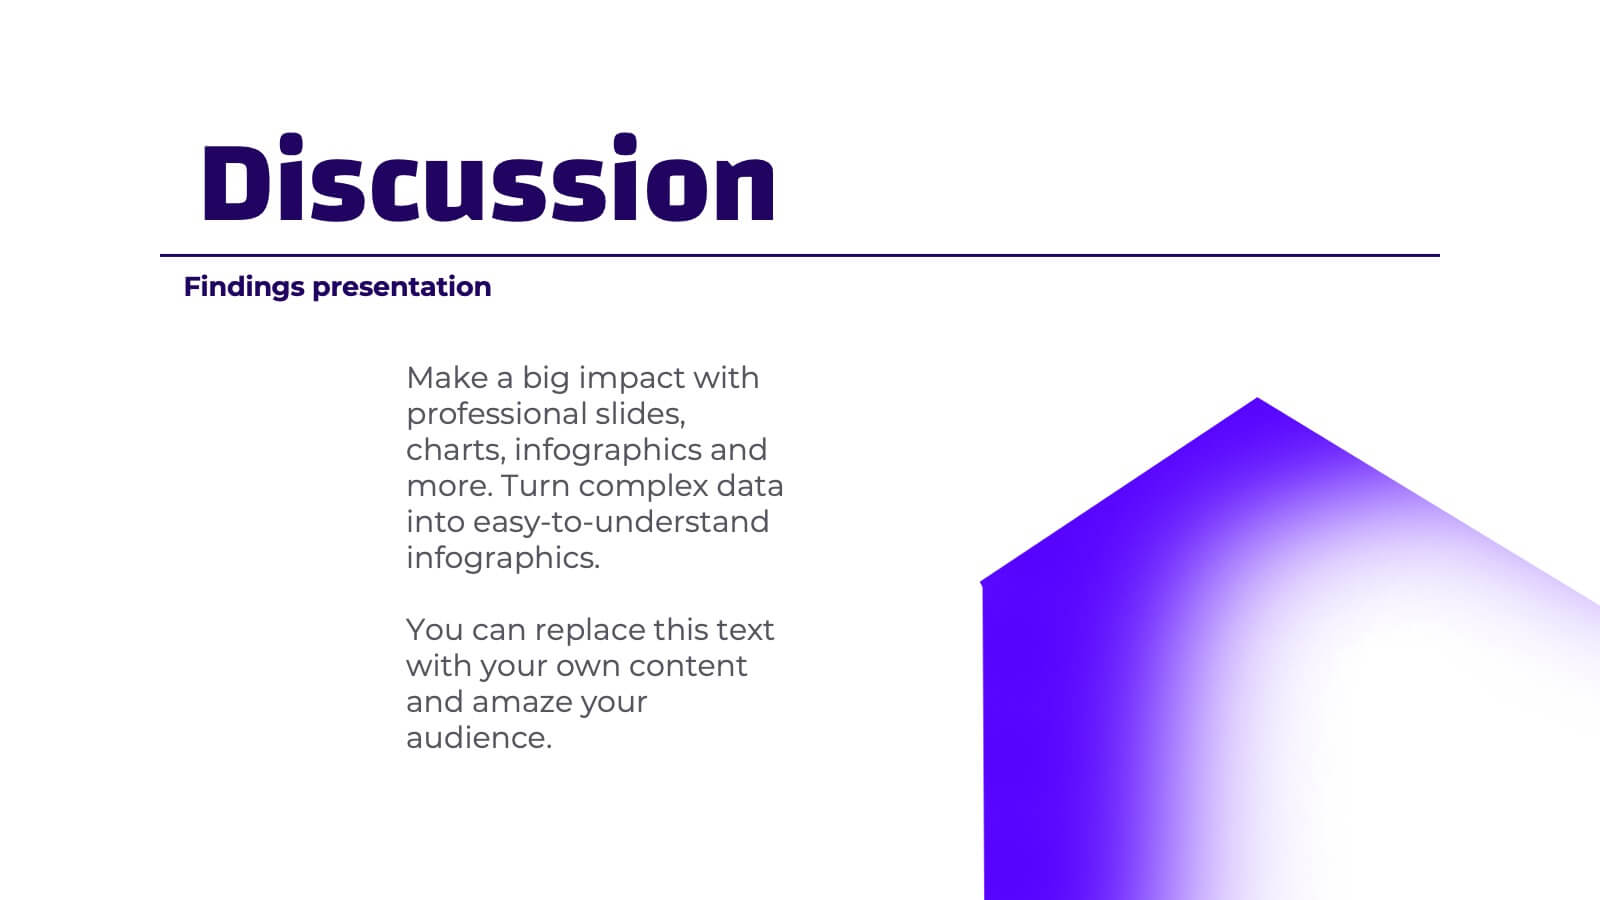
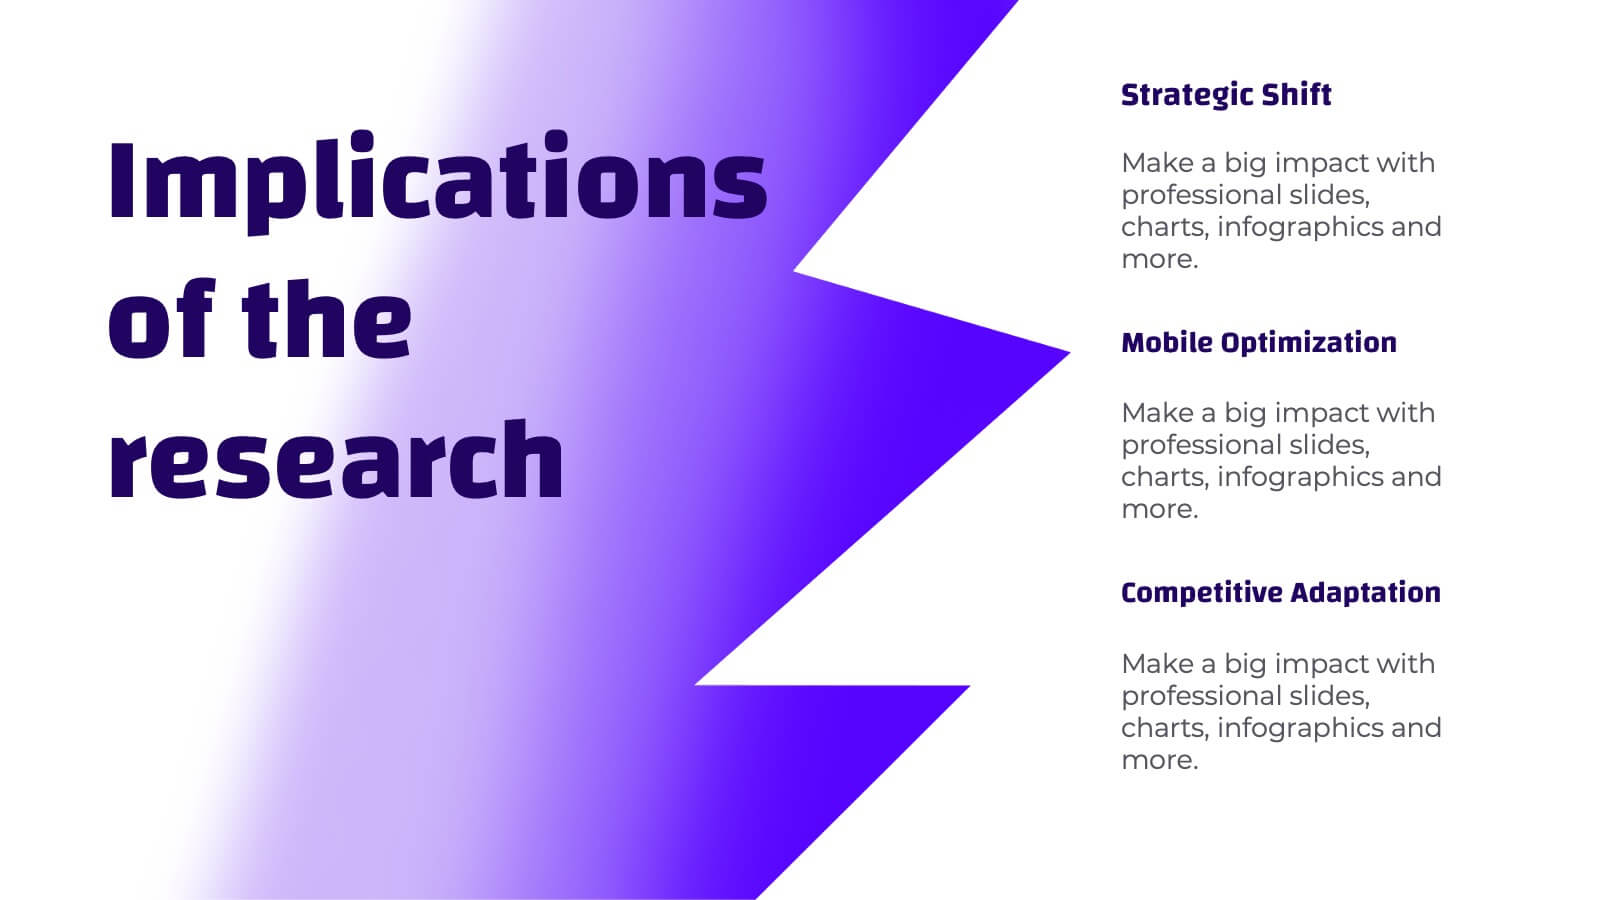
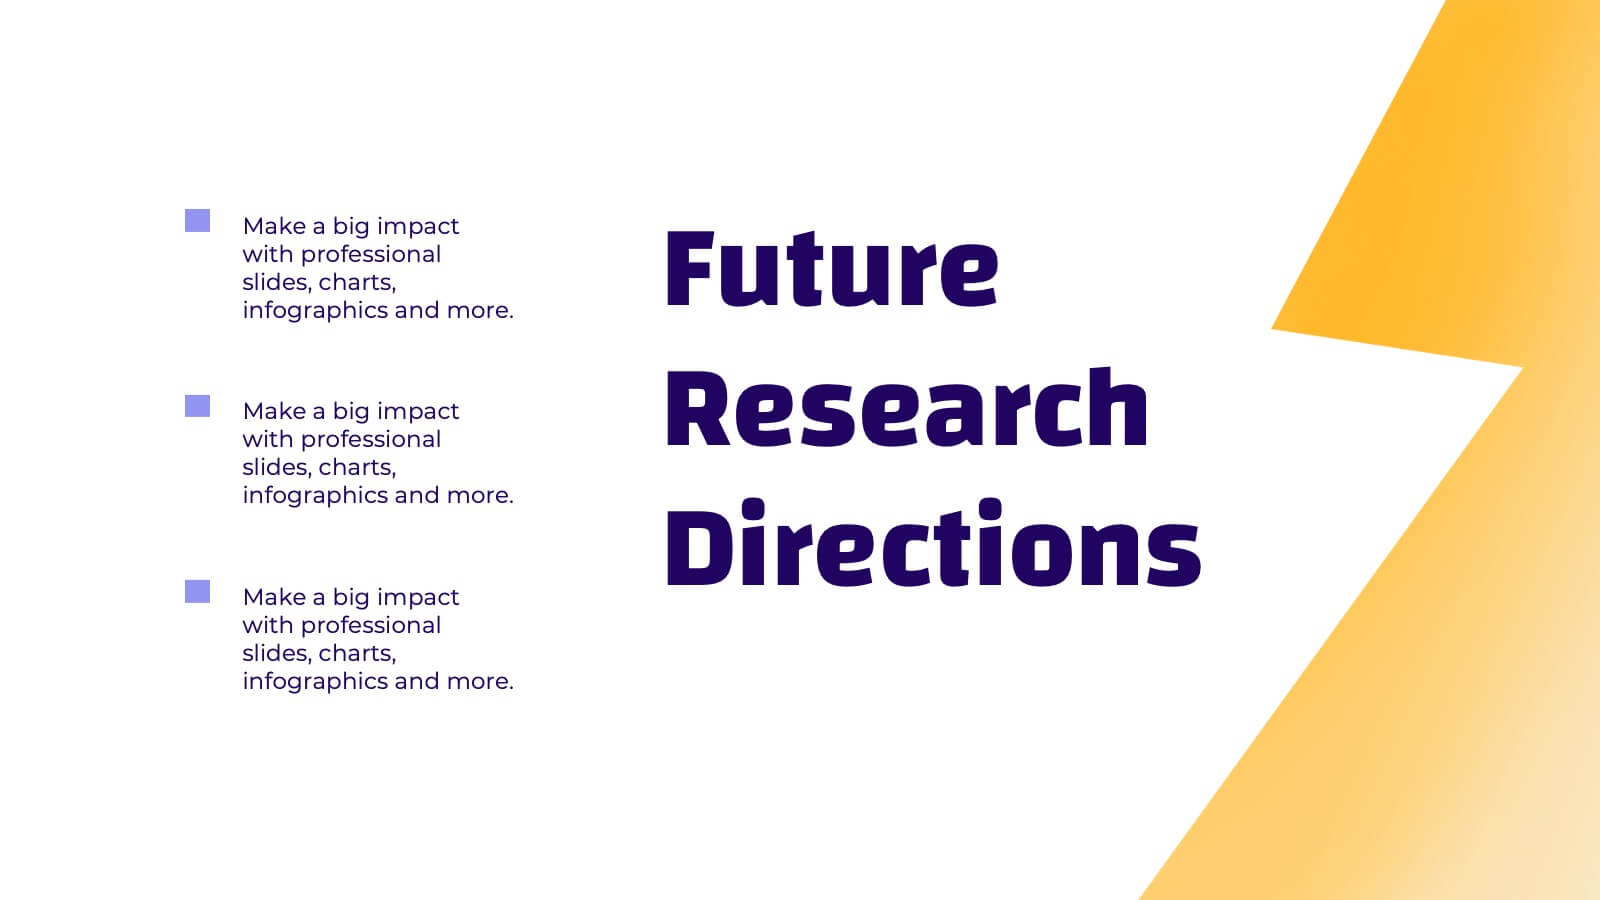
Naiad Qualitative Research Findings Presentation
Dive into your data with this refreshing, Naiad-inspired presentation template, perfect for sharing qualitative research findings! Designed to showcase insights, trends, and key conclusions with clarity, this visually appealing layout ensures your research captivates and informs. Make your data flow effortlessly. Compatible with PowerPoint, Keynote, and Google Slides for easy customization.


6 diapositivas
Corporate Vision and Mission Presentation
Present your company’s purpose with clarity using this Corporate Vision and Mission Presentation. Featuring modern visuals, bold typography, and image placeholders, this layout highlights your strategic goals effectively. Perfect for company profiles, startup decks, or internal briefings. Fully editable in PowerPoint, Keynote, and Google Slides for seamless customization.


4 diapositivas
Governance Practices for Risk Mitigation Presentation
Break down your risk strategy with the Governance Practices for Risk Mitigation Presentation. This slide features a step-stair 3D block visual, ideal for illustrating layered compliance initiatives, control measures, and escalation paths. Perfect for corporate governance teams, compliance officers, and strategic risk planners. Fully editable in PowerPoint, Keynote, and Google Slides.


6 diapositivas
STEM Education and Discovery Presentation
Showcase your STEM insights with this vibrant puzzle-piece infographic. Each piece highlights a key point in science, technology, engineering, or math—perfect for lesson plans, research summaries, or discovery processes. Fully customizable in PowerPoint, Keynote, and Google Slides, making it ideal for educators, researchers, or curriculum developers.


3 diapositivas
Automation and AI Strategy Framework Presentation
Take your ideas for a high-tech spin with this bold and modern layout! This template visually breaks down strategic frameworks for automation and AI by using a clean, segmented circular flow. Ideal for showcasing processes, data integration, or tech-driven initiatives. Fully compatible with PowerPoint, Keynote, and Google Slides for seamless editing.


4 diapositivas
Elegant Watercolor Background Presentation
Add a touch of sophistication to your presentation with soft watercolor textures that create a calming, professional atmosphere. Perfect for creative projects, proposals, or portfolios, this elegant design blends artistry with clarity. Fully compatible with PowerPoint, Keynote, and Google Slides for seamless customization and a refined visual finish.


7 diapositivas
Urban Ecology Illustrated Infographics
Ecology is the scientific study of the interactions between organisms and their environment. This ecology template will help you explain the science behind our world. This is great for anyone who is presenting information about ecology, environment, or sustainability. You can use this infographic as is or customize it by changing the colors and fonts of each slide. You can also add your own images, and text by downloading in Powerpoint, Keynote, or Google Slides. This Template comes with a wealth of key facts and figures on eco-friendly living and presents them in an infographic style.


6 diapositivas
Business Revenue Break-Even Strategy
Visualize profitability with clarity using this dynamic break-even strategy template. Ideal for business analysts, finance teams, and consultants, this diagram highlights the balance between cost, loss, and profit at the break-even point. With intuitive icons and space for key metrics, it's fully editable in PowerPoint, Keynote, and Google Slides.


4 diapositivas
Client Proposal Overview Presentation
Present your ideas with confidence using a sleek and structured layout that turns client insights into a compelling story. Ideal for outlining project goals, value propositions, or proposal summaries, this template keeps every detail polished and professional. Fully compatible with PowerPoint, Keynote, and Google Slides for effortless customization.