


Características


¿Tienes alguna pregunta?
Recomendar


5 diapositivas
Types of Vaccine Infographics
Vaccines are biological substances that stimulate the body's immune system to develop immunity against specific diseases. These vertical infographics provide essential information about different types of vaccines. This infographic serves as a valuable educational resource to raise awareness about vaccines and their role in preventing infectious diseases. The infographic is organized into clear sections, each representing a category of vaccines. Each vaccine category is accompanied by illustrations or icons that represent the type of vaccine being discussed. Compatible with Powerpoint, Keynote, and Google Slides.


5 diapositivas
Future Planning and Next Steps Strategy Presentation
Map out your goals with clarity using the Future Planning and Next Steps Strategy Presentation. This slide features a sleek four-step curved timeline with editable icons and labels, ideal for outlining strategic actions or project phases. Easily customize each stage to match your business objectives. Compatible with PowerPoint, Keynote, and Google Slides.


26 diapositivas
Leyna Presentation Template
Leyna is an elegant and minimalist wedding planner presentation template. This wonderful presentation template will help couples know what all you’ll offer as a wedding planner. We have made it easy for you this this multipurpose template because you will be able to edit easily to make sure it fits what you need. We have built a clean, responsive and modern design for them to have a great experience on what they are looking for in the best way possible. This template provides a professional and clean design for your business or personal use. It's time to impress the potential clients!


23 diapositivas
Nymph Startup Pitch Deck Presentation
This startup pitch deck template covers all the essentials for presenting a business. It includes slides for mission and vision, business model, market analysis, value proposition, and financial overview. Easily customizable for any startup industry, this modern design makes presenting your ideas a breeze. Compatible with PowerPoint, Keynote, and Google Slides.


4 diapositivas
HR Policies and Employee Management Presentation
Clearly outline your workplace strategies with this HR Policies and Employee Management slide. Featuring four color-coded segments alongside an illustration of employee analysis, this layout is ideal for presenting onboarding steps, employee benefits, internal policies, or training procedures. Fully editable and compatible with PowerPoint, Keynote, and Google Slides for seamless customization.


20 diapositivas
Symphonix Marketing Campaign Presentation
The Marketing Campaign Presentation Template is designed for impactful storytelling and strategy. With 20 vibrant, customizable slides, it covers key topics like consumer behavior, emerging trends, data-driven strategies, and sustainability. Perfect for marketers and agencies, it’s fully compatible with PowerPoint, Keynote, and Google Slides for seamless presentations.


23 diapositivas
Phantasia Sales Pitch Deck Presentation
Impress stakeholders and close deals effectively with this sleek and dynamic pitch deck template. With structured slides for company overview, problem statements, and market opportunities, you can present your solutions with clarity and impact. Showcase your business model, revenue streams, and unique selling propositions to stand out in a competitive landscape. This template also includes slides for financial projections, growth strategies, and funding requirements, making it an excellent choice for entrepreneurs, sales teams, and business leaders. The modern design ensures your data is engaging and easy to follow, keeping your audience focused on your message. Fully editable and compatible with PowerPoint, Google Slides, and Keynote, this template provides the customization options you need to align with your branding and goals. Perfect for delivering professional and persuasive presentations.


21 diapositivas
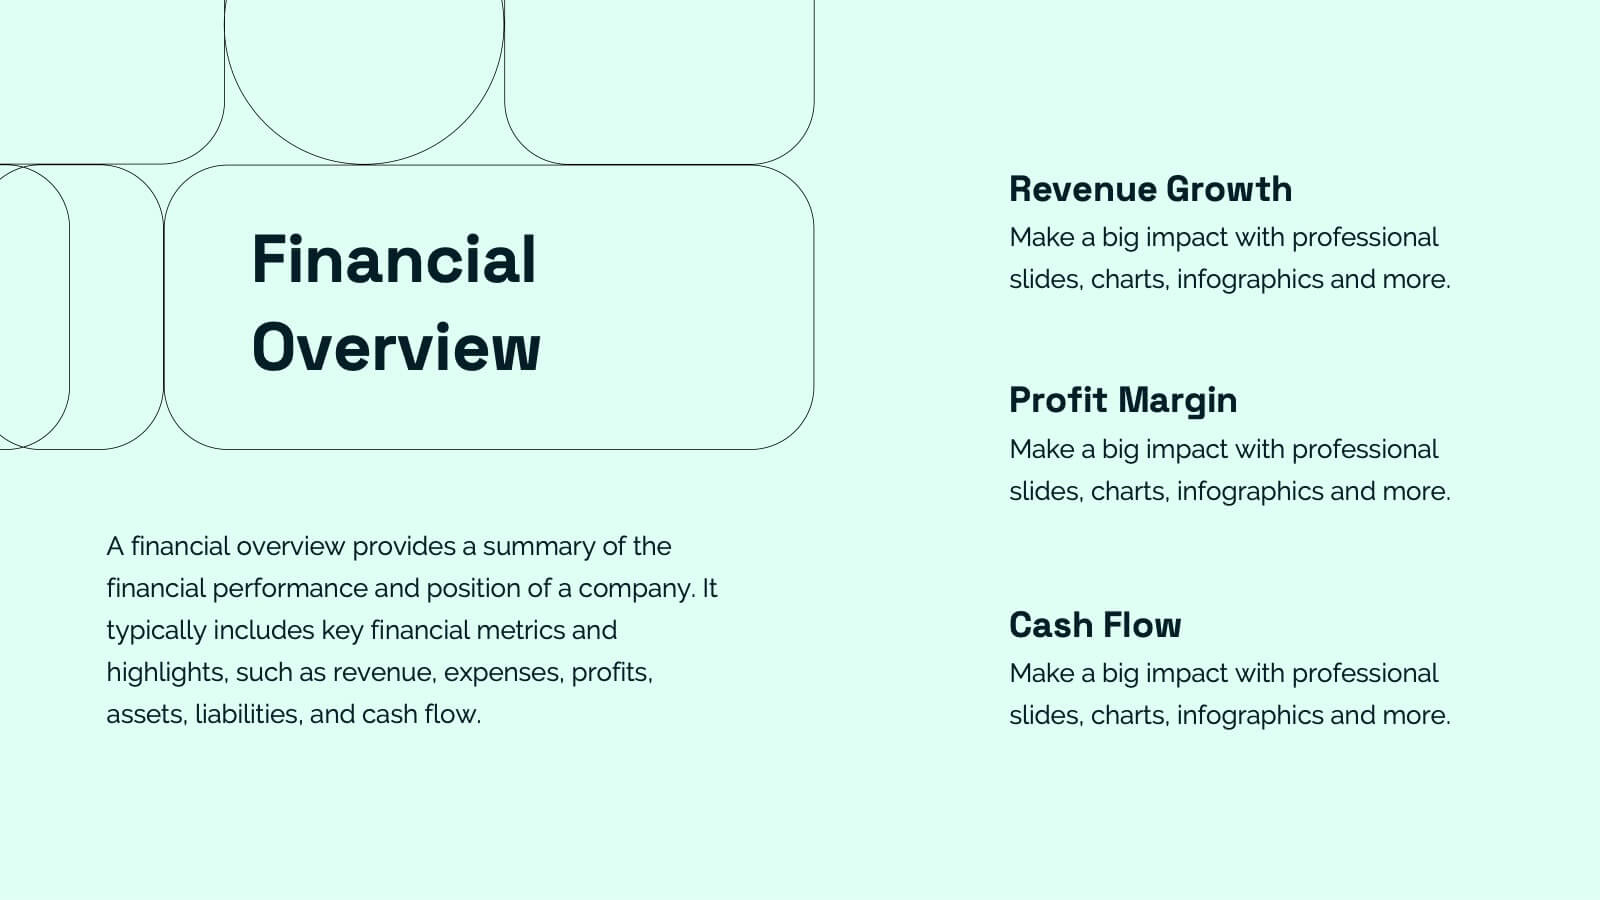
Ironveil Annual Report Presentation
A professional annual report template for showcasing performance metrics, key highlights, financial summaries, and strategic initiatives. Includes sections for customer feedback, competitor insights, and future priorities. Fully customizable and ideal for business reviews. Compatible with PowerPoint, Keynote, and Google Slides for seamless presentation delivery.


8 diapositivas
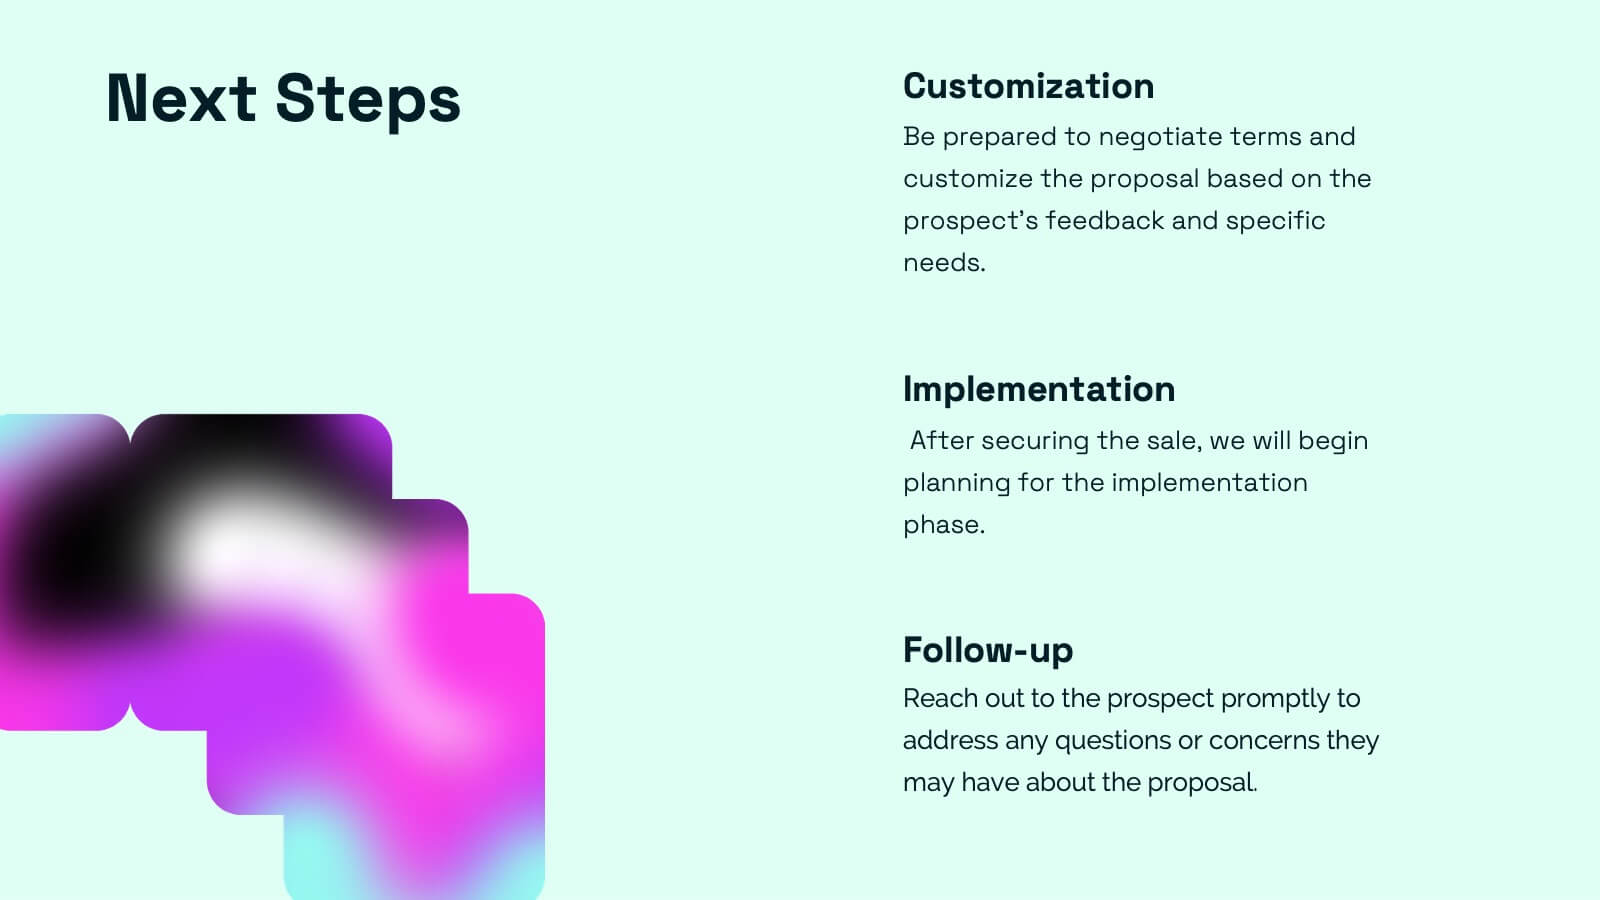
Business Growth Strategies Presentation
Take your vision from concept to expansion with a sleek, modern presentation designed to highlight progress and future potential. Ideal for showcasing goals, performance metrics, and market strategies, it keeps your ideas structured and engaging. Fully compatible with PowerPoint, Keynote, and Google Slides for effortless customization and presentation delivery.


7 diapositivas
Environmental Infographic Presentation Template
An Environmental infographic is a great tool for educating your audience about the state of the environment. This template includes a large format and bold colors that create an impactful visual appeal. The design provides space for facts, stats, and descriptions of the project in question. Use this template to show how much the world has changed and what measures are being taken to mitigate effects on the environment. This infographic has a green hue and illustrations that allow you to add information on the world's natural resources. This is a unique and fun way to display your information.


6 diapositivas
Revenue Growth Sales Slide Presentation
Showcase your business success with this Revenue Growth Sales Slide Presentation. The upward-curved arrow design highlights five key milestones, each with customizable titles, icons, and color accents. Perfect for illustrating sales performance, growth metrics, or financial forecasts. Easy to edit in PowerPoint, Keynote, or Google Slides—ideal for sales teams, analysts, and executives.
6 diapositivas
Key Project Milestone Tracker Presentation
Stay on top of project timelines with this clean and colorful milestone tracker. Ideal for Gantt-style overviews, this slide helps teams visualize progress across months for multiple tasks. Compatible with PowerPoint, Keynote, and Google Slides for seamless editing.


26 diapositivas
Jenzen Presentation Template
Jenzen is a modern multi-purpose template with warm tones for coaching and investing. Jenzen is suitable for all types of businesses Its slide designs can be used in conjunction with each other, making it perfect for sharing information about the various services available to customers. It's easy to use, resulting in high quality presentations. Its slide designs can be used with each other to create more elaborate presentations complete with charts, images and text boxes. It's simple yet stylish design makes it easy for anyone to use and is for both personal use as well as professional use.


2 diapositivas
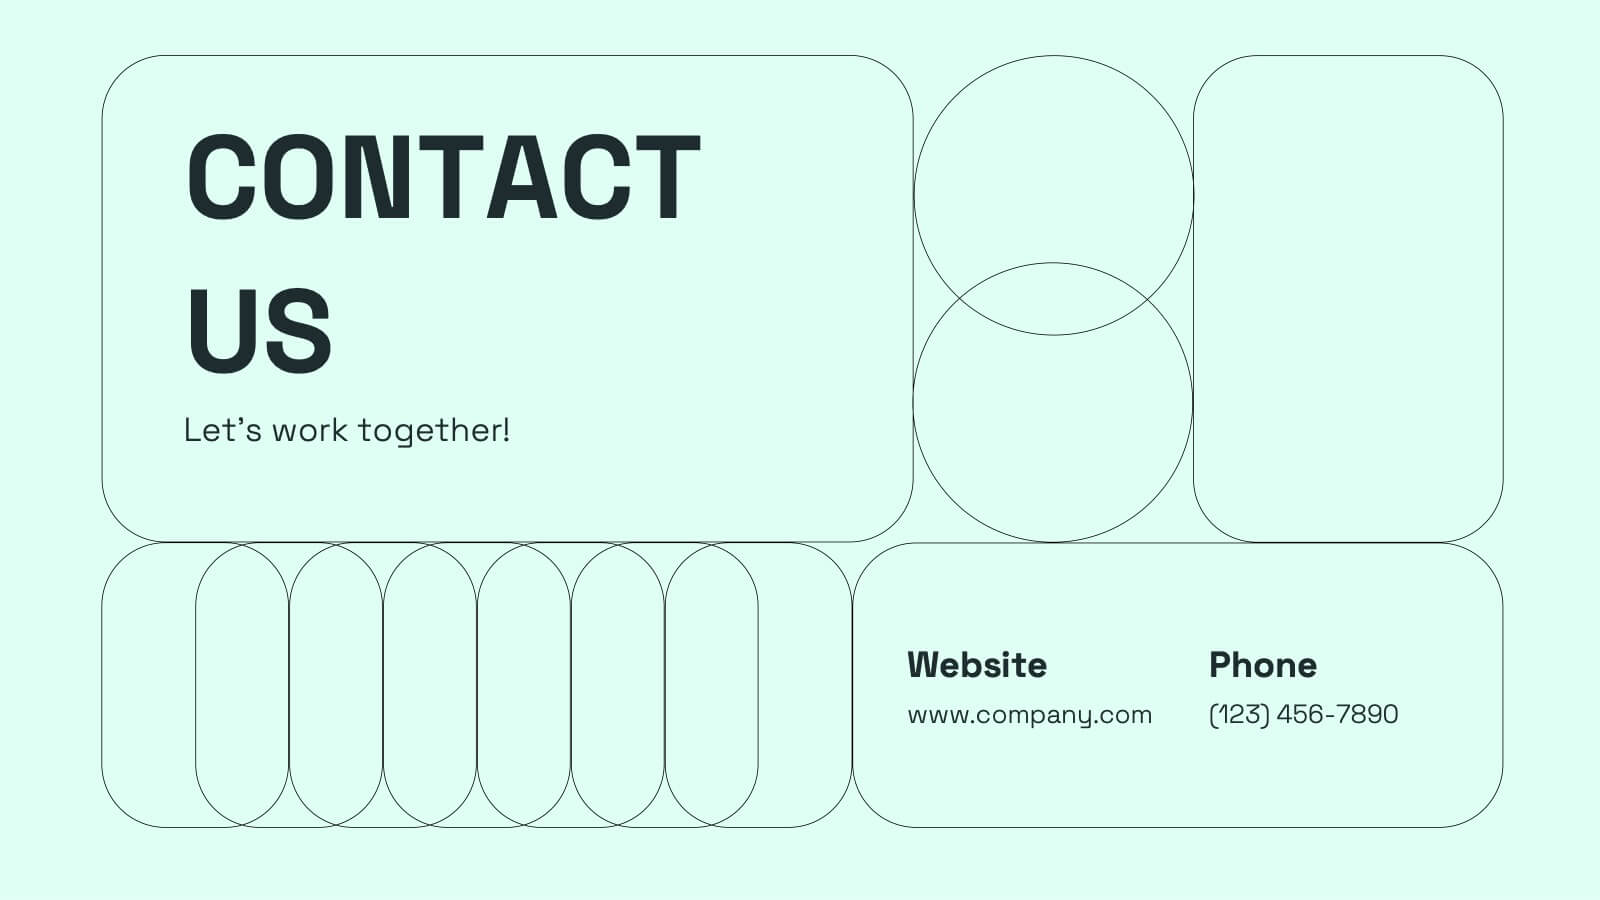
Professional Introduction Slide Presentation
Make a lasting first impression with this Professional Introduction Slide. Designed for business presentations, personal branding, and team introductions, this modern layout features bold shapes, a photo placeholder, and space for key details. Ideal for PowerPoint, Keynote, and Google Slides, this fully editable template lets you customize colors, text, and images to match your brand identity.


6 diapositivas
Best Pricing Tables Infographics
Maximize your product or service presentation with our Best Pricing Tables infographic template. This template is fully compatible with popular presentation software like PowerPoint, Keynote, and Google Slides, allowing you to easily customize it to showcase your pricing structures effectively. The Best Pricing Tables infographic template offers a visually appealing platform to display different pricing tiers, features, and benefits. Whether you're a business owner, marketer, or sales professional, this template provides a user-friendly canvas to create pricing tables that captivate your audience. Optimize your pricing strategy with this SEO-optimized Best Pricing Tables infographic template, thoughtfully designed for clarity and ease of use. Customize it to highlight competitive advantages, discounts, and special offers, helping you convert potential customers into loyal clients. Start crafting your personalized pricing tables today to boost your sales and revenue!


6 diapositivas
Matrix Diagram
A matrix diagram, also known as a matrix chart, is a visual tool used to analyze and organize complex information by displaying it in a matrix format. This infographic template provides a visual framework for analyzing complex information, and improving understanding of relationships between different elements or factors. This template allows users to effectively communicate complex relationships and categorize information using a matrix format. This is perfect to use in a wide range of contexts, including project management, problem-solving, decision-making, strategic planning, and data analysis.


7 diapositivas
Business Plan Process Infographic
Unveil the roadmap to entrepreneurial success with our business plan process infographic. This simple and streamlined infographic encapsulates the quintessential steps to draft a robust business plan, guiding entrepreneurs and business professionals on their journey to creating a successful enterprise. This infographic is an indispensable tool for budding entrepreneurs, business consultants, educators, and anyone looking to gain insights into the formulation of a business plan. Designed for seamless integration with PowerPoint, Keynote, or Google Slides, this template promises a presentation that is both engaging and educative.