


Características


¿Tienes alguna pregunta?
Recomendar


21 diapositivas
Fahrenheit Scientific Research Presentation
Present your findings with clarity using this scientific research presentation template. Designed for researchers, it includes sections for objectives, methodology, data analysis, results, and recommendations. Perfect for academic and professional use, this template ensures a polished, organized presentation and is fully compatible with PowerPoint, Keynote, and Google Slides.


5 diapositivas
Education Department Infographics
The Education Department, also known as the department of education or ministry of education, is a government or administrative body responsible for overseeing and regulating education within a particular jurisdiction. This infographic template is designed to showcase the key aspects and functions of an education department within an organization or institution. It provides an informative overview of the department's goals, initiatives, programs, and achievements. This is the perfect template for educational institutions, government departments, or organizations with an education-focused division. Compatible with Powerpoint, Keynote, and Google Slides.


7 diapositivas
Progress Energy Infographic
Progress generally refers to forward movement or advancement towards a goal, or improvement. This is a dynamic infographic designed to visually represent your journey towards success and growth. This template serves as a visual roadmap, allowing you to showcase milestones, achievements, and key steps toward your objectives in a clear and captivating manner. Compatible with Powerpoint, Keynote, and Google Slides. This easily illustrates the impact of your progress. This infographic is designed to showcase your achievements, marking key milestones that demonstrate your progress and the impact they've had on your journey.


21 diapositivas
Naga Project Proposal Presentation
Present your project with confidence using this comprehensive proposal presentation! It covers crucial sections such as objectives, methodology, timeline, budget breakdown, and risk mitigation strategies, ensuring every detail is addressed clearly. Ideal for client proposals or internal planning, this template works seamlessly with PowerPoint, Keynote, and Google Slides.


5 diapositivas
Projects Milestone Timeline Presentation
Kickstart your story with a clean, engaging timeline that makes every achievement feel purposeful and easy to follow. This presentation helps you outline major milestones, track progress, and communicate project goals with clarity and structure. Ideal for planning, reporting, and strategy sessions. Fully compatible with PowerPoint, Keynote, and Google Slides.


6 diapositivas
Preventative Healthcare and Fitness Presentation
Promote wellness and proactive care with this colorful and clean slide layout. Featuring a clipboard-style design with stacked icons and aligned descriptions from A to E, it’s perfect for presenting fitness tips, health programs, or preventative strategies. The vibrant sections help guide viewers through key points at a glance. Fully editable and compatible with PowerPoint, Keynote, and Google Slides.


6 diapositivas
Overcoming Market Challenges Strategy Presentation
Tackle industry obstacles with clarity using this dynamic teamwork-themed visual. Featuring illustrated characters passing puzzle pieces along a circular process, this design is perfect for illustrating phased strategies, collaborative efforts, or key milestones. Great for strategic planning or team alignment presentations. Fully editable in PowerPoint, Keynote, and Google Slides.
22 diapositivas
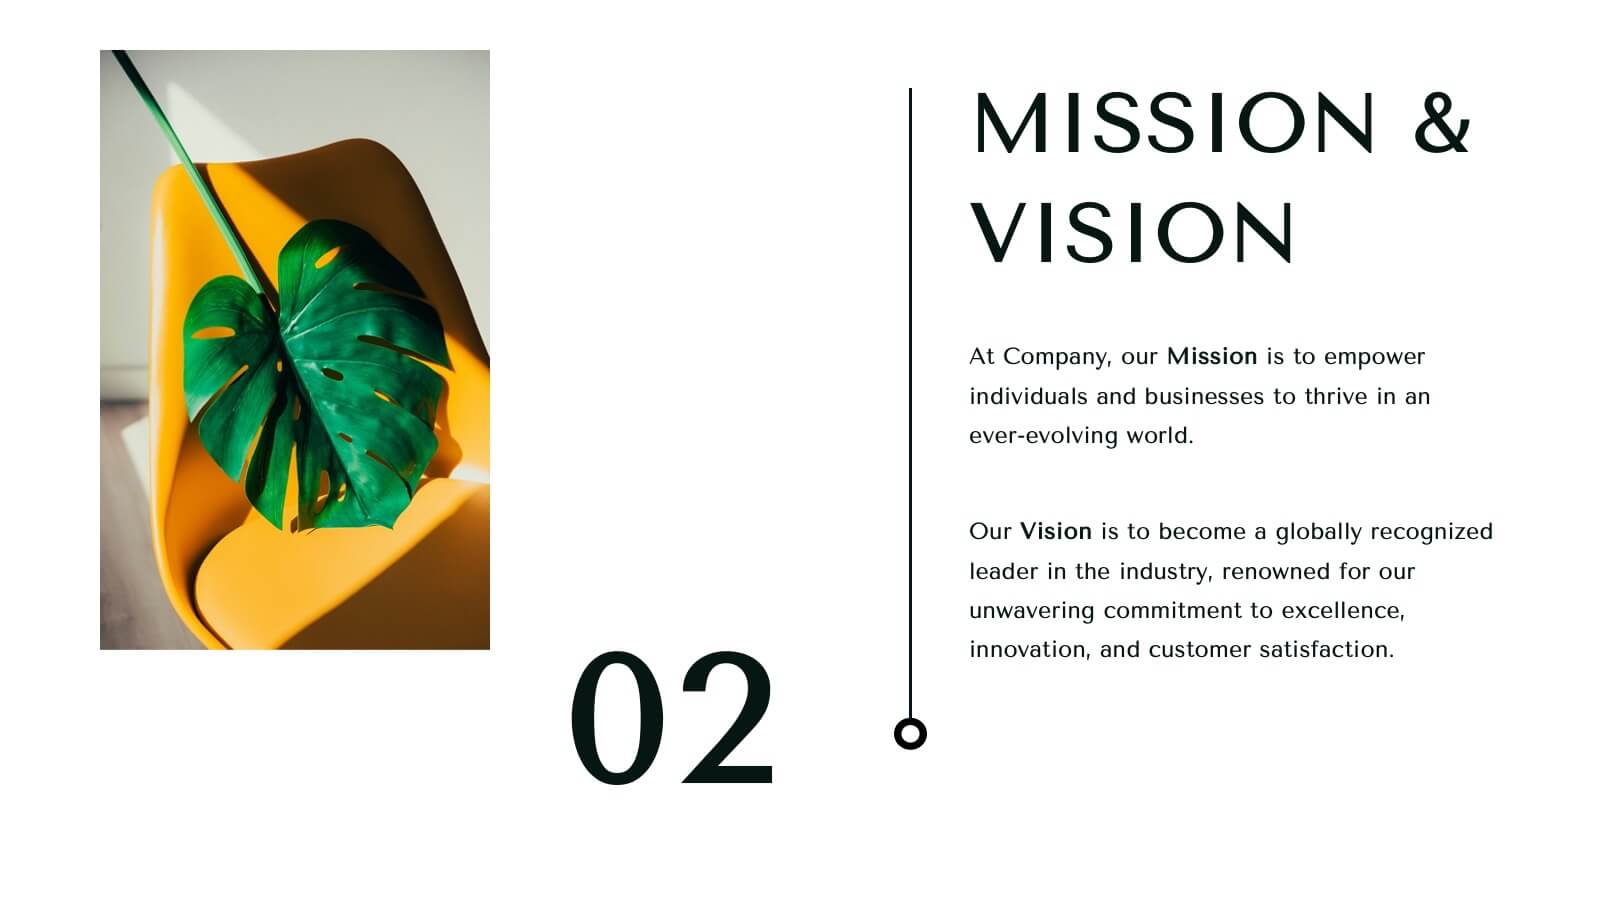
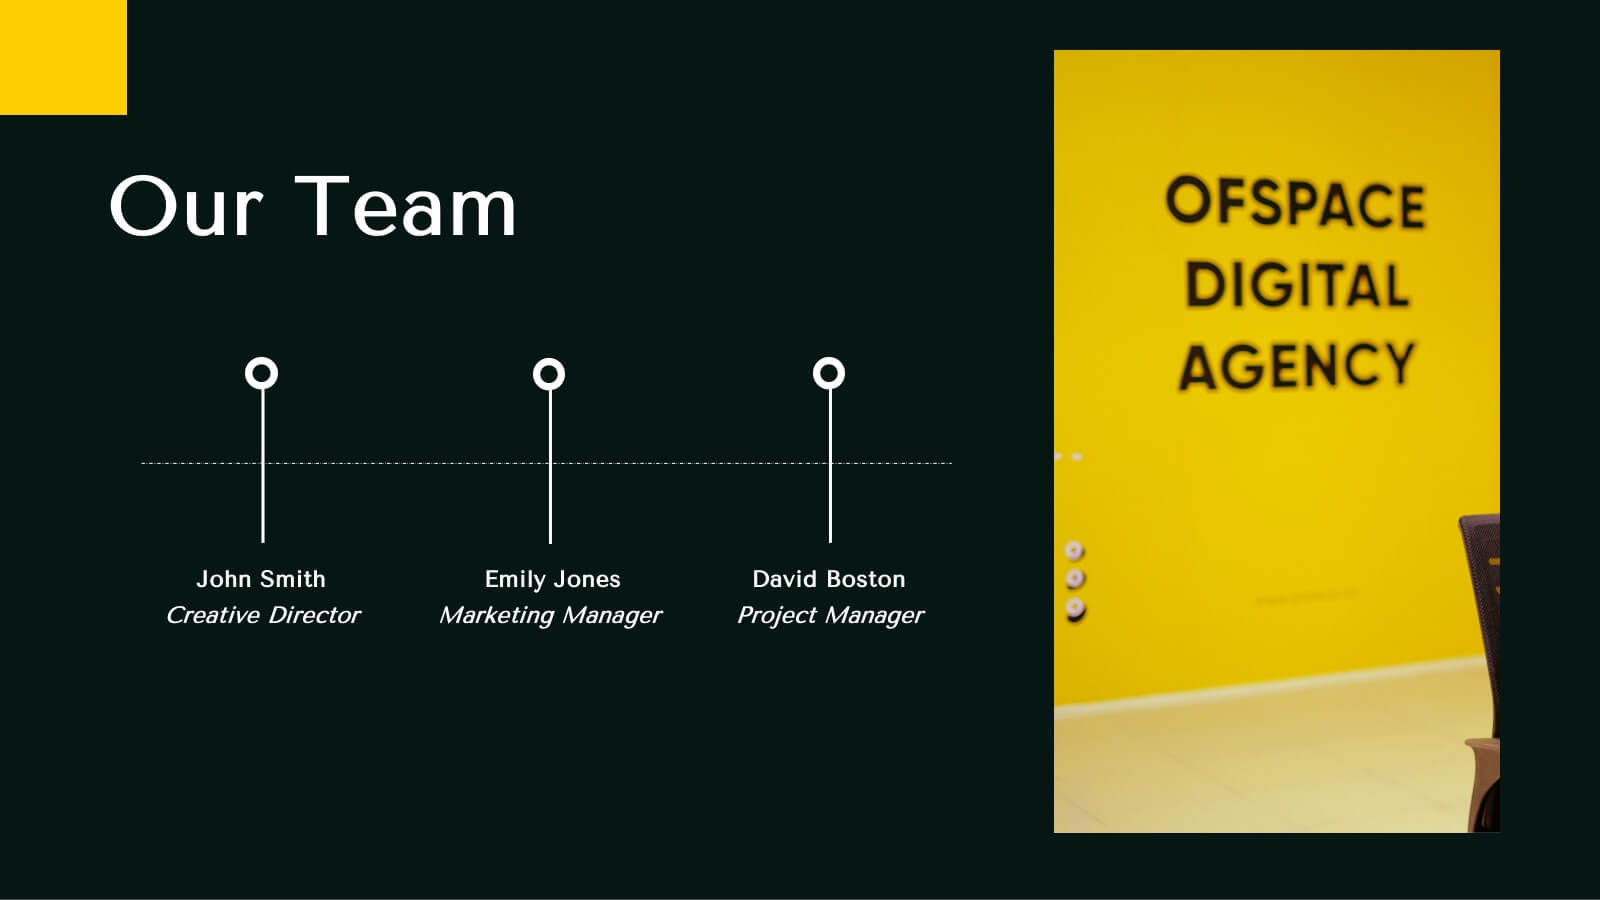
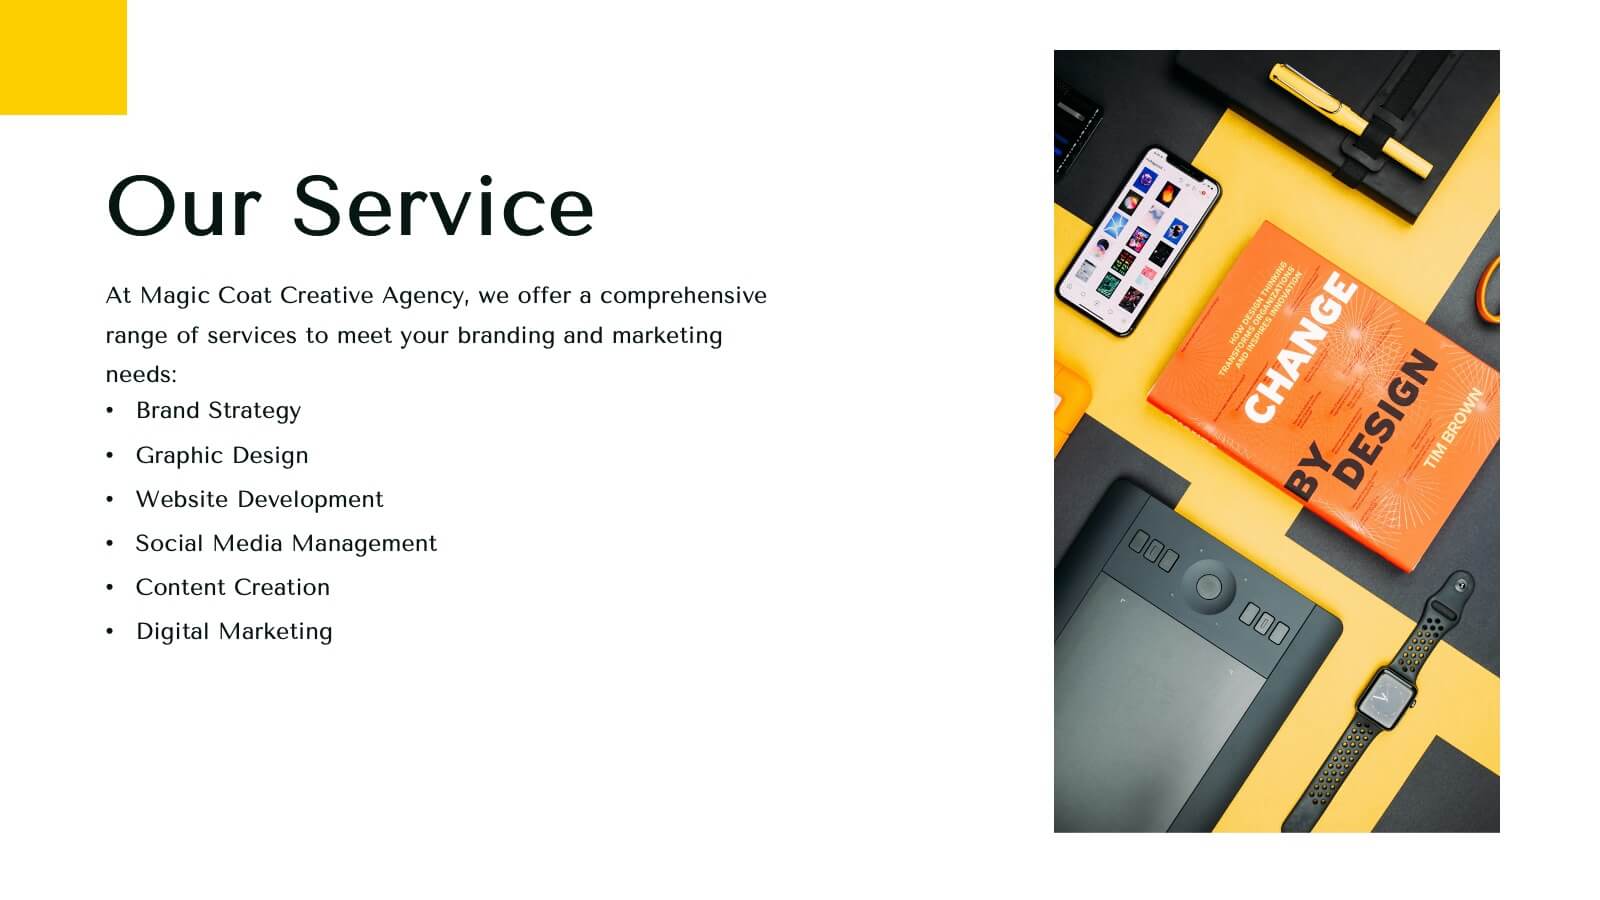
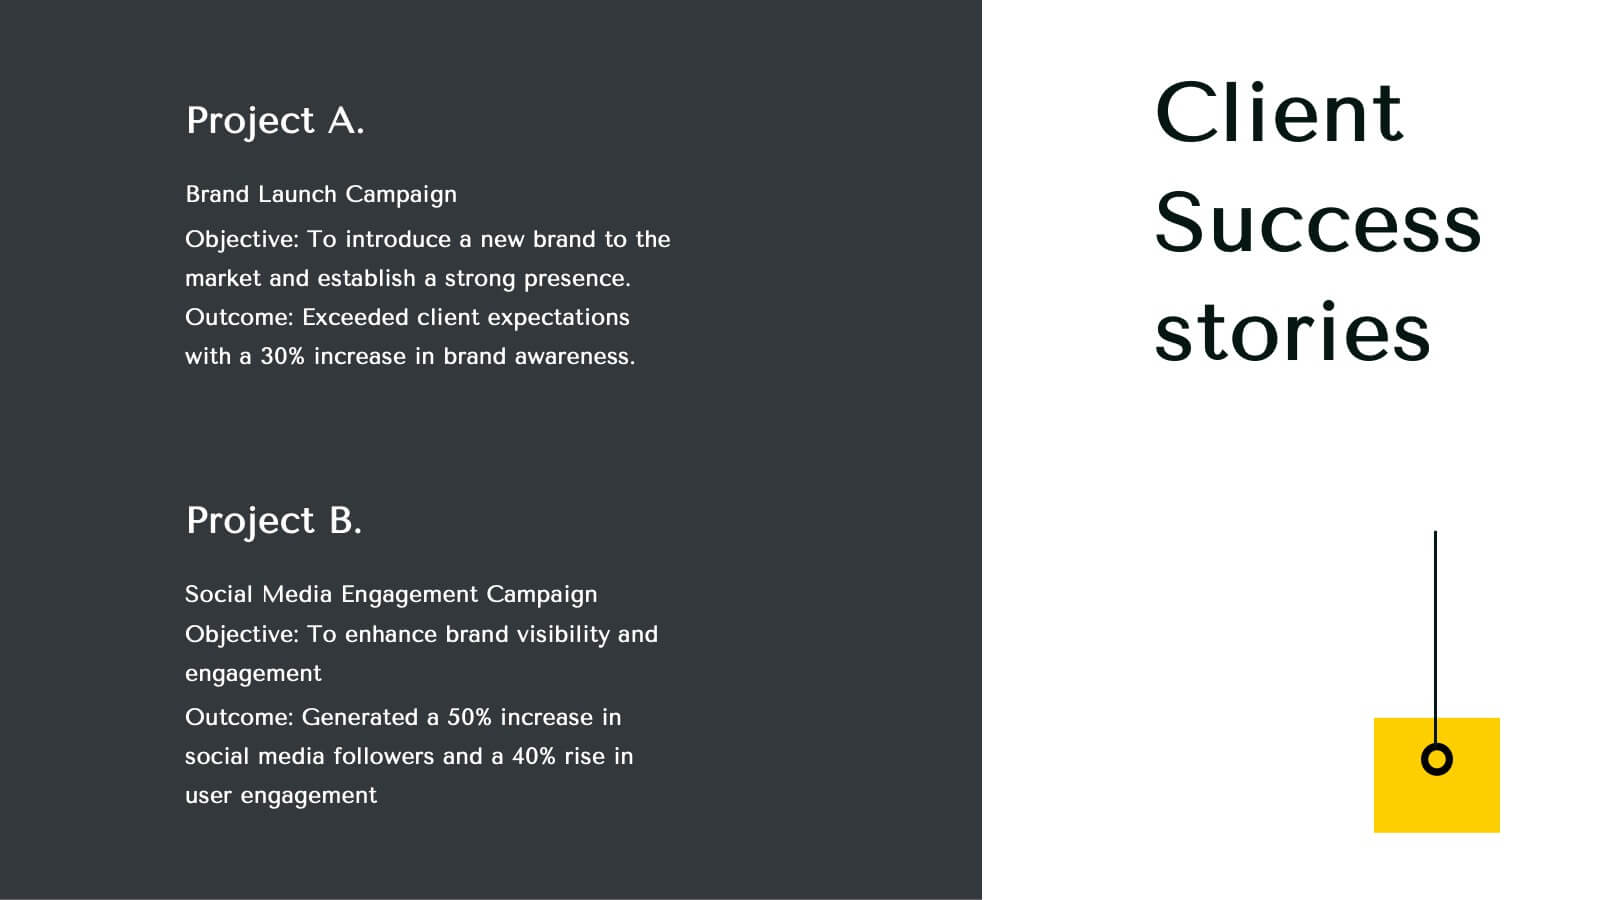
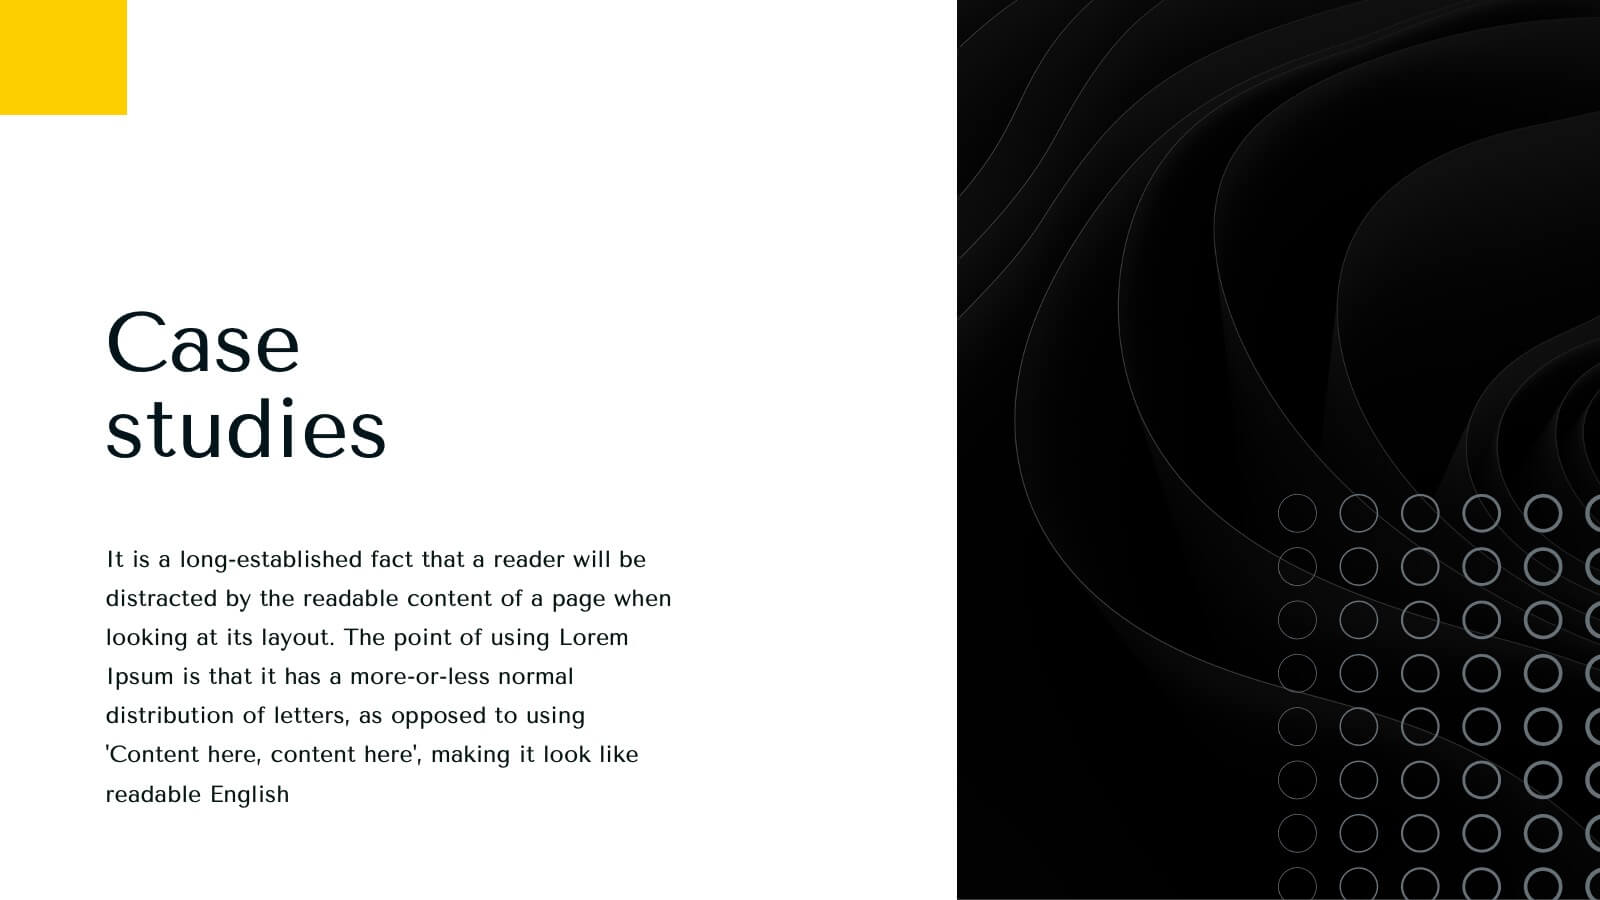
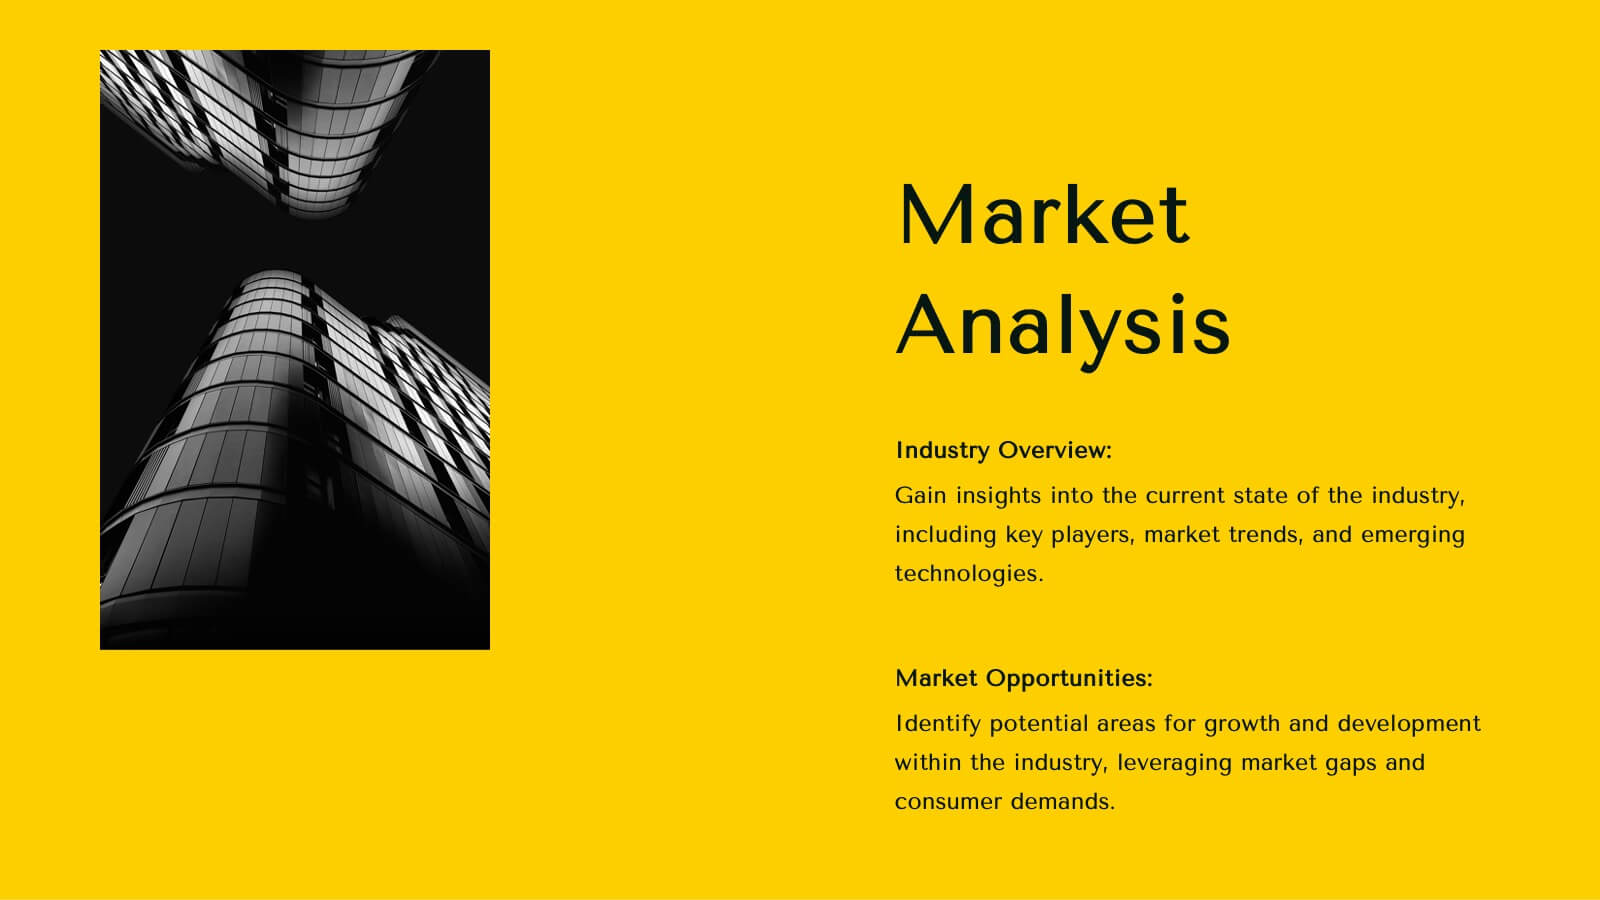
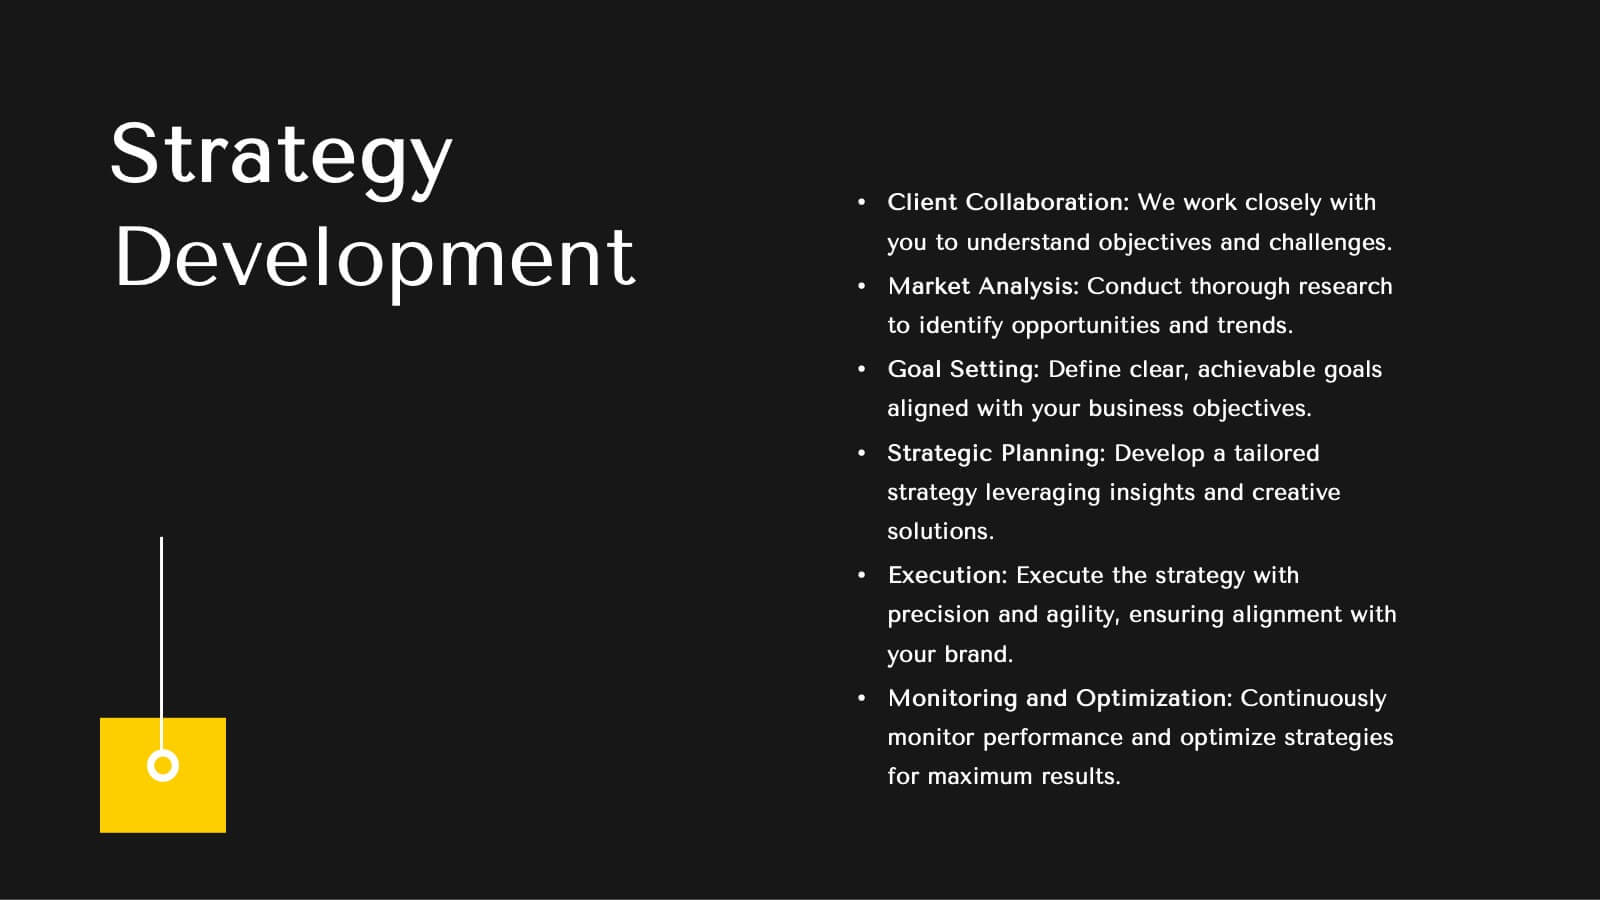
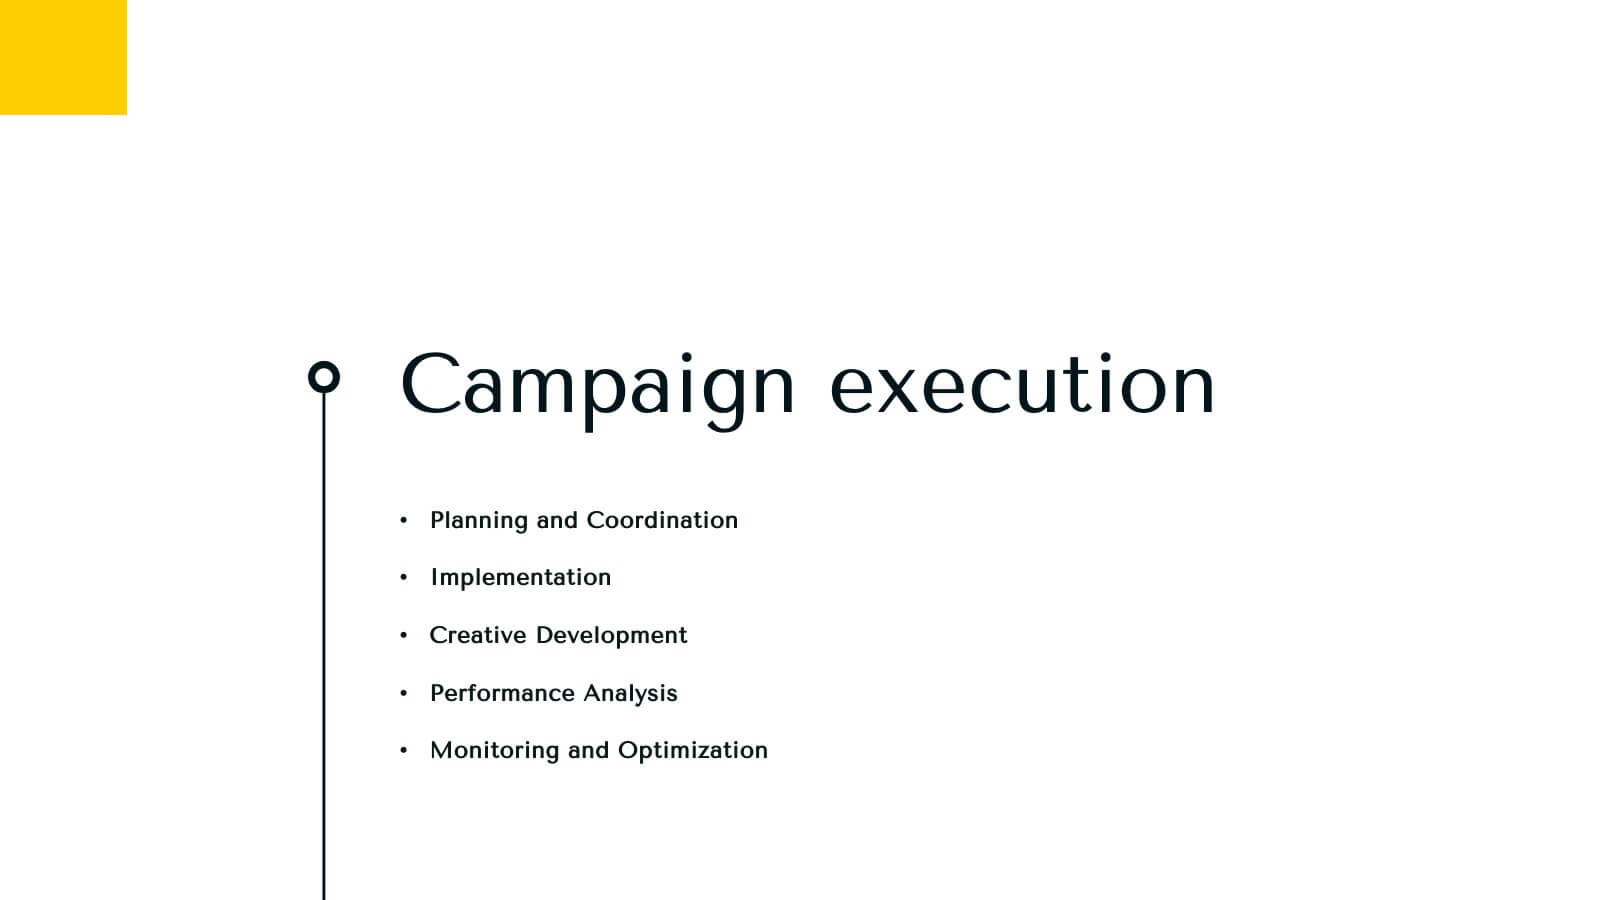
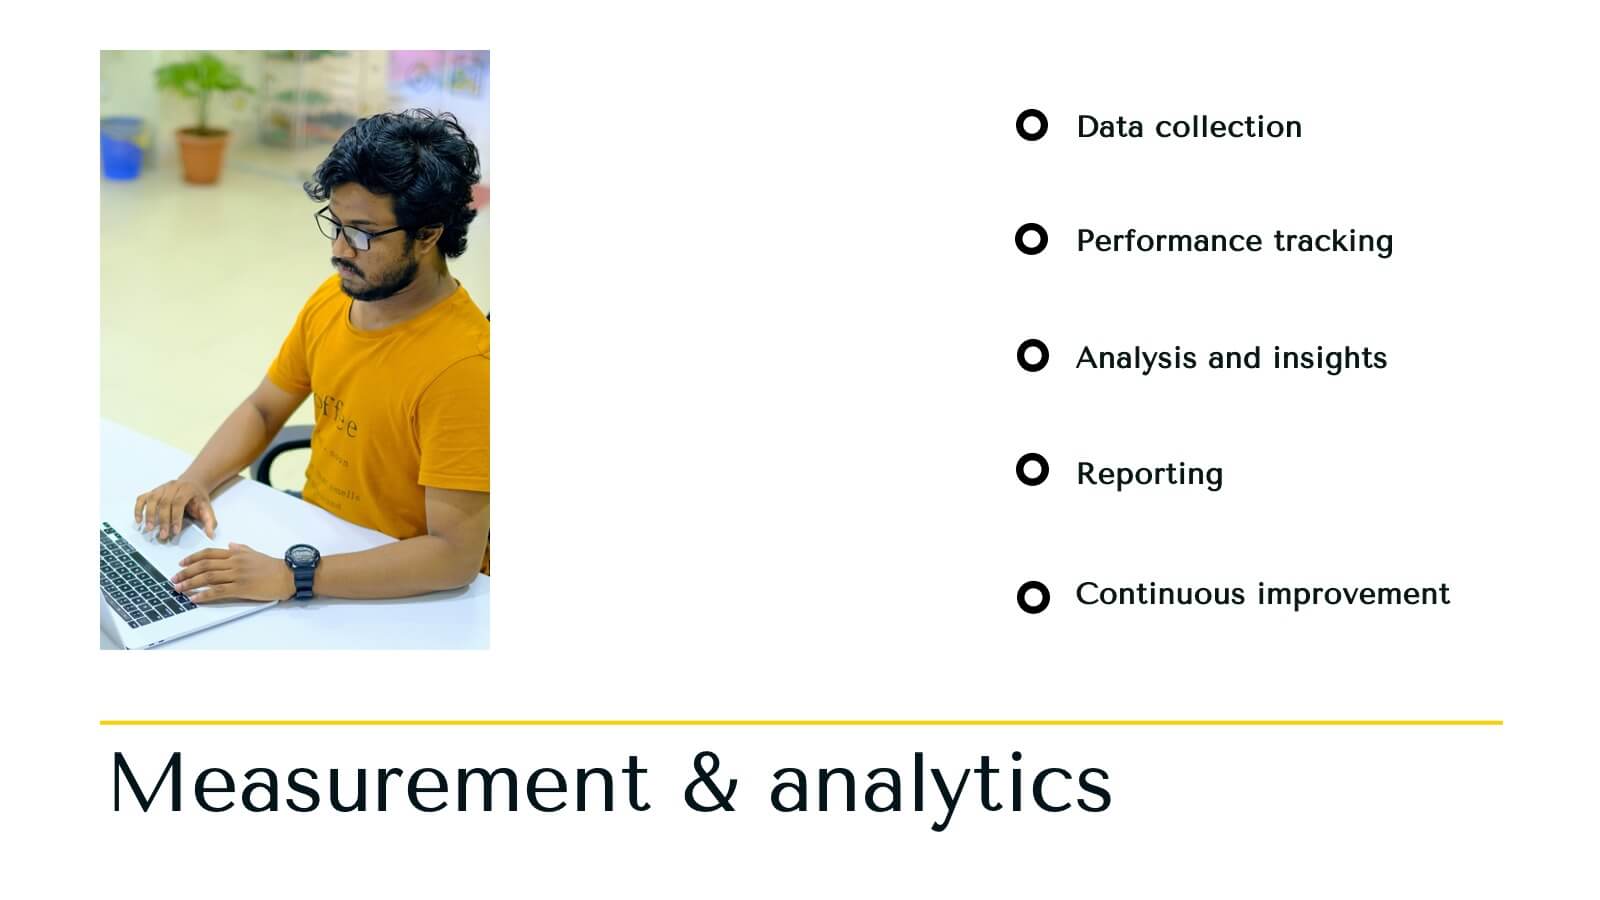
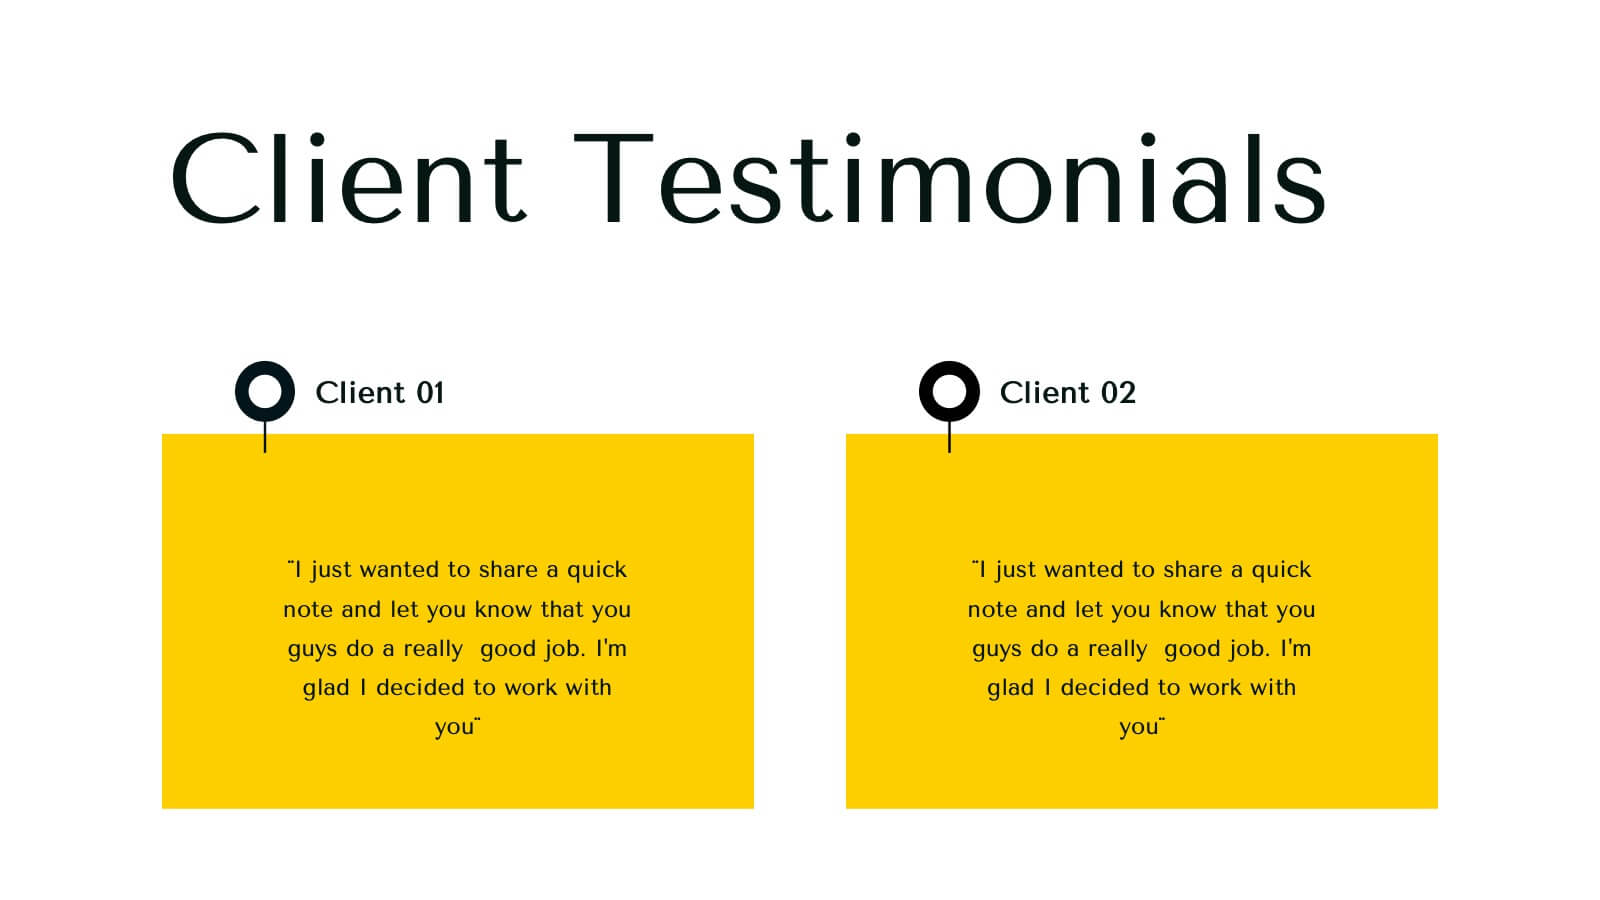
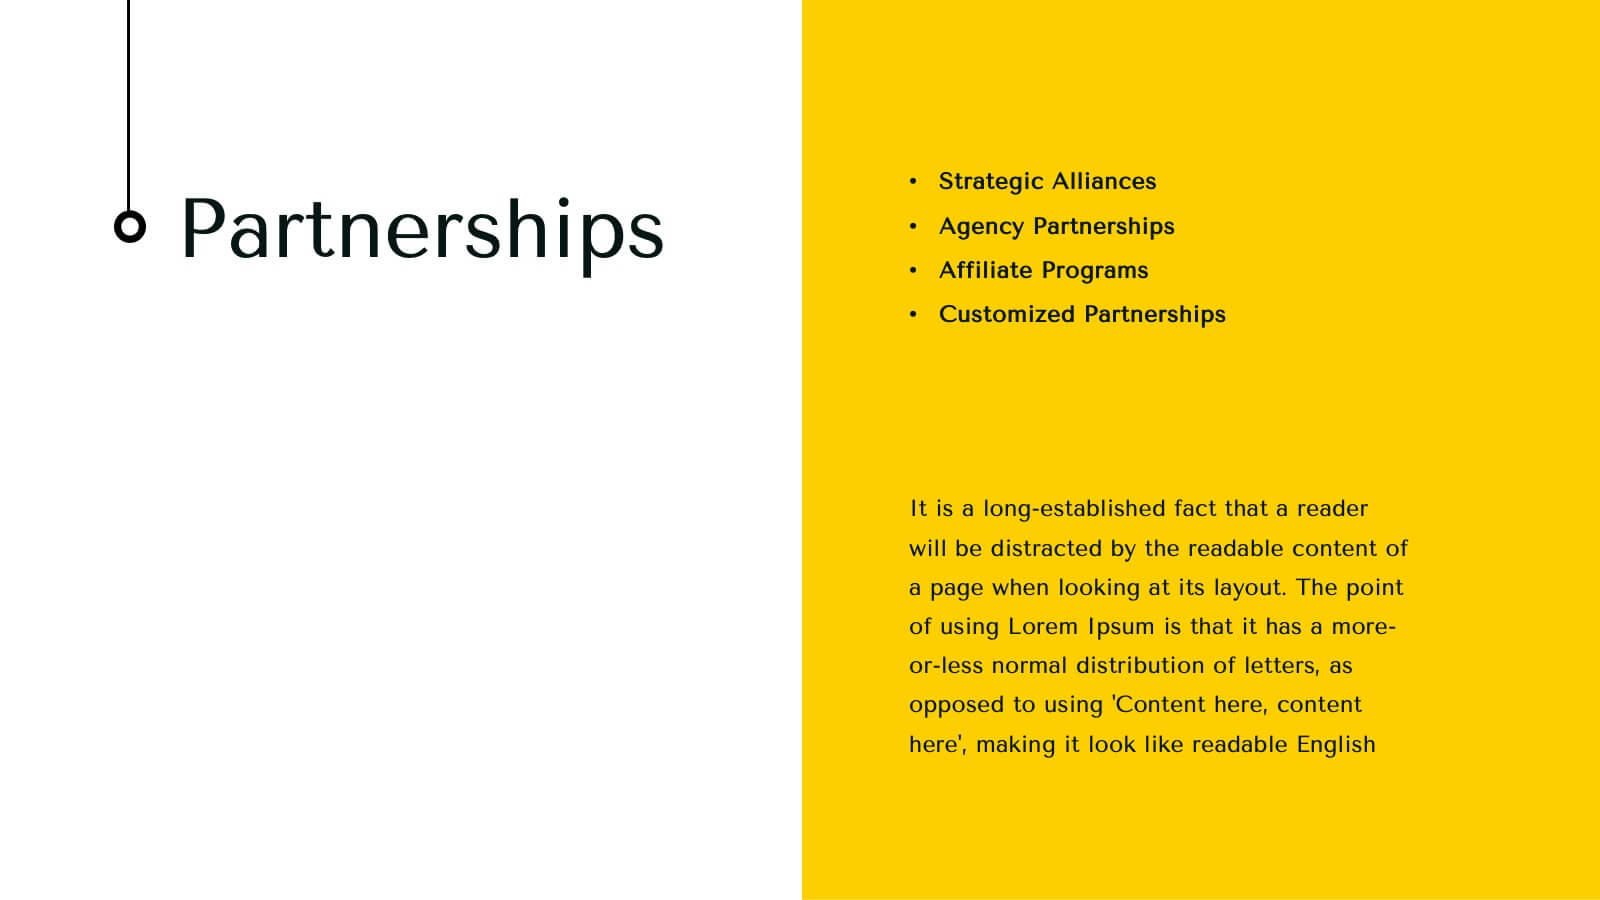
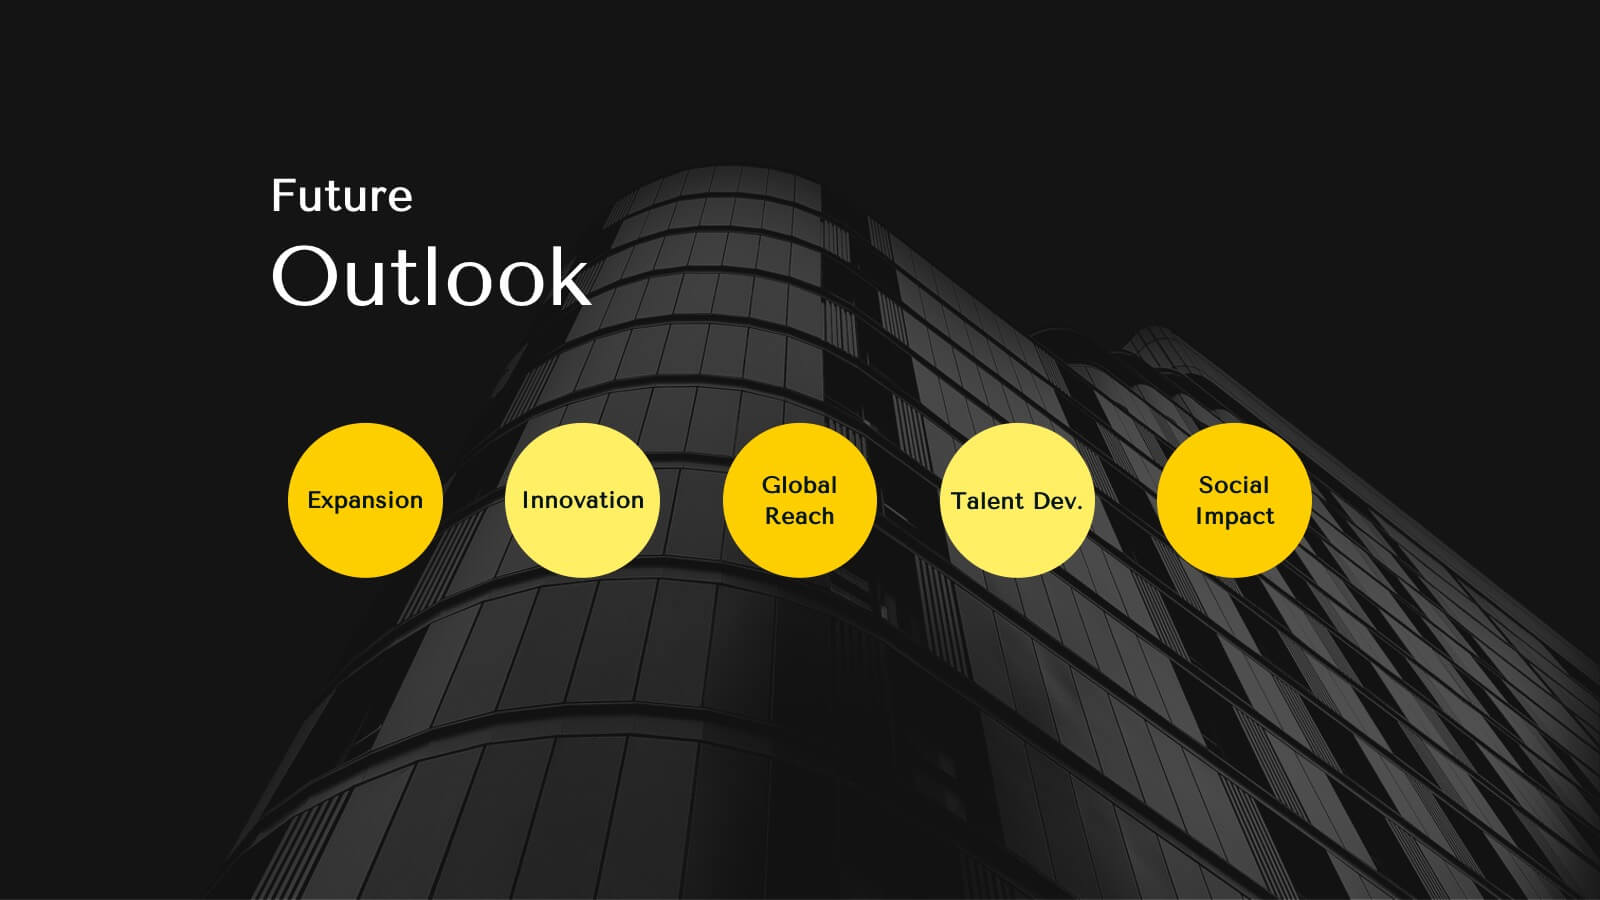
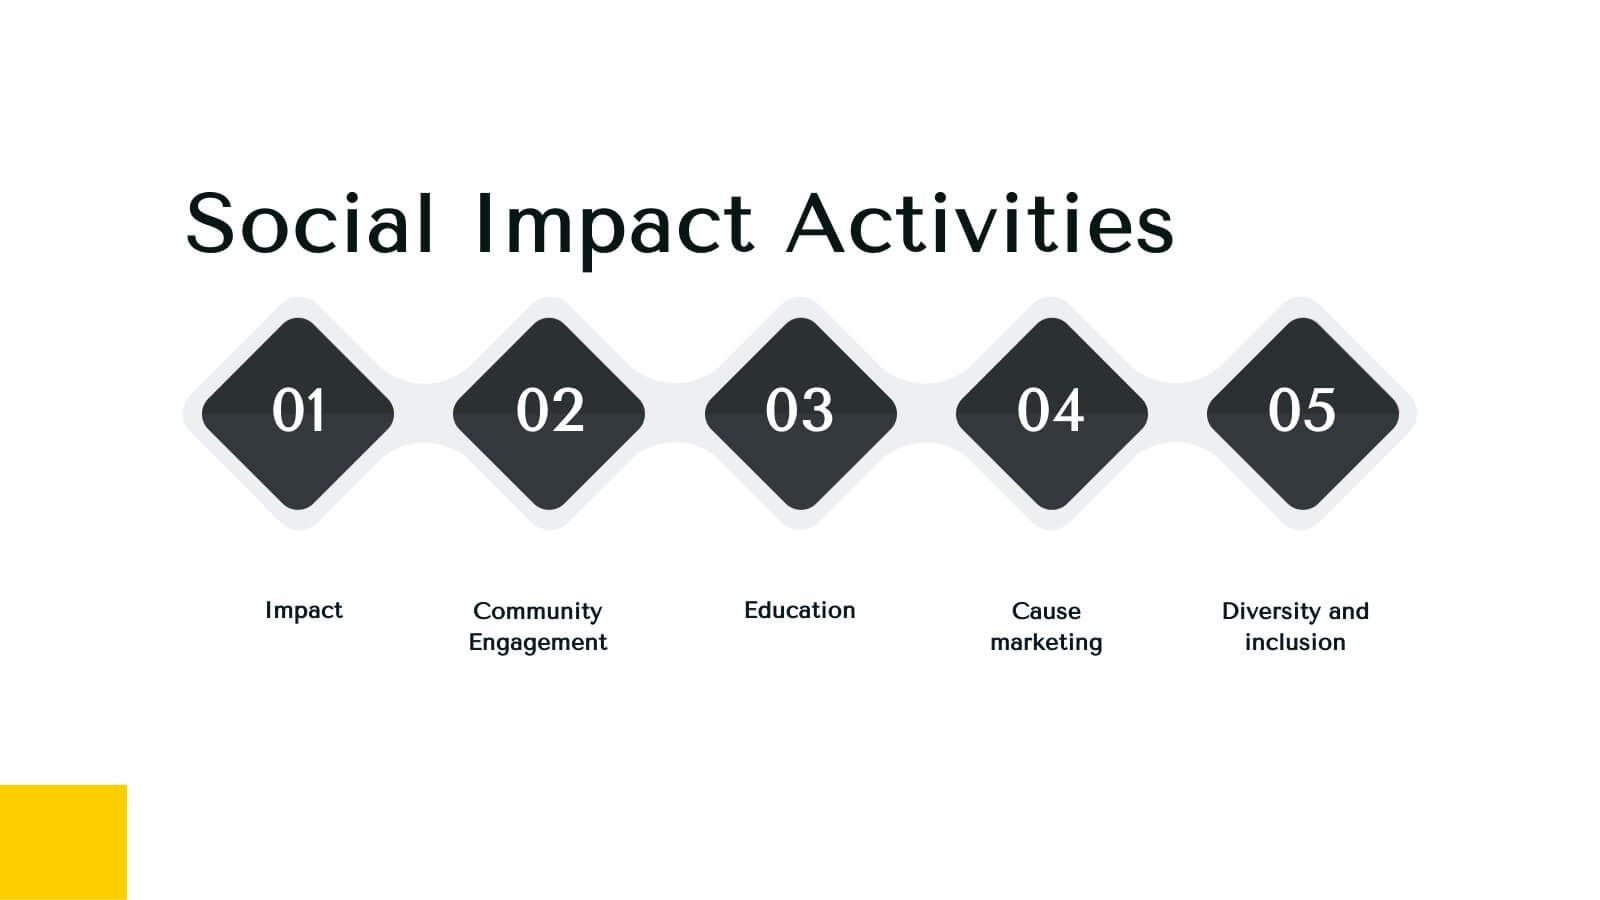
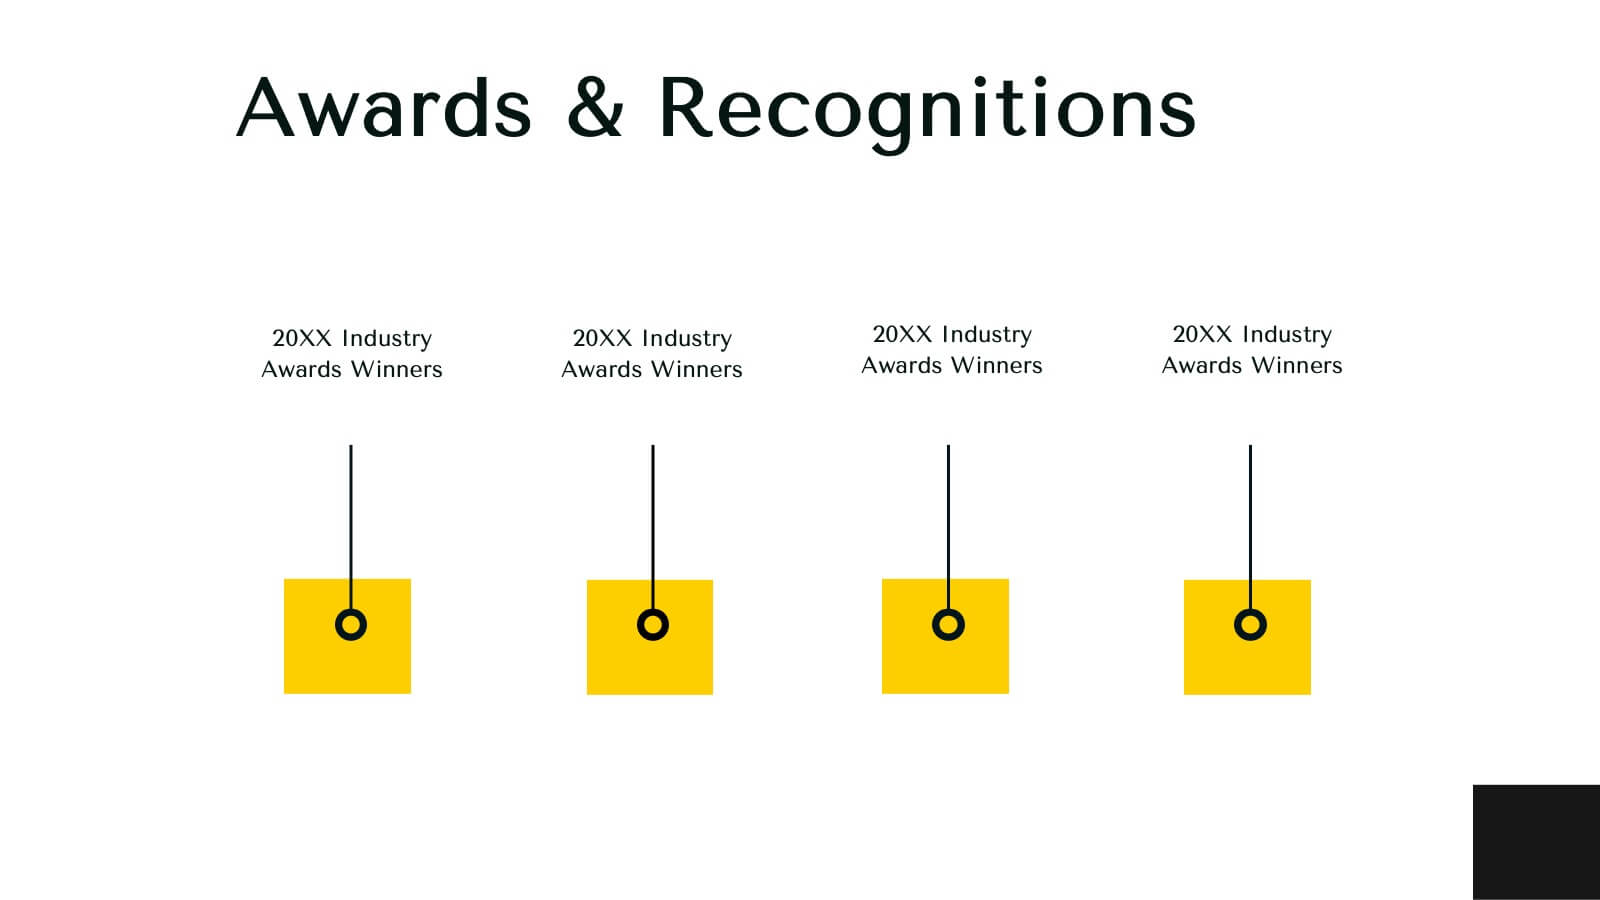
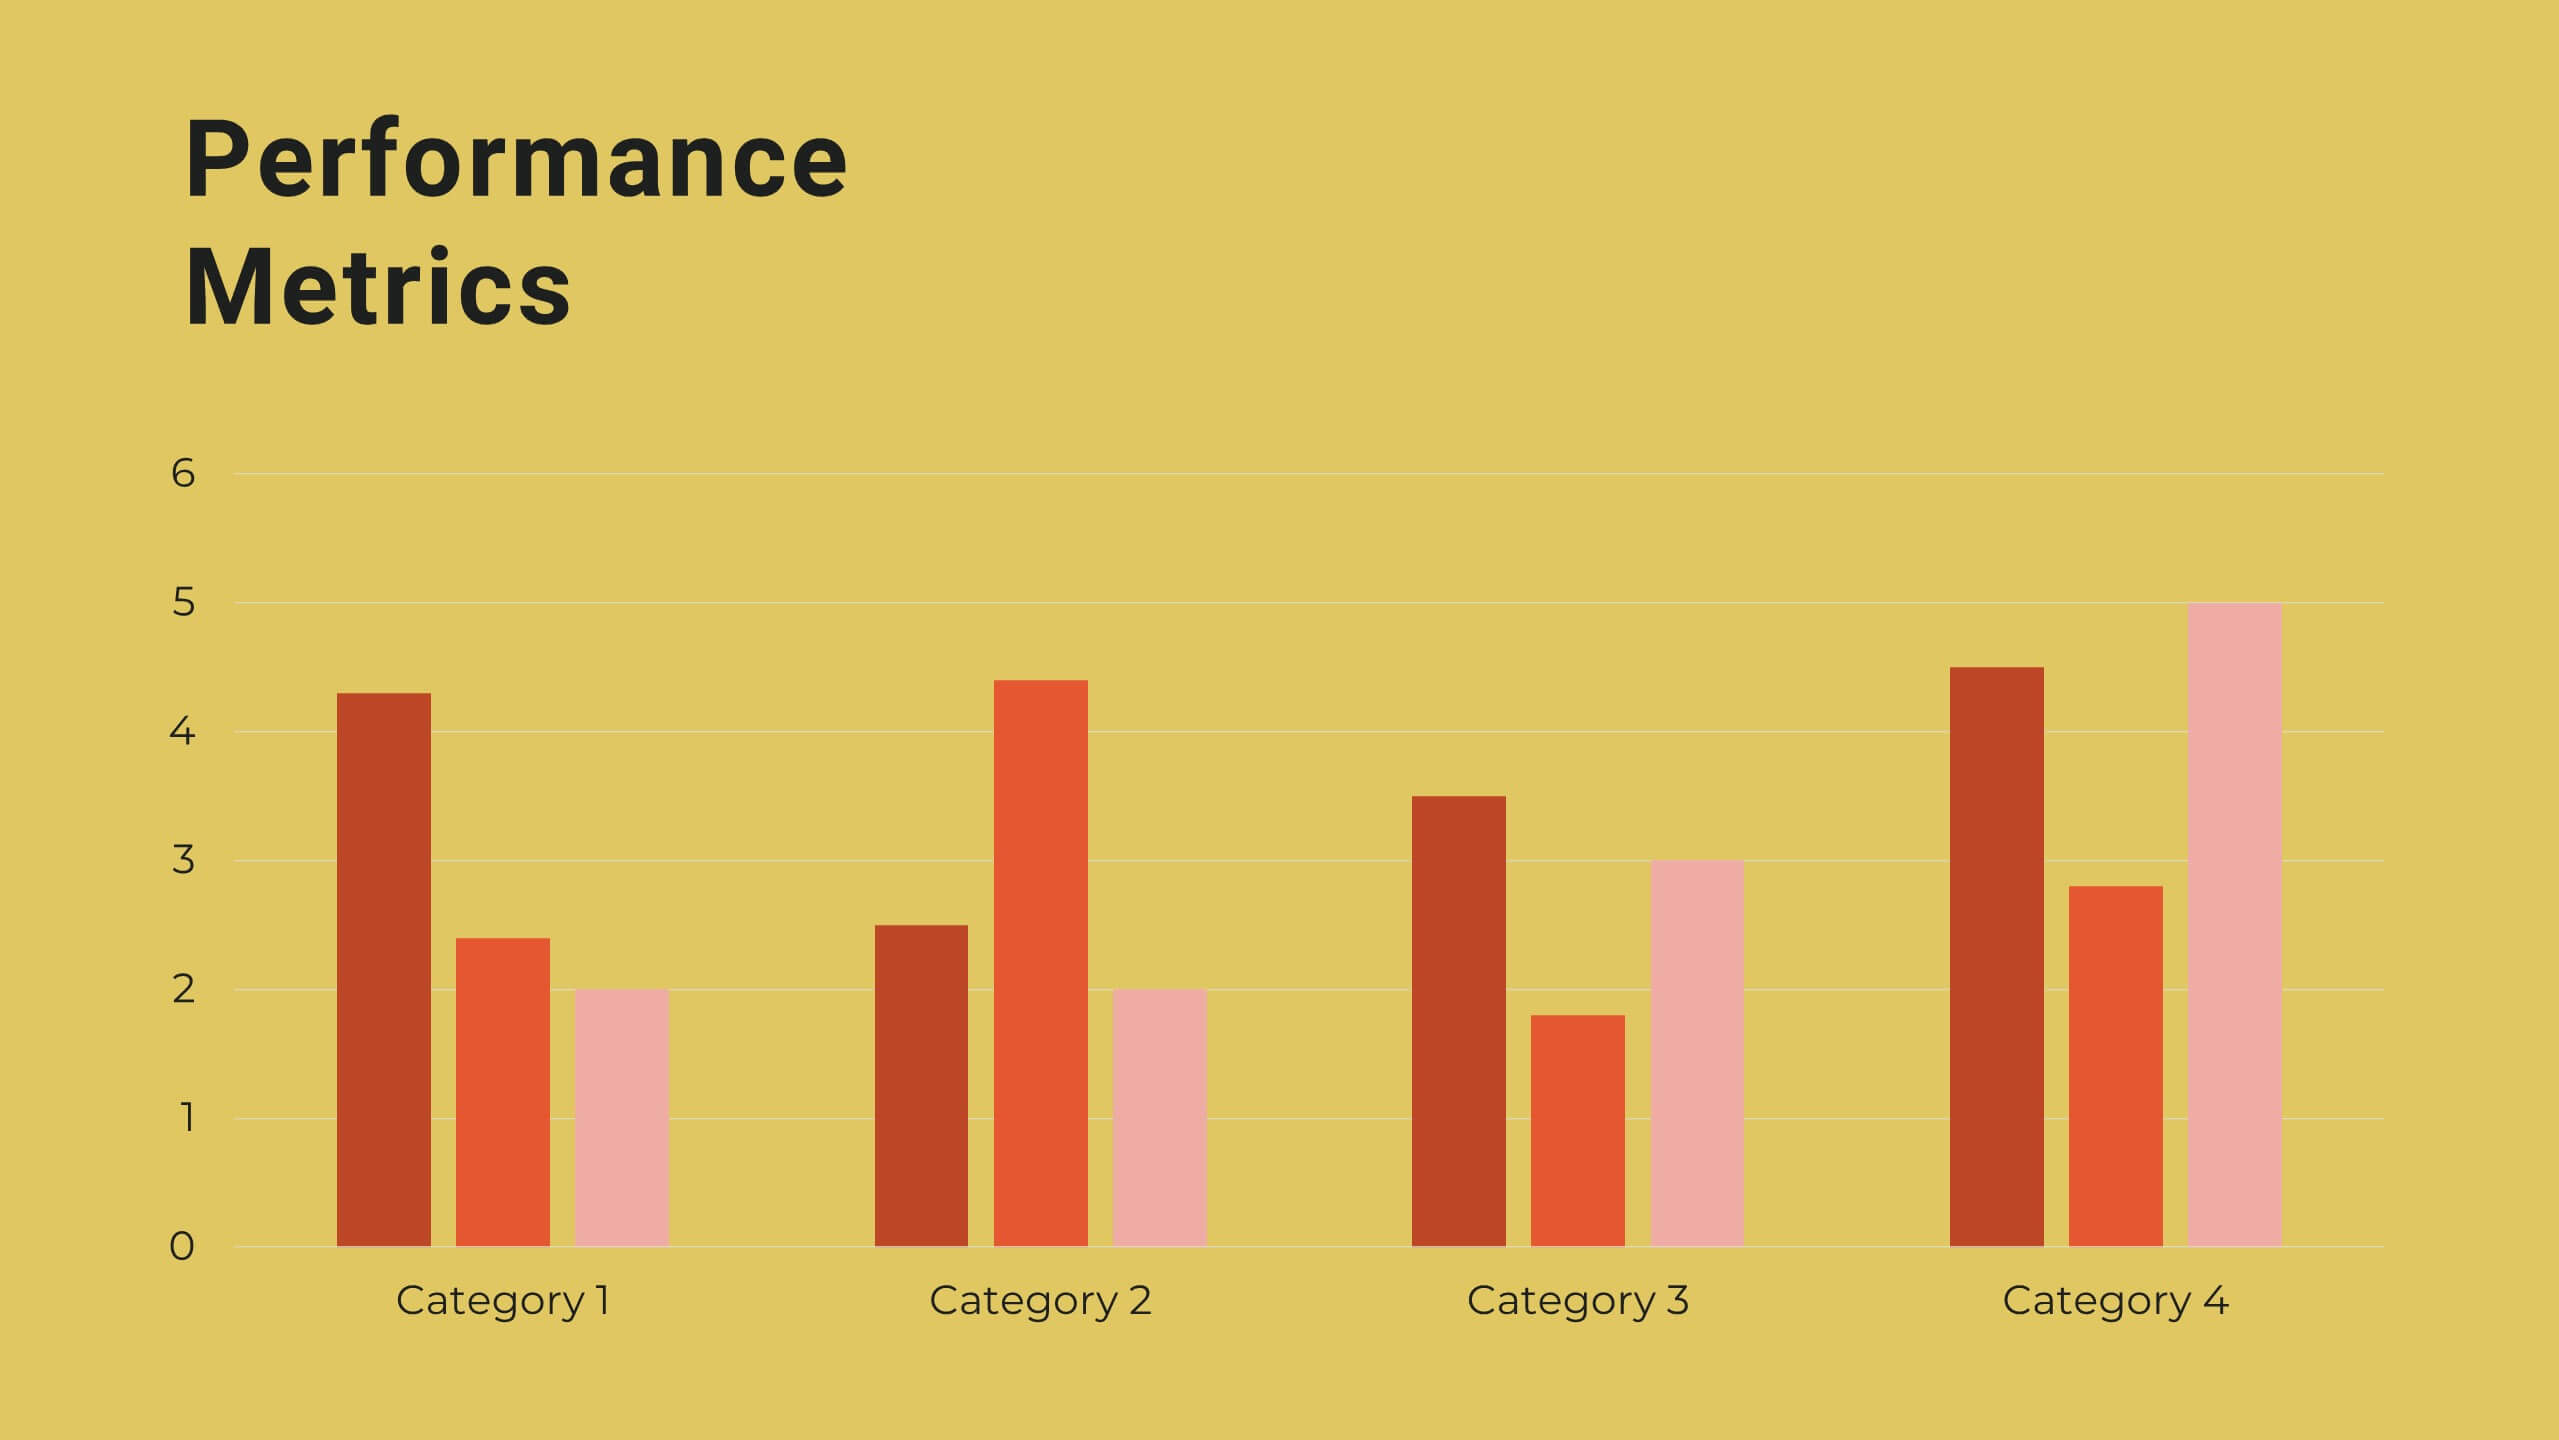
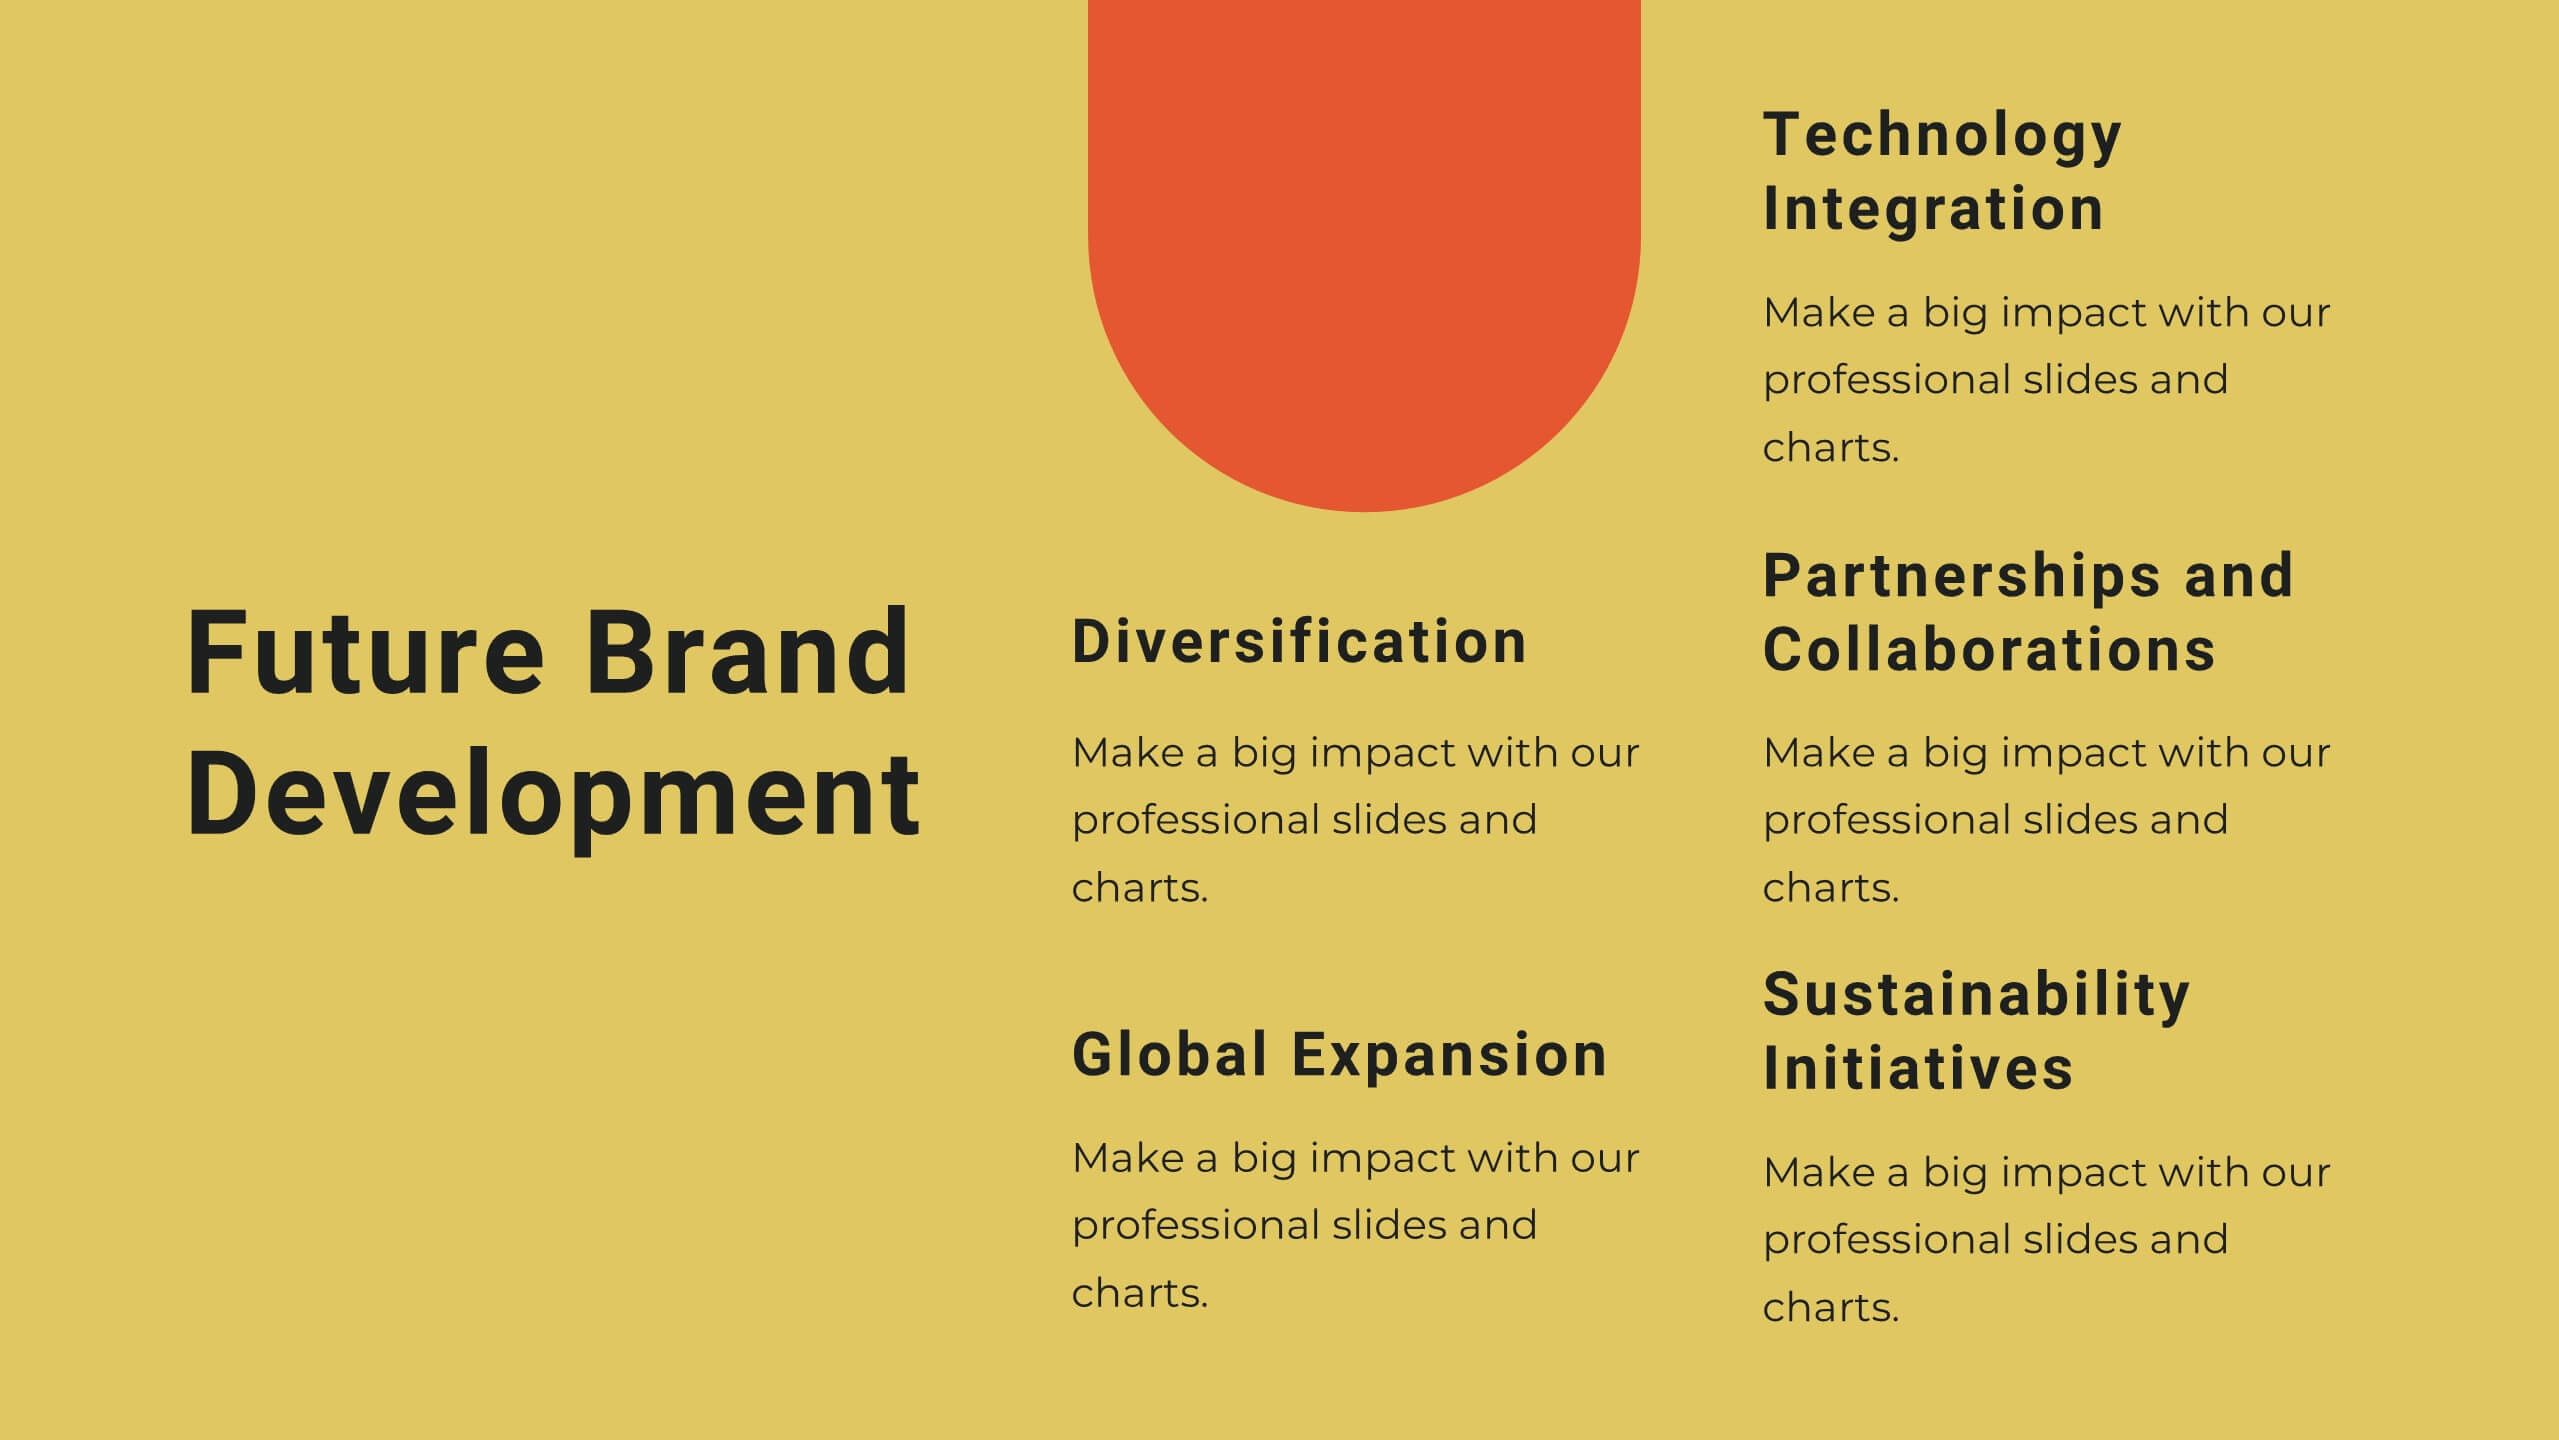
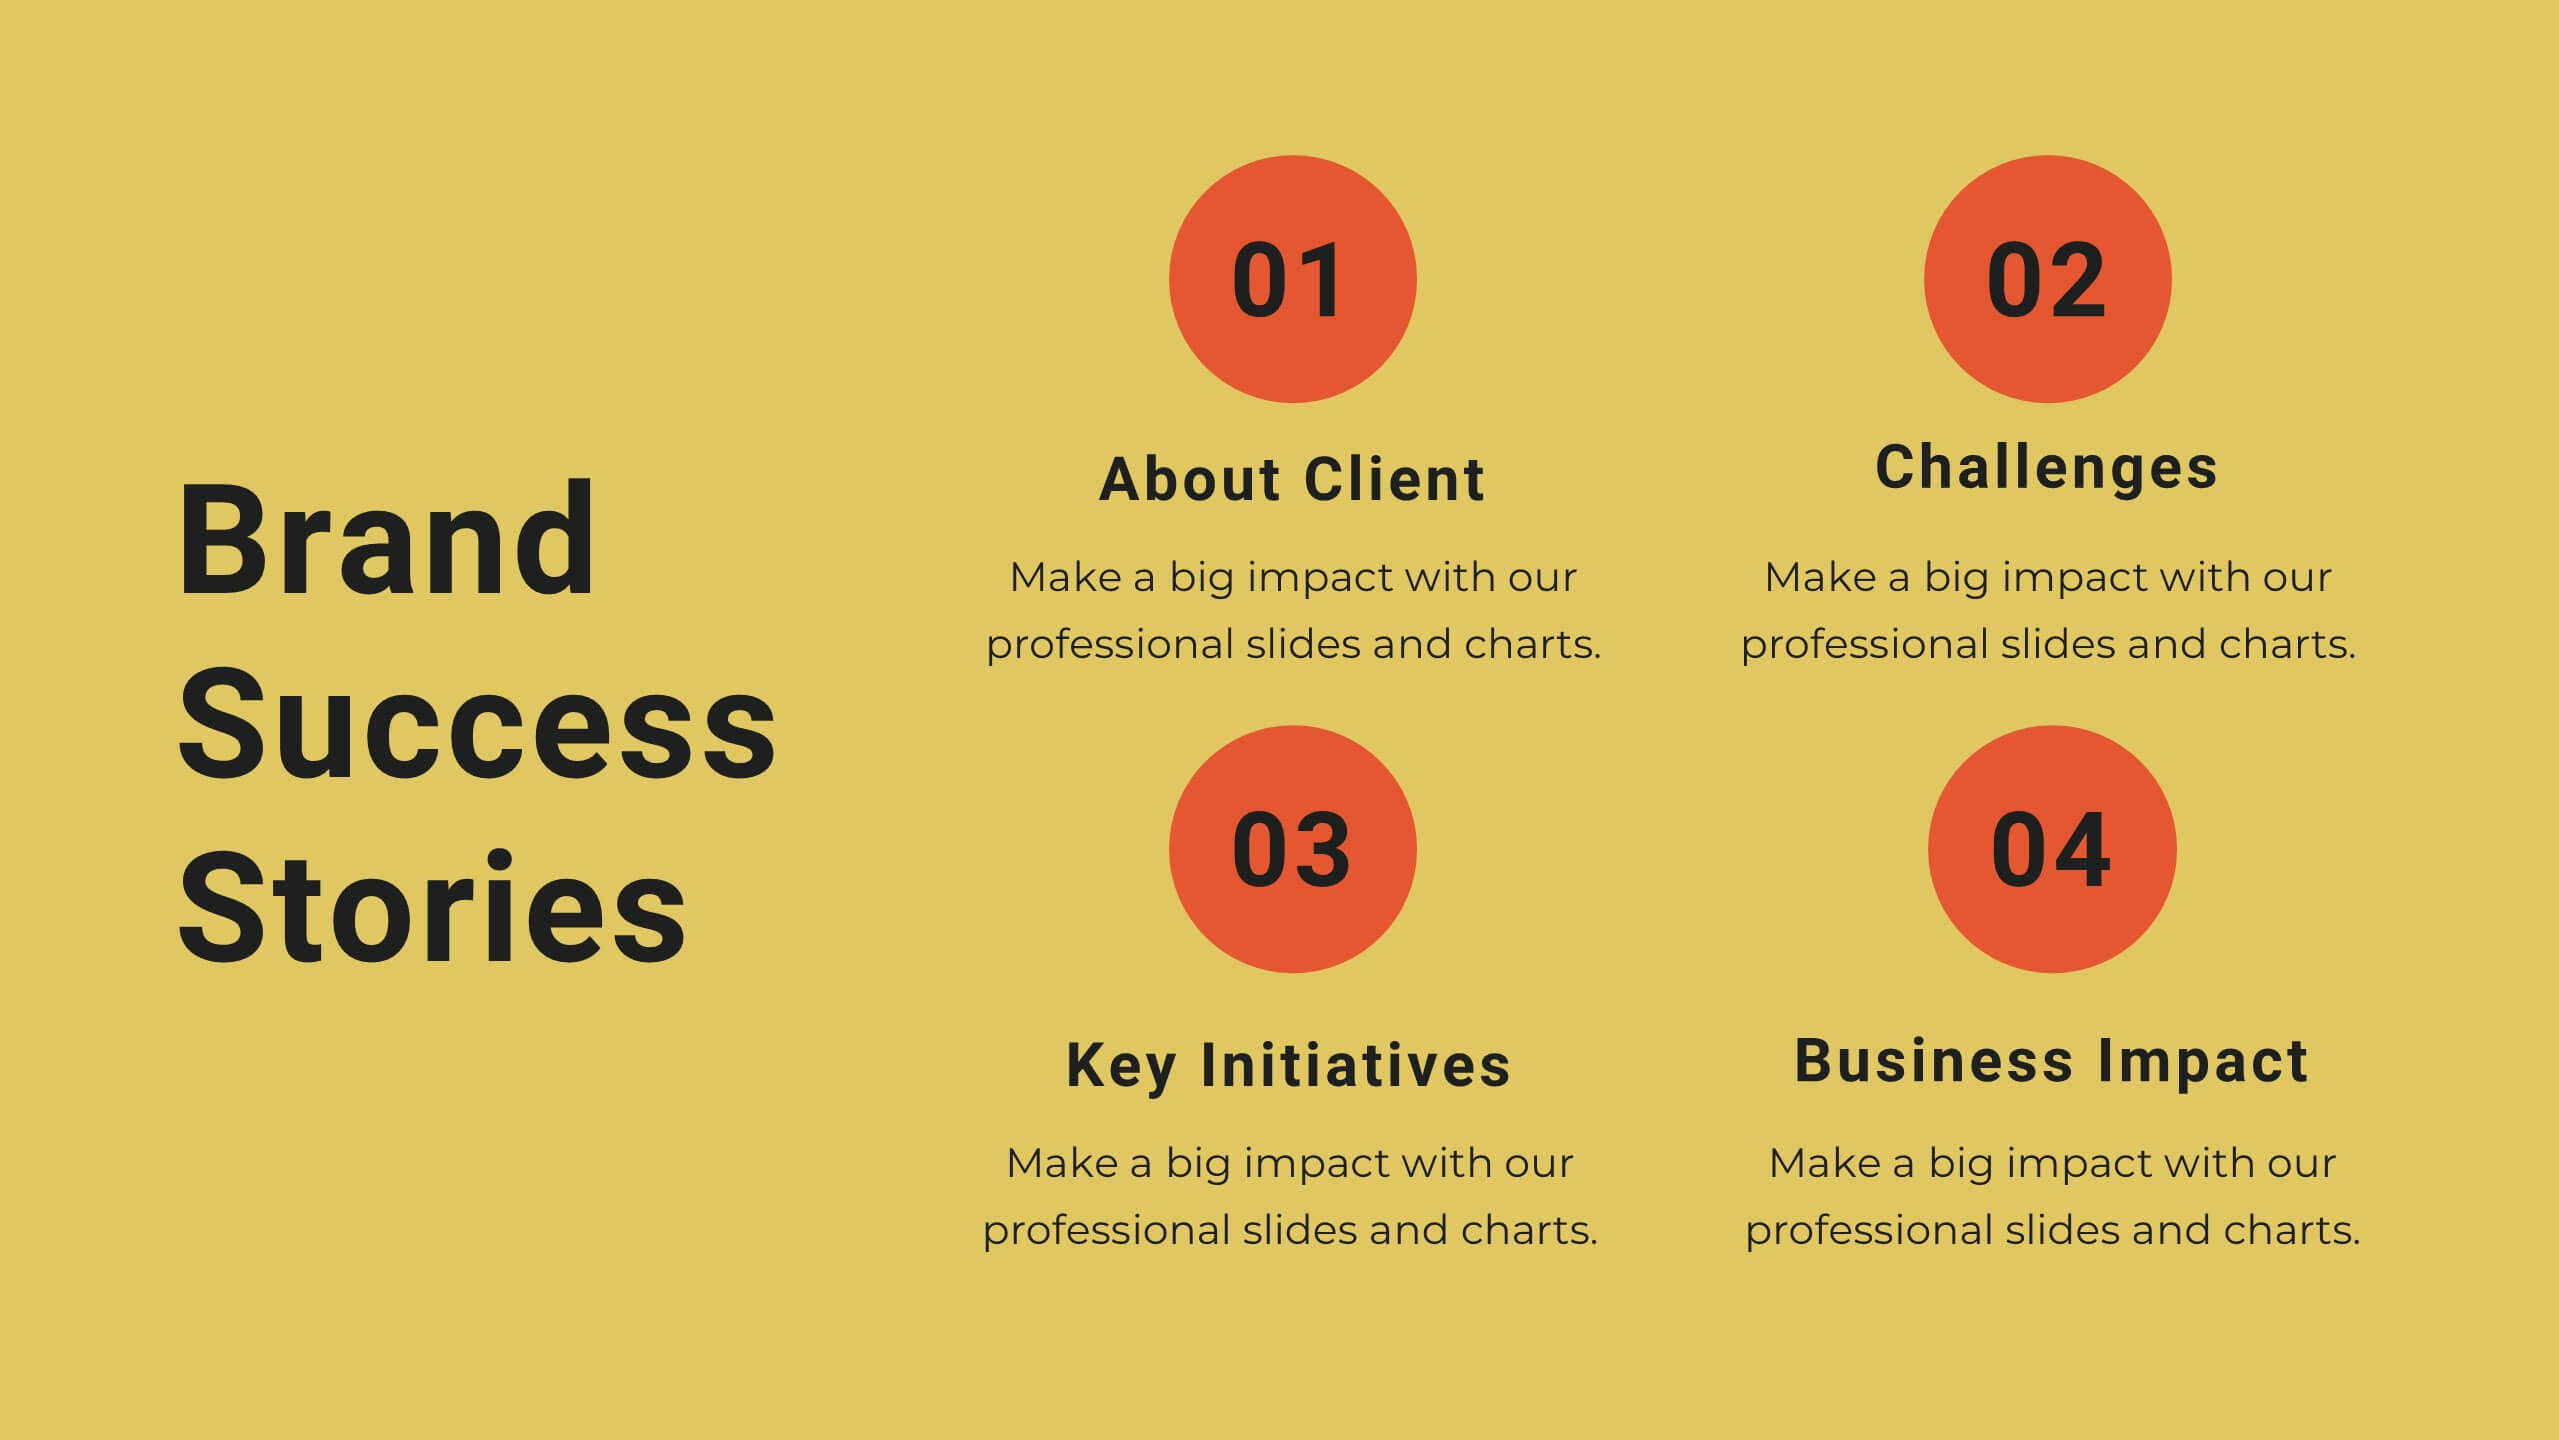
Infinity Agency Portfolio Presentation
Showcase your agency's excellence with this dynamic and modern presentation template. Ideal for presenting market analysis, client success stories, and strategic development plans, it features a bold design with a vibrant yellow and black theme. Highlight your unique approach and creative process to captivate your audience. Compatible with PowerPoint, Keynote, and Google Slides, it's perfect for any platform.


7 diapositivas
SEO Infographic Presentation Template
SEO stands for “search engine optimization.” In simple terms, it's the process of improving your site to increase its visibility when people search for products or services related to your business in Google and other search engines. Learn more about SEO with this clean template, including how to optimize your pages and how search engines work. This template will inform you how keywords and phrases drive search engine results, how they affect rankings, and what steps to take to achieve higher rankings. This template comes packed with fun illustrations, and can be used as a great presentation.


7 diapositivas
Master Six Sigma Infographic Presentation
Six Sigma is a methodology used by organizations to improve their business processes and eliminate defects. Use this template to explore the key concepts of Six Sigma and how it can be applied in different industries. This templates include helpful illustrations, charts and tips which allow you to present information in a clear and concise way that makes it easy for your audience to understand and take notes. This template has been made using modern fonts, appealing color combinations and simple layouts. The clean and simple design is compatible with Powerpoint, Keynote and Google Slides.


25 diapositivas
Jasper Rebranding Project Plan Presentation
Elevate your brand transformation with this sleek rebranding presentation template! It covers everything from mission and values to market analysis and brand positioning. Perfect for showcasing your brand guidelines and touchpoints. Fully customizable, and compatible with PowerPoint, Keynote, and Google Slides, making your rebranding process seamless and professional.


6 diapositivas
Best Solution Proposal Presentation
Present your ideas with clarity and confidence using this modern, structured layout that highlights problems, opportunities, and proposed solutions step by step. Ideal for showcasing strategies or business improvements, it keeps information organized and persuasive. Fully compatible with PowerPoint, Keynote, and Google Slides for effortless customization and presentation.


6 diapositivas
Sustainability Goals and Metrics Presentation
Bring your eco-initiatives to life with a presentation that blends purpose and clarity. Ideal for showcasing environmental goals, progress metrics, and sustainability strategies, this clean design helps communicate impact with confidence. Fully editable and compatible with PowerPoint, Keynote, and Google Slides for seamless customization and professional results.


21 diapositivas
Novaedge Professional Portfolio Showcase Presentation
Showcase your expertise with this elegant experience proposal presentation! Featuring sections like portfolio highlights, creative process, client testimonials, and pricing packages, it provides a complete overview of your work. Ideal for freelance professionals or agencies, this template ensures a polished presentation. Fully compatible with PowerPoint, Keynote, and Google Slides.


7 diapositivas
Liability Insurance Infographic
Liability insurance is a type of insurance that provides coverage and protection to individuals and businesses against the risk of being sued and held legally liable for injuries, damages, or losses caused to other individuals or entities. This template is your roadmap to understanding the vital realm of liability insurance, a shield against unexpected financial risks. Compatible with Powerpoint, Keynote, and Google Slides. It lays out the crucial aspects of liability insurance in a clear and engaging manner, ensuring you're well-equipped to protect yourself or your business.


26 diapositivas
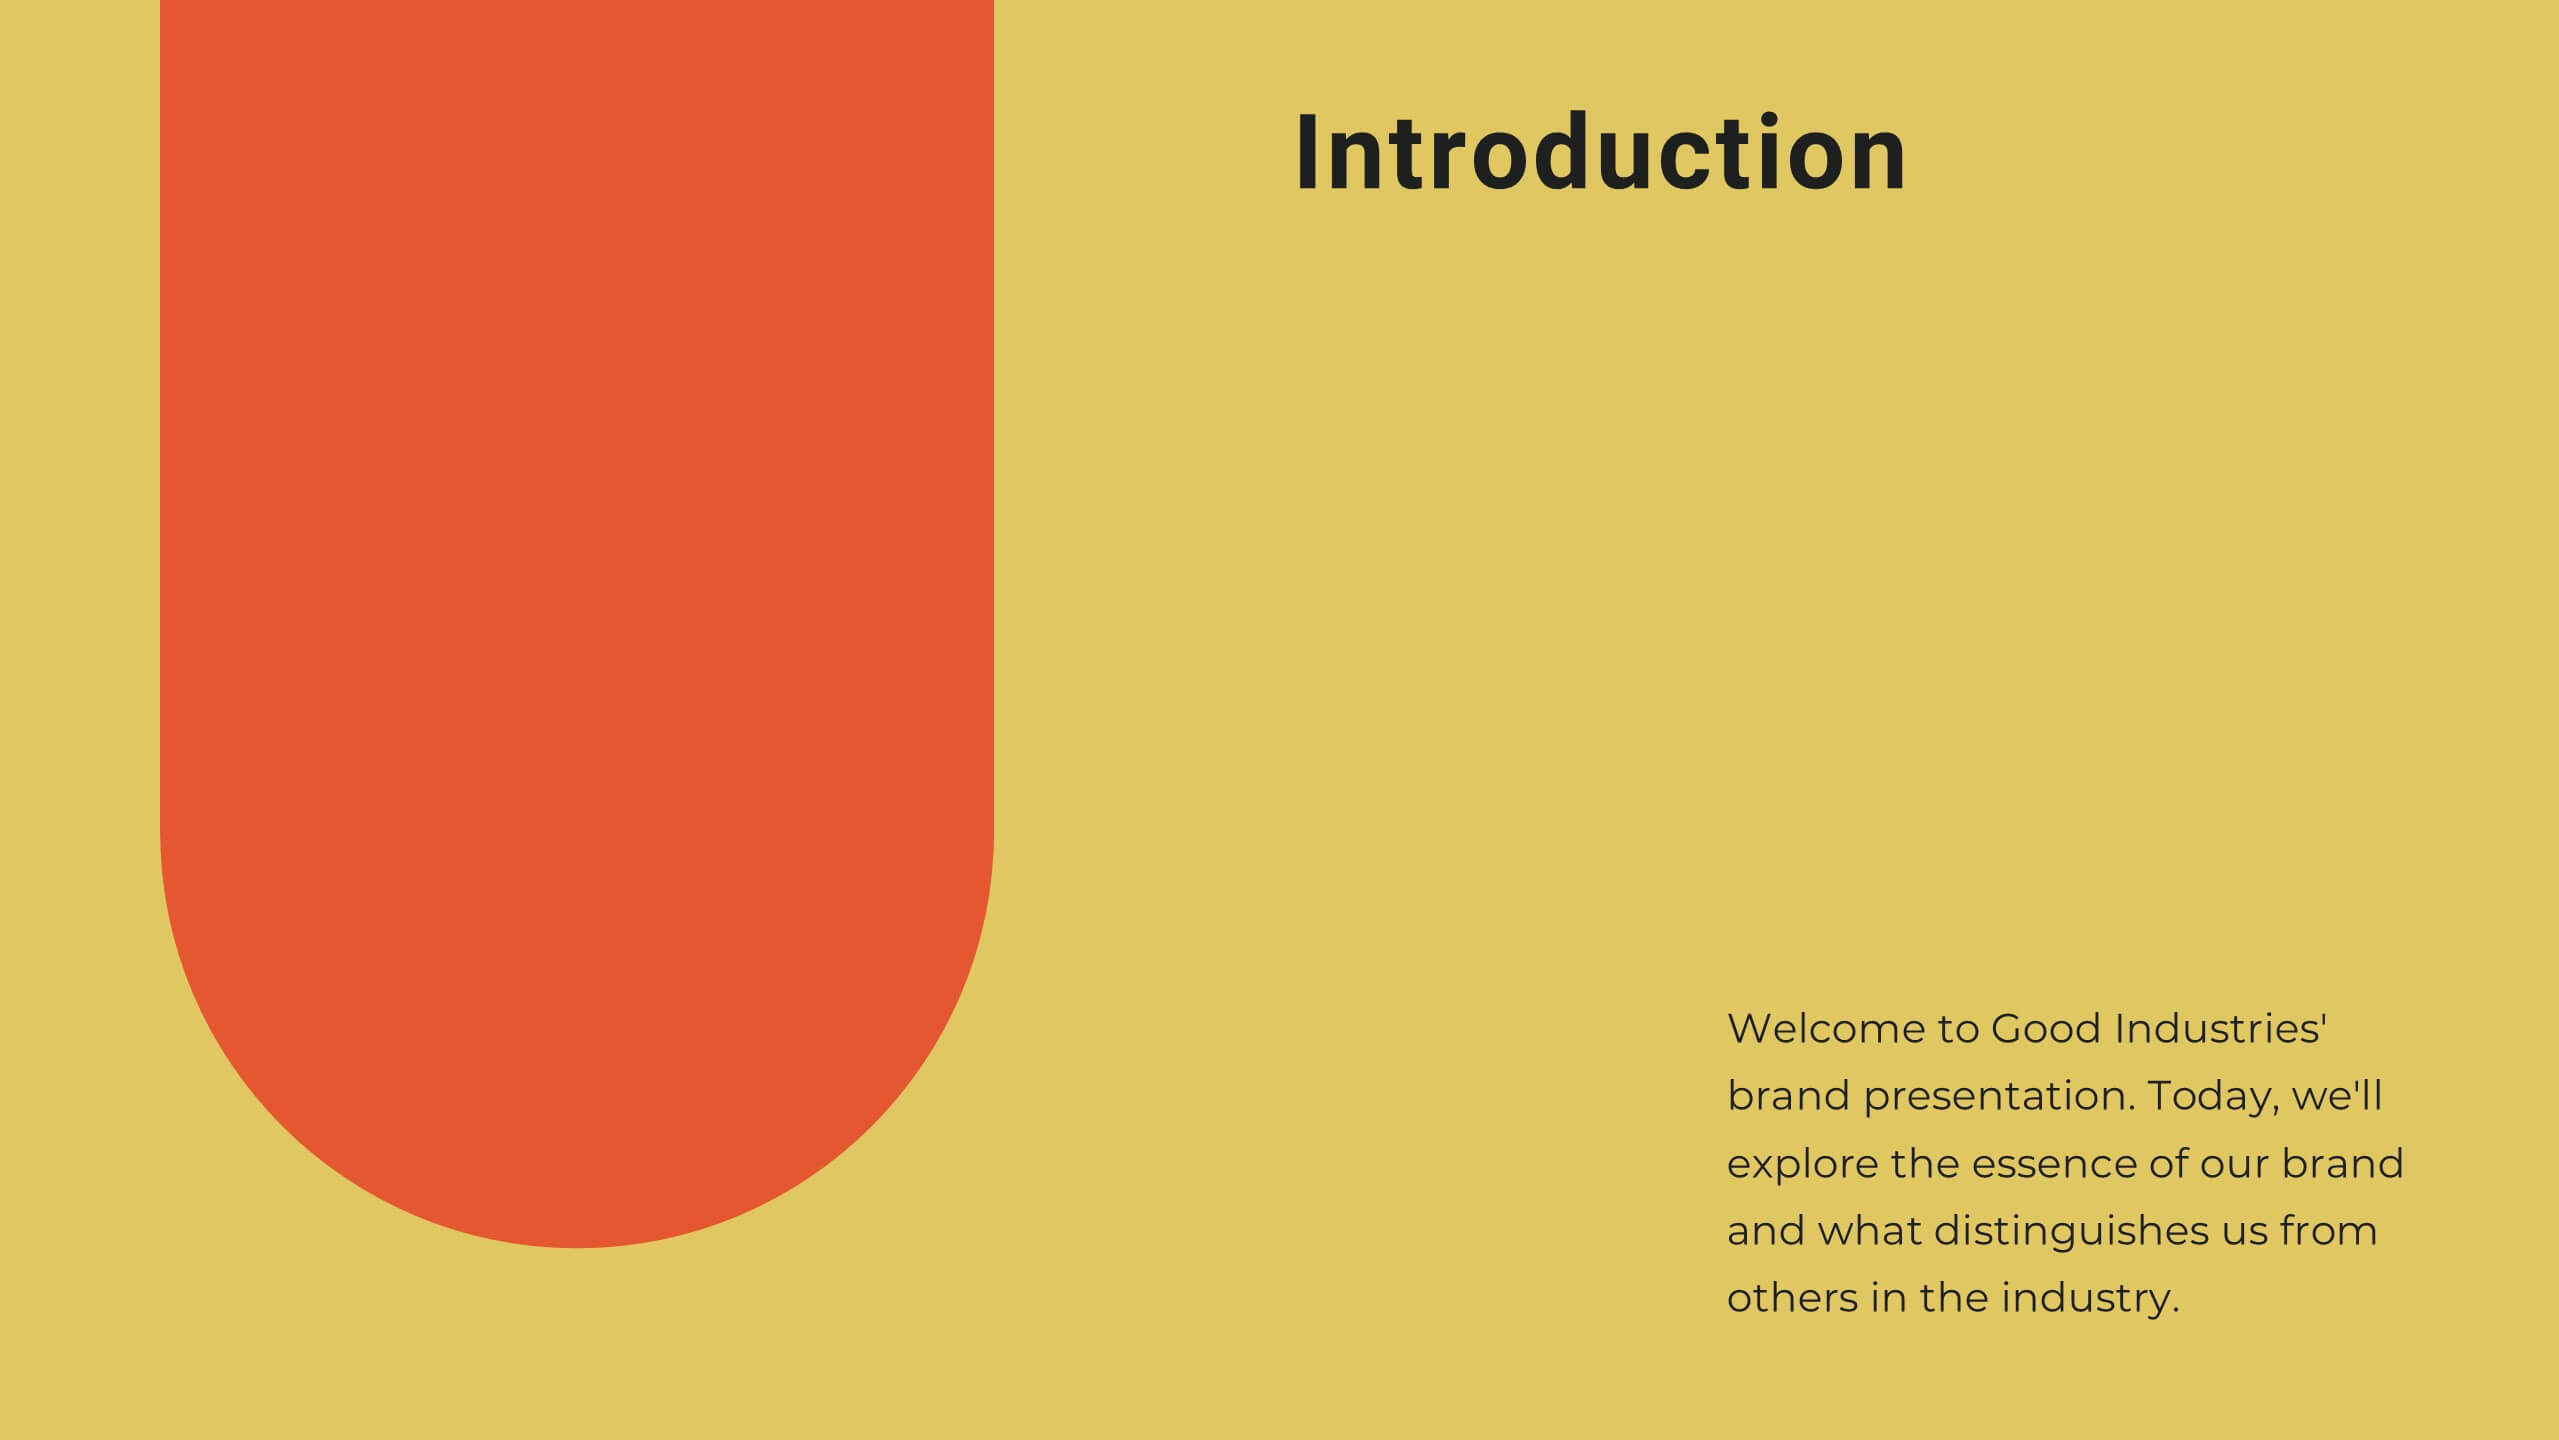
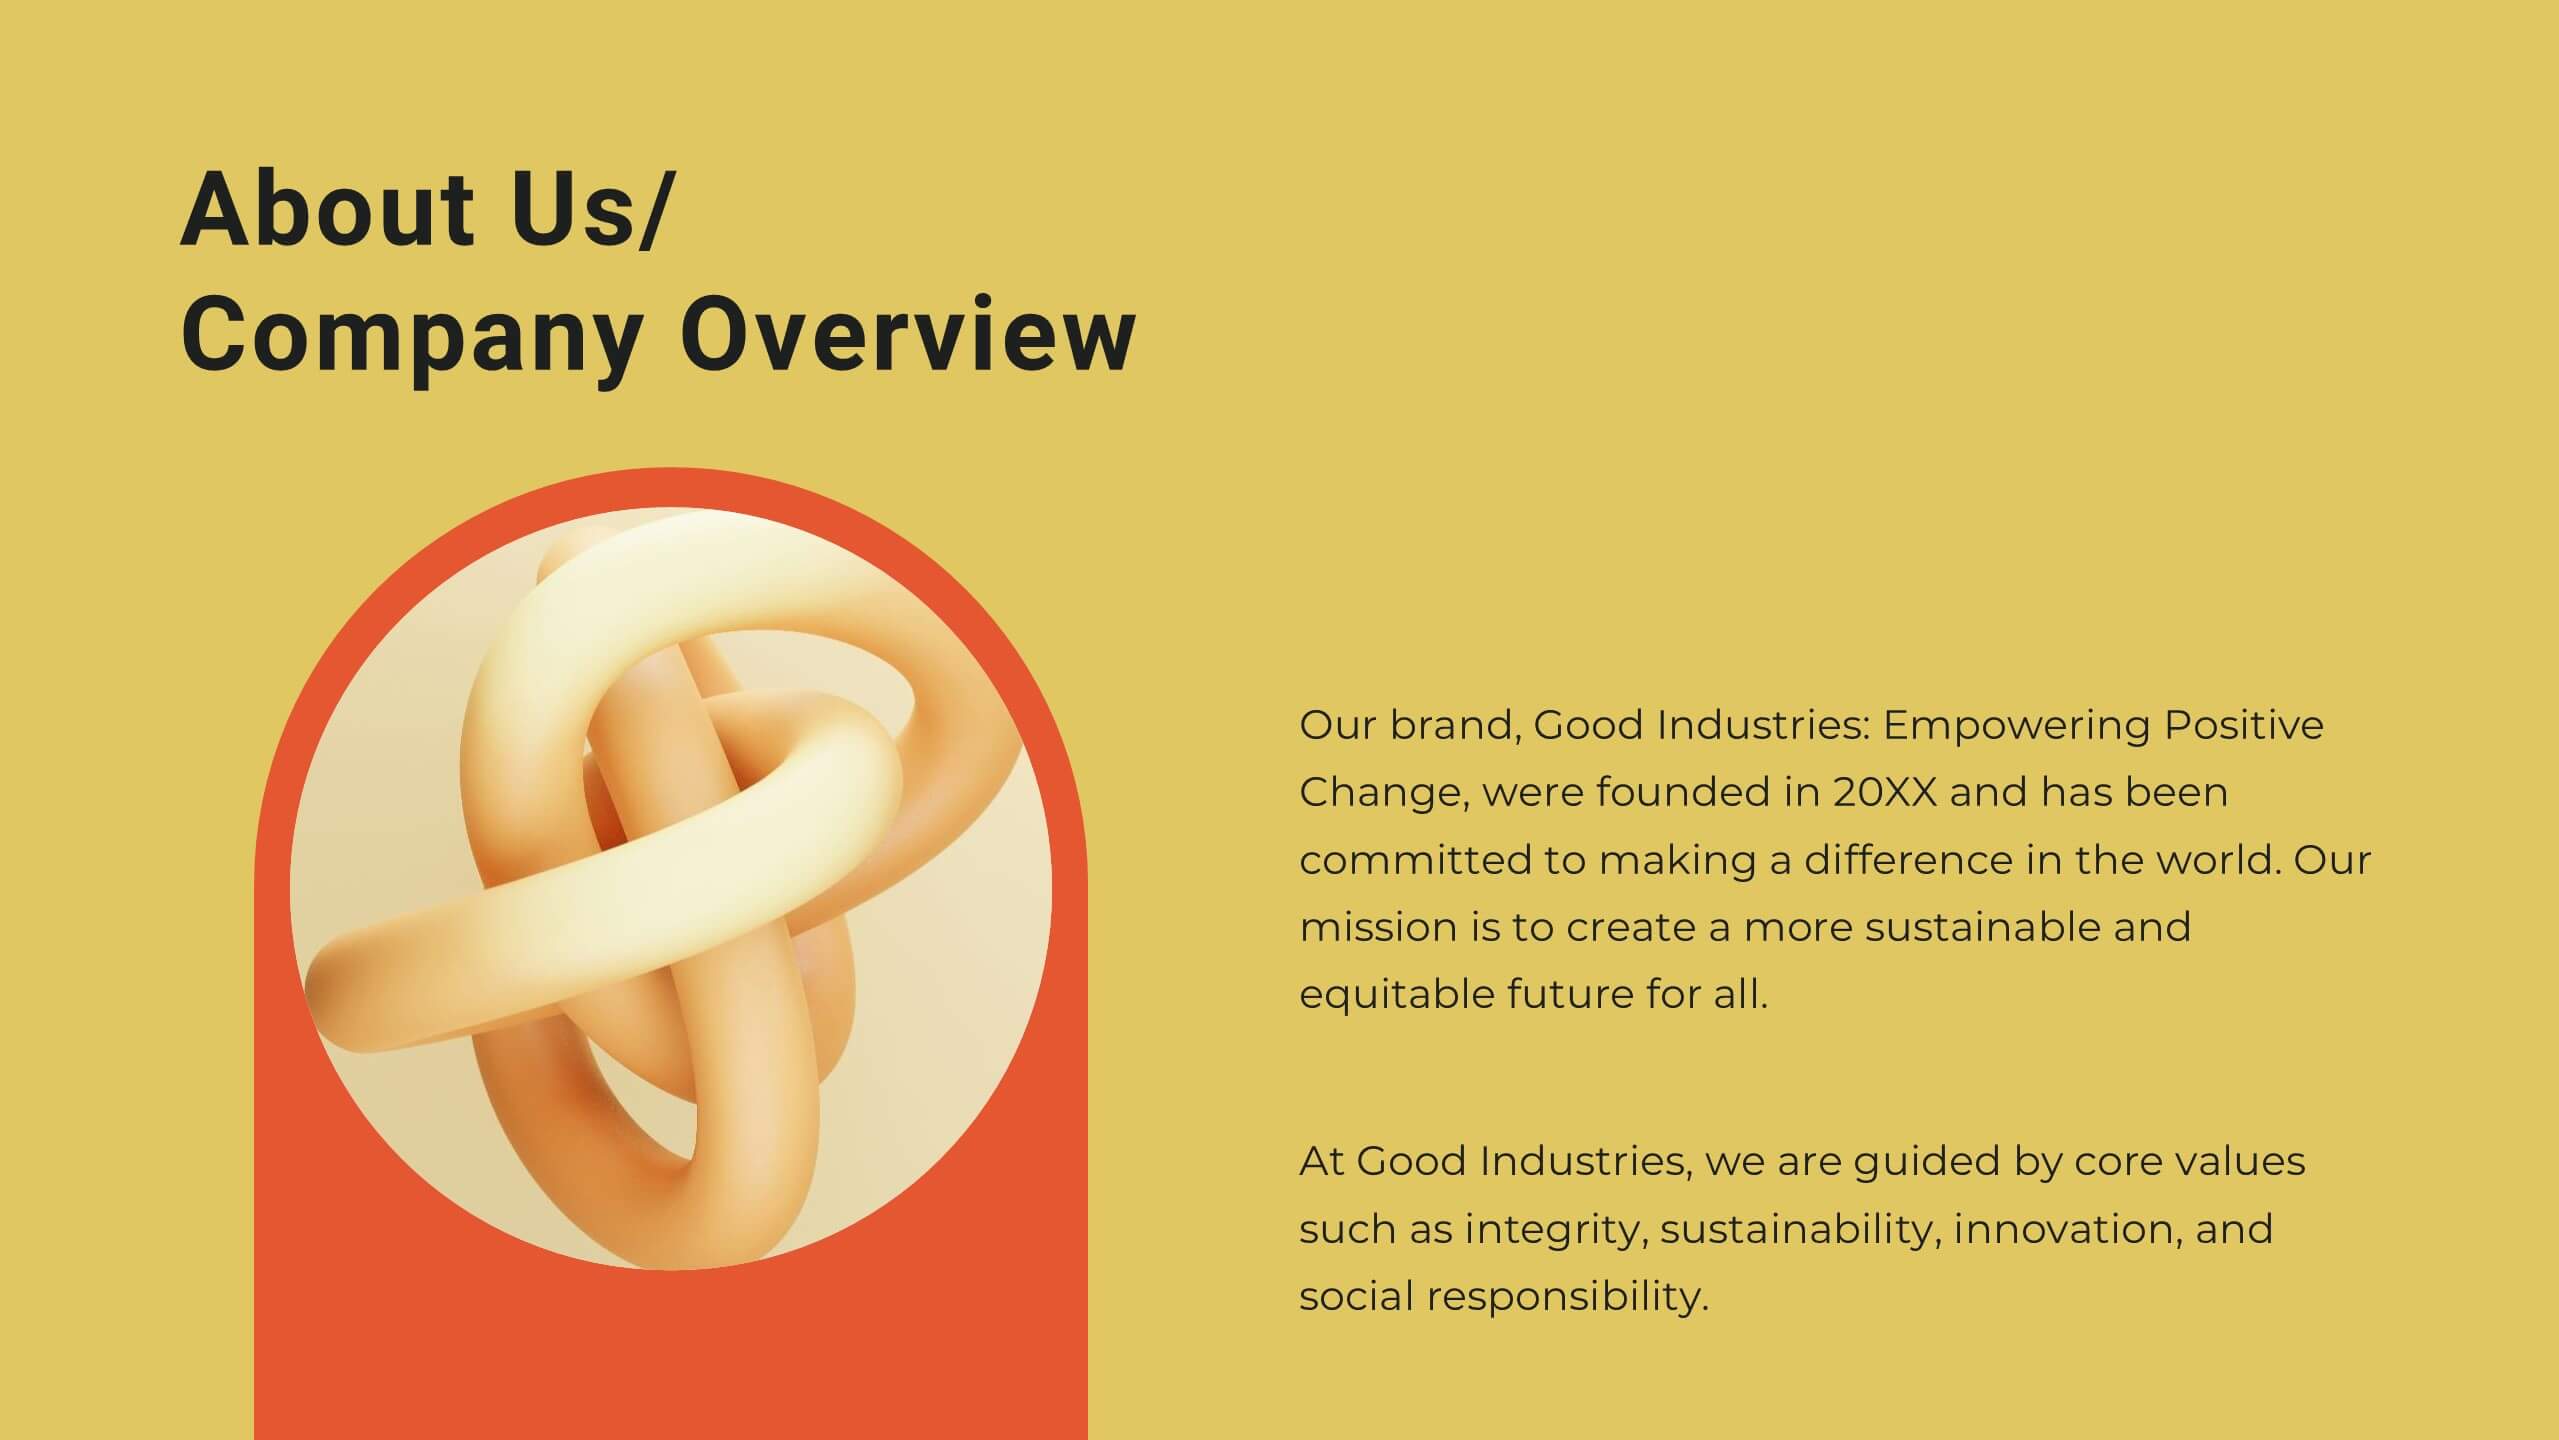
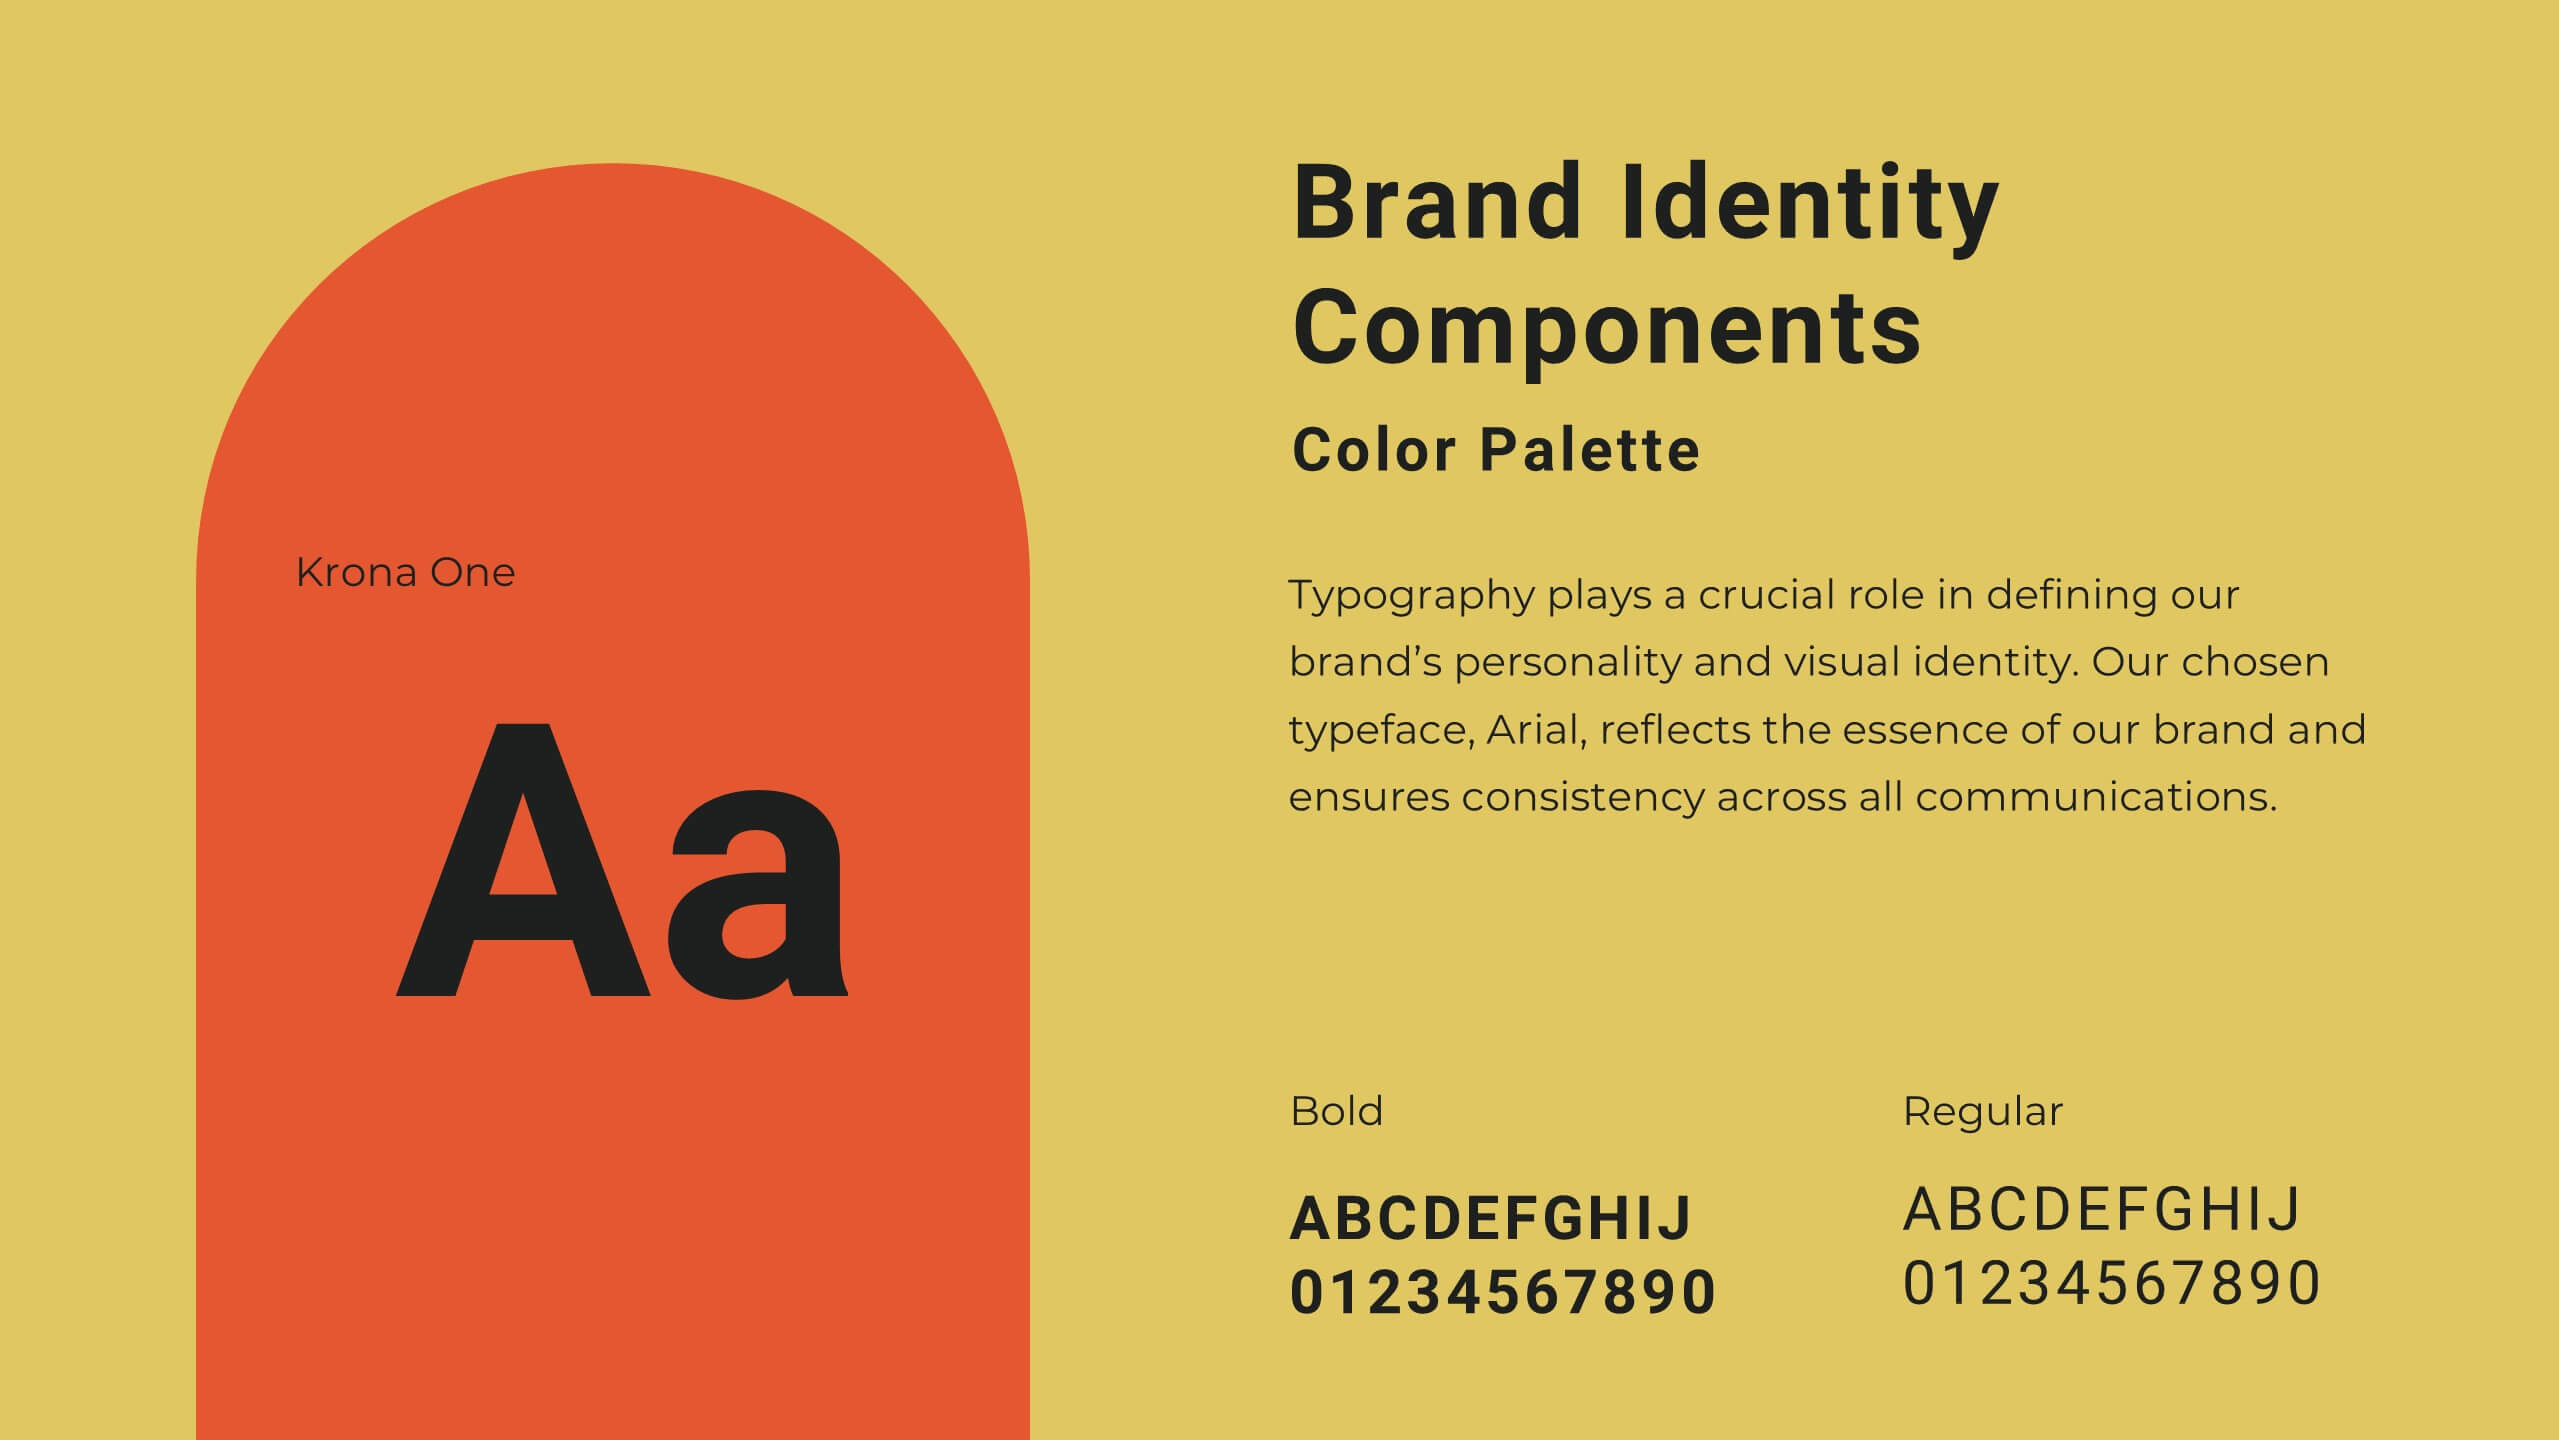
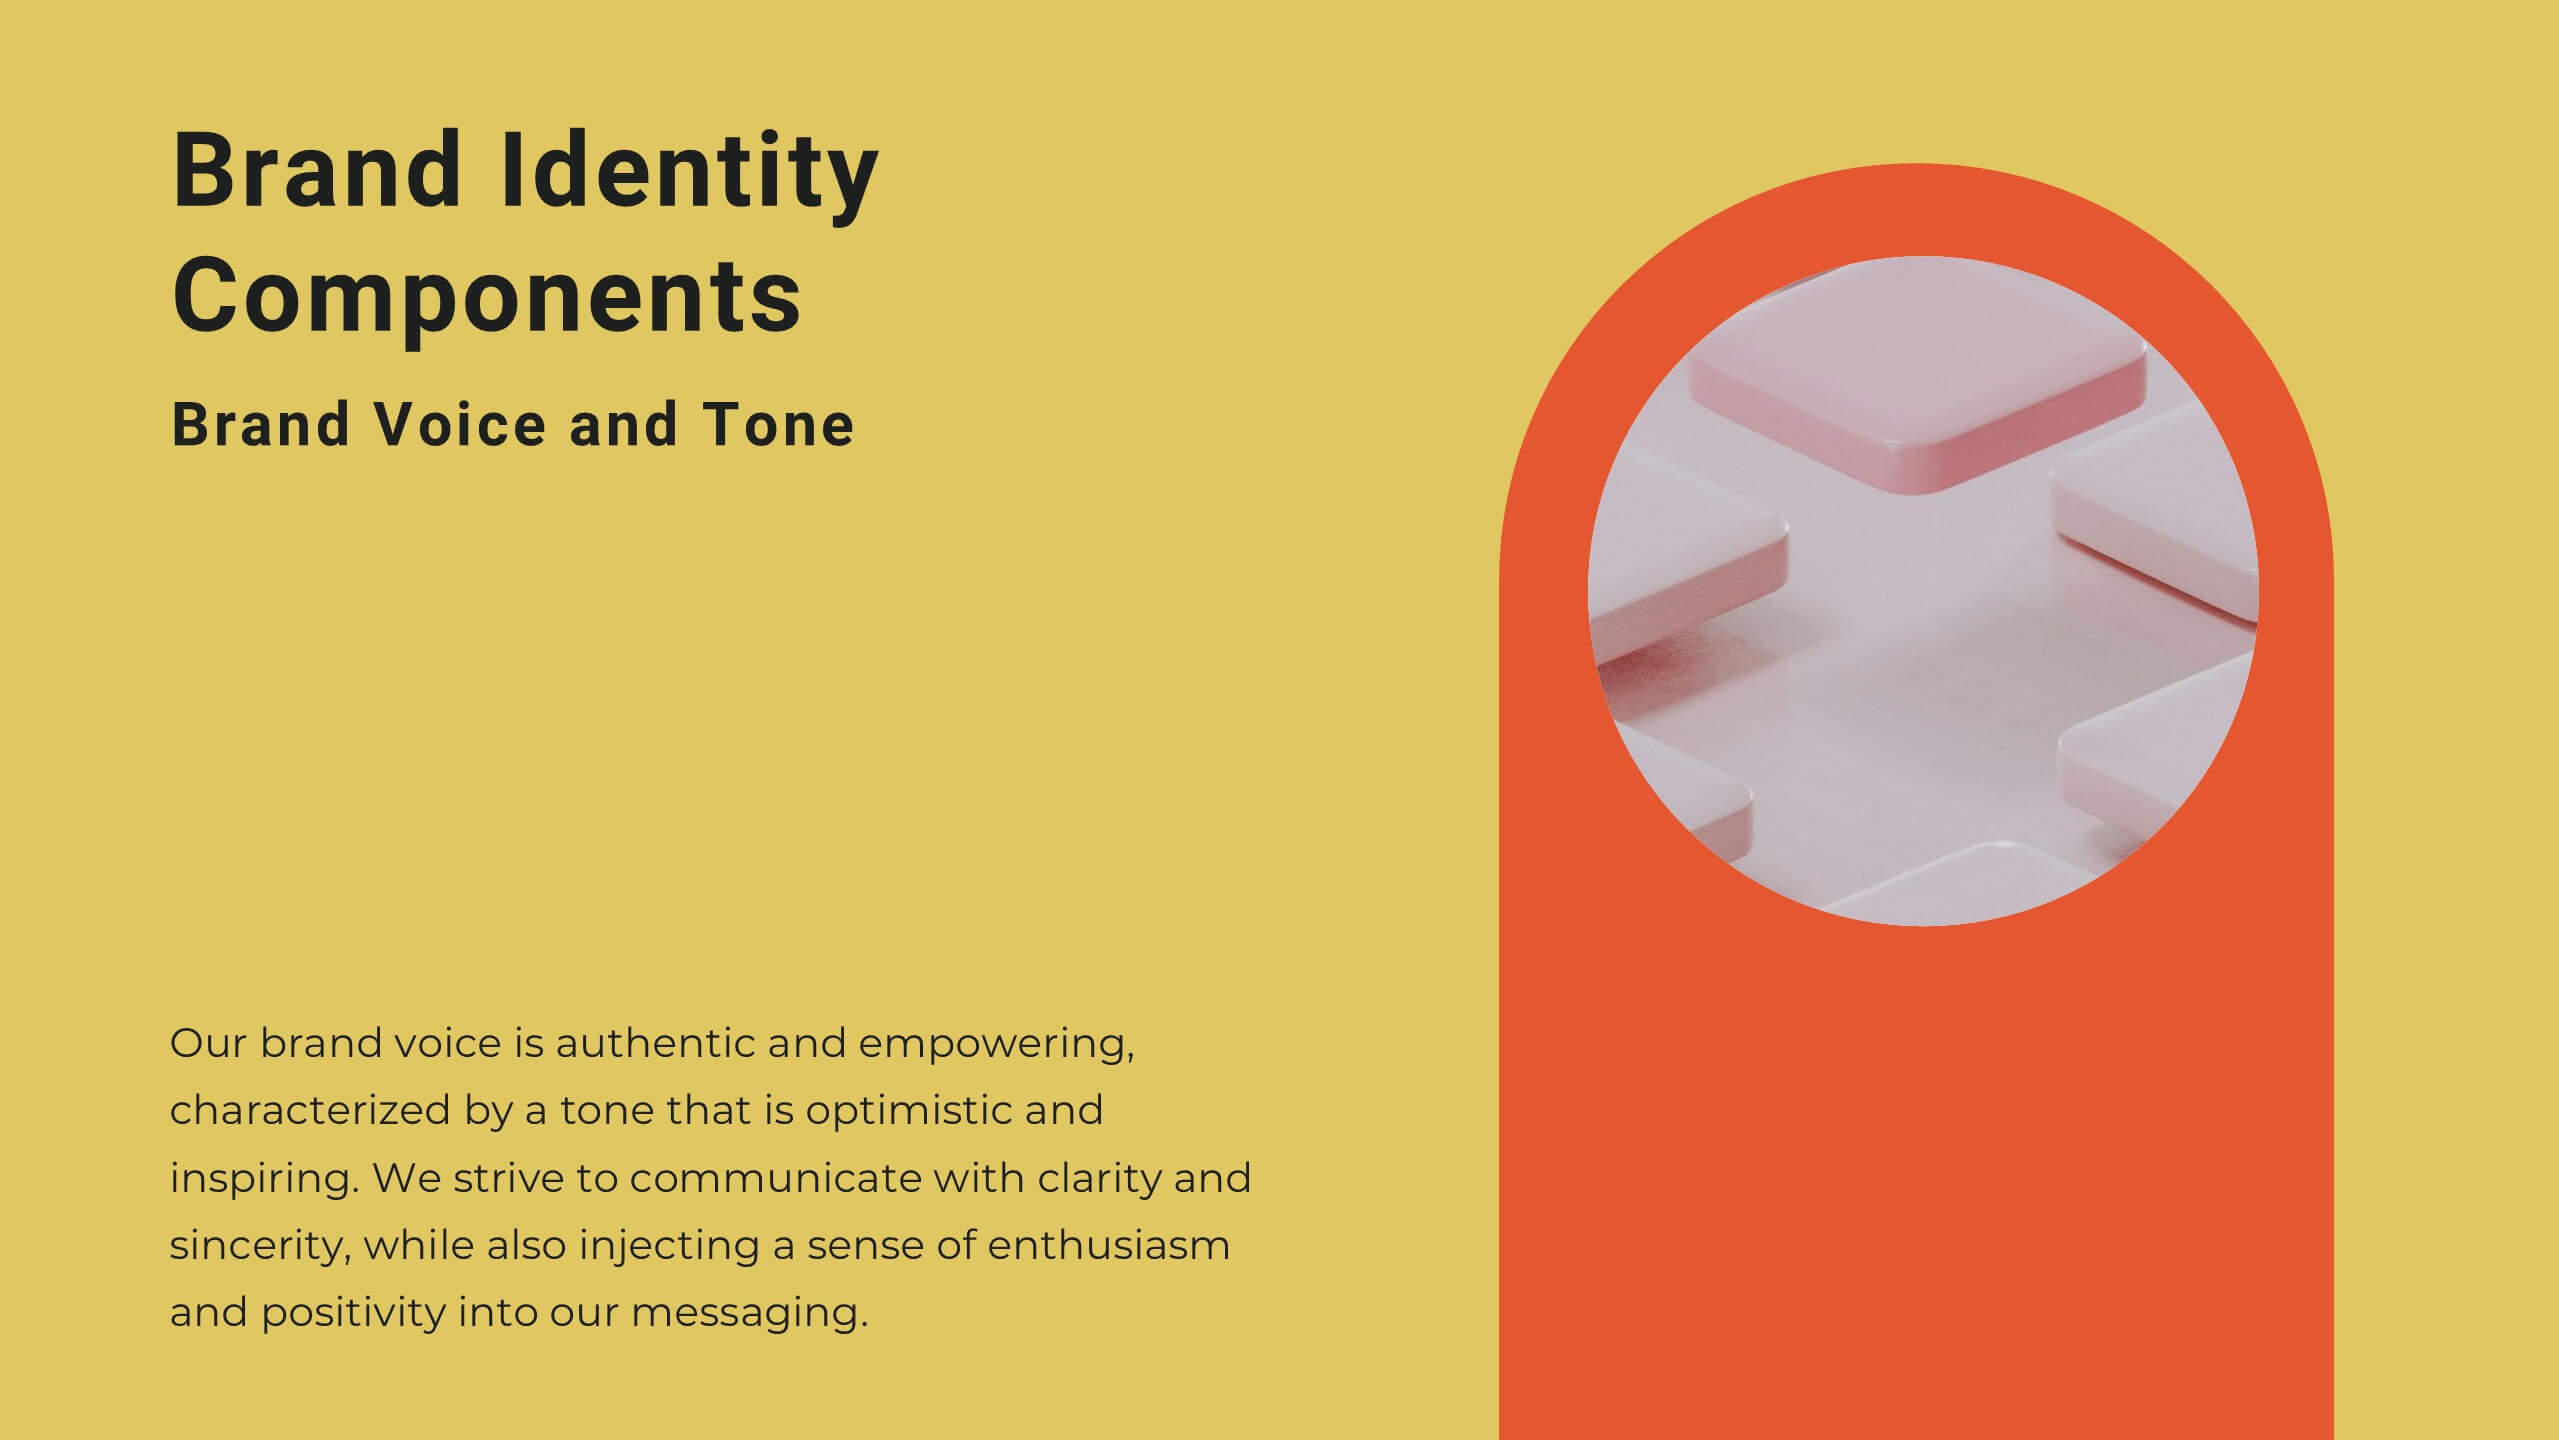
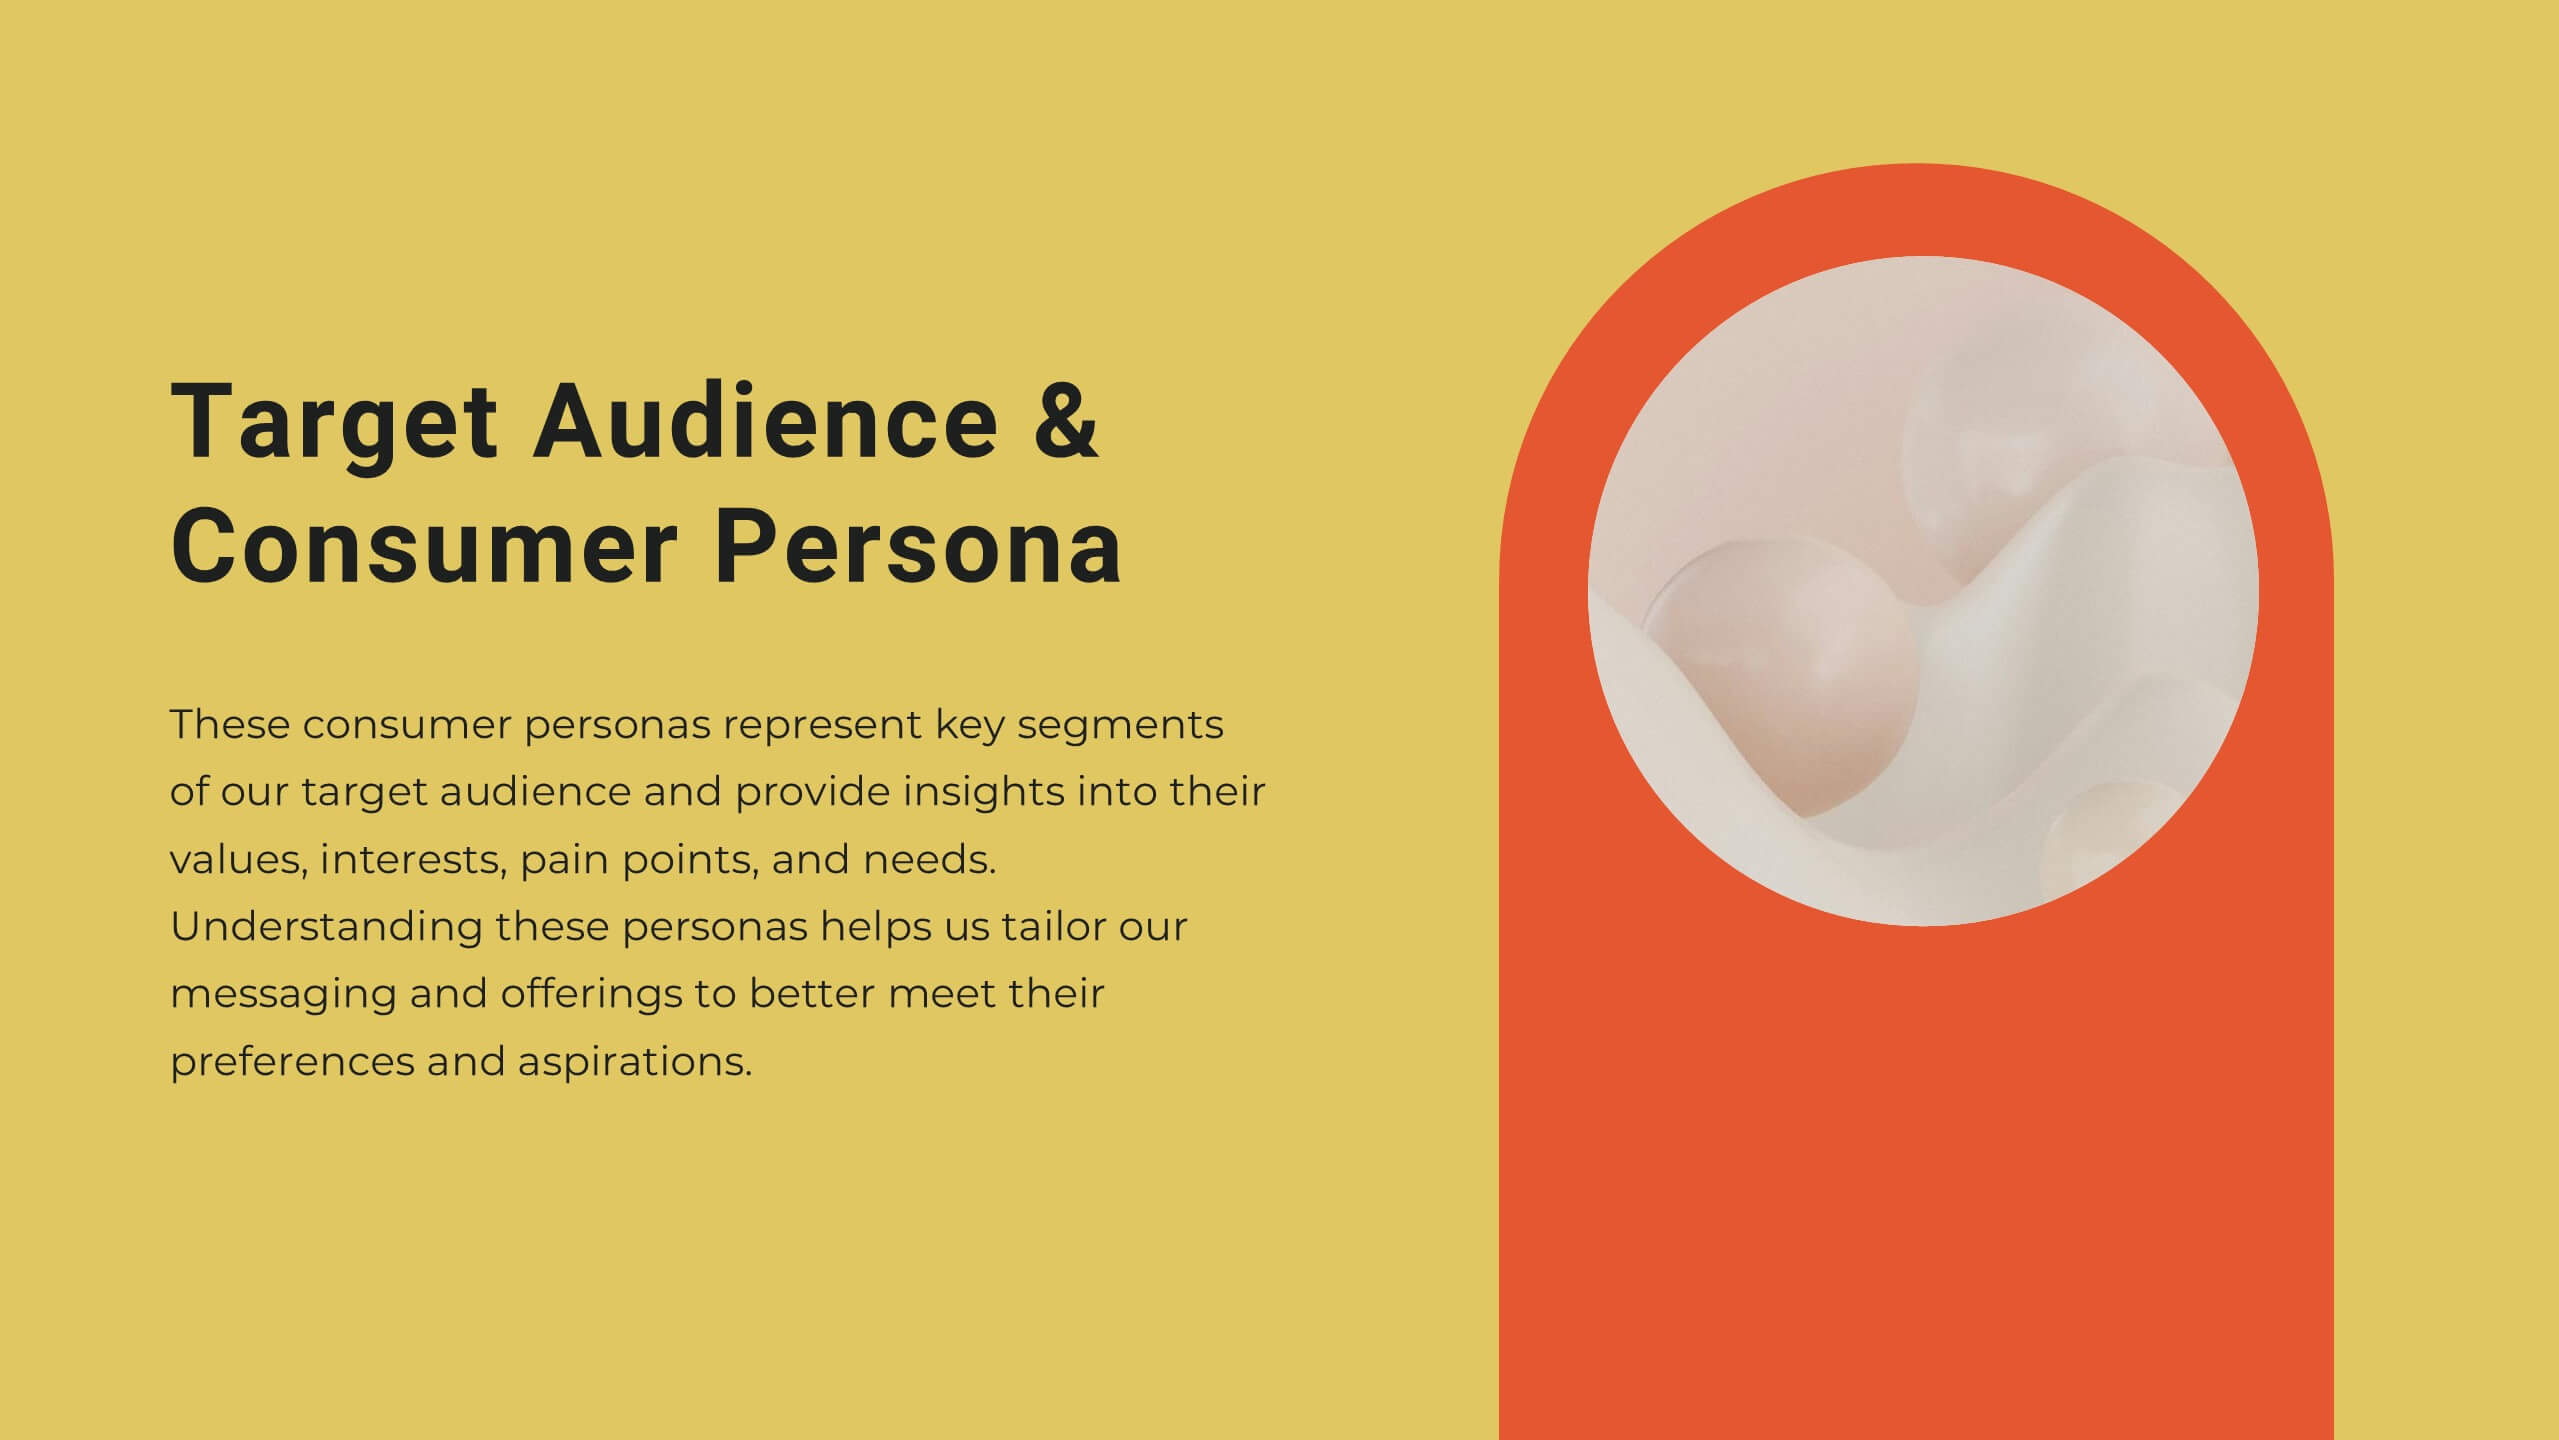
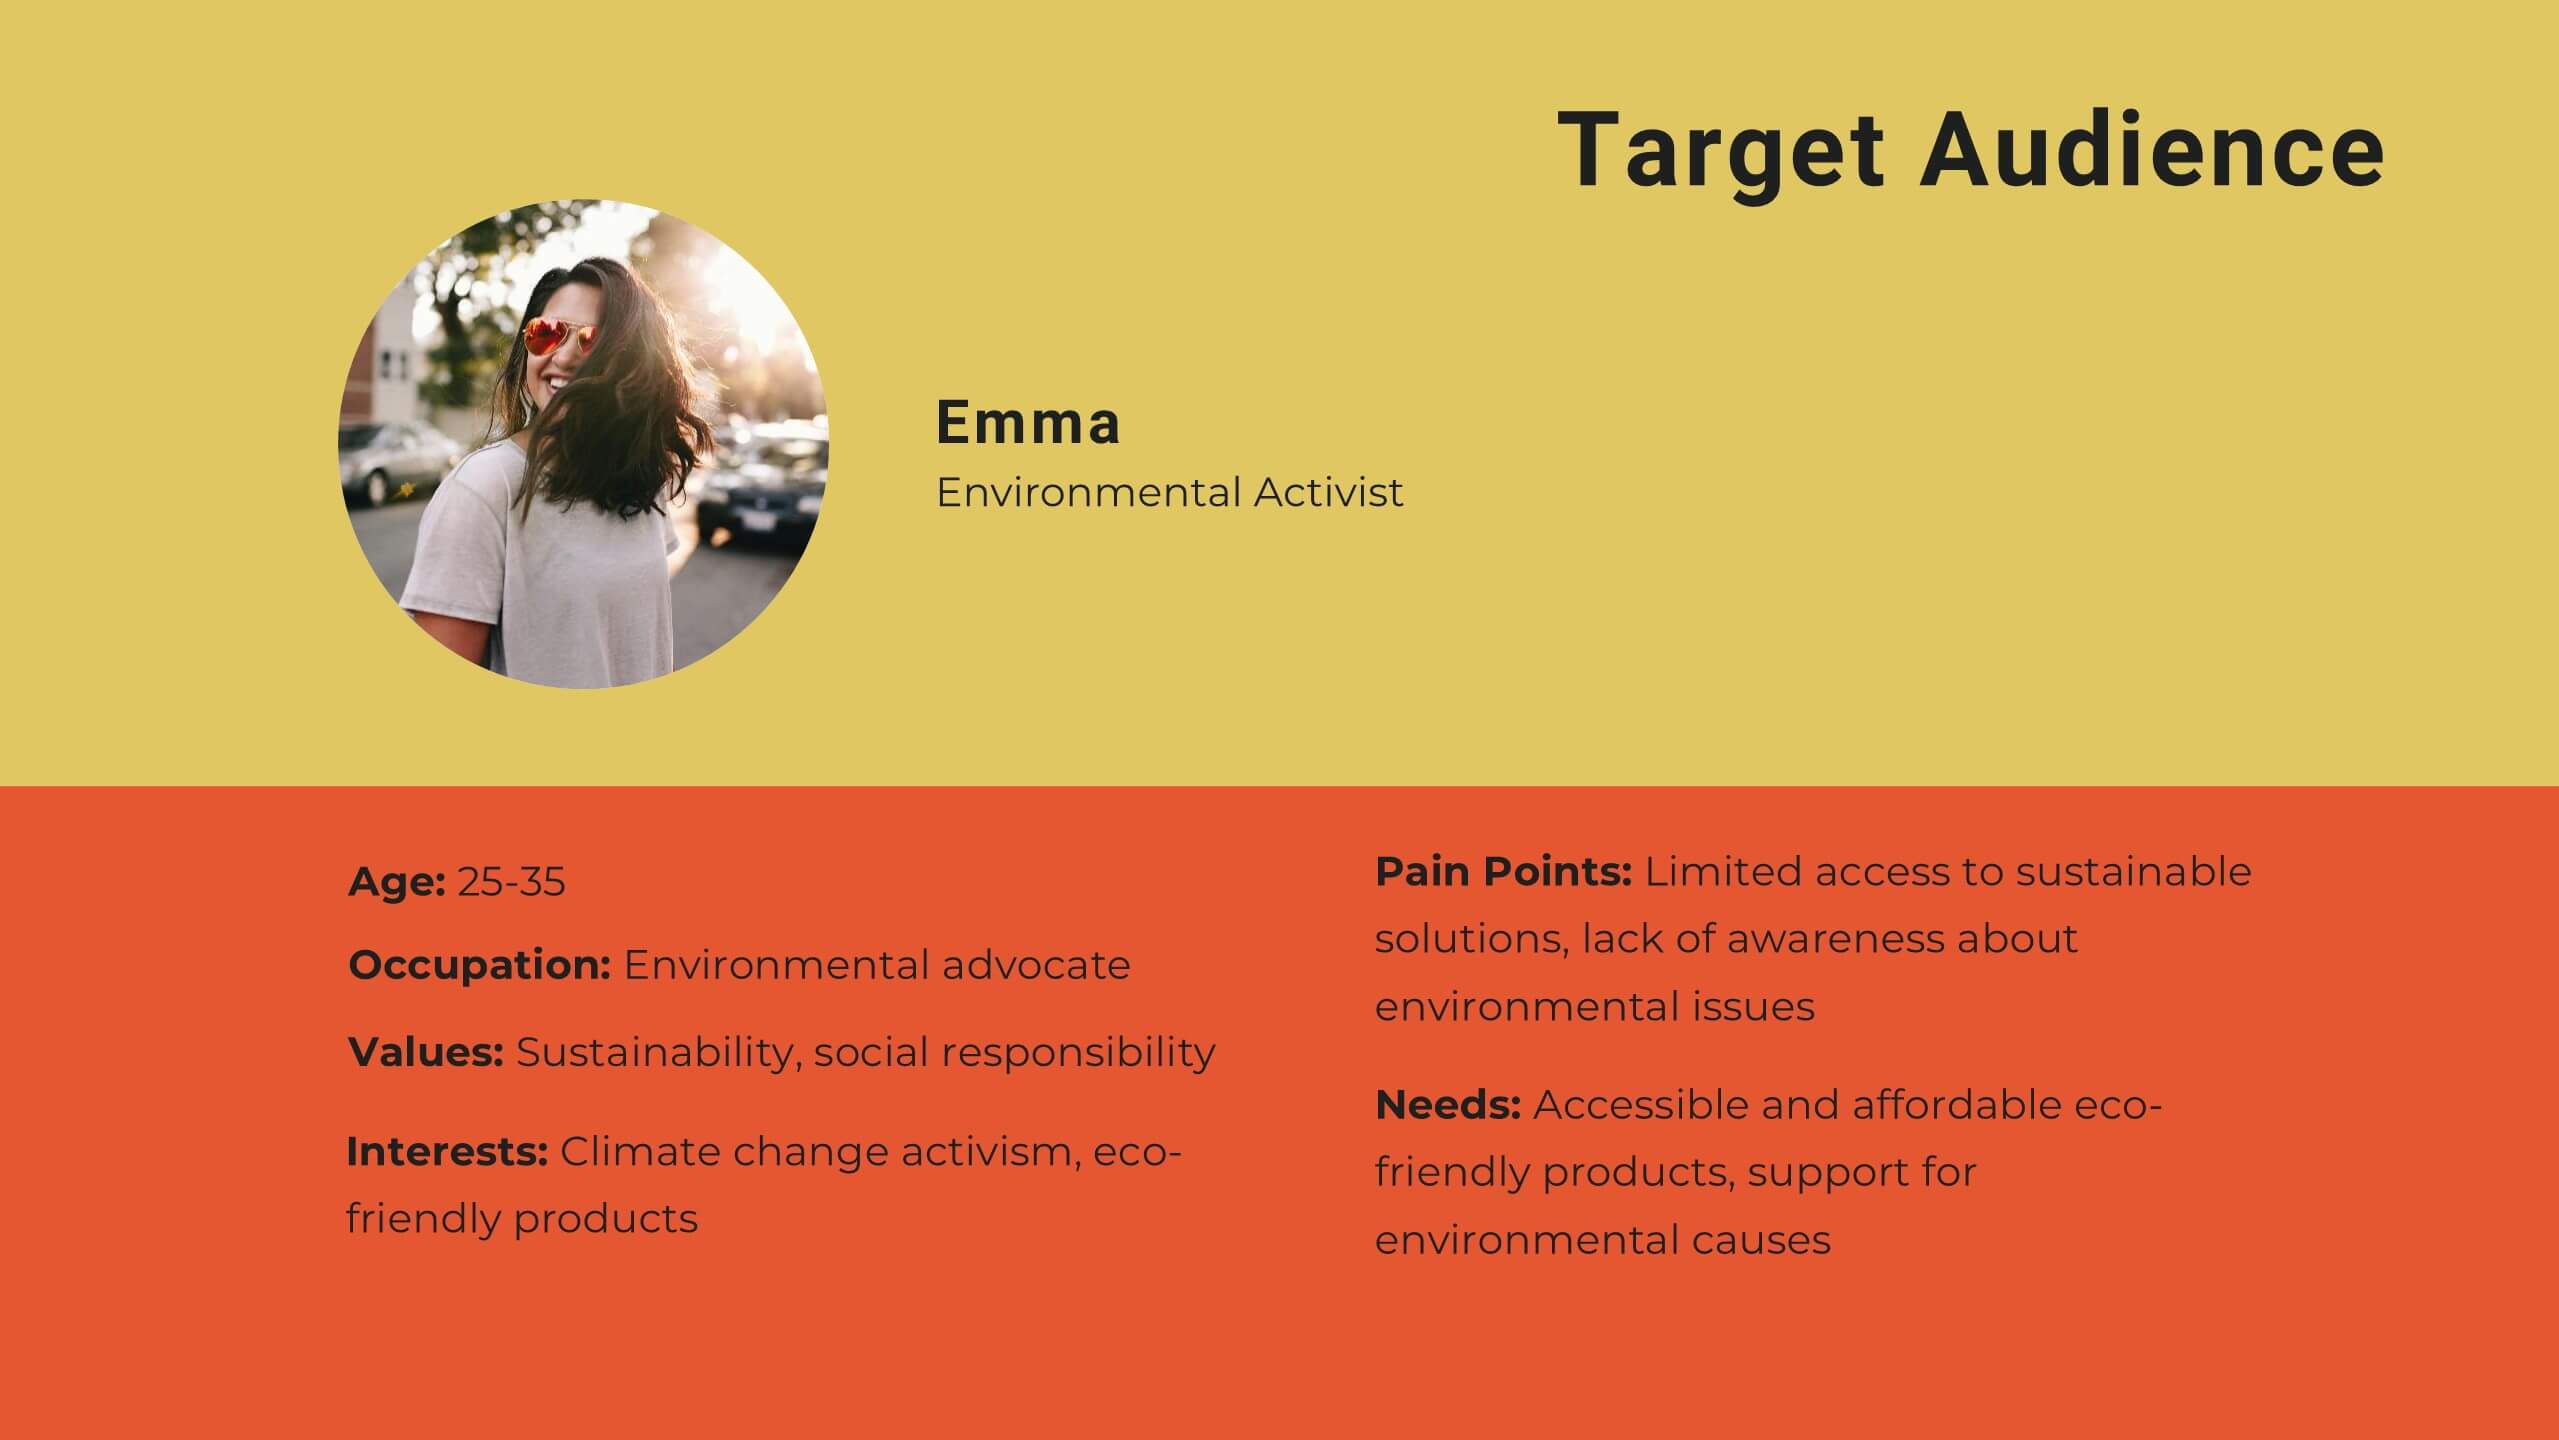
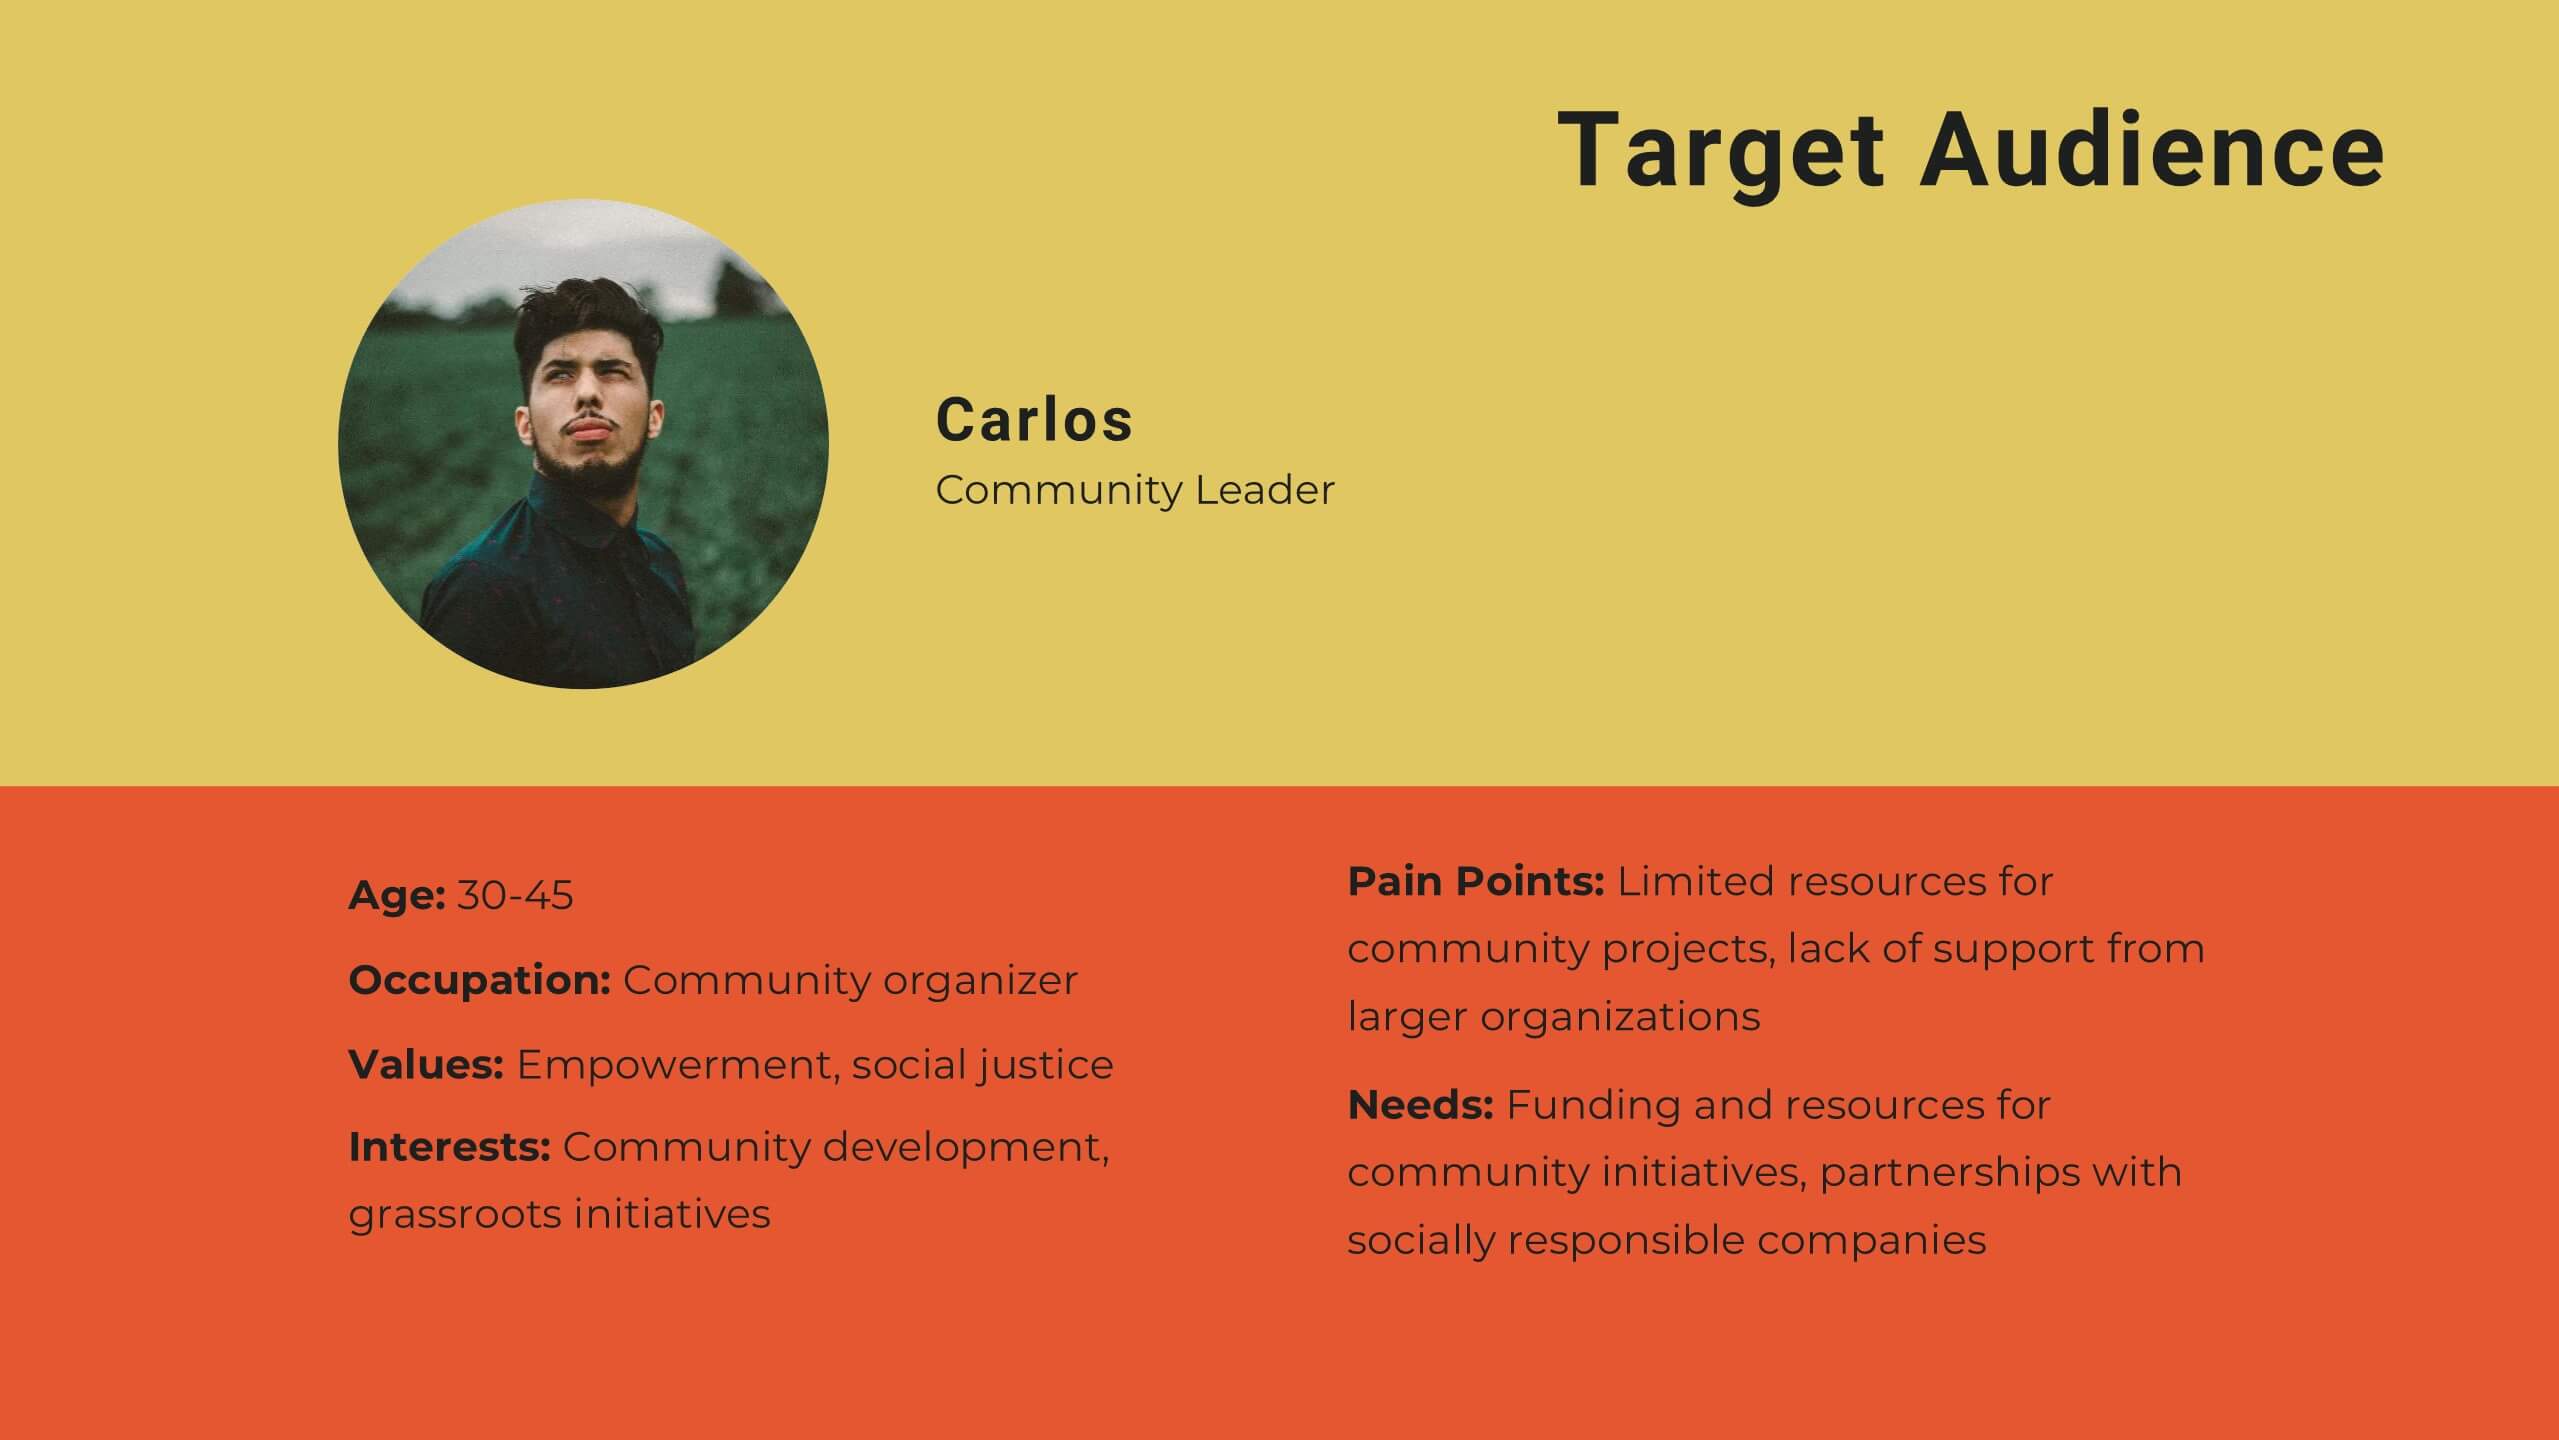
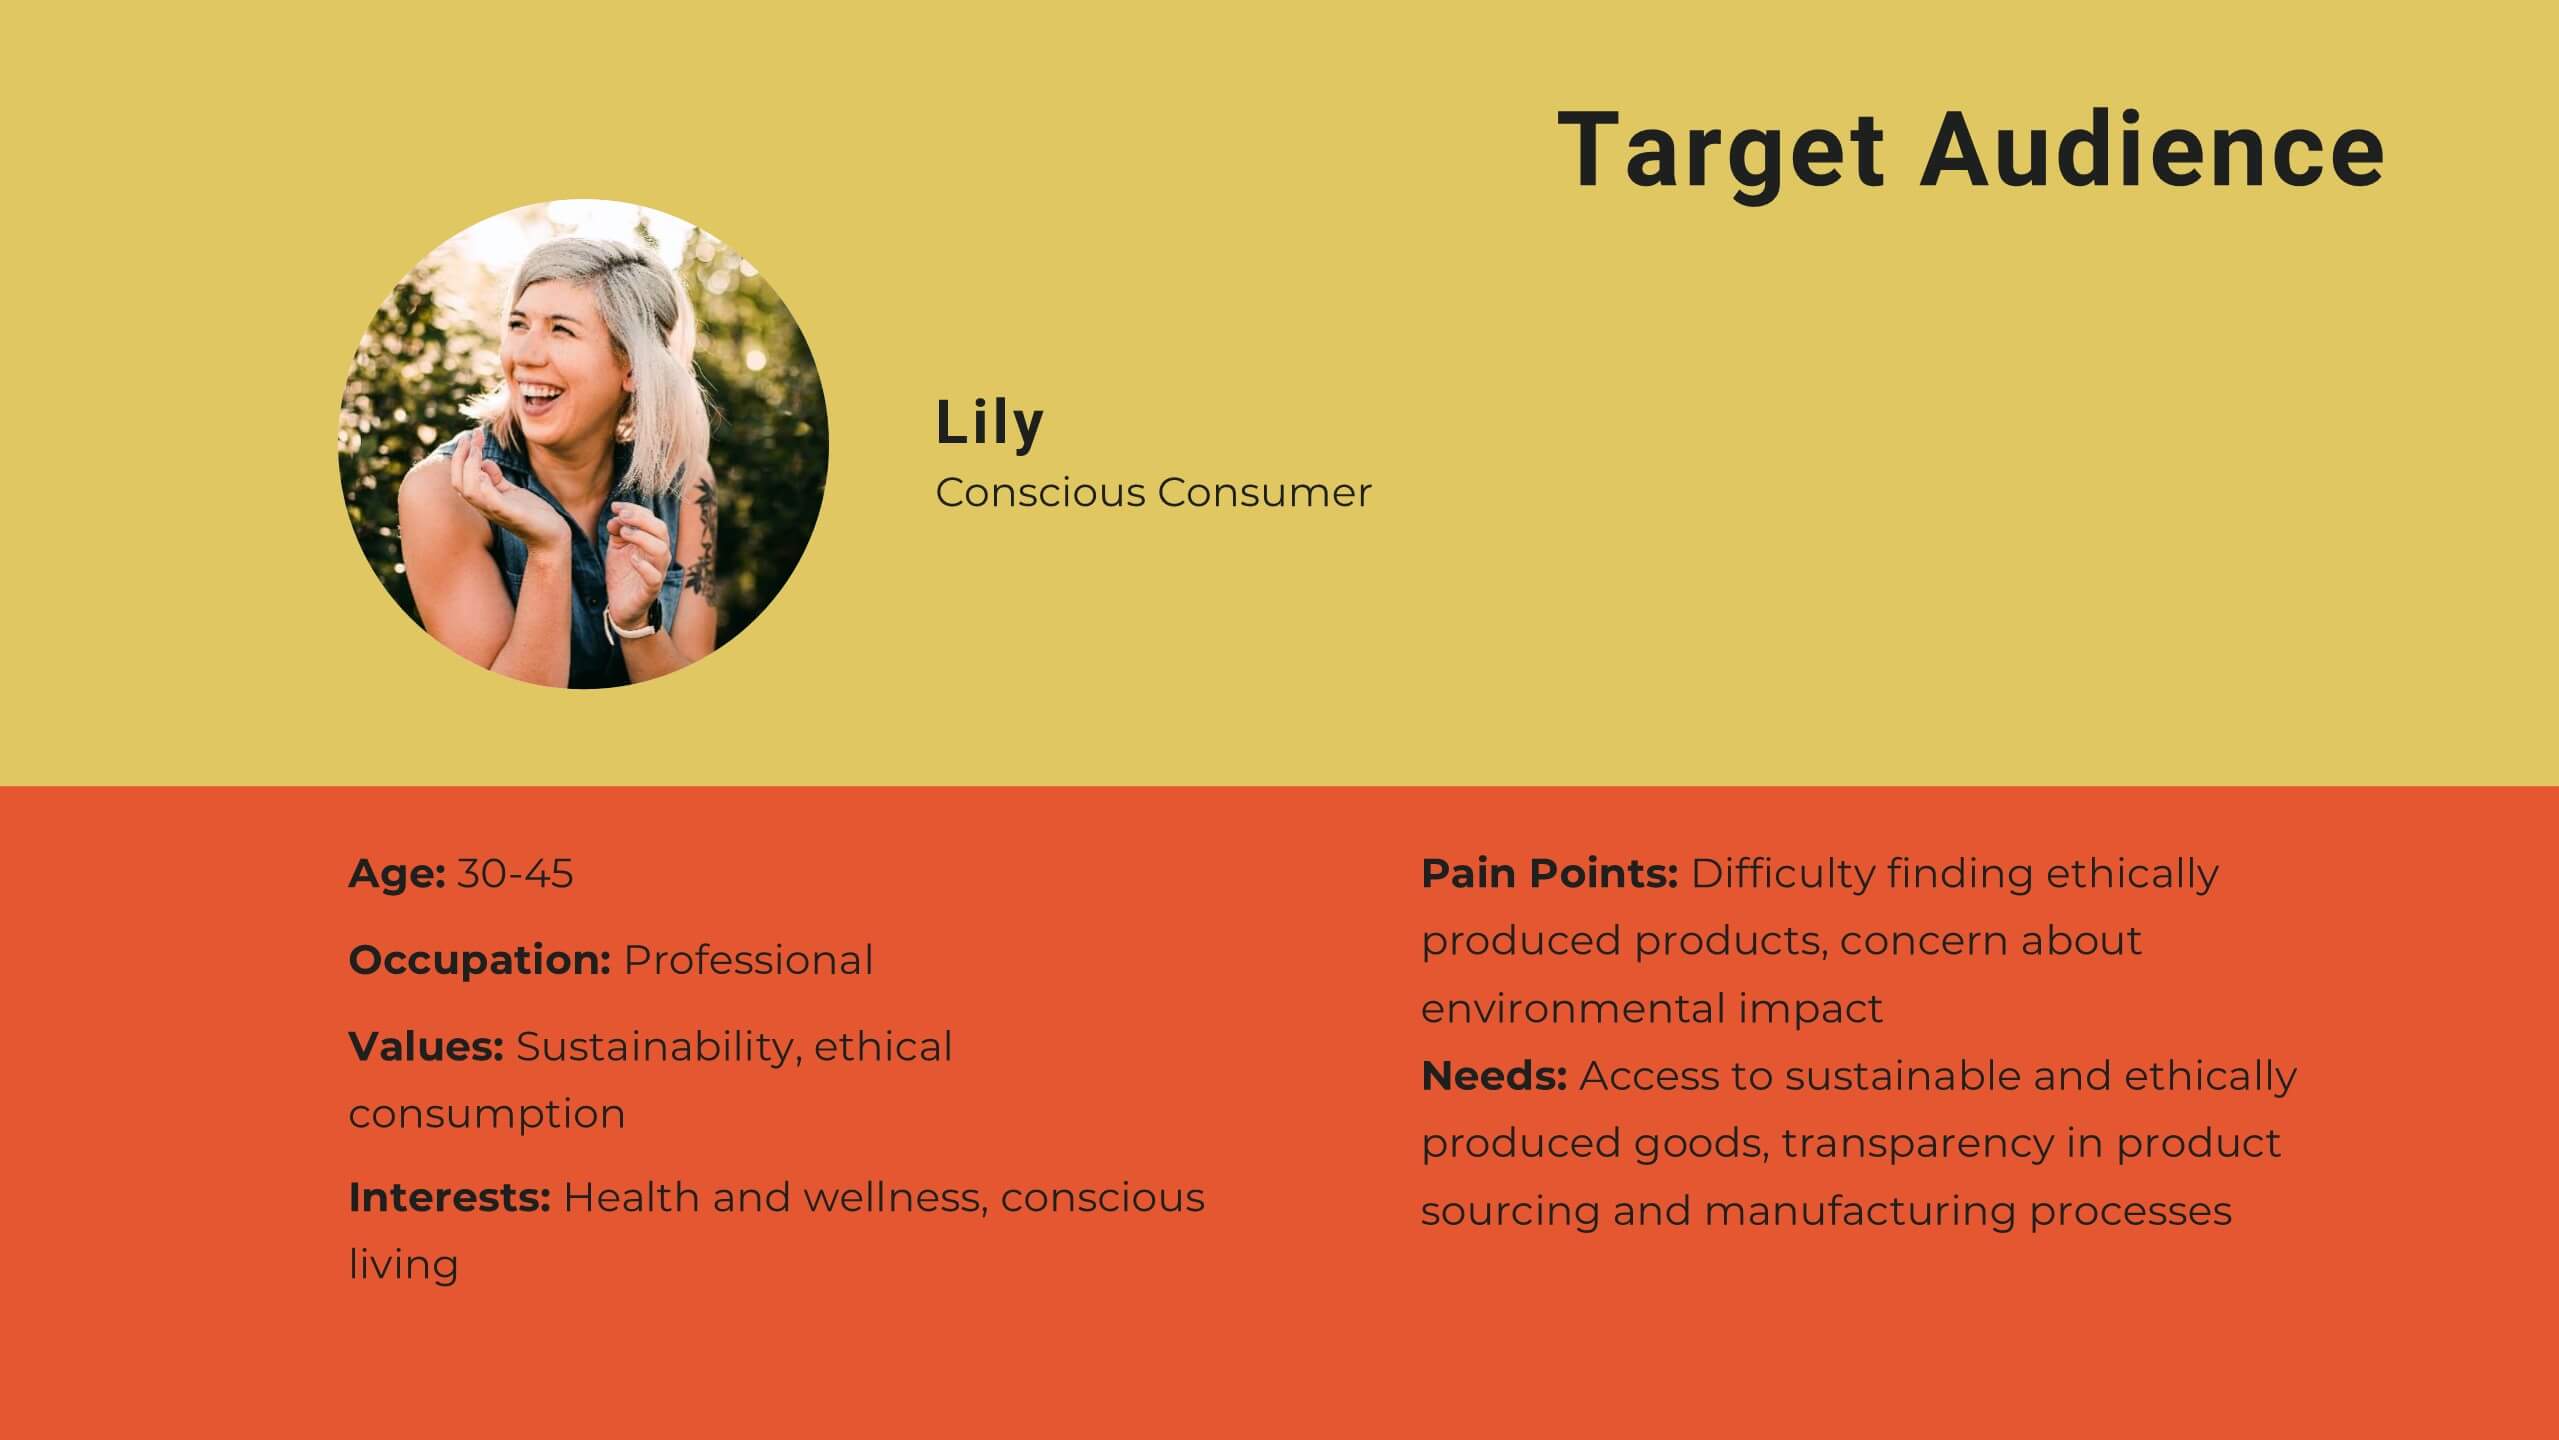
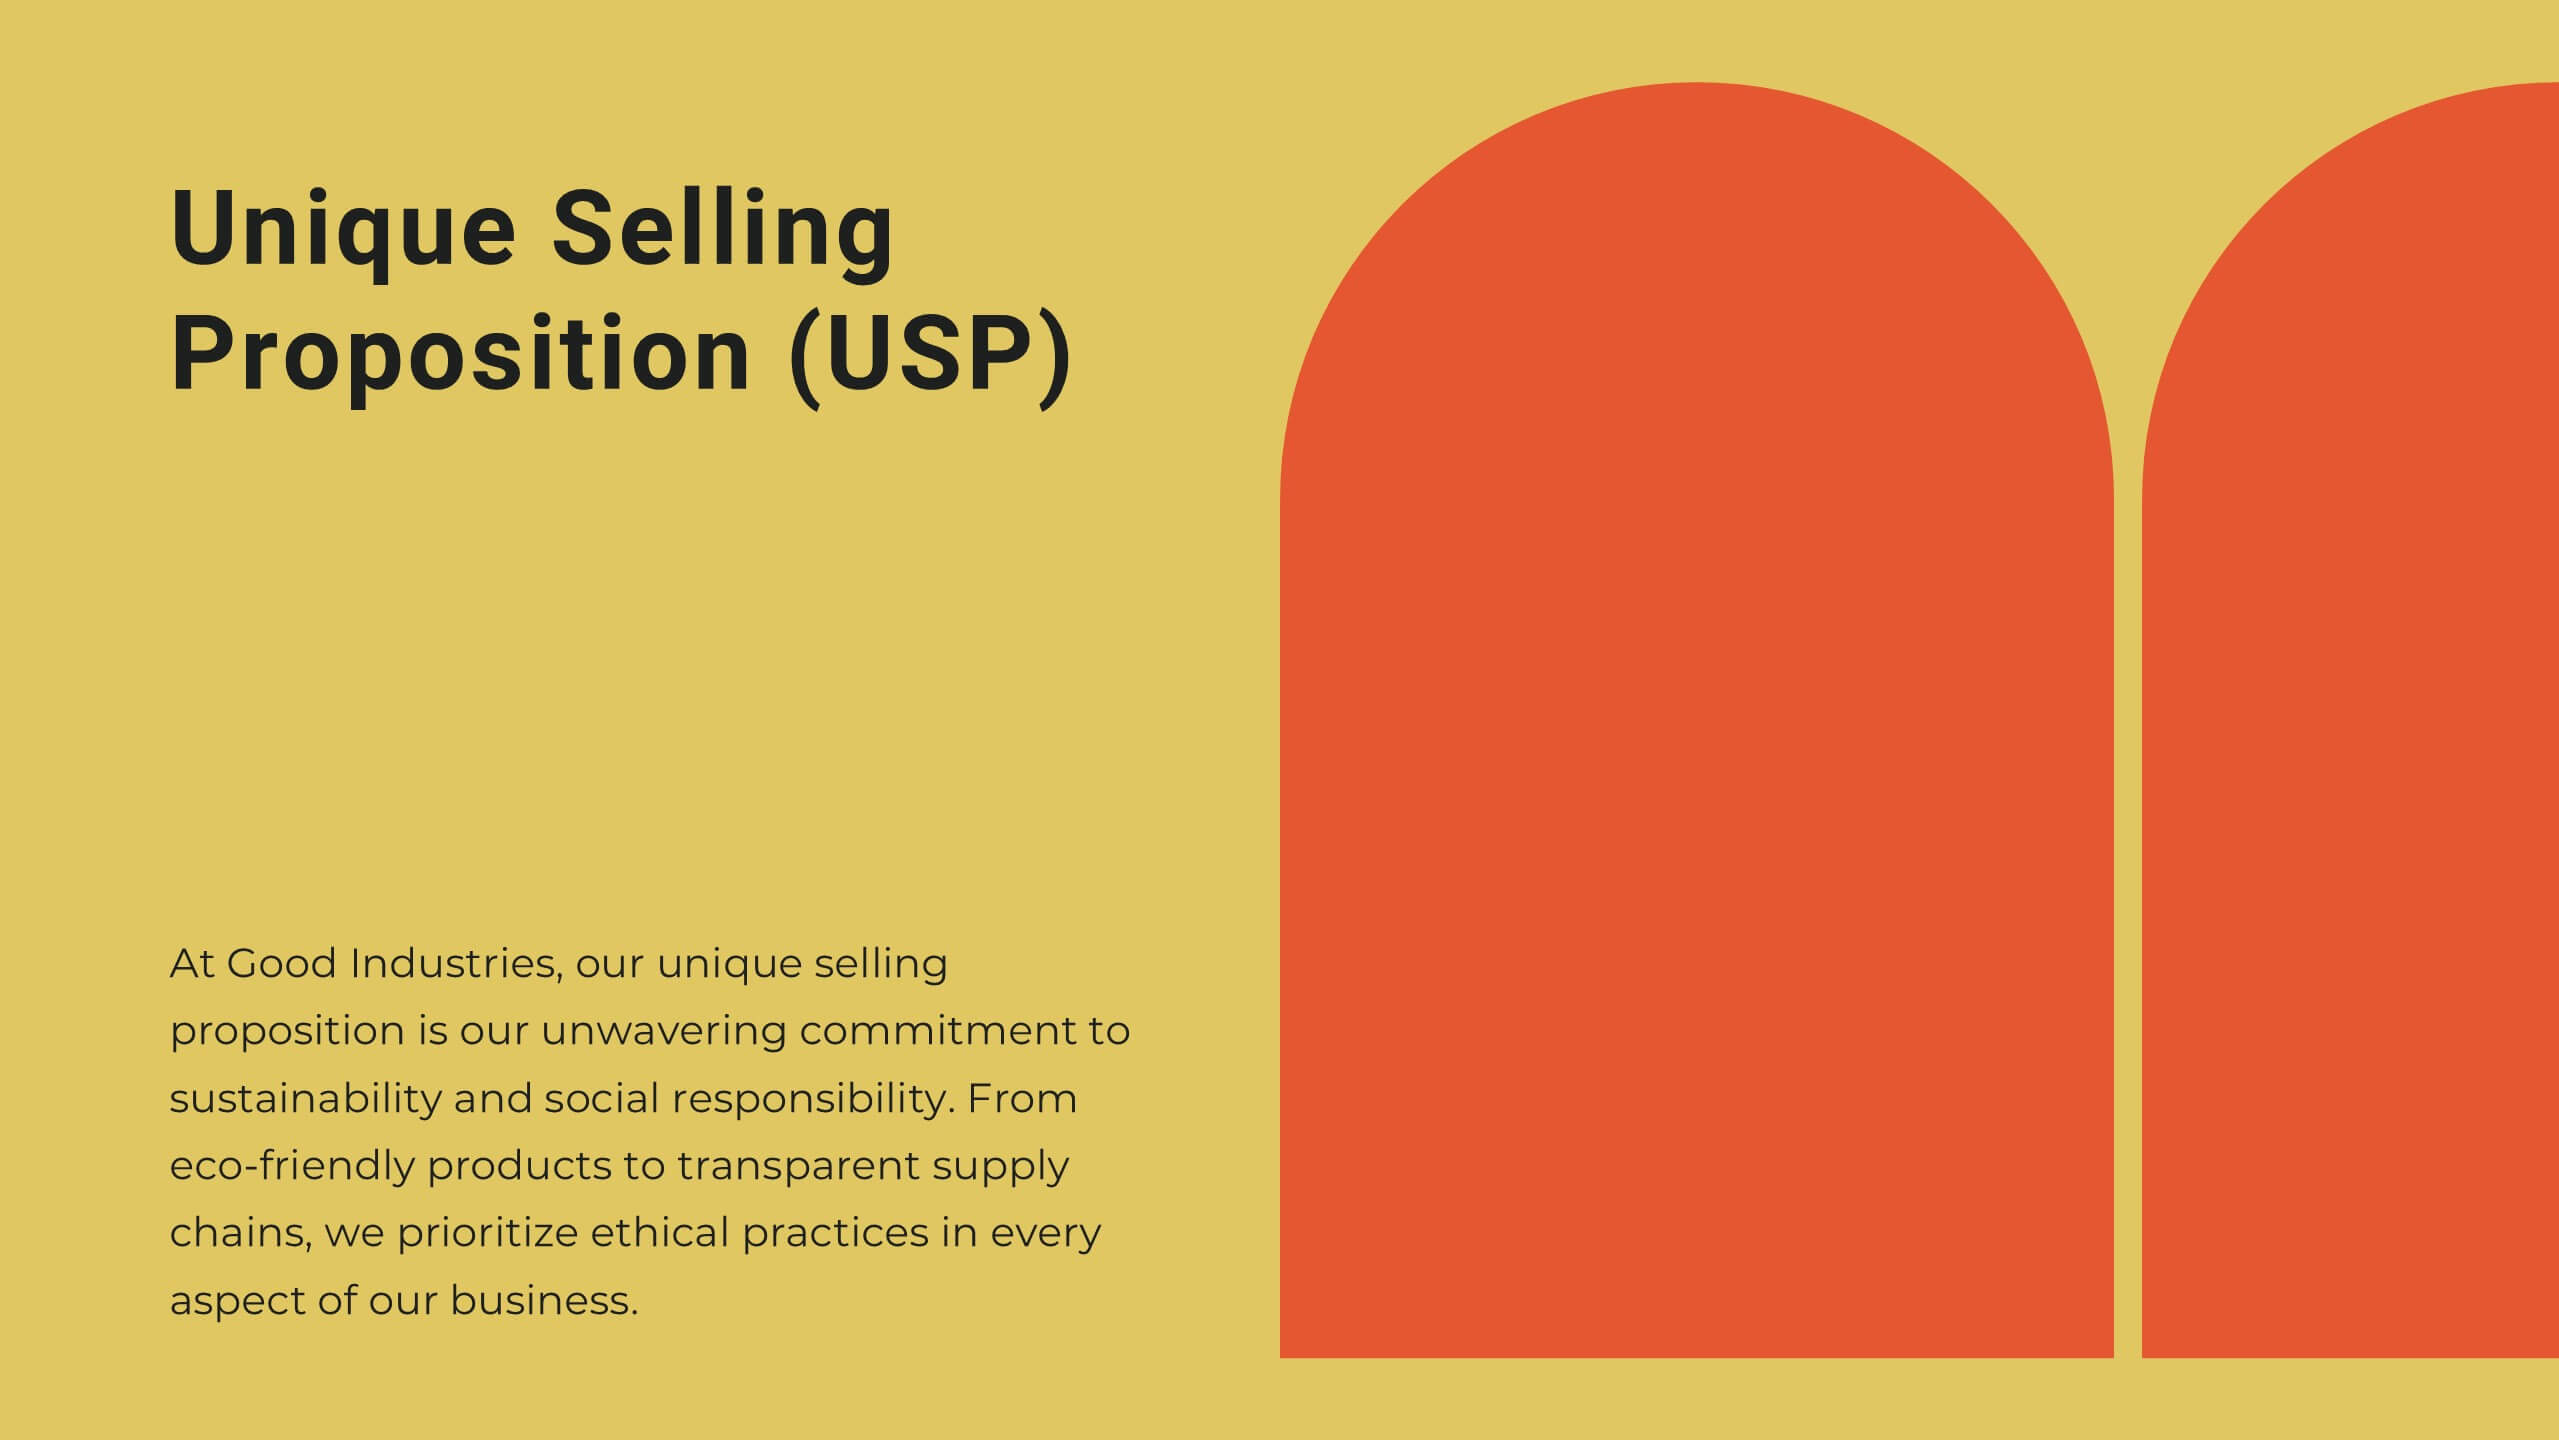
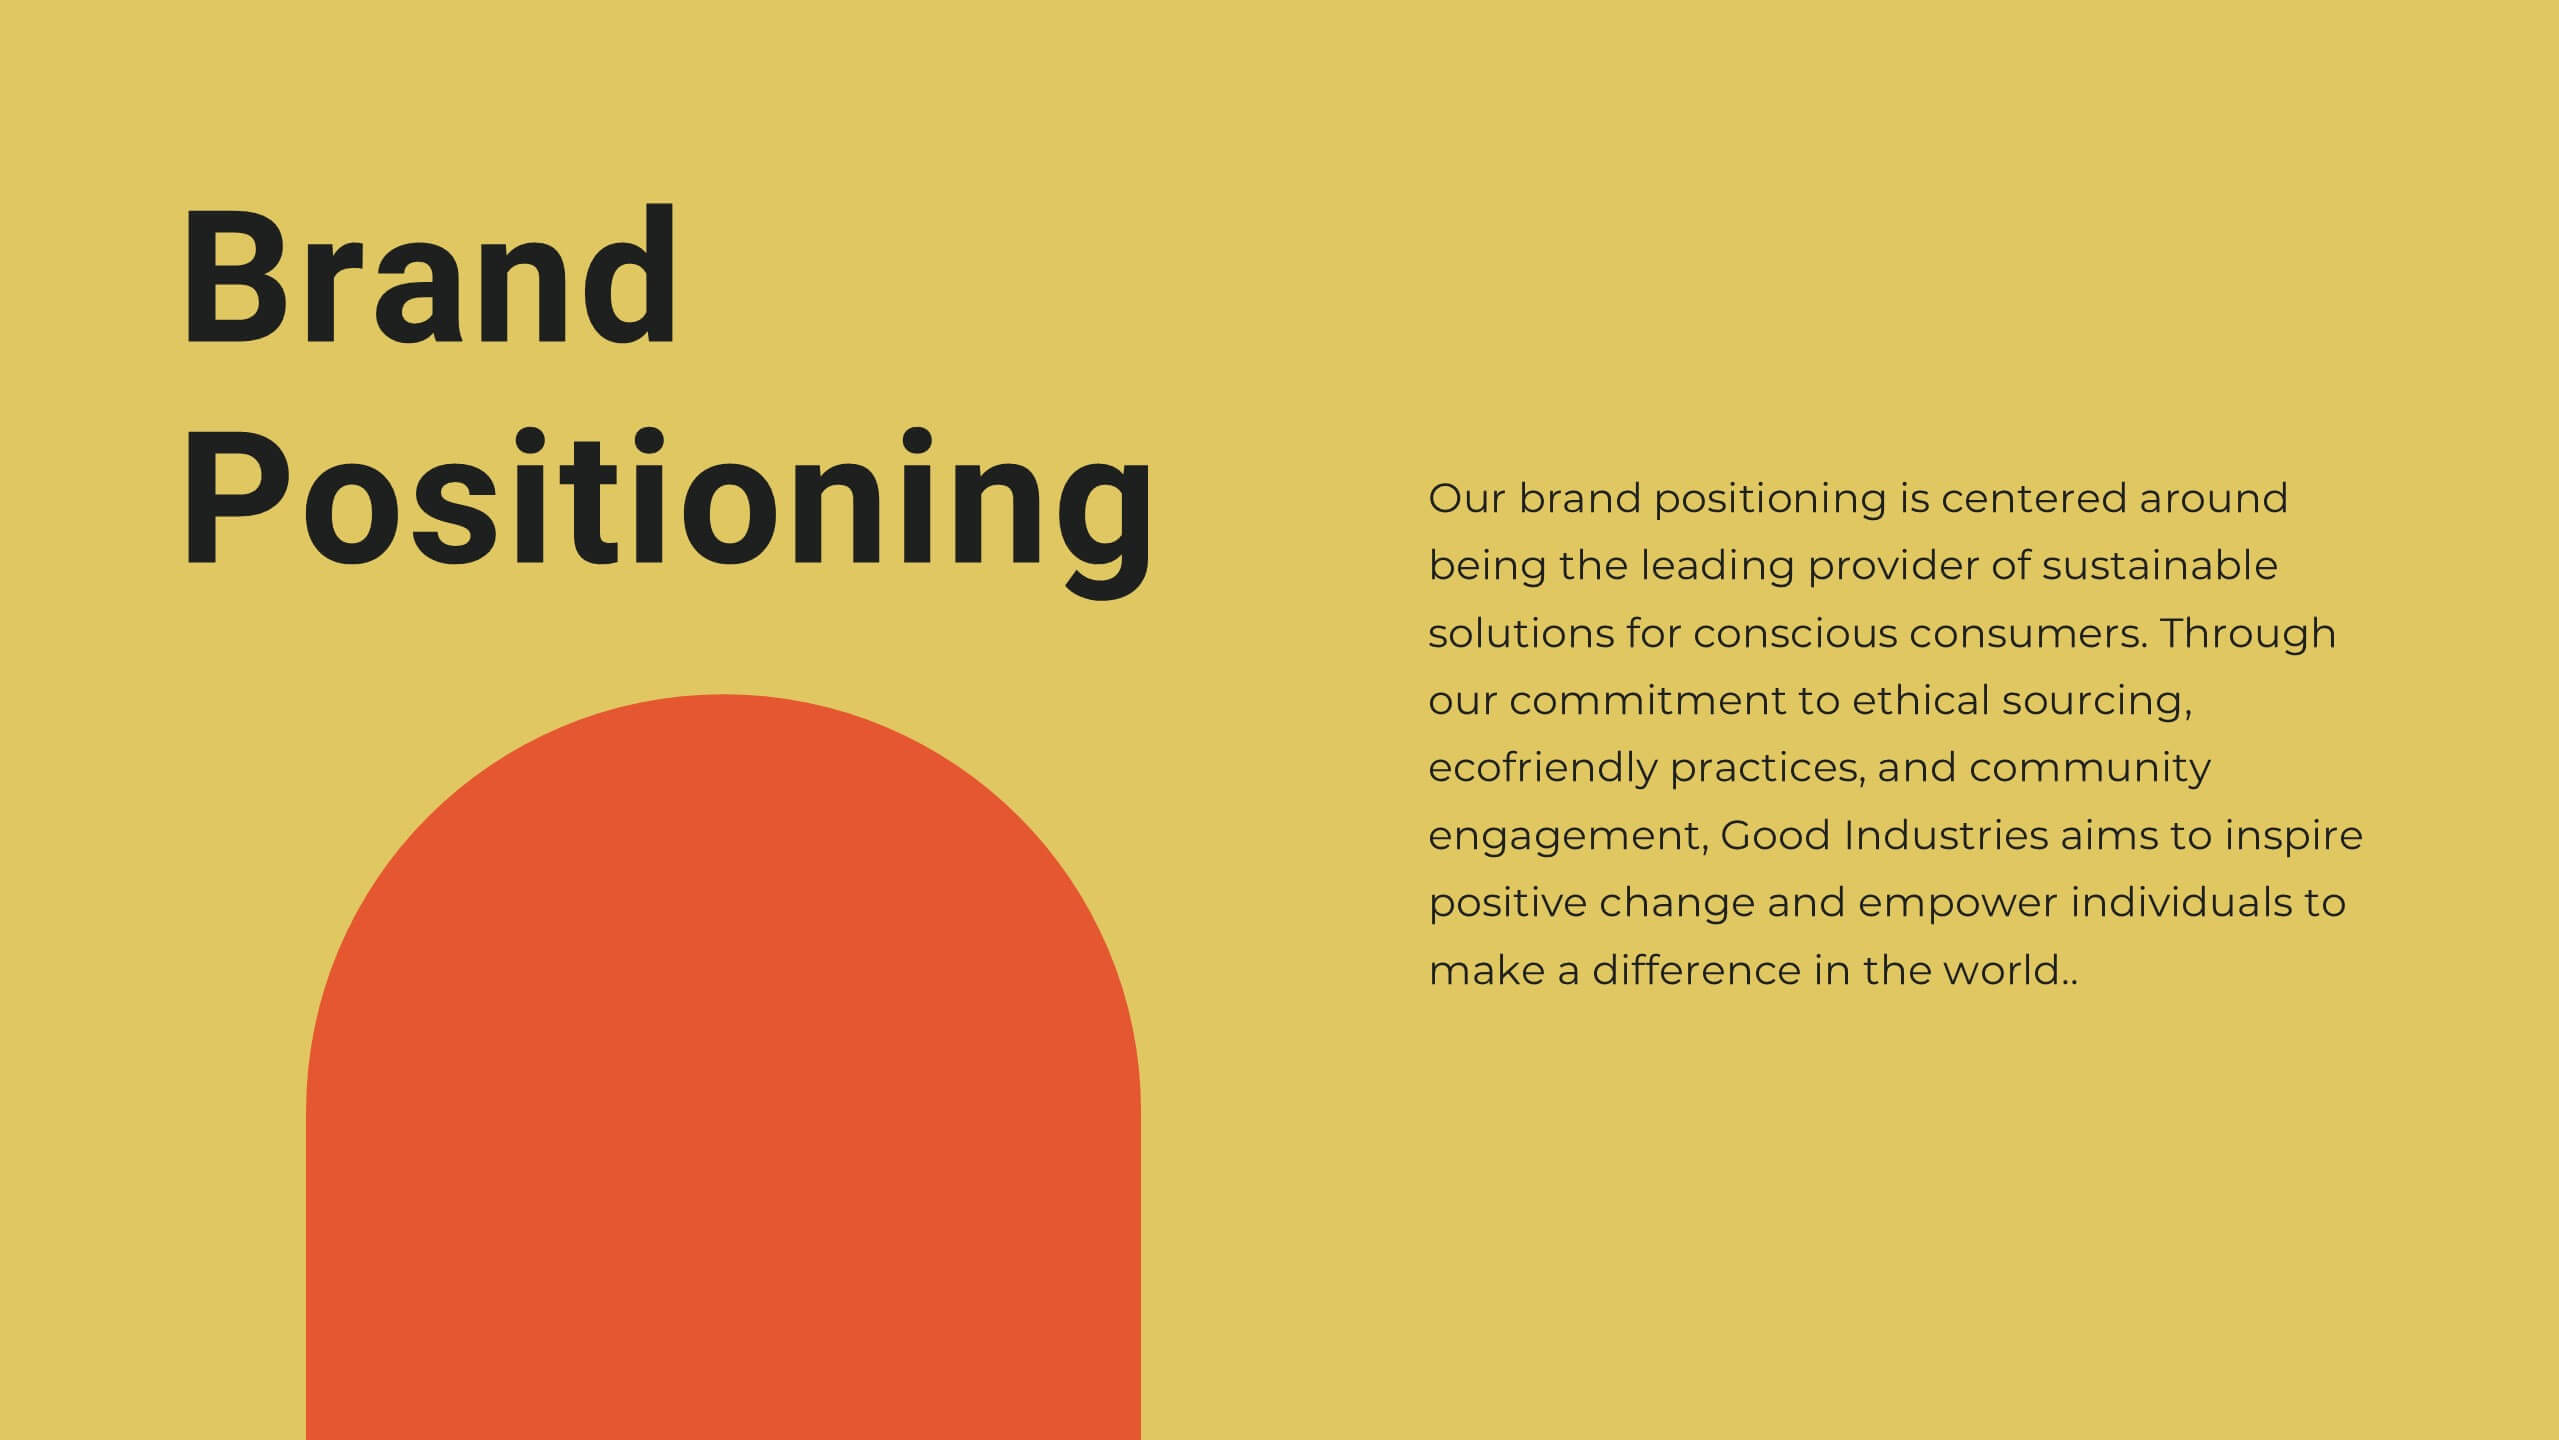
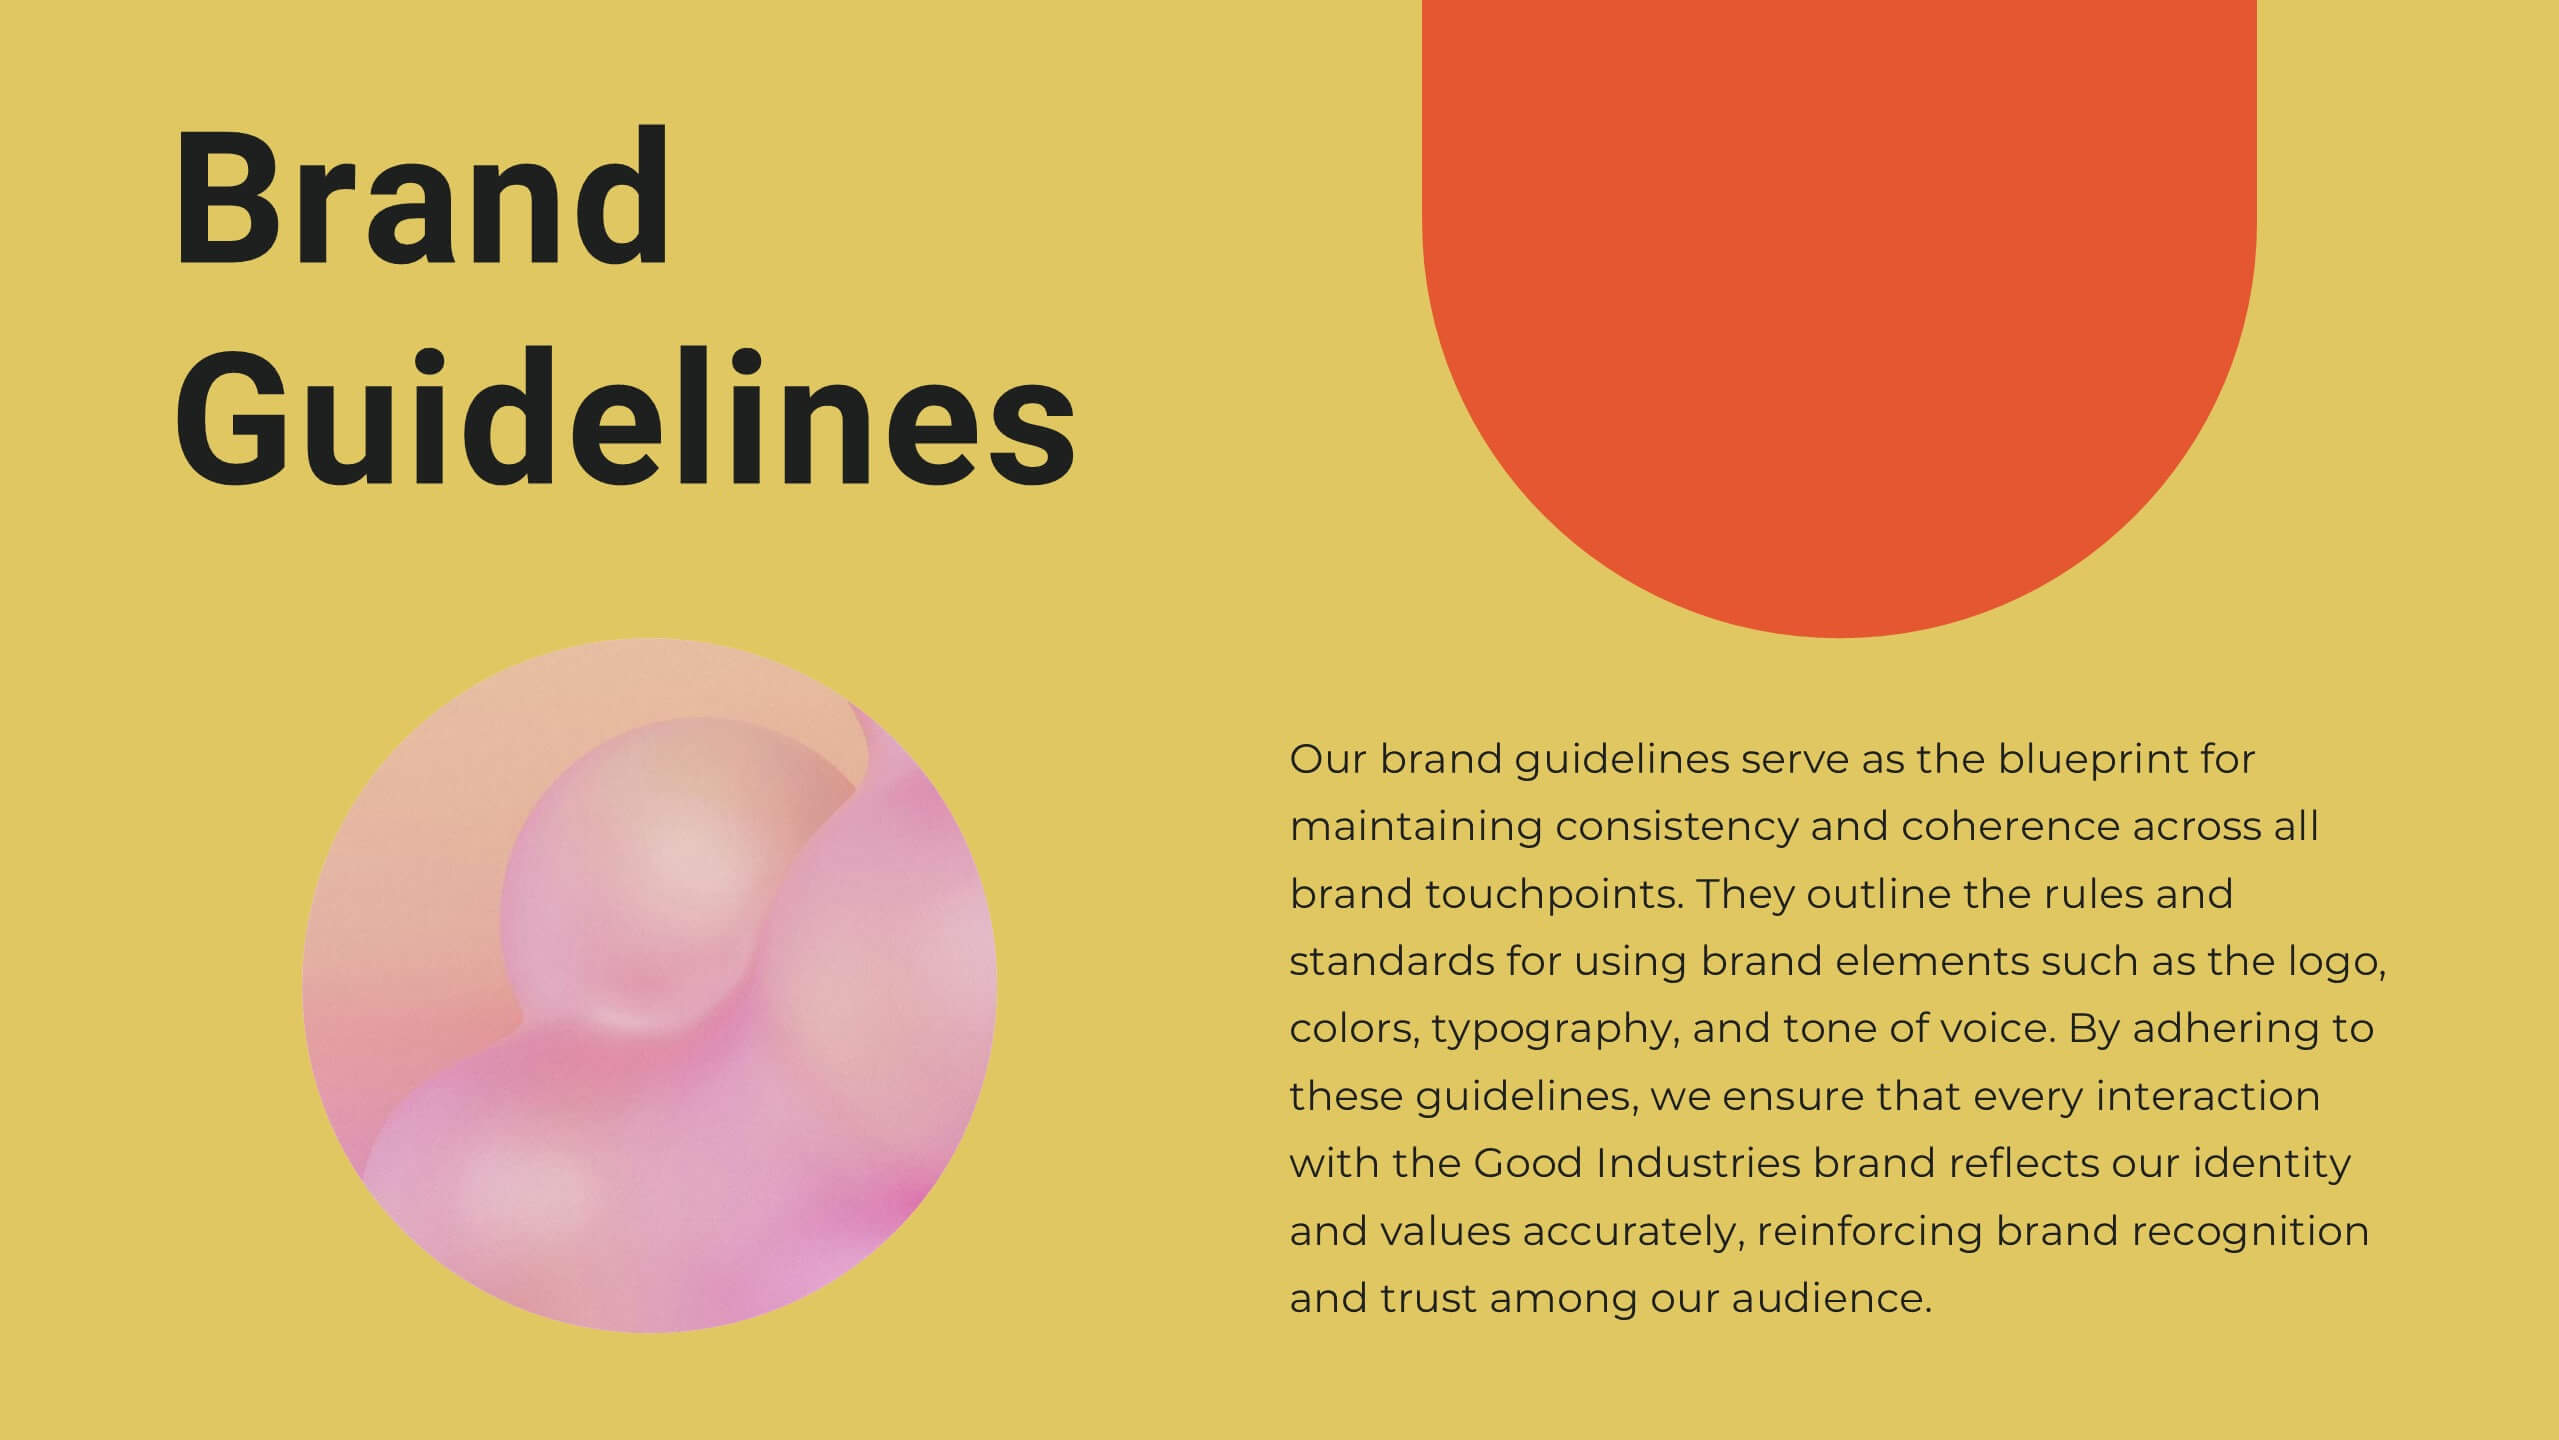
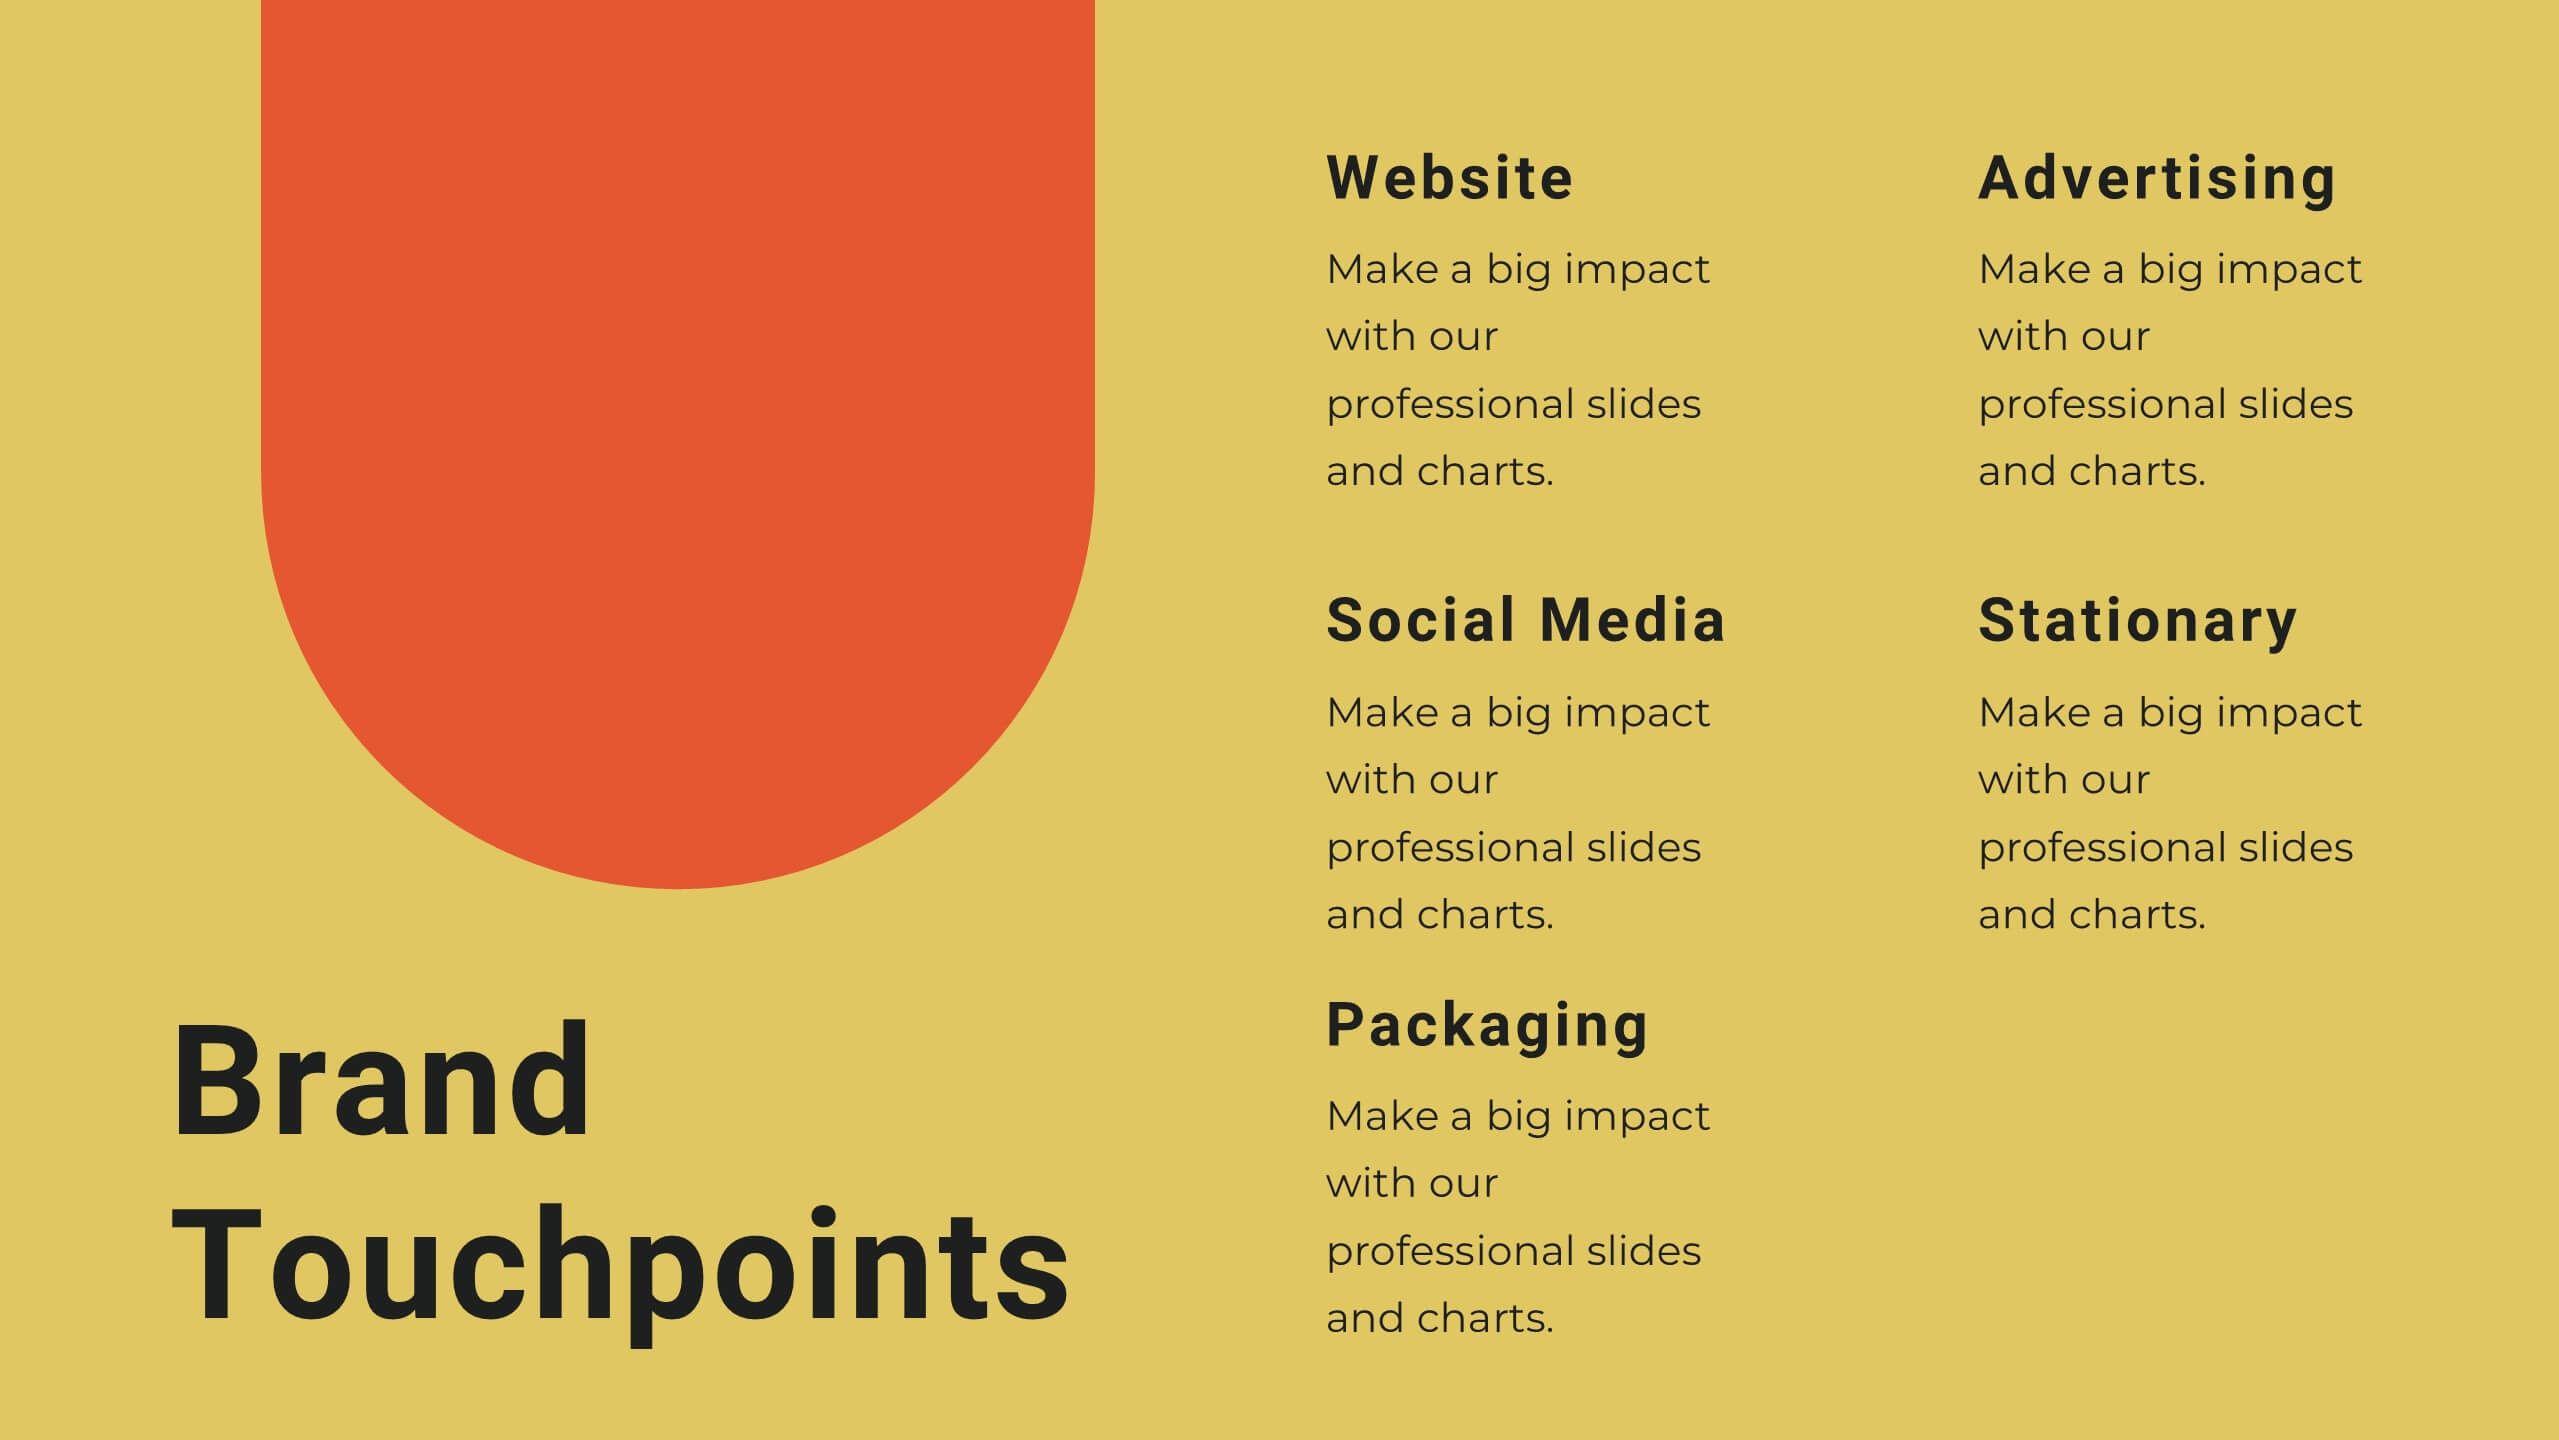
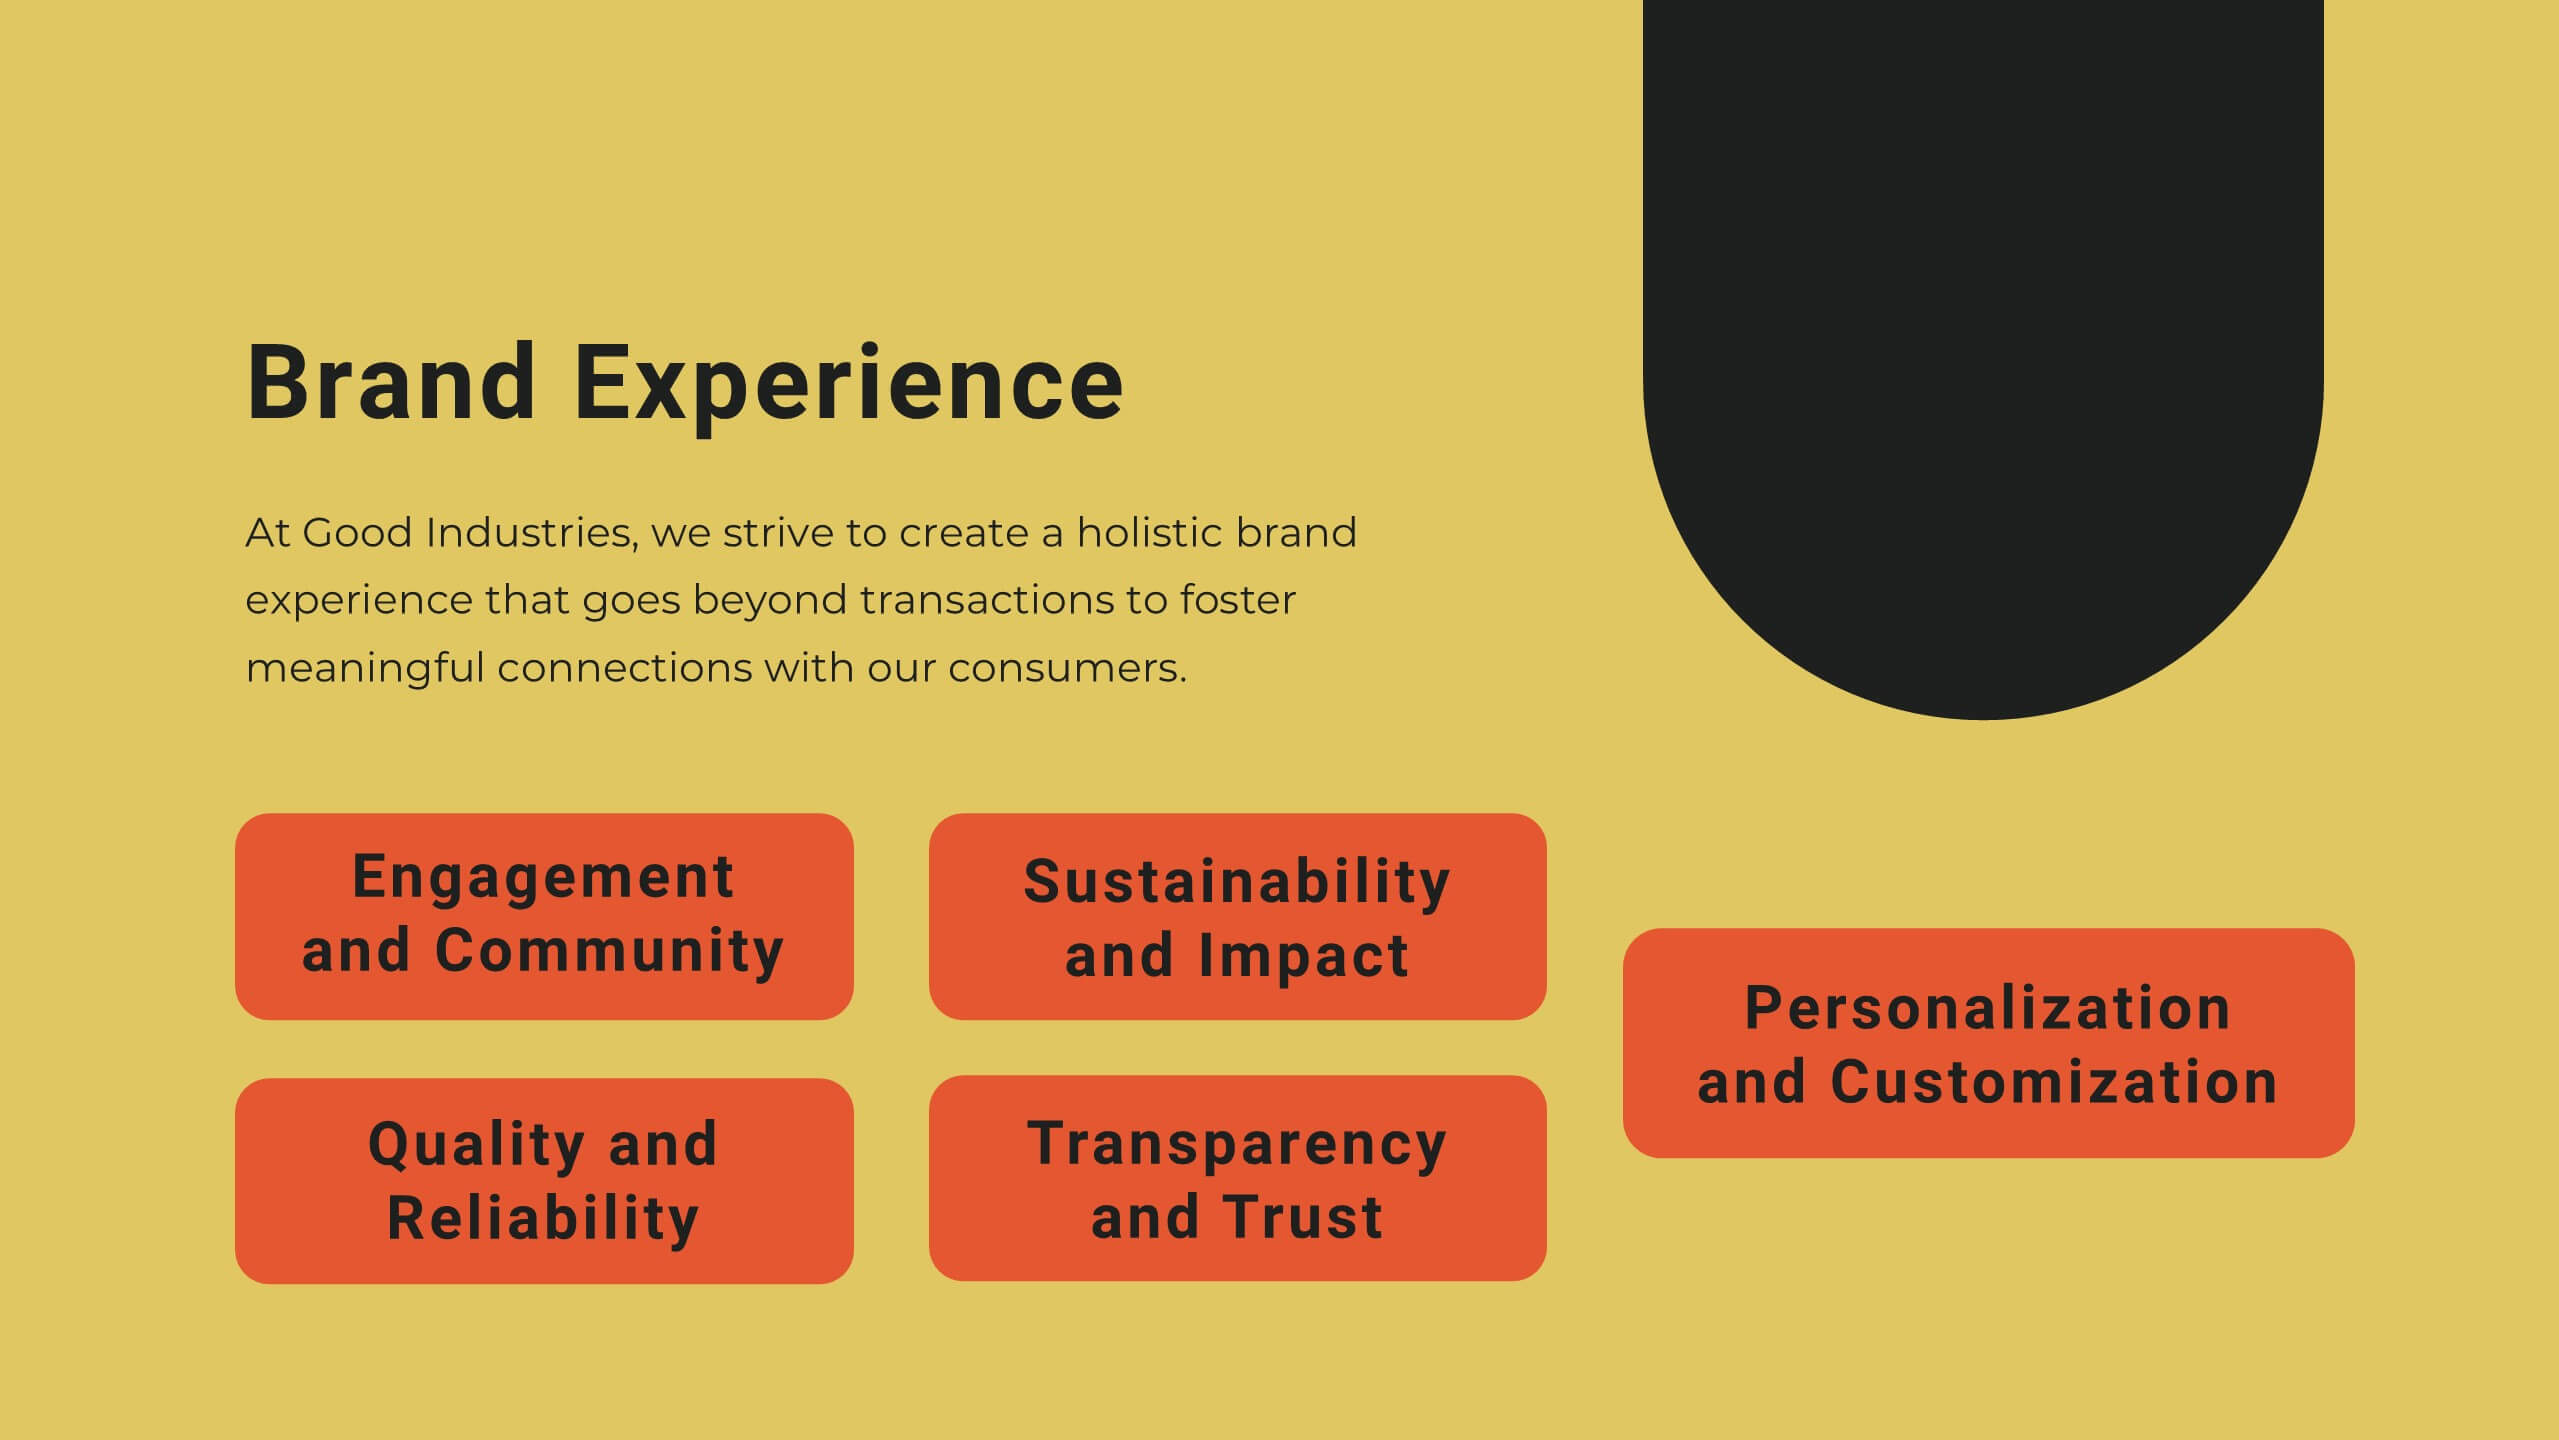
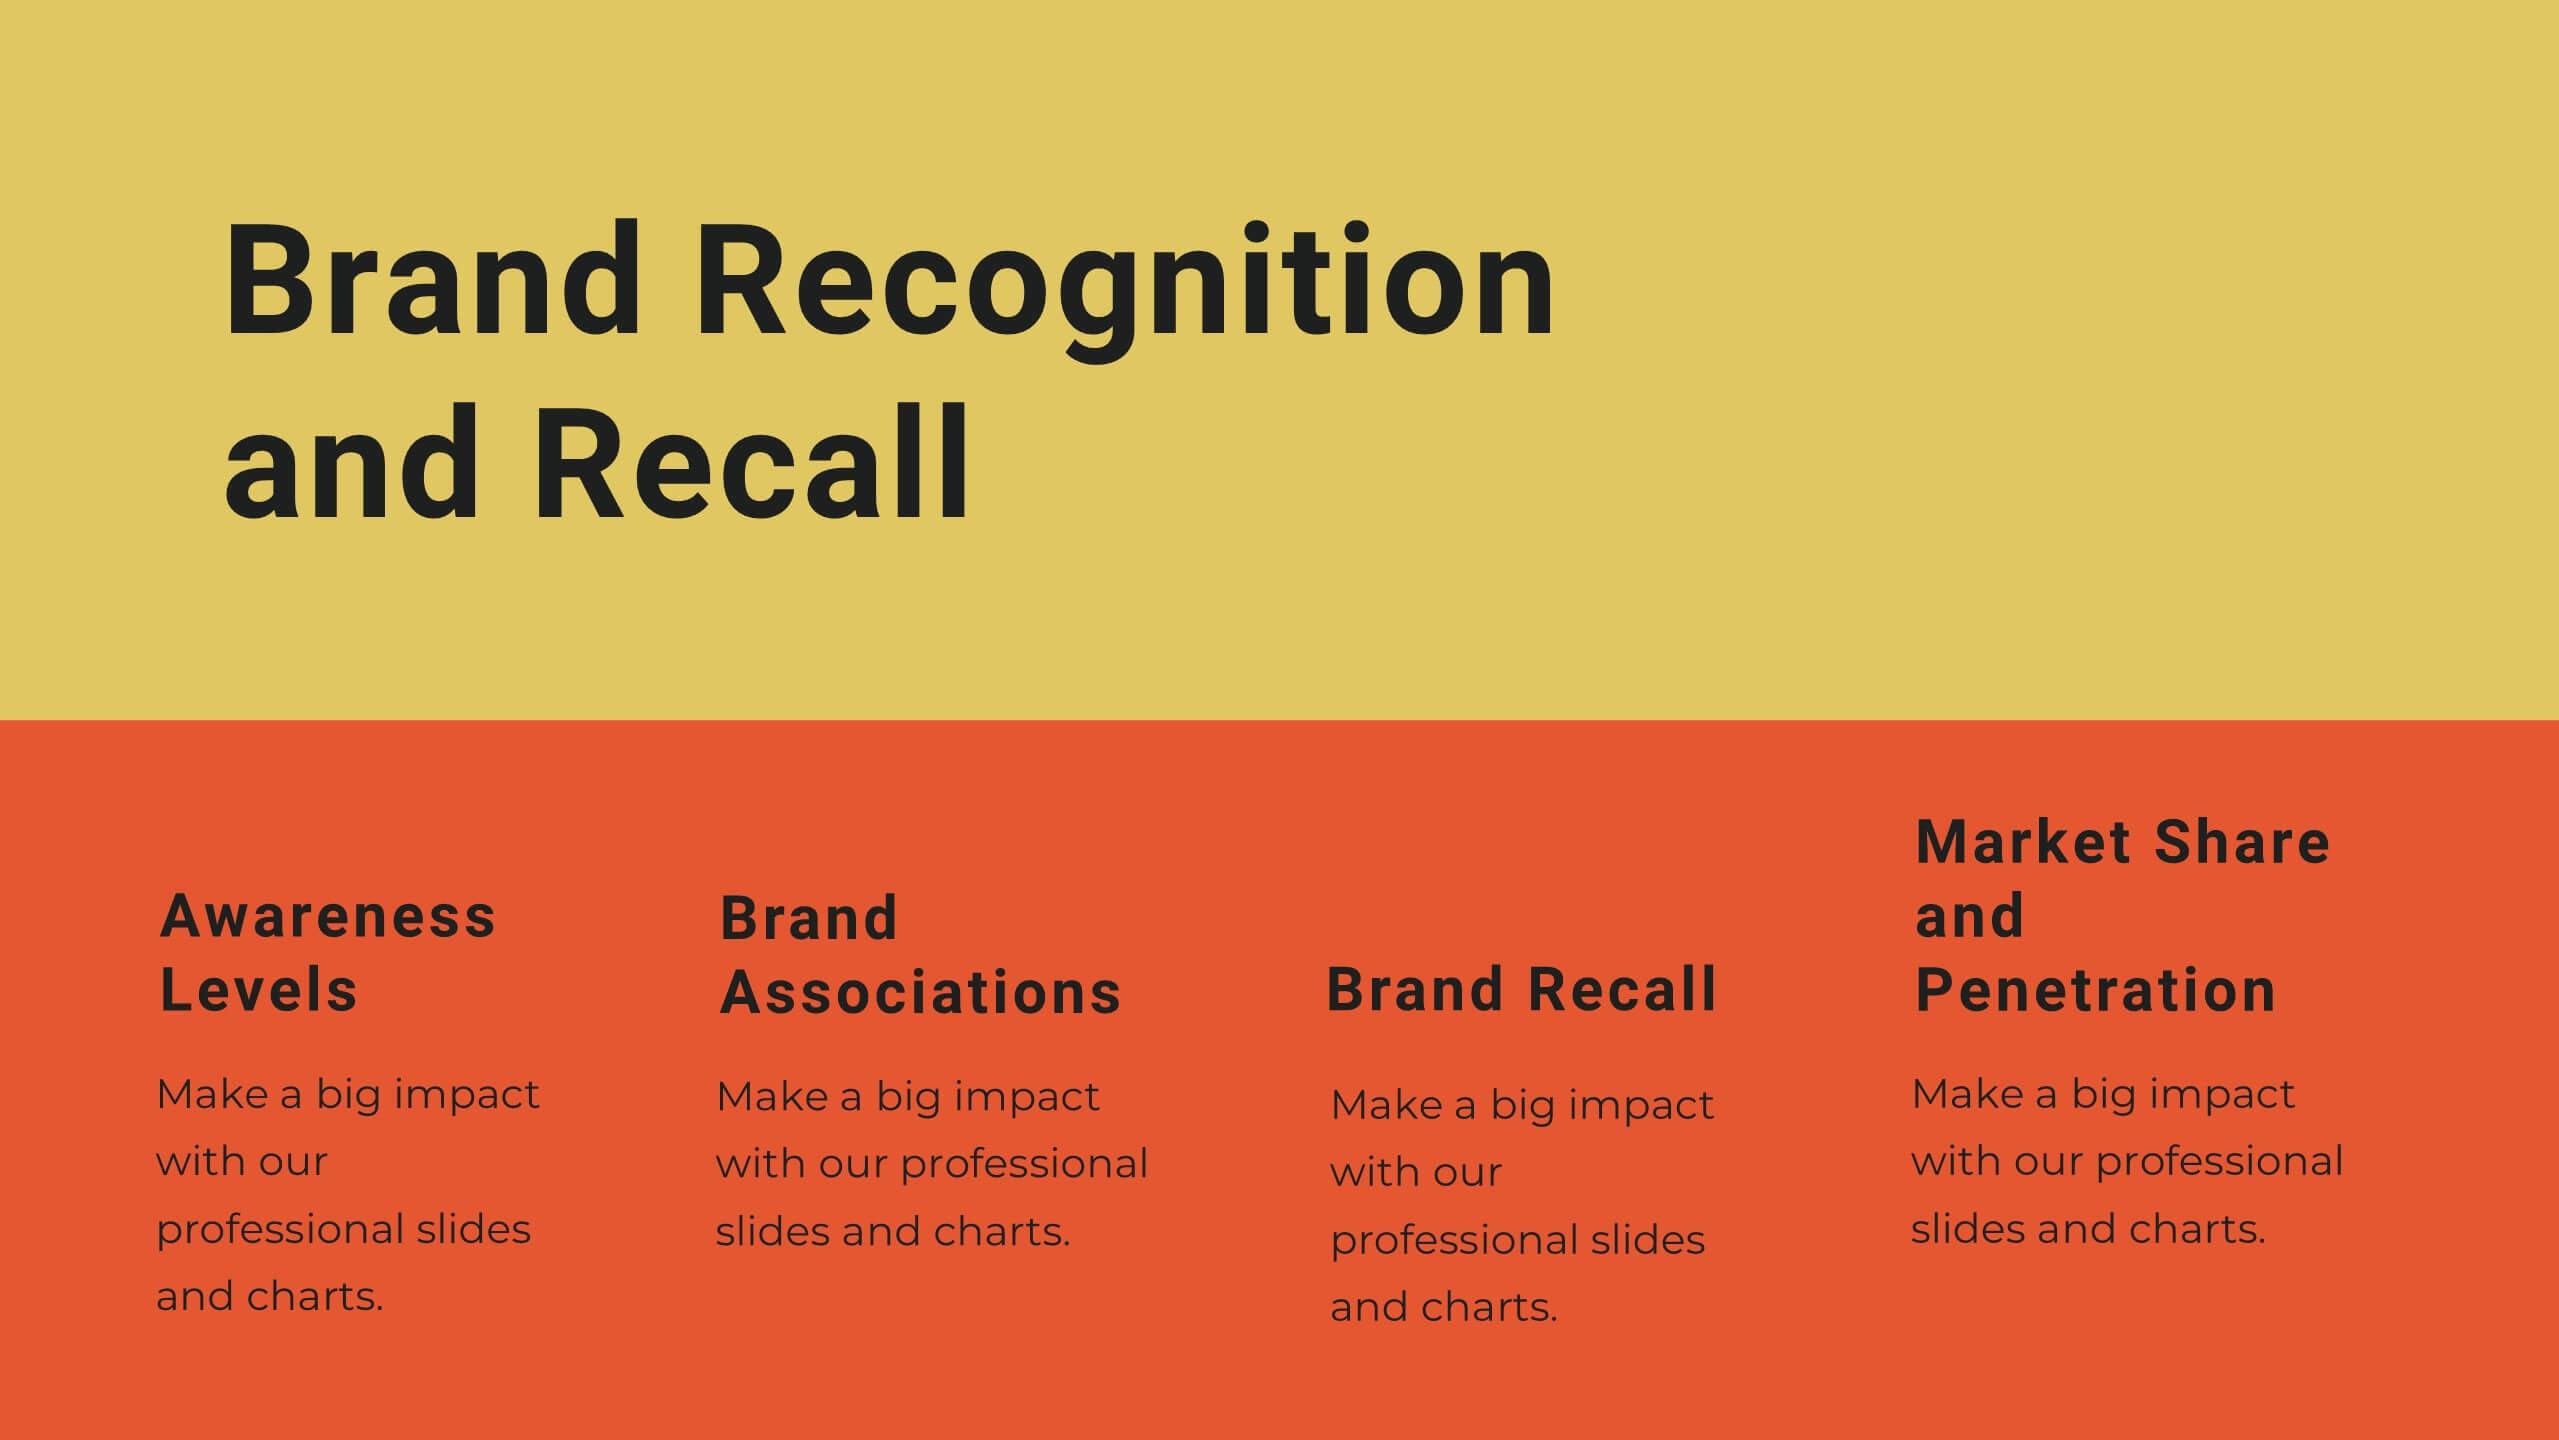
Yttrium Brand Strategy Report Presentation
Present your brand strategy with confidence using this vibrant, structured template! Covering brand identity, values, audience personas, and positioning, this template is perfect for crafting a compelling brand narrative. Fully customizable, it’s designed for seamless use in PowerPoint, Keynote, and Google Slides, making it an ideal tool for branding presentations.


6 diapositivas
Business Framework Strategy Presentation
Dive into strategic planning with our Business Framework Strategy presentation template. This design brilliantly visualizes the essentials of business frameworks, guiding users through critical insights with a visually appealing, color-coded process. Ideal for strategists and planners, it offers a streamlined way to present complex information effectively. Compatible with PowerPoint, Keynote, and Google Slides, this template is a versatile tool for delivering impactful business strategies.