


Características


¿Tienes alguna pregunta?
Recomendar


8 diapositivas
Product Pricing Table Comparison Presentation
Showcase your product pricing options clearly with our 'Product Pricing Table Comparison' presentation template. This straightforward and efficient layout helps you display different price points and features across multiple packages, making it easy for your audience to compare and make informed choices. Ideal for sales presentations and marketing meetings, this template is compatible with PowerPoint, Keynote, and Google Slides.

20 diapositivas
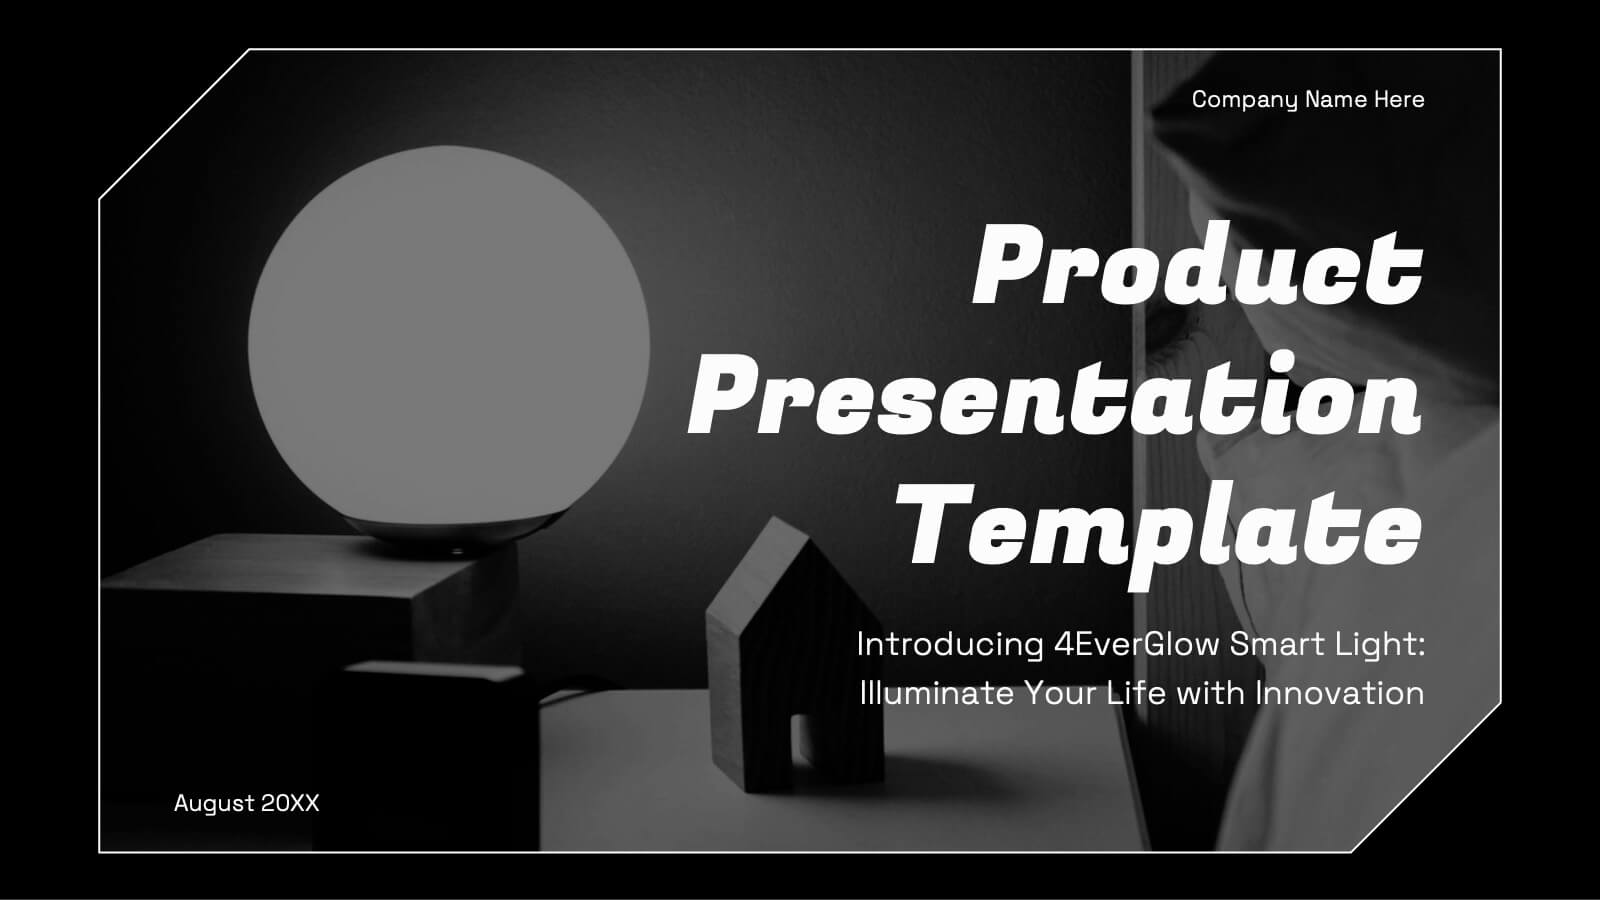
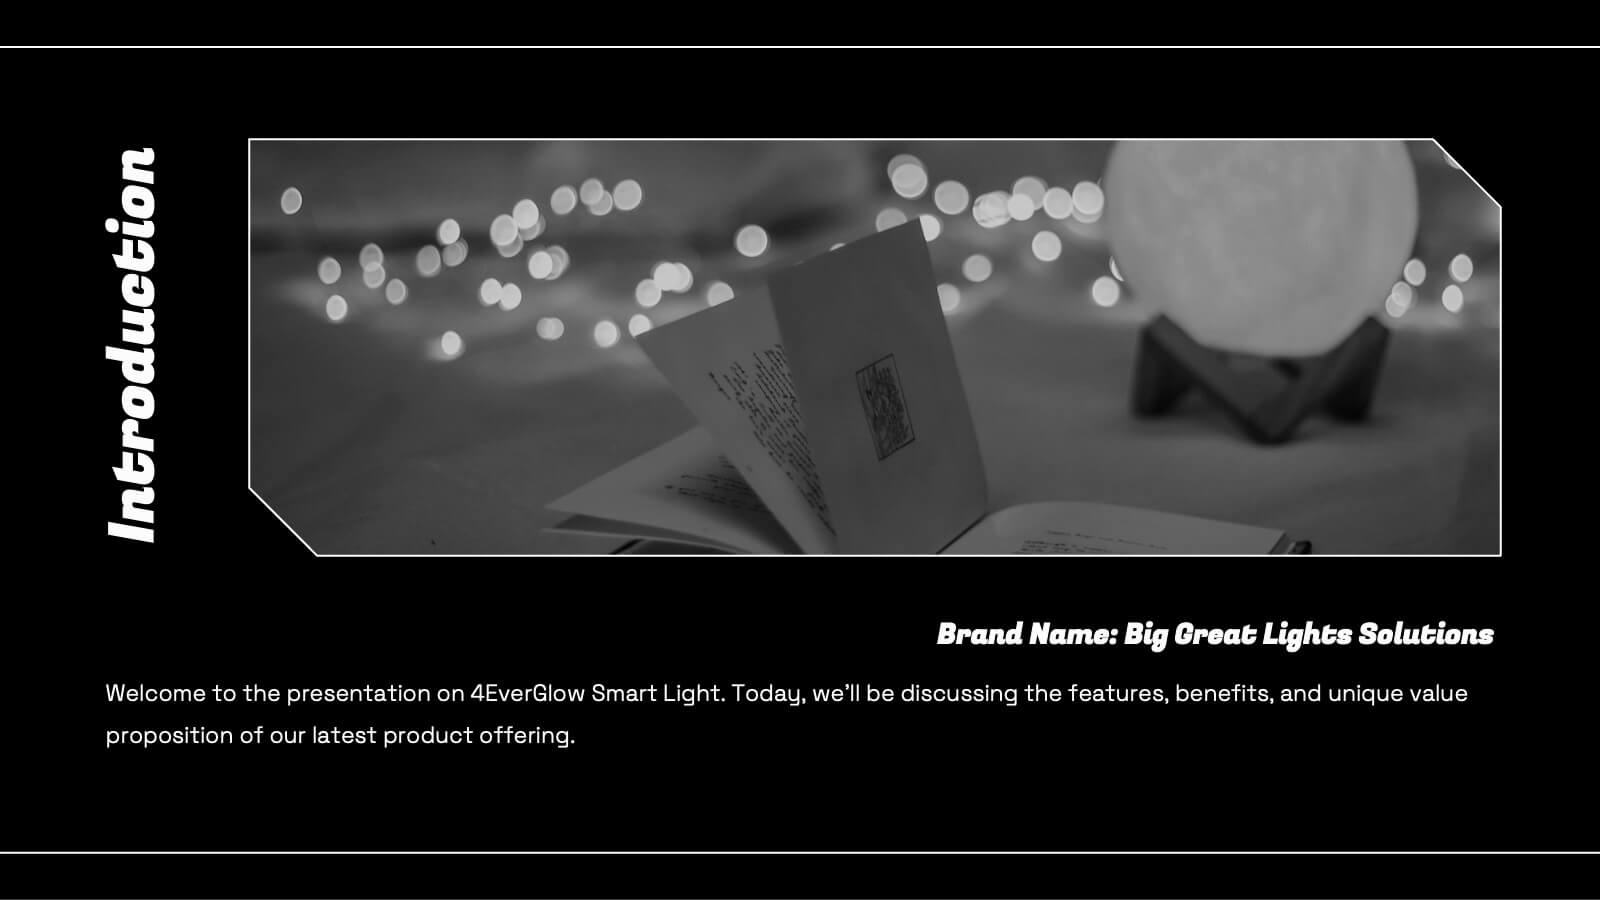
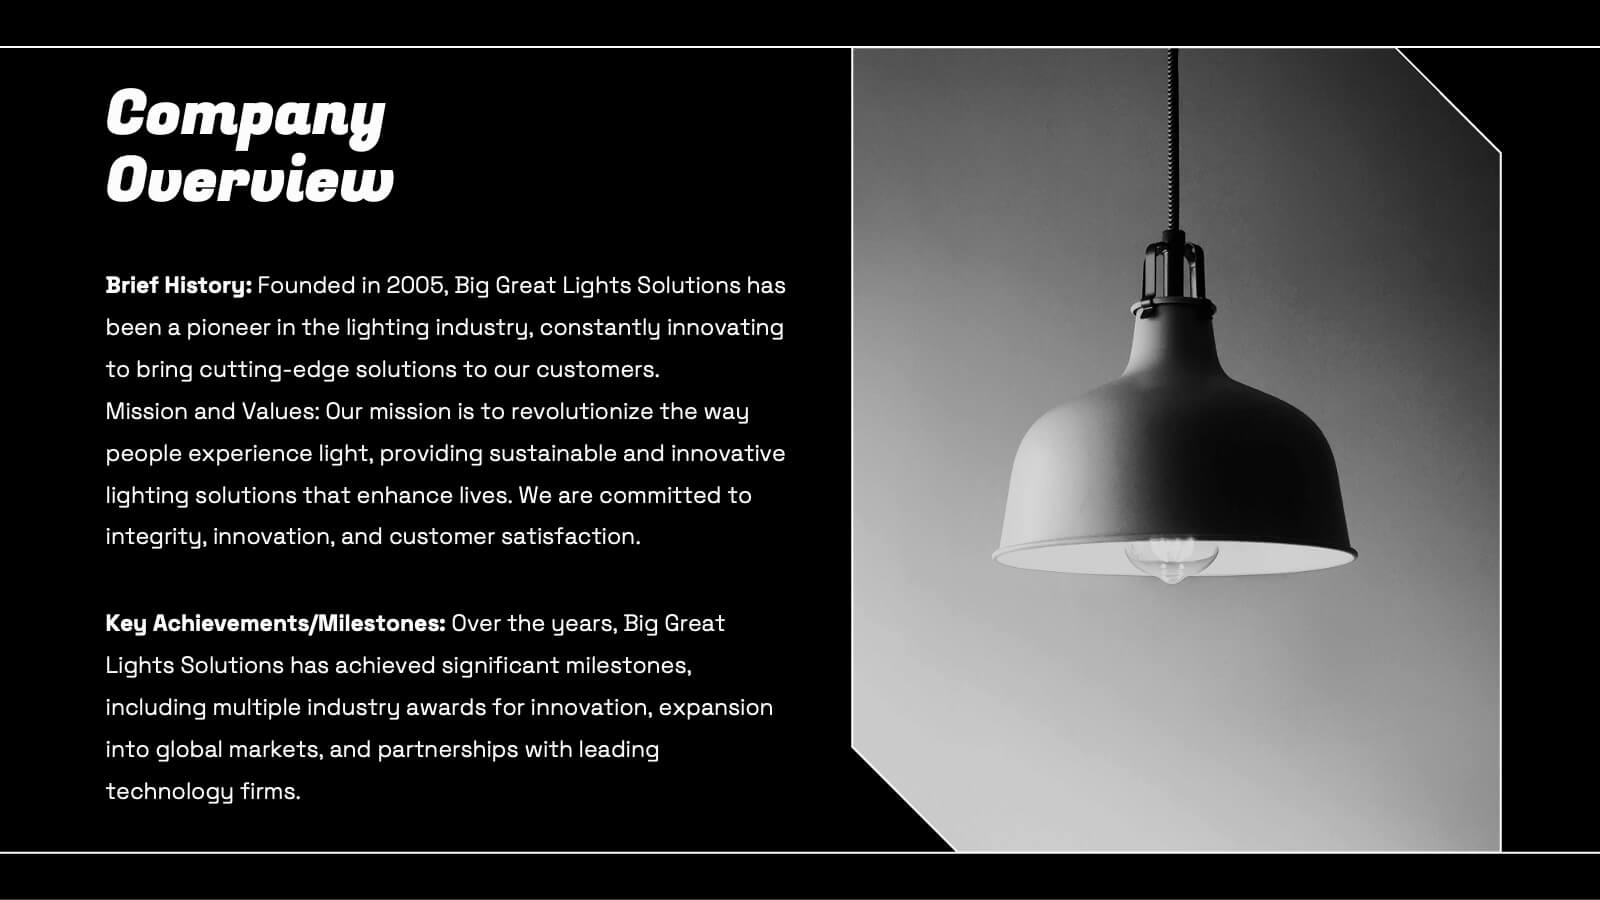
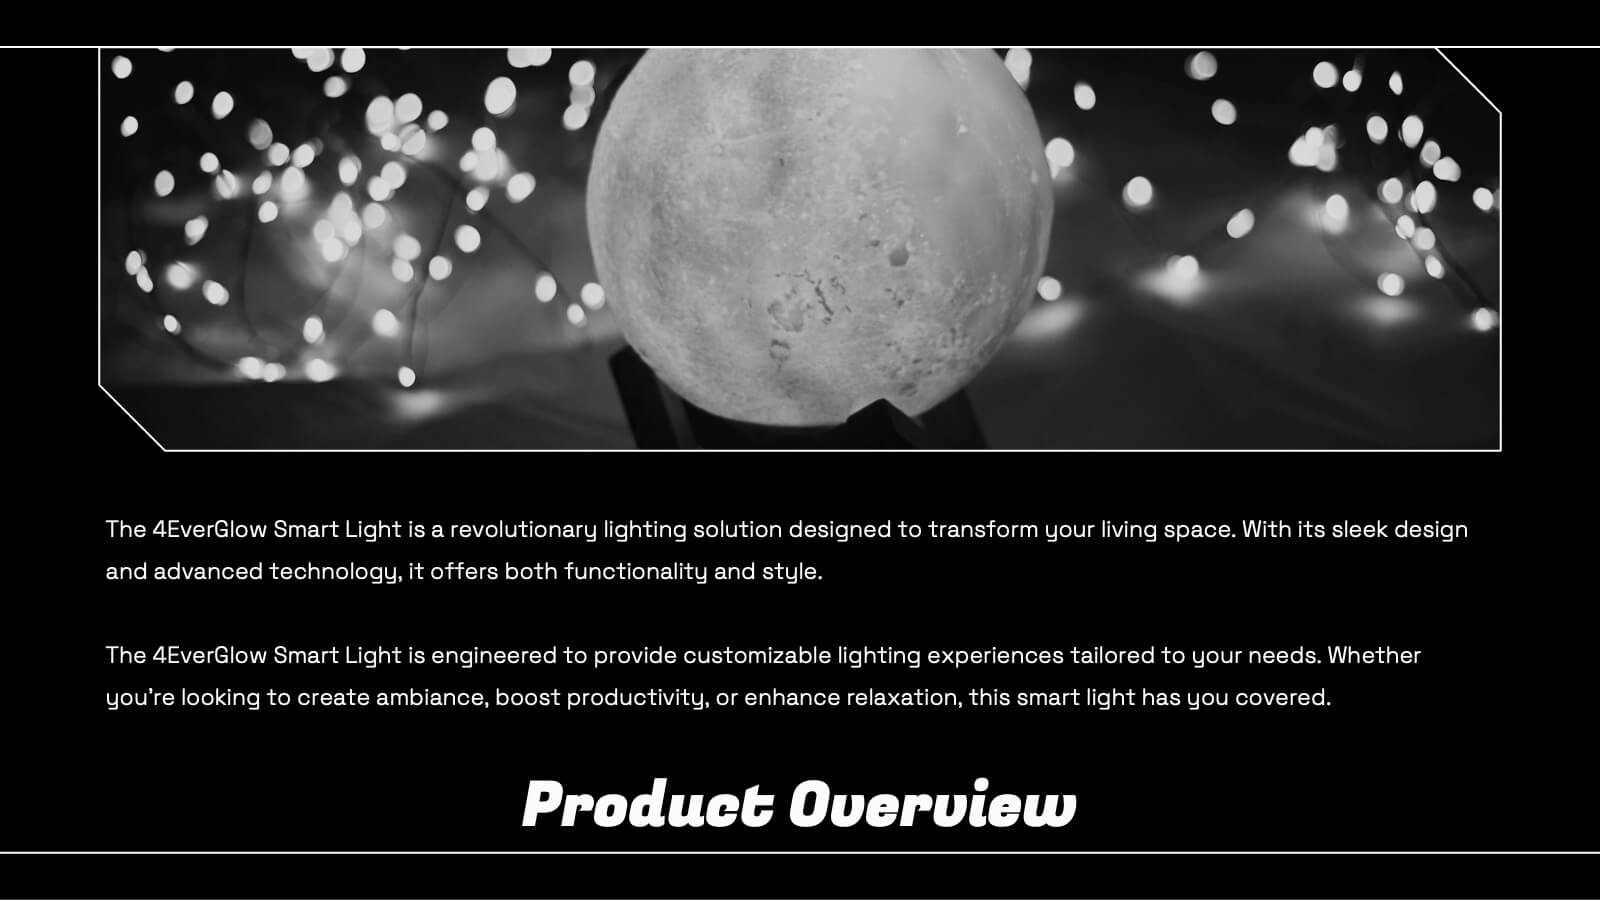
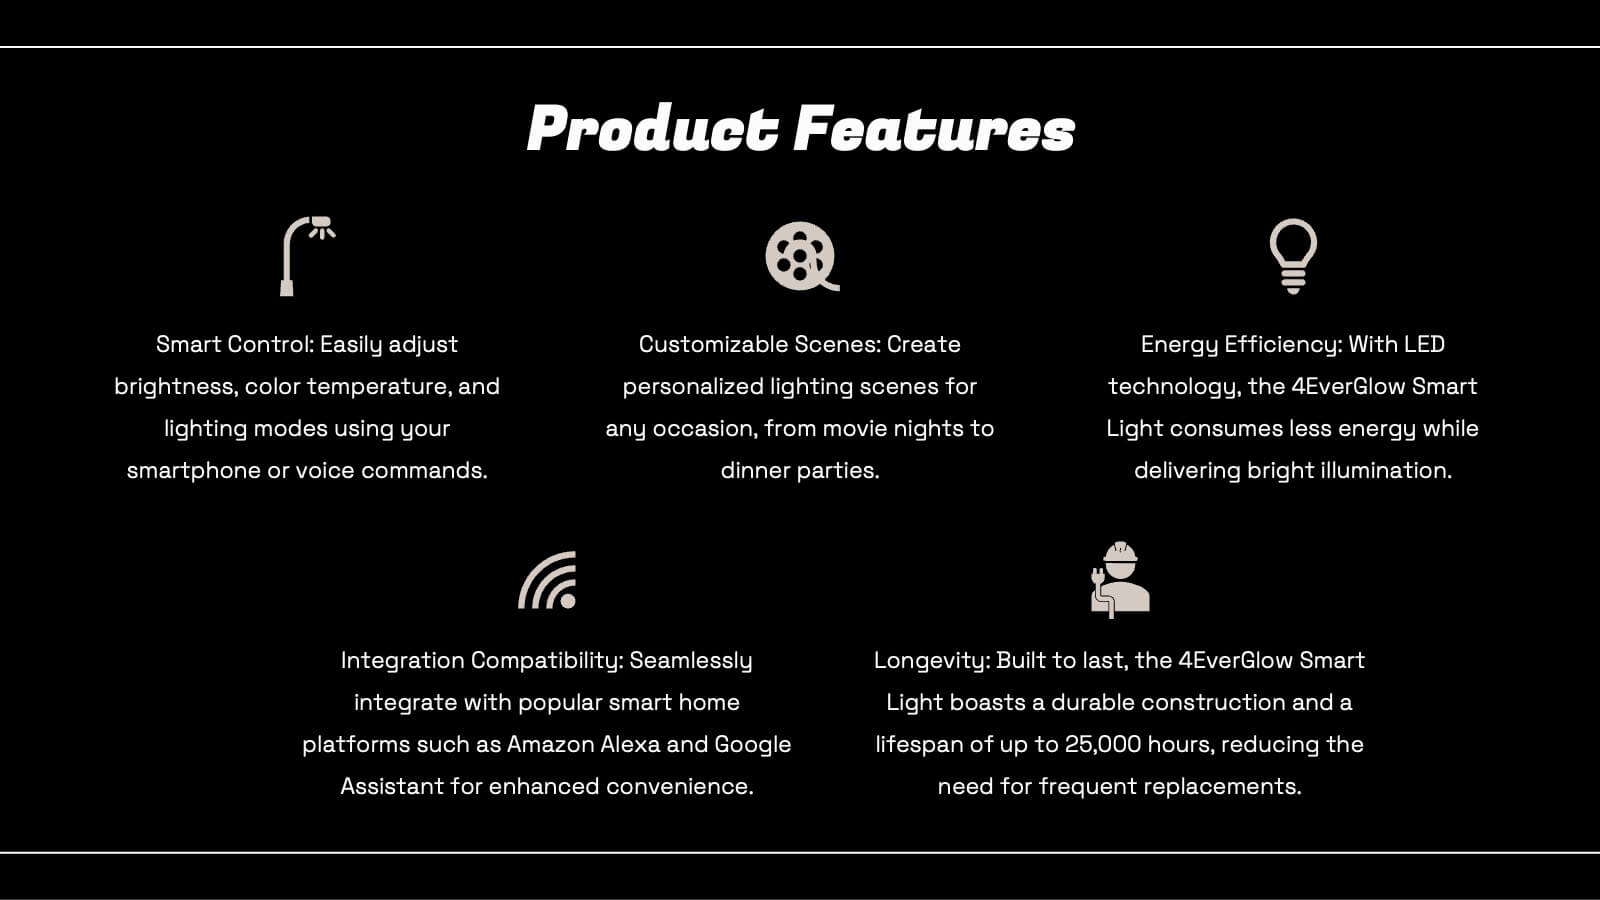
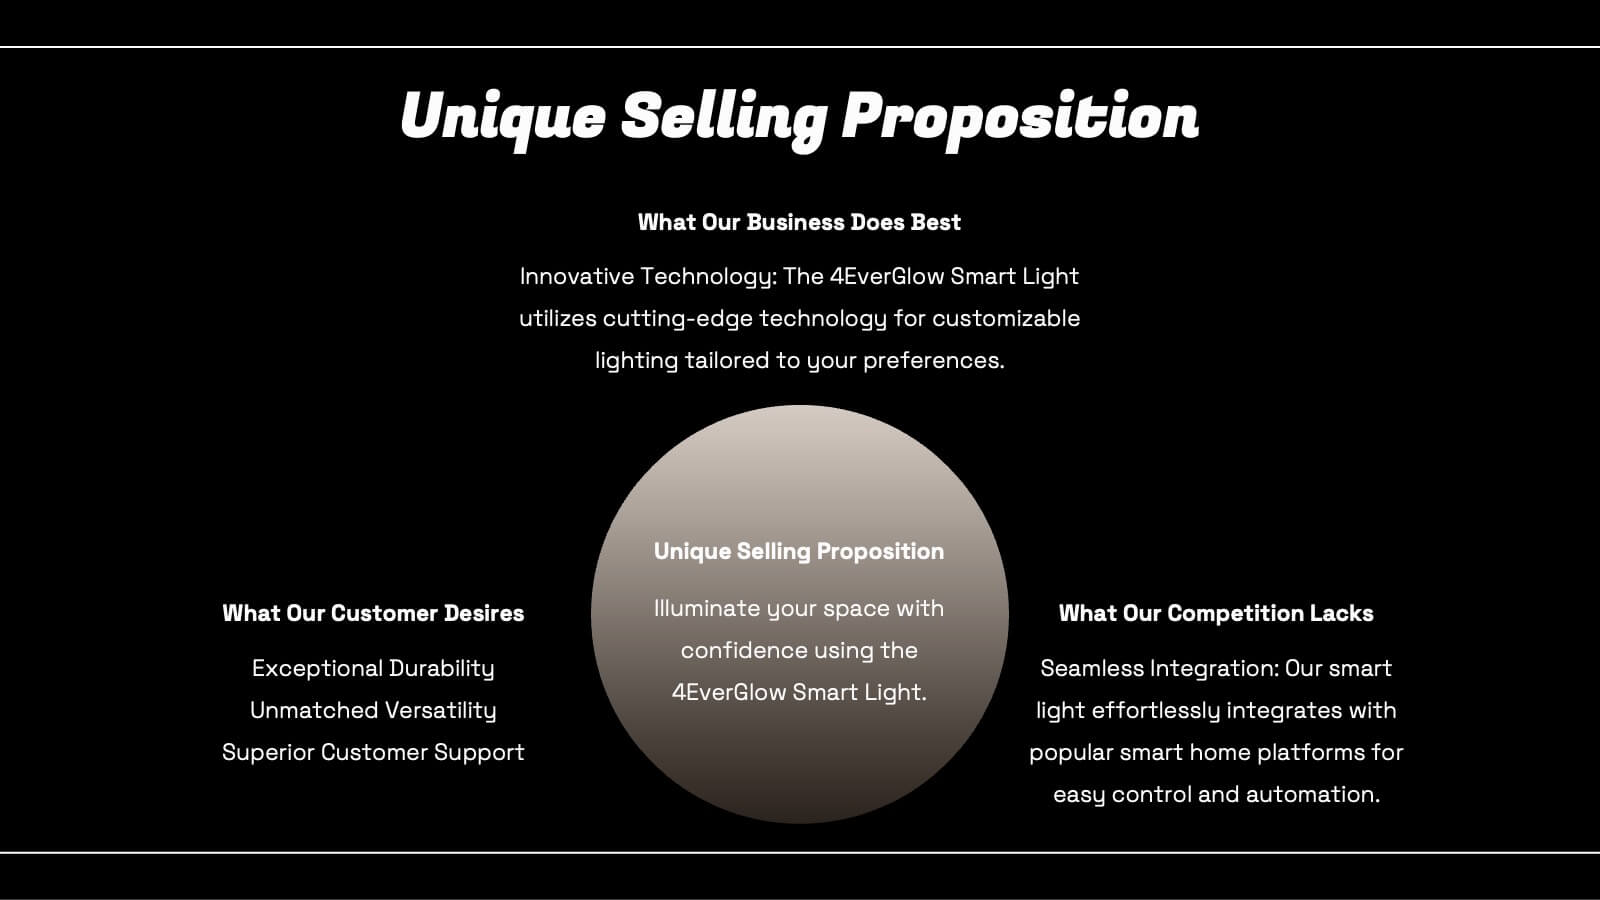
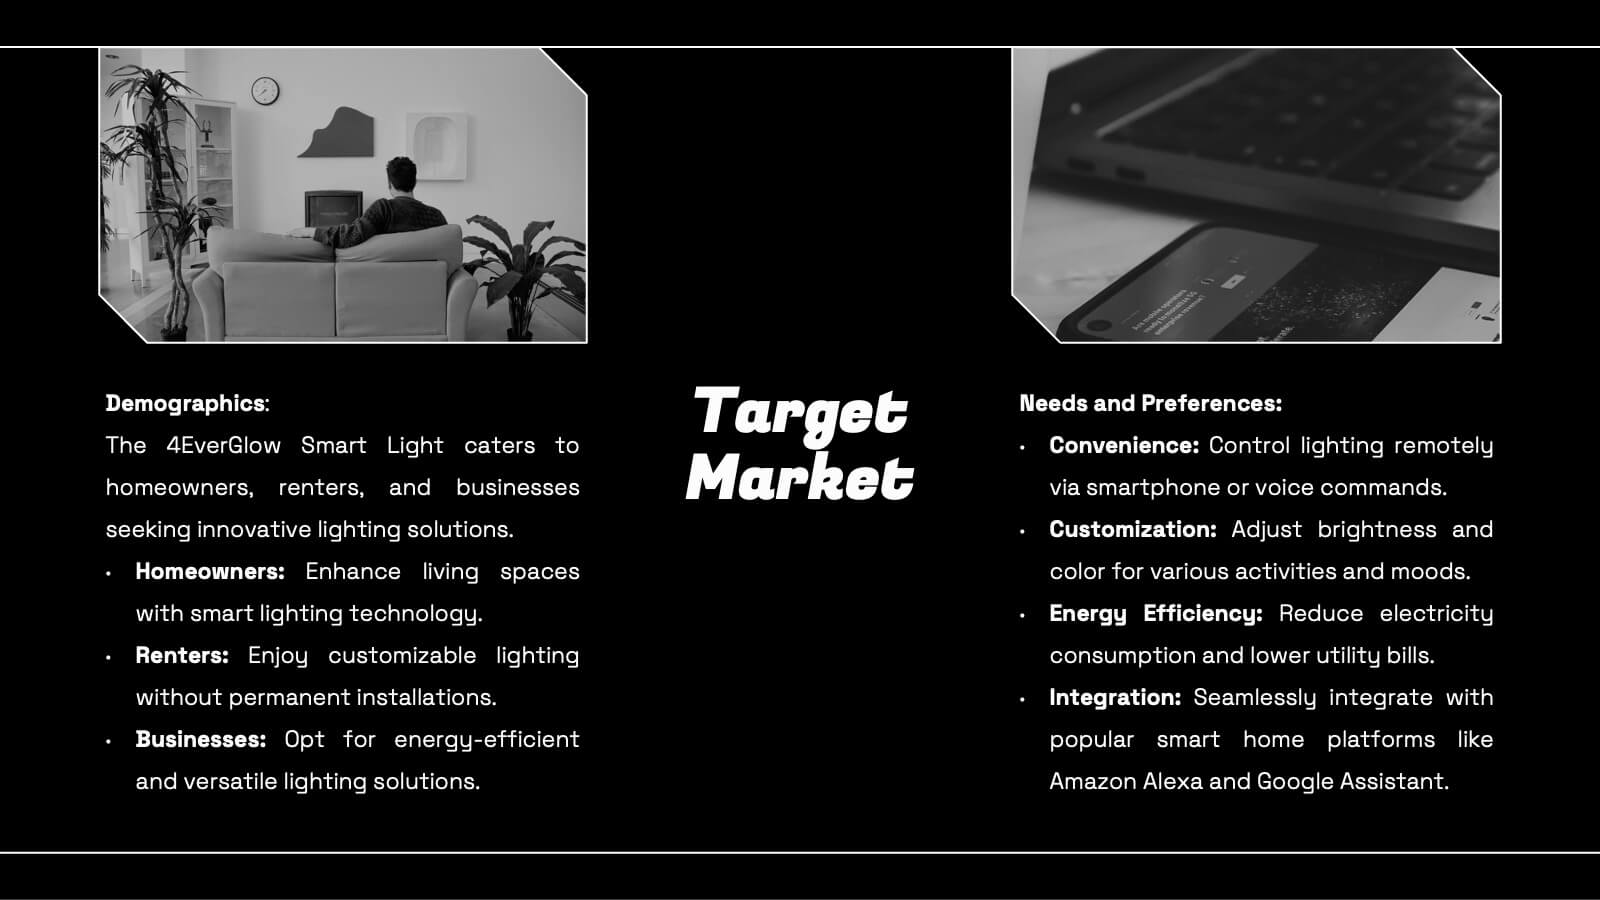
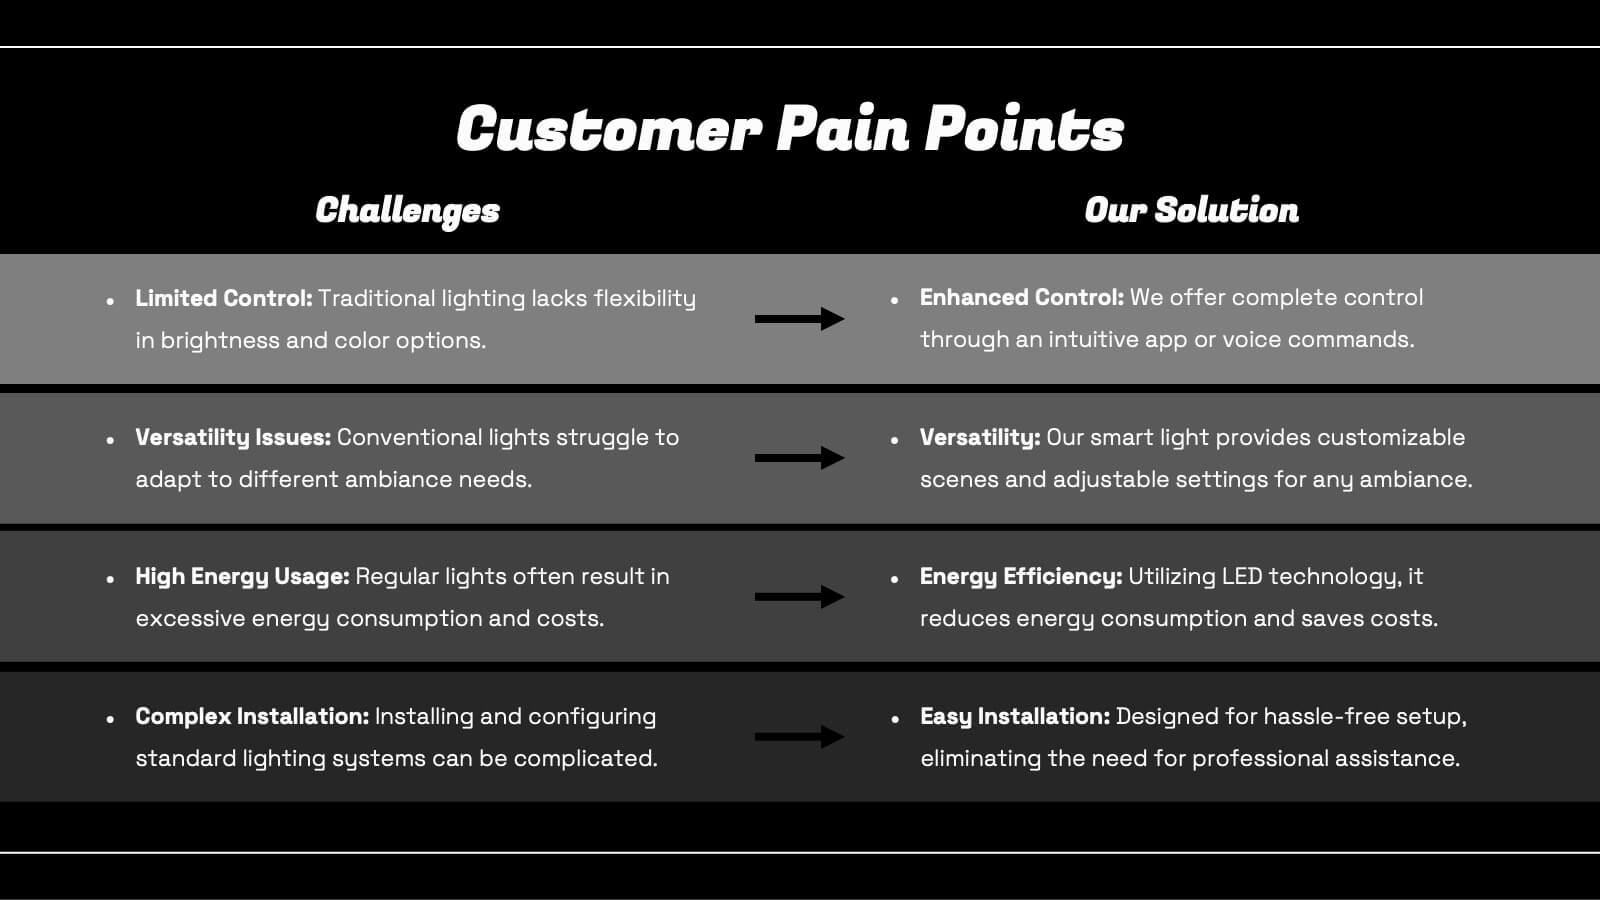
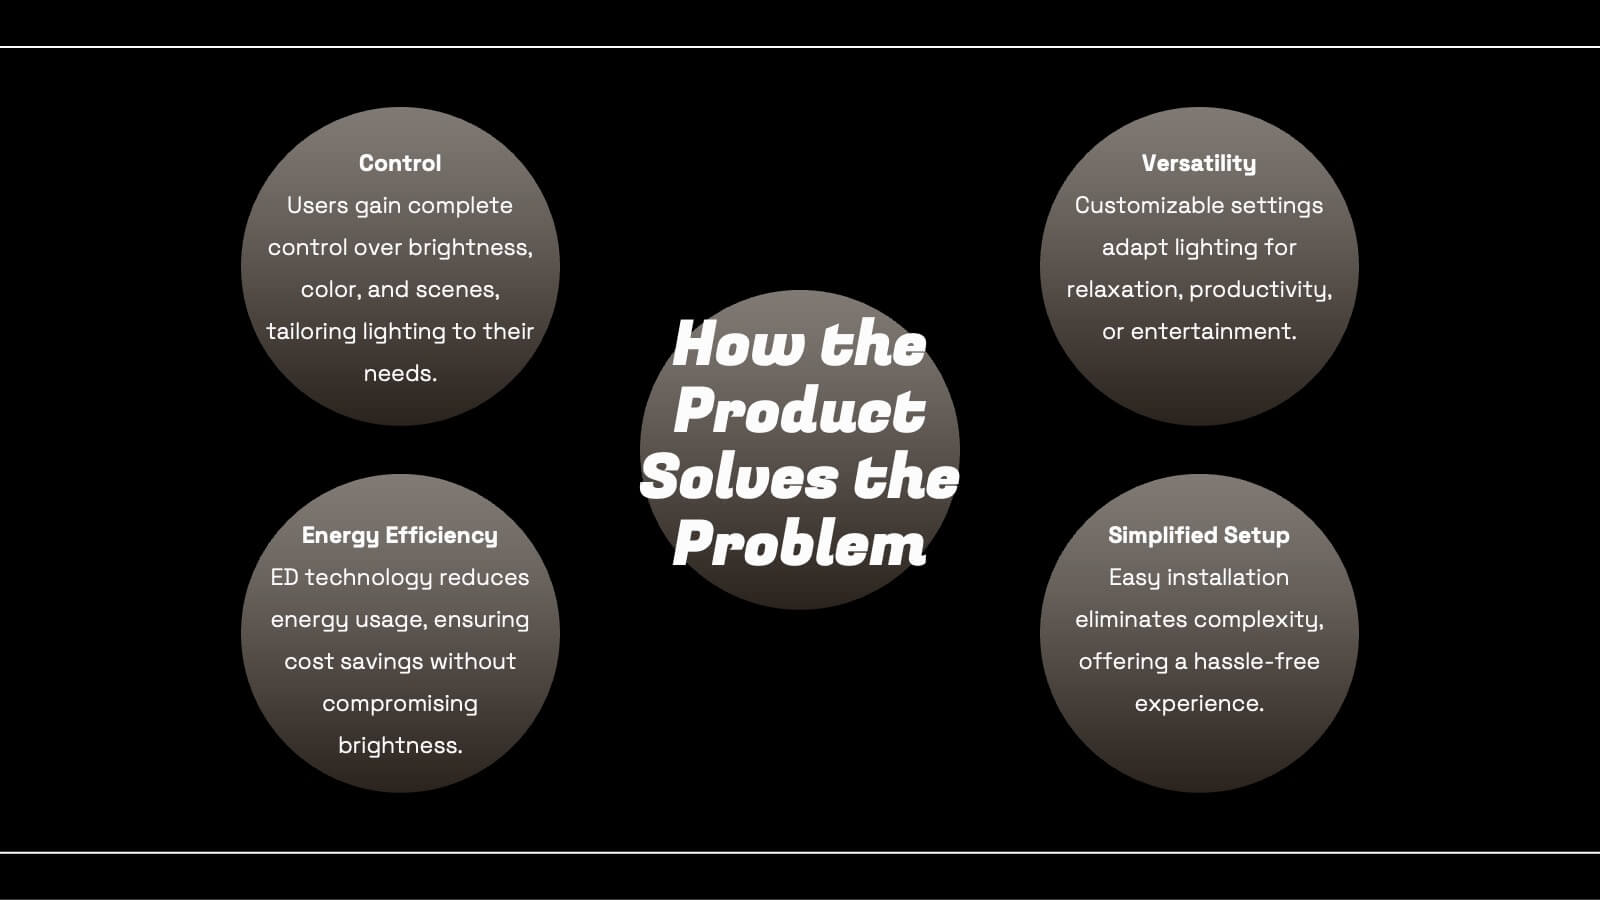
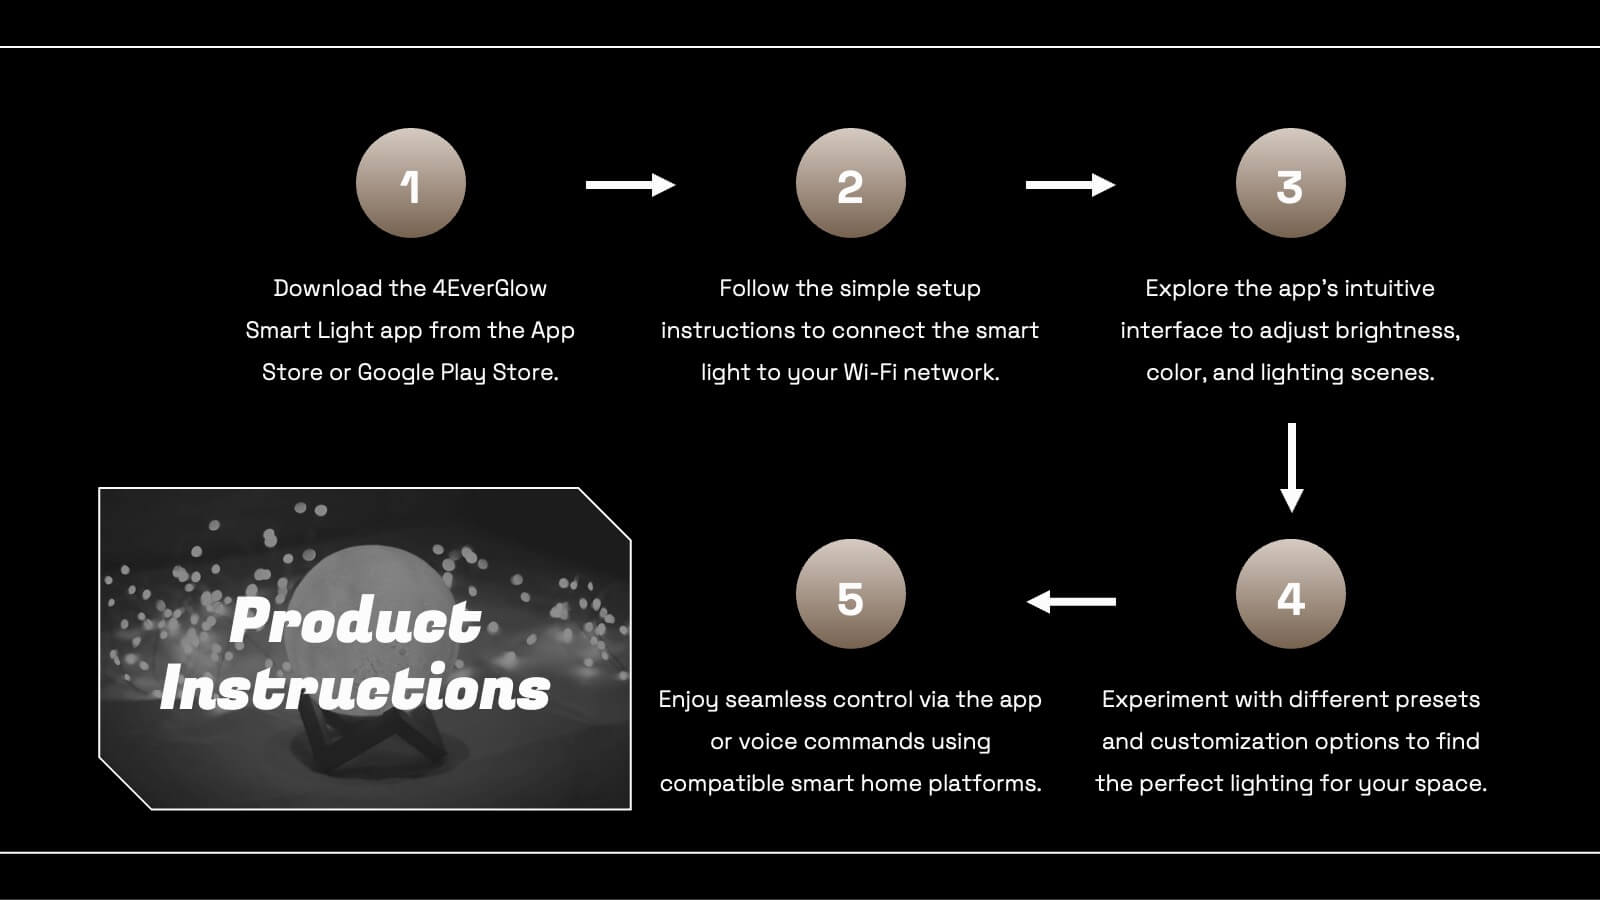
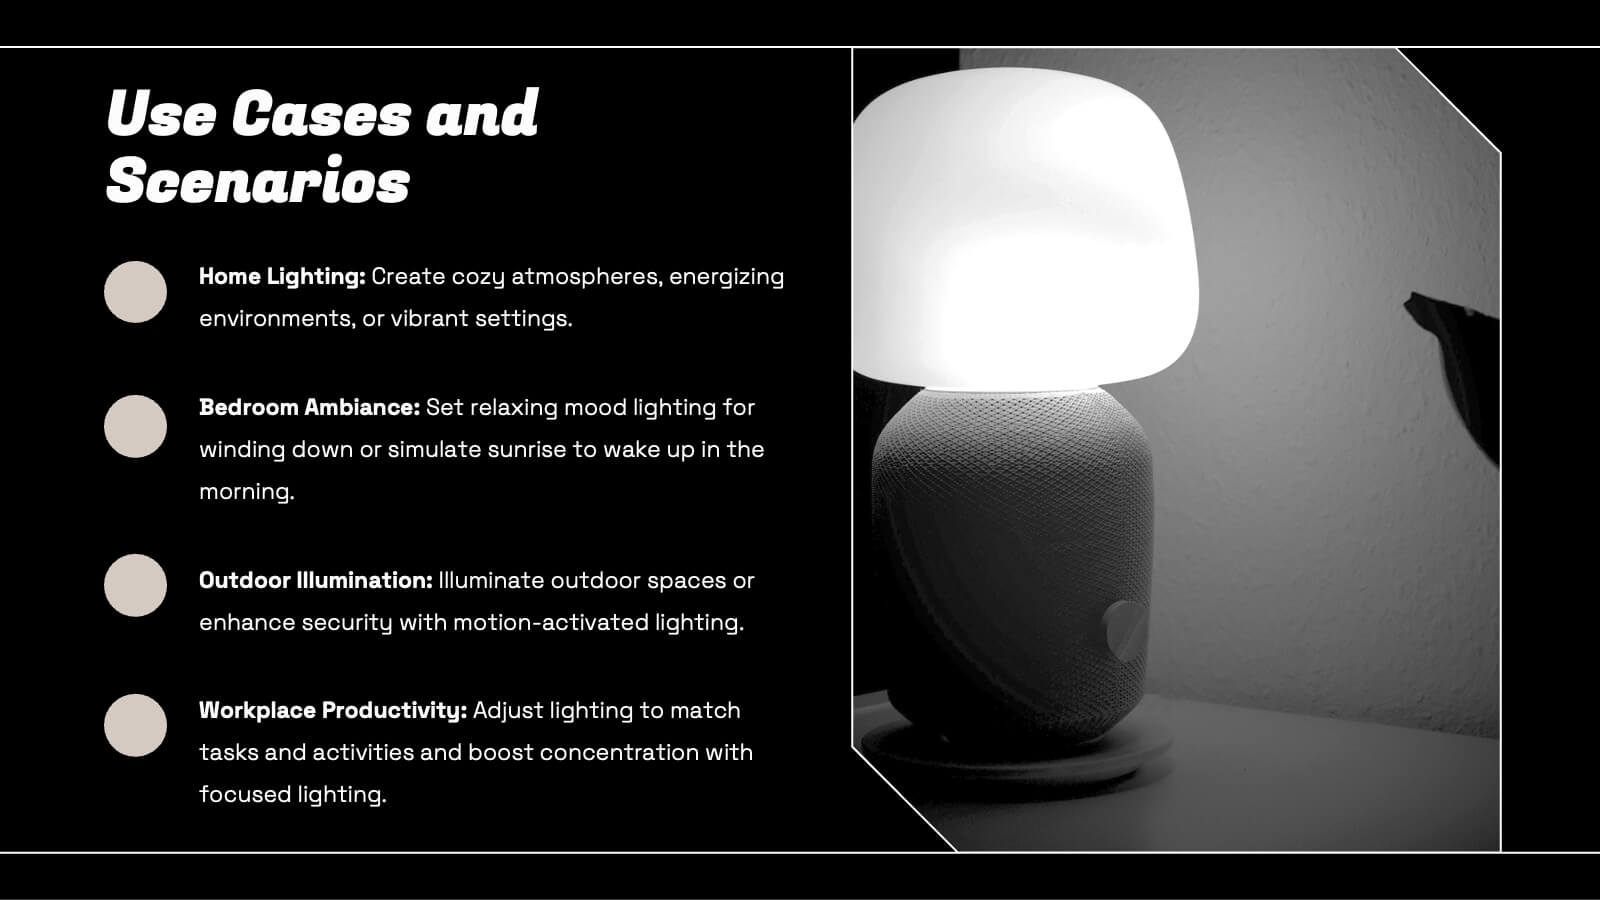
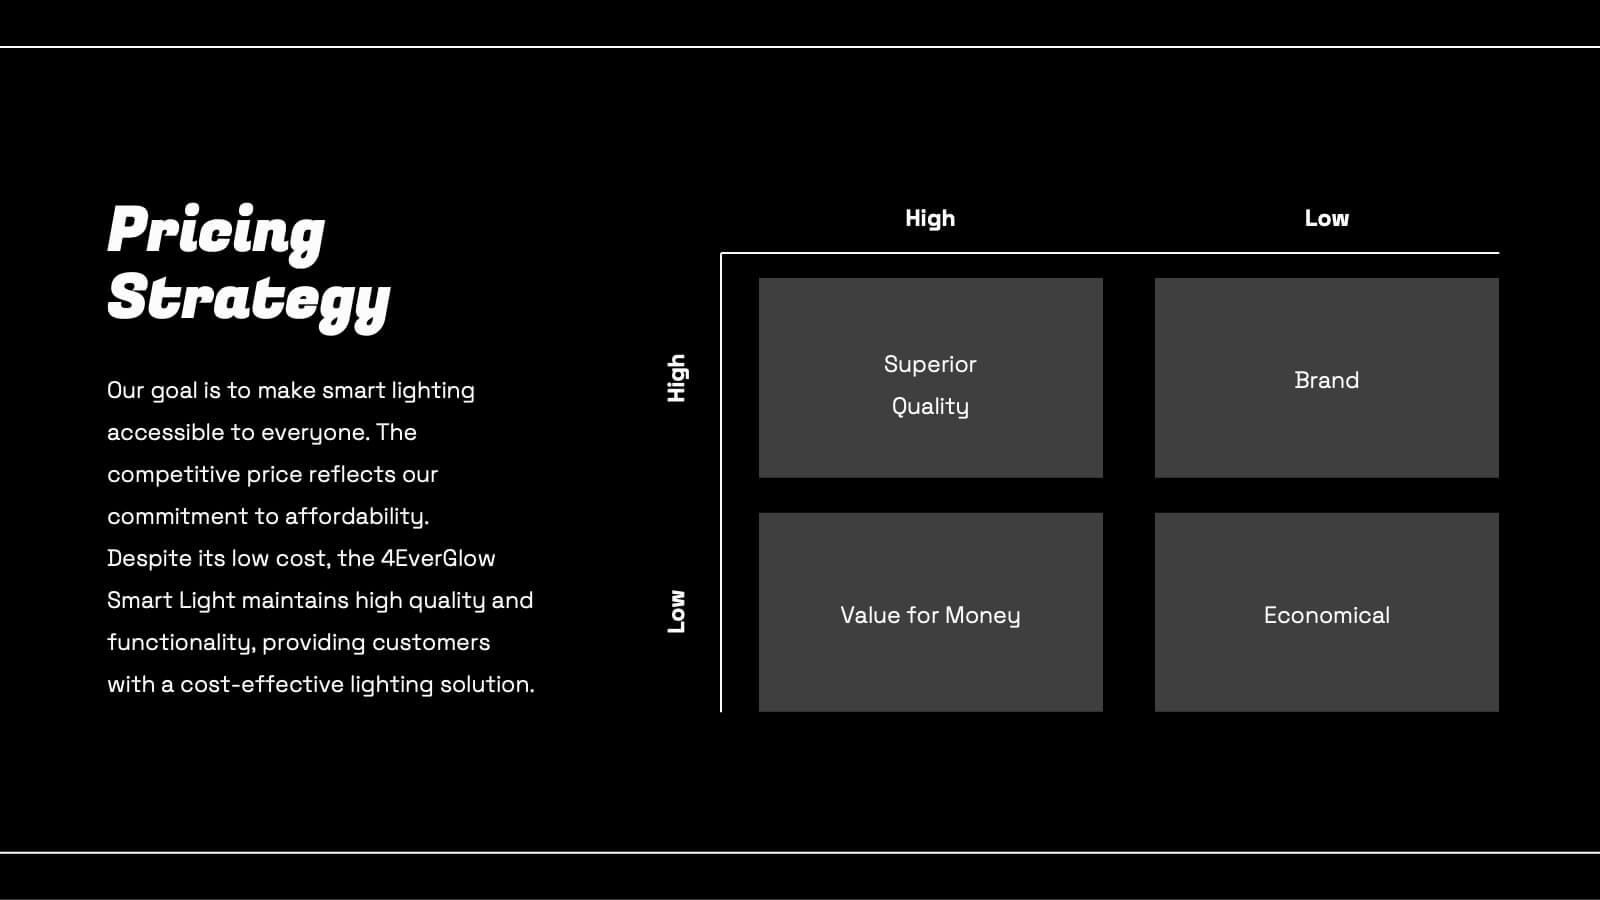
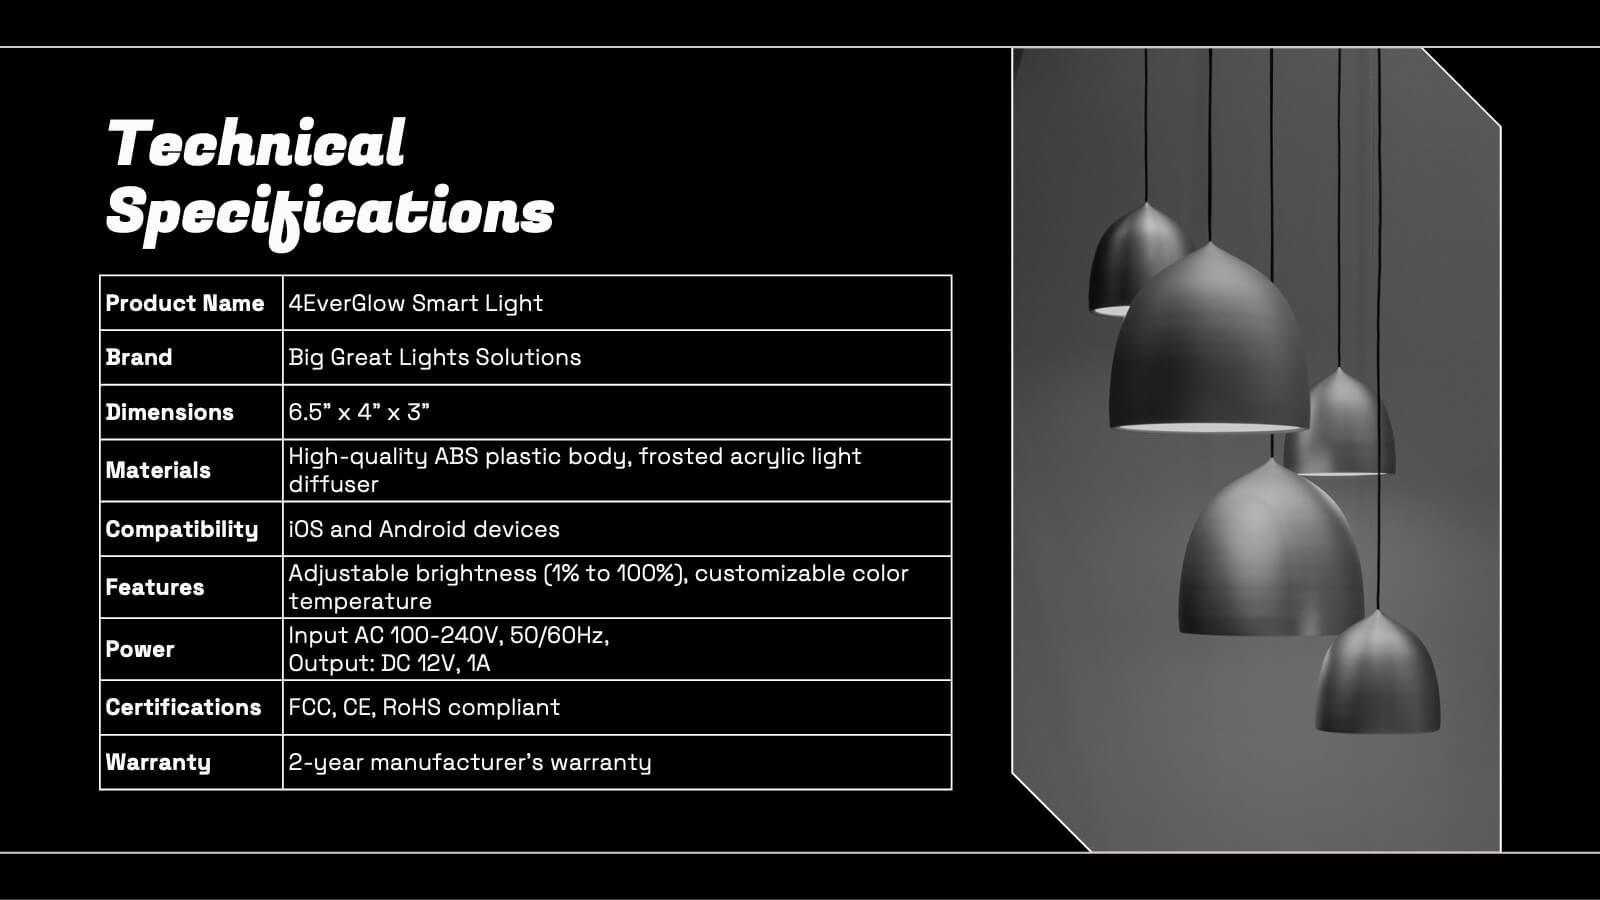
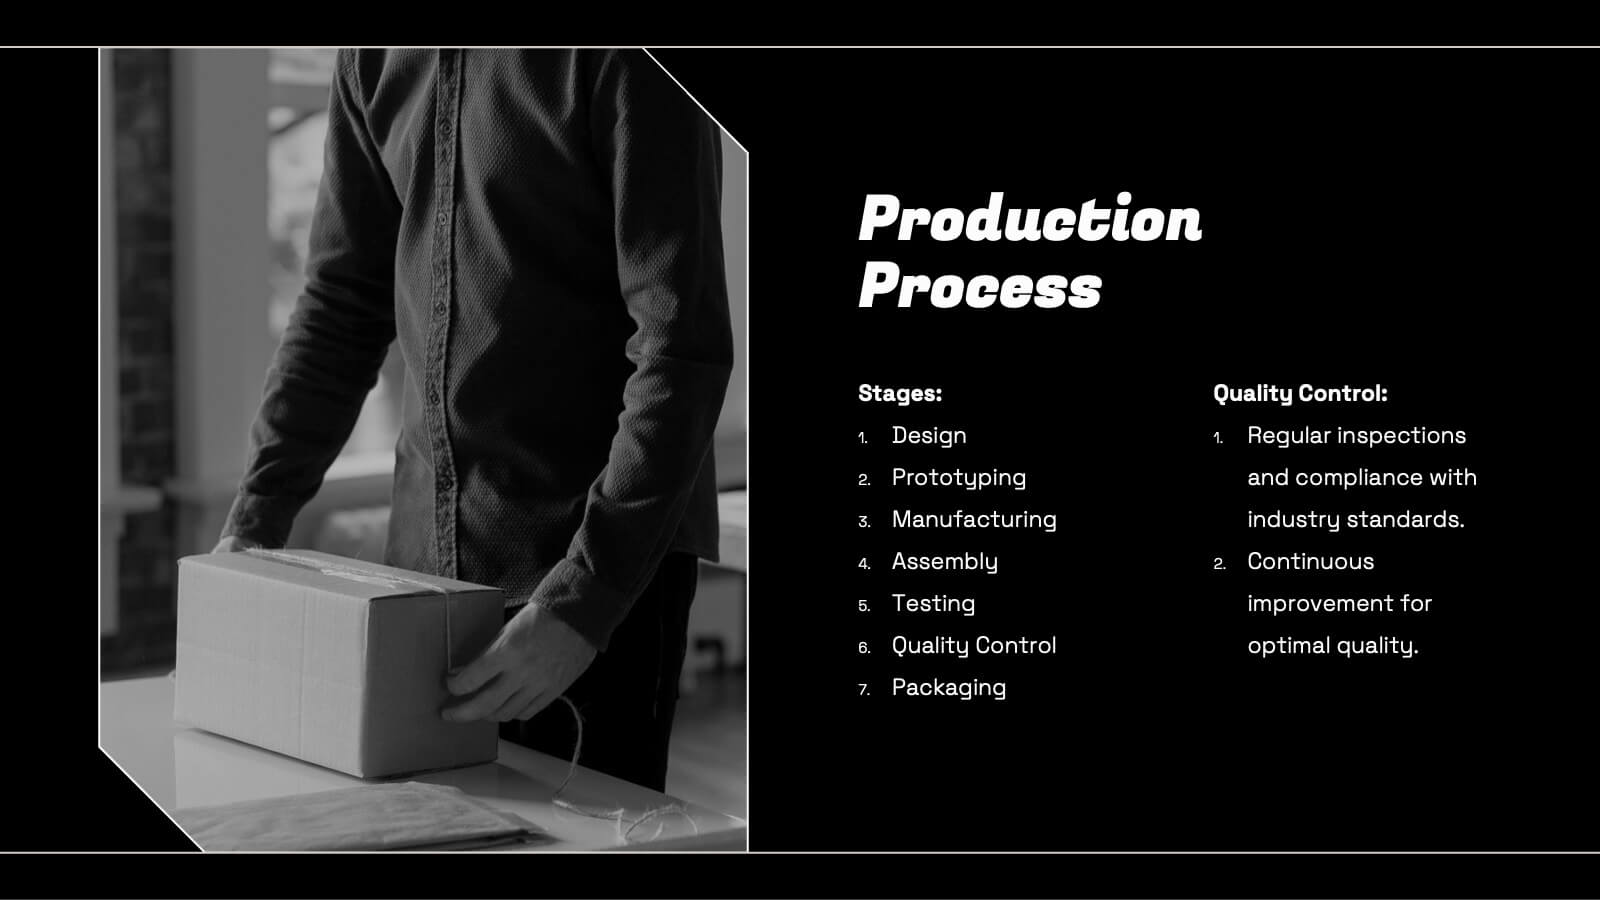
Smart Light Product Presentation
Enhance your product presentations with this Smart Lighting template. Designed for clarity and aesthetic appeal, it includes slides detailing product features, market analysis, technical specifications, and pricing strategies. Ideal for tech products, it's compatible with PowerPoint, Keynote, and Google Slides, ensuring broad accessibility and ease of use.


6 diapositivas
Business Investment Market in Africa Map Presentation
Highlight key investment hotspots across Africa with this clean, location-based map template. Featuring labeled markers, progress bars, and editable data points, it’s ideal for showcasing project focus, regional funding, or development opportunities. Customize easily in PowerPoint, Keynote, or Google Slides to create compelling, data-driven business and finance presentations.


5 diapositivas
Employee Onboarding HR Presentation
Start your presentation with energy and clarity using this clean, engaging slide designed to simplify every step of the onboarding journey. It helps explain employee integration, training stages, and team alignment in a way that feels intuitive and visually organized. Fully compatible with PowerPoint, Keynote, and Google Slides.


5 diapositivas
Leadership and Team Dynamics Strategy Presentation
Highlight team hierarchy and leadership flow with the Leadership and Team Dynamics Strategy Presentation. This visual layout is ideal for mapping roles, responsibilities, or reporting lines. Use it to clarify leadership structures or showcase team development plans. Fully customizable in PowerPoint, Keynote, and Google Slides for seamless strategic communication.


4 diapositivas
Creative Brush Stroke Theme Design Presentation
Bring a bold, artistic flair to your presentation with this Creative Brush Stroke Theme Design. Featuring layered paint-like strokes in vibrant tones, this layout blends creativity with clarity—perfect for design pitches, brainstorming sessions, or visual storytelling. Fully customizable in PowerPoint, Google Slides, and Canva for seamless editing.


21 diapositivas
Inventra Creative Portfolio Presentation
Make a lasting impression with this sleek and modern creative portfolio presentation template. Perfect for showcasing your artistic journey, featured projects, unique style, and client testimonials. Highlight your creative process, pricing, and services with a bold and professional layout. Fully customizable in PowerPoint, Keynote, and Google Slides.


4 diapositivas
Real Estate Market Trends
Present housing data and property growth insights with this ascending building chart layout. Perfect for realtors, investors, and market analysts, this template helps visualize real estate performance over time. Fully editable in PowerPoint, Keynote, and Google Slides.


2 diapositivas
Detailed Buyer Profile Analysis Layout Presentation
Showcase a clear snapshot of your customer insights with this Detailed Buyer Profile Analysis Layout. This modern slide helps you outline bios, goals, and key traits using labeled icons, progress bars, and a visual profile section. Ideal for marketing teams, persona development, and product targeting. Fully editable in PowerPoint, Keynote, and Google Slides.


4 diapositivas
Performance Gap Analysis Diagram Presentation
Bridge the gap between current and desired performance with this strategic diagram. Featuring a split-path layout and central bridge graphic, this template helps visualize obstacles, goals, and solutions. Ideal for strategy teams, consultants, and analysts. Fully editable in PowerPoint, Keynote, and Google Slides—clear, impactful, and easy to customize.


20 diapositivas
Leafsong Design Strategy Proposal Presentation
This Design Strategy Presentation Template is perfect for showcasing your creative process, key design elements, and project planning. Covering essential aspects like moodboards, prototypes, and design assets, it ensures a structured and visually appealing approach. Fully customizable and compatible with PowerPoint, Keynote, and Google Slides.


20 diapositivas
Cascade Detailed Project Execution Plan Presentation
Embark on your next big project with confidence using the Cascade Project Plan template! This visually stunning and meticulously designed template is perfect for laying out the roadmap for any project, whether it's launching a new product or managing a complex initiative. The template features sections for project overview, scope of work, budget breakdown, and risk management, ensuring every aspect of your project is thoroughly covered. Its clean and modern design allows you to present your ideas with clarity, while the customizable slides offer the flexibility to tailor the presentation to your specific needs. With dedicated slides for stakeholder analysis, resource allocation, and timeline milestones, this template helps you keep all parties informed and aligned. Compatible with PowerPoint, Keynote, and Google Slides, the Cascade Project Plan template is your ultimate tool for professional and effective project management presentations. Get ready to impress your team and stakeholders with a well-organized and impactful presentation!


7 diapositivas
Financial Health and Budget Planning Presentation
Present your budgeting journey with clarity using the Financial Health and Budget Planning Presentation. This slide features a horizontal flow diagram with six editable steps—perfect for outlining savings strategies, expense tracking, or financial goals. Each icon-based block helps highlight key actions. Fully customizable in PowerPoint, Canva, and Google Slides.


5 diapositivas
Projects Milestone Timeline Presentation
Kickstart your story with a clean, engaging timeline that makes every achievement feel purposeful and easy to follow. This presentation helps you outline major milestones, track progress, and communicate project goals with clarity and structure. Ideal for planning, reporting, and strategy sessions. Fully compatible with PowerPoint, Keynote, and Google Slides.


22 diapositivas
Muse UX Case Study Presentation
Deliver compelling UX case studies with a sleek presentation template designed to highlight your design journey and results. Ideal for showcasing your user-centered approach, it includes dedicated slides for project overview, user research, personas, journey mapping, wireframes, prototyping, and user testing. Clearly communicate your design principles and decision-making processes with visual design elements and brand guidelines. With specific sections for feedback, accessibility considerations, and project outcomes, this template ensures every aspect of your UX process is captured in a structured and visually engaging manner. Whether you're presenting to clients, stakeholders, or design teams, this template is fully editable and compatible with PowerPoint, Google Slides, and Keynote. Its modern design and professional layout provide an effortless way to convey the value of your UX work, making a lasting impact on your audience. Tailor it to your brand, and elevate your case studies today!


5 diapositivas
Agile and Waterfall PM Models Presentation
Compare two popular project methodologies with ease using the Agile and Waterfall PM Models Presentation. This side-by-side layout highlights key differences in structure, flexibility, and delivery approach—perfect for client briefings, team onboarding, or stakeholder reviews. Fully editable in PowerPoint, Google Slides, Keynote, and Canva for seamless customization.


4 diapositivas
Lean Startup Business Model Presentation
Optimize your startup strategy with the Lean Startup Business Model Presentation. This fully customizable template simplifies key business components, including funding sources, revenue models, growth strategies, and value propositions. Designed for entrepreneurs, investors, and business analysts, this layout is available for PowerPoint, Keynote, and Google Slides, ensuring a professional, structured, and impactful presentation.