


Características


¿Tienes alguna pregunta?
Recomendar


7 diapositivas
Data Analysis Infographics Presentation Template
Data Analysis is a process used to turn raw data into information useful for decision making by users. Data that has been collected, is analyzed to answer questions, or disprove theories. Analyses include tasks such as statistical modeling and hypothesis testing. This template can be used to collect data via surveys or experiments. It is a great tool for those conducting research and analyzing data. This template allows you to create an efficient and organized data collection process using multiple methods of data collection. Graphs and statistics are available to help visualize your data.


8 diapositivas
Target Demographic Insights
Get a clear view of your audience with the Target Demographic Insights Presentation. This template uses a visual bullseye layout to highlight key demographic data through concentric circles and percentages. Ideal for marketers, brand strategists, or analysts, it helps you communicate audience segmentation and market reach effectively. Fully editable in PowerPoint, Keynote, and Google Slides.


6 diapositivas
Vision Statement Development Guide
Craft a powerful company vision with this eye-catching layout—literally. Centered around a bold visual icon, this slide helps you organize six core ideas or values that shape your future direction. It’s perfect for strategy workshops, leadership meetings, or branding sessions. Fully compatible with PowerPoint, Keynote, and Google Slides.


4 diapositivas
Target Audience Analysis Presentation
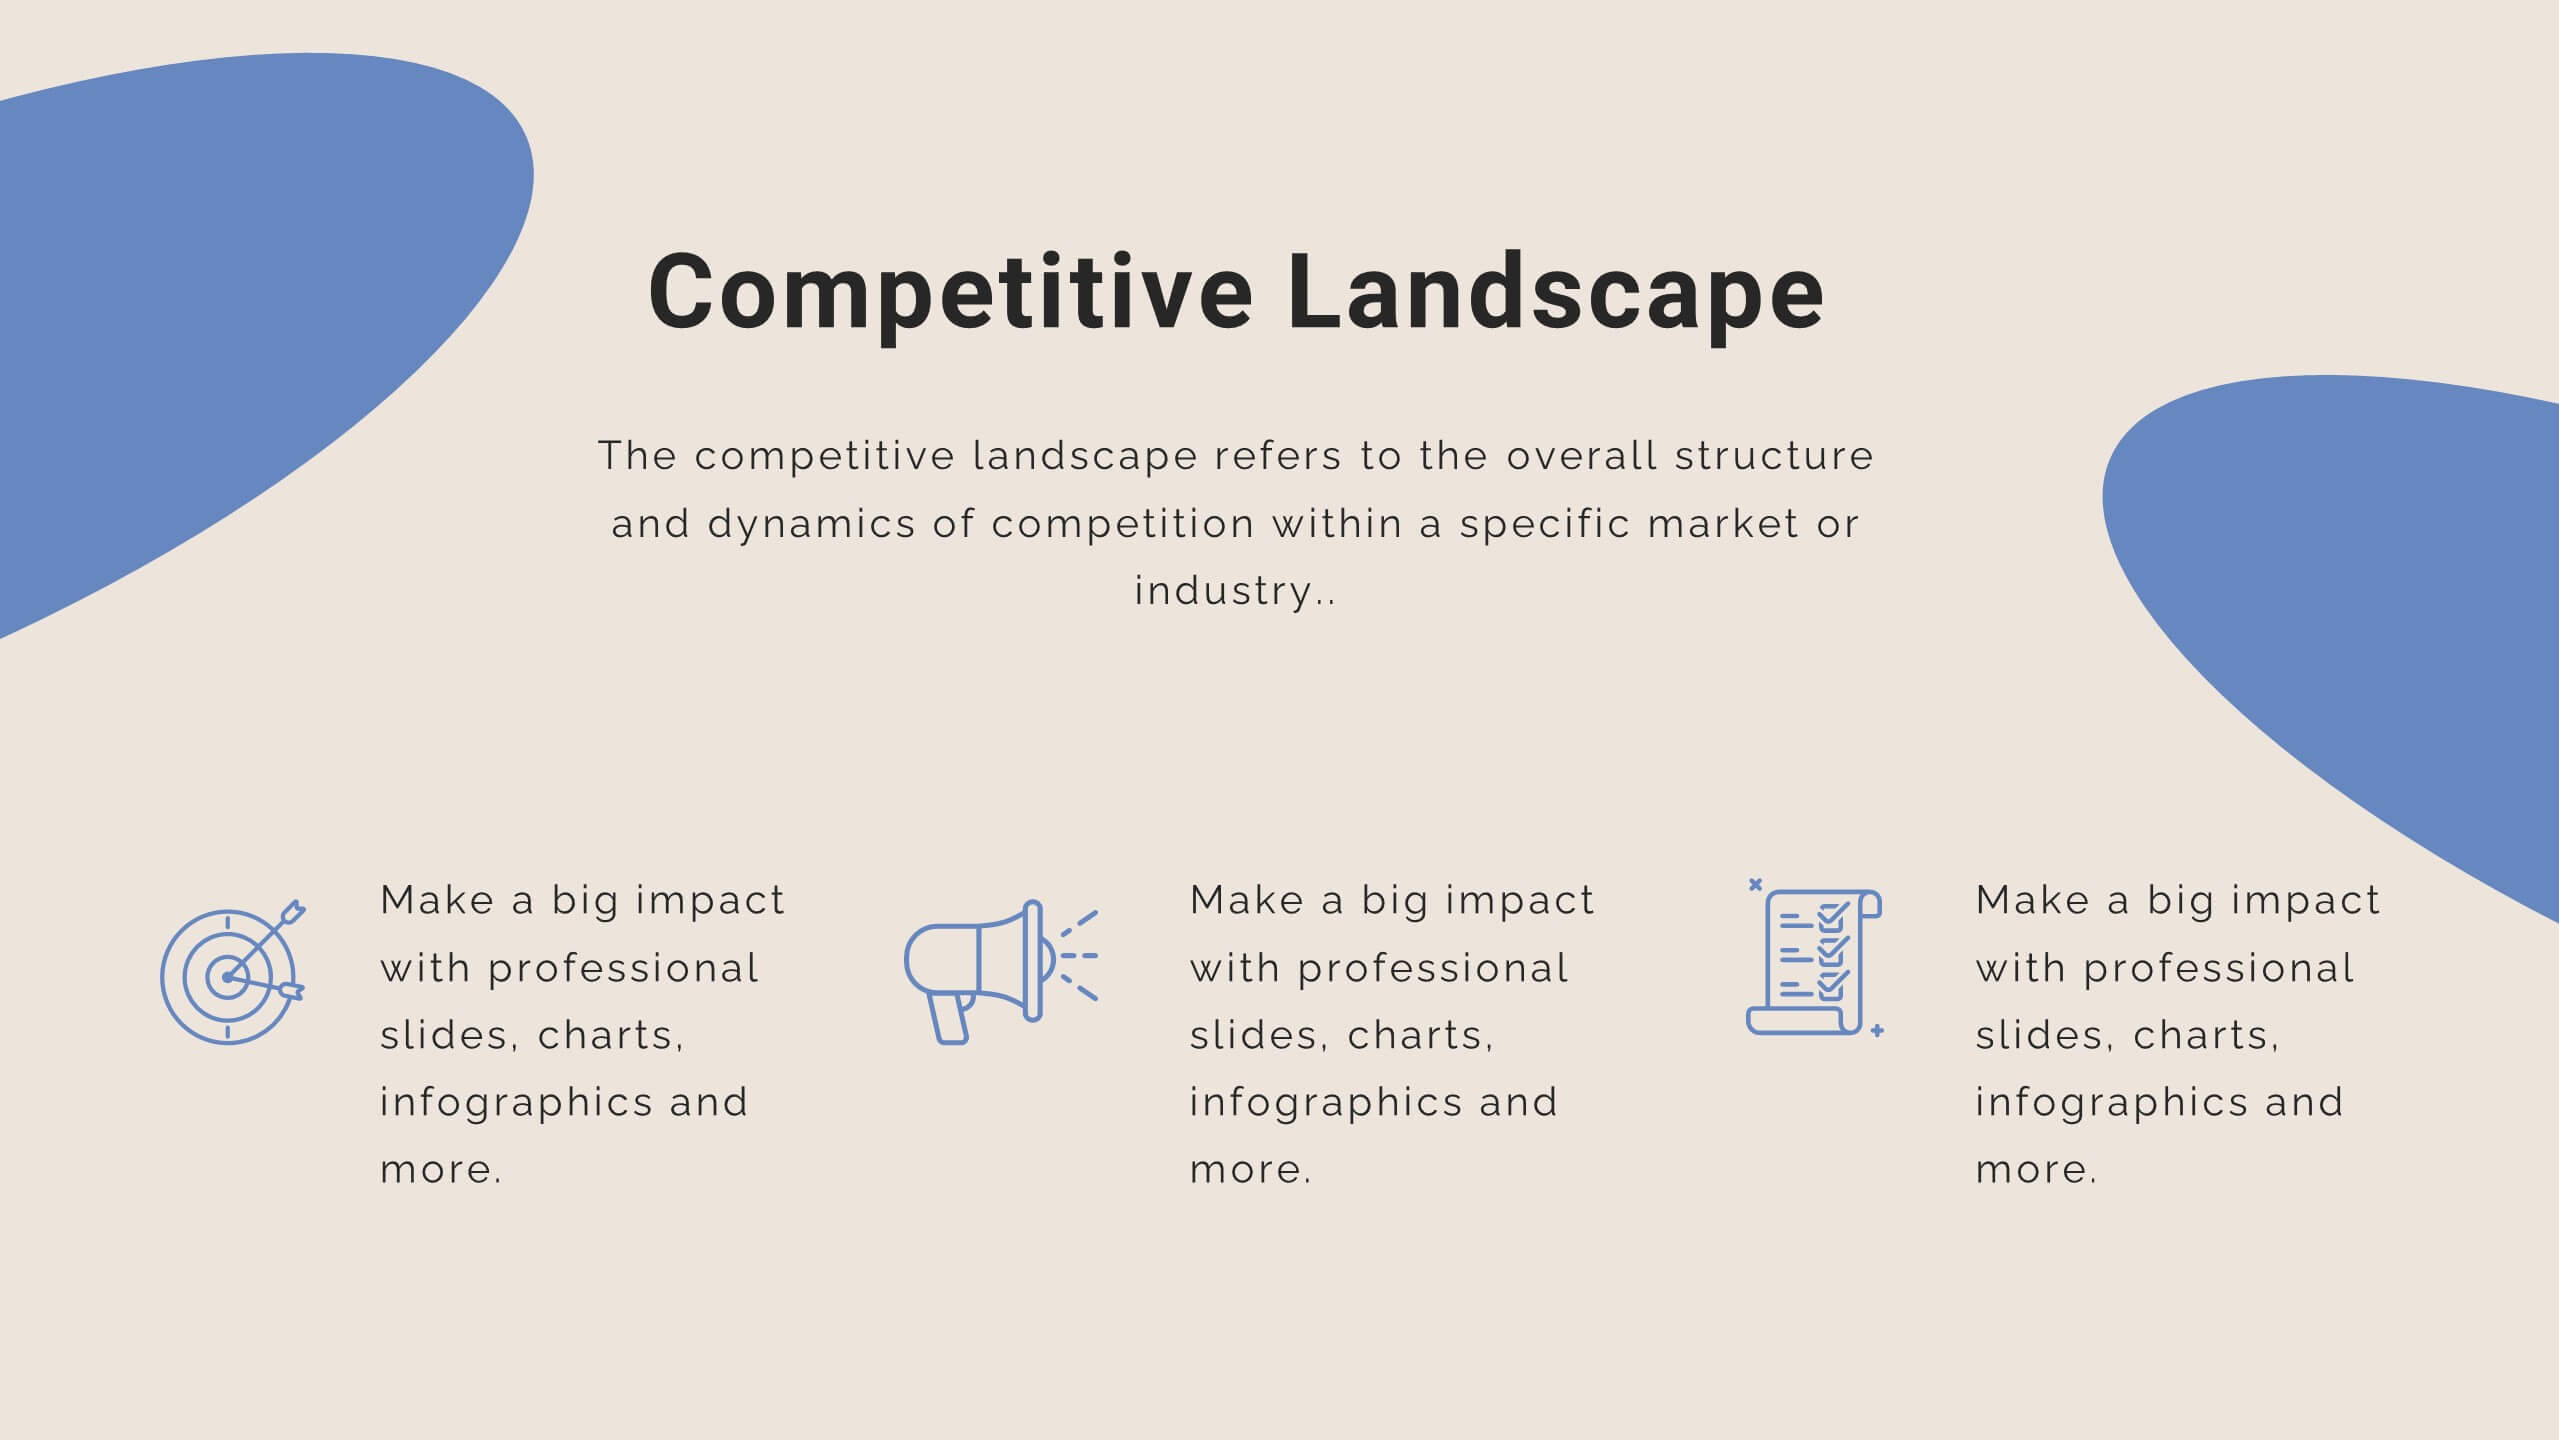
Dive deep into your market with our "Target Audience Analysis" presentation template. This design aids in visually segmenting and understanding your potential customers through demographics, behaviors, and preferences. Ideal for marketers and strategists, this template is compatible with PowerPoint, Keynote, and Google Slides, providing a clear framework to tailor your strategies effectively to different audience segments.


6 diapositivas
Aviation Safety and Efficiency Presentation
Take your audience to new heights with this modern aviation-themed infographic layout. Perfect for illustrating flight performance, safety systems, and operational improvements, it combines clarity with sleek visual flow to enhance understanding. Fully customizable and compatible with PowerPoint, Keynote, and Google Slides for effortless professional presentations.


5 diapositivas
Creative Geometric Layouts Presentation
Give your content a fresh, modern spark with bold geometric elements that guide attention and create a clean visual rhythm. This presentation helps you structure ideas clearly, highlight key sections, and maintain a polished, creative look throughout your slides. Fully editable and compatible with PowerPoint, Keynote, and Google Slides.


6 diapositivas
Organizational Goals and SMART Objectives Presentation
Align your business vision with clarity using this Organizational Goals and SMART Objectives slide. Designed to visually represent each SMART component—Specific, Measurable, Achievable, Relevant, and Time-bound—it helps communicate strategic goals in a simple and effective format. Fully editable in Canva, PowerPoint, and Google Slides for maximum flexibility.


14 diapositivas
Leadership Training Workshop
Build stronger leaders with a visually engaging puzzle-style layout that maps out each stage of leadership development. This training workshop presentation uses an intuitive, step-by-step format to guide your audience through key growth areas, making it perfect for team-building or executive sessions. Fully compatible with PowerPoint, Keynote, and Google Slides.


5 diapositivas
Leadership Styles Overview Presentation
Explore what makes great leaders stand out with this engaging and visually balanced presentation design. Perfect for outlining different management approaches, personality-driven leadership models, or team dynamics, it helps audiences grasp key insights with clarity. Fully editable and compatible with PowerPoint, Keynote, and Google Slides for effortless customization.


5 diapositivas
A to Z Slide Concept Presentation
Bring your ideas to life with a bold, block-style visual that makes complex concepts feel simple and structured. This slide is perfect for breaking down processes, frameworks, or step-by-step explanations in a clear, memorable way. Fully editable and compatible with PowerPoint, Keynote, and Google Slides.


6 diapositivas
Safety Department Infographics
Promote safety awareness with our Safety Department infographic template. This template is fully compatible with popular presentation software like PowerPoint, Keynote, and Google Slides, allowing you to easily customize it to illustrate and communicate the role and functions of a safety department within an organization. The Safety Department infographic template offers a visually engaging platform to highlight the responsibilities, goals, and initiatives of a safety department. Whether you're a safety officer, HR professional, business leader, or interested in workplace safety, this template provides a user-friendly canvas to create informative presentations and educational materials. Enhance safety practices and awareness with this SEO-optimized Safety Department infographic template, thoughtfully designed for clarity and ease of use. Customize it to showcase safety protocols, training programs, incident reporting, and the importance of a safety-focused culture, ensuring that your audience understands the critical role of the safety department. Start crafting your personalized infographic today to promote a safer work environment.


4 diapositivas
Harvey Ball Chart Business Analysis
Simplify your data-driven storytelling with this Harvey Ball chart slide—perfect for consultants, analysts, and strategy teams. Visualize percentage-based insights across four categories using clean, easy-to-read circular progress visuals. Fully editable in PowerPoint, Keynote, and Google Slides to match your branding and message.


4 diapositivas
Fixed and Variable Cost Balance Presentation
Visualize cost distribution using a balanced scale metaphor. This presentation helps compare fixed and variable costs with editable sections for data input. Ideal for financial planning, budgeting, or cost control analysis. Fully customizable in PowerPoint, Keynote, and Google Slides to match any brand or business presentation style.

22 diapositivas
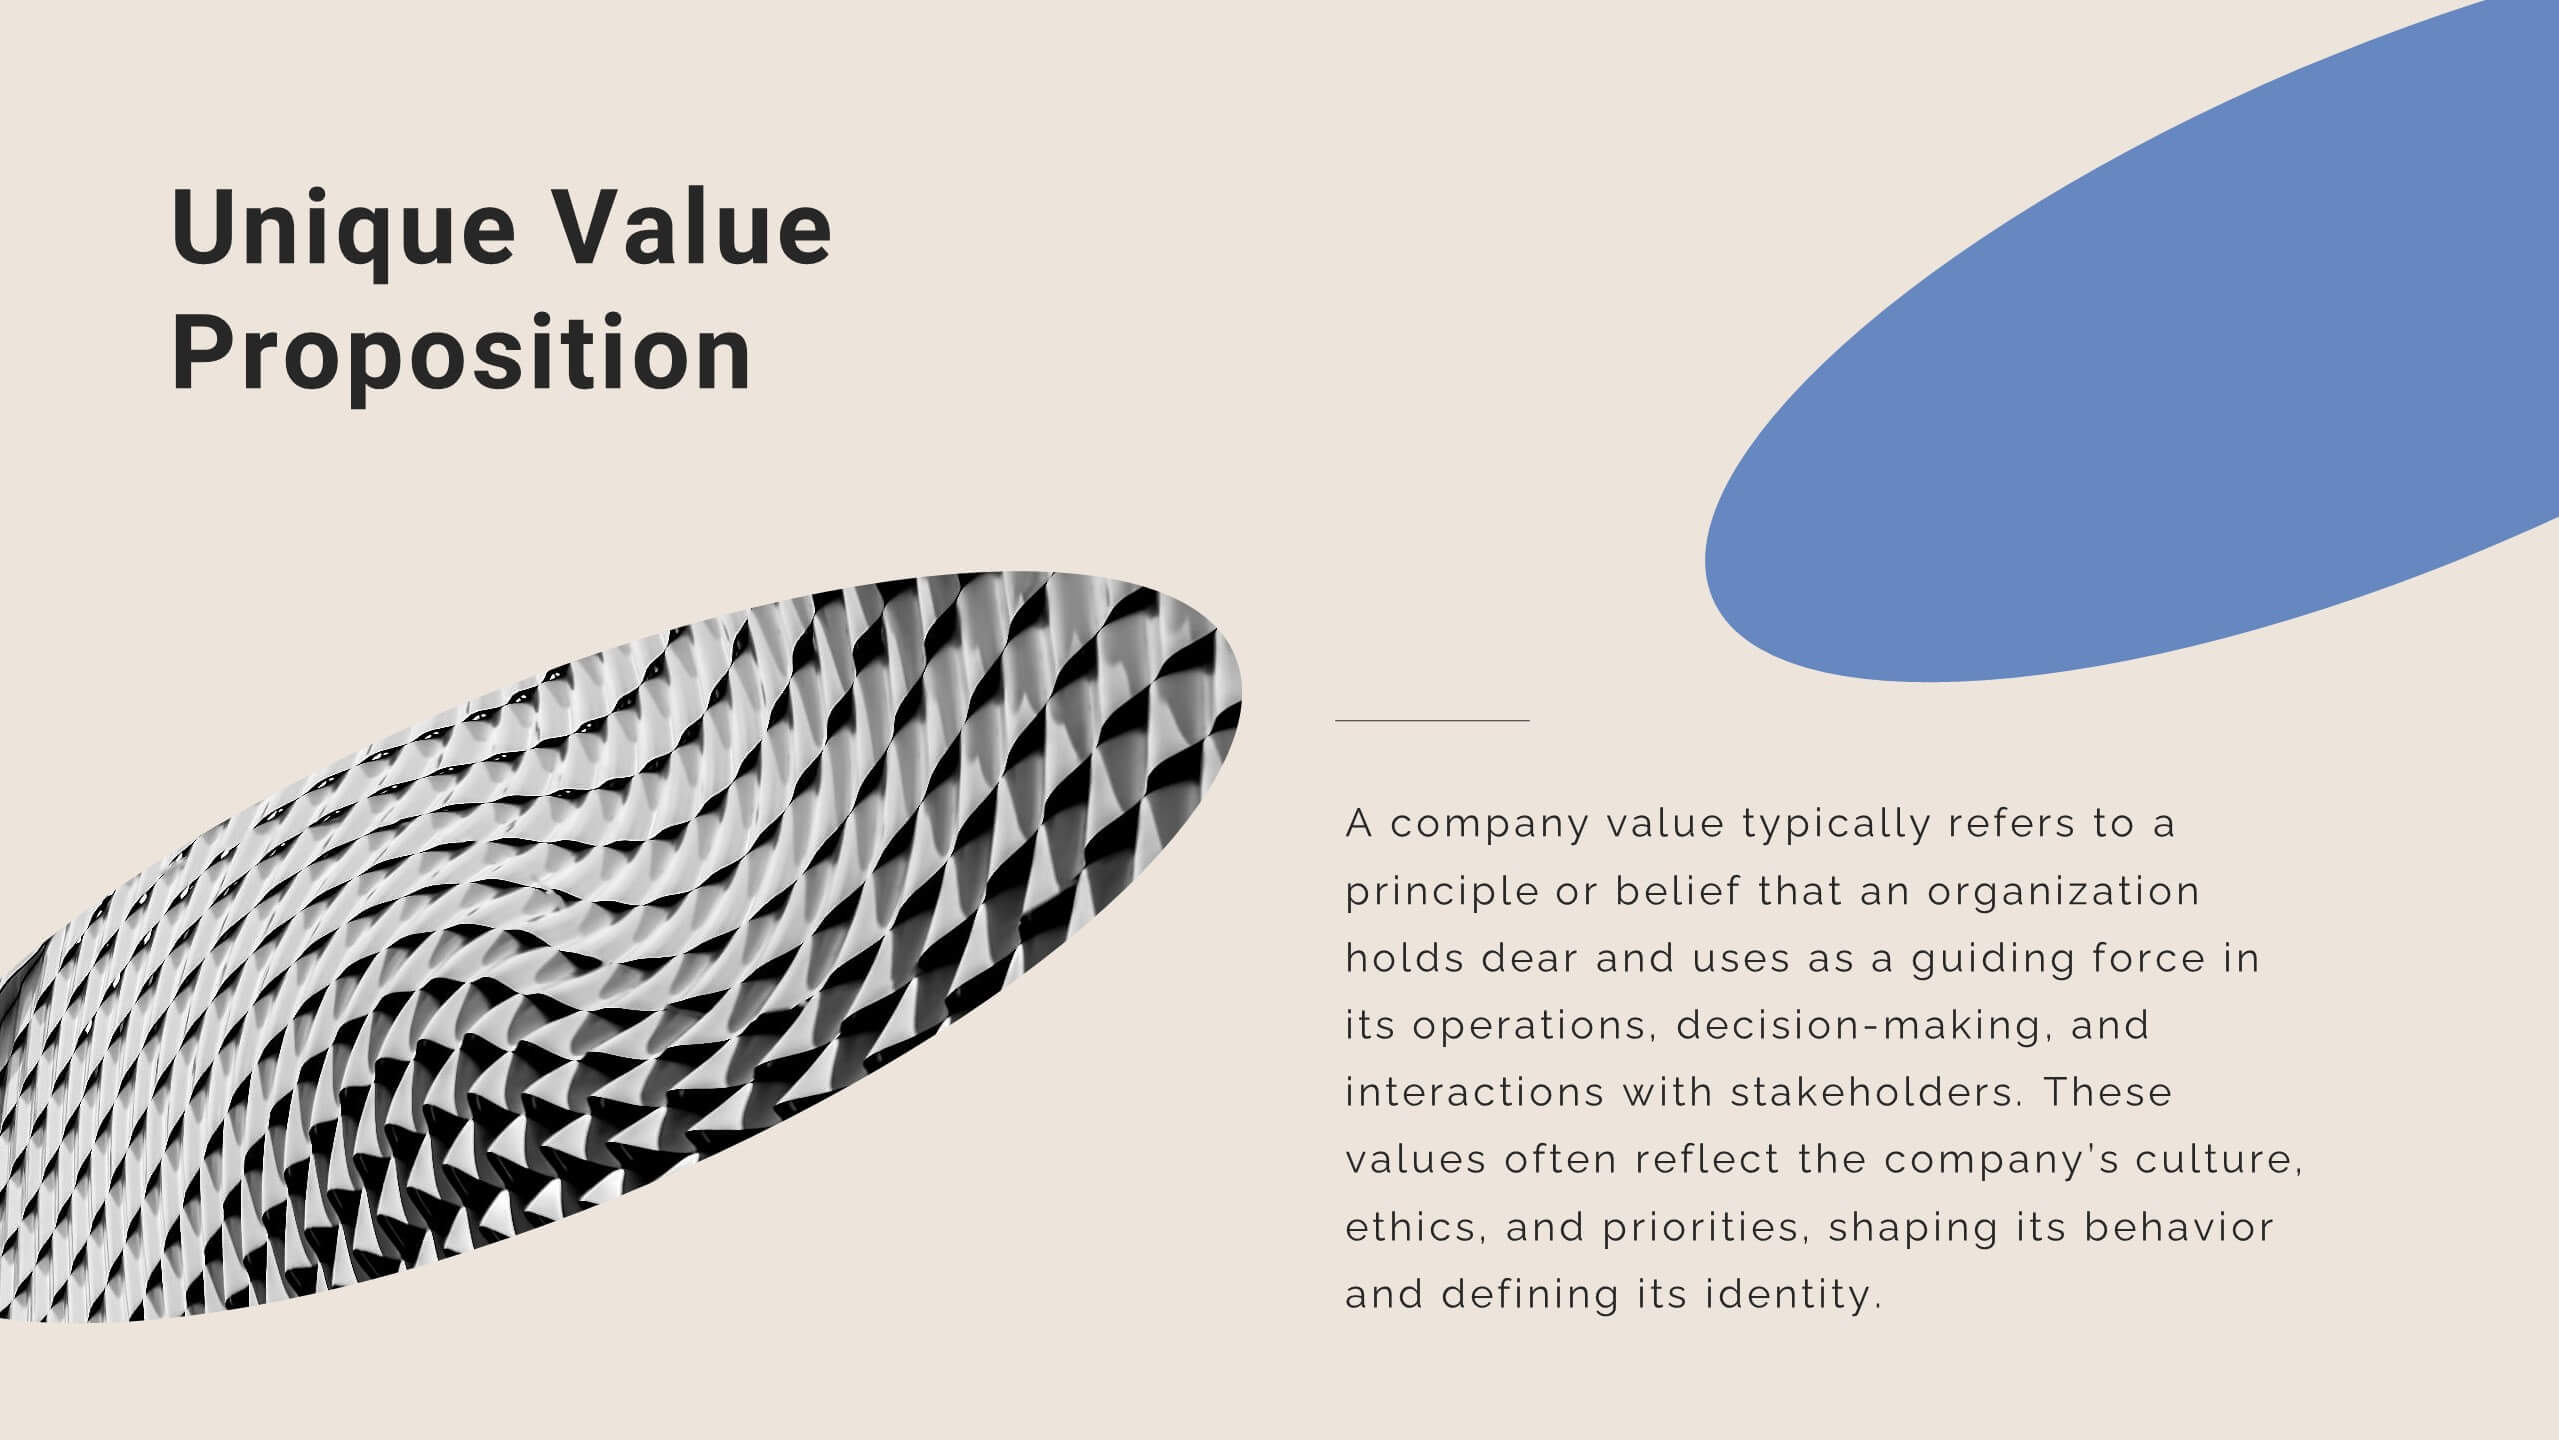
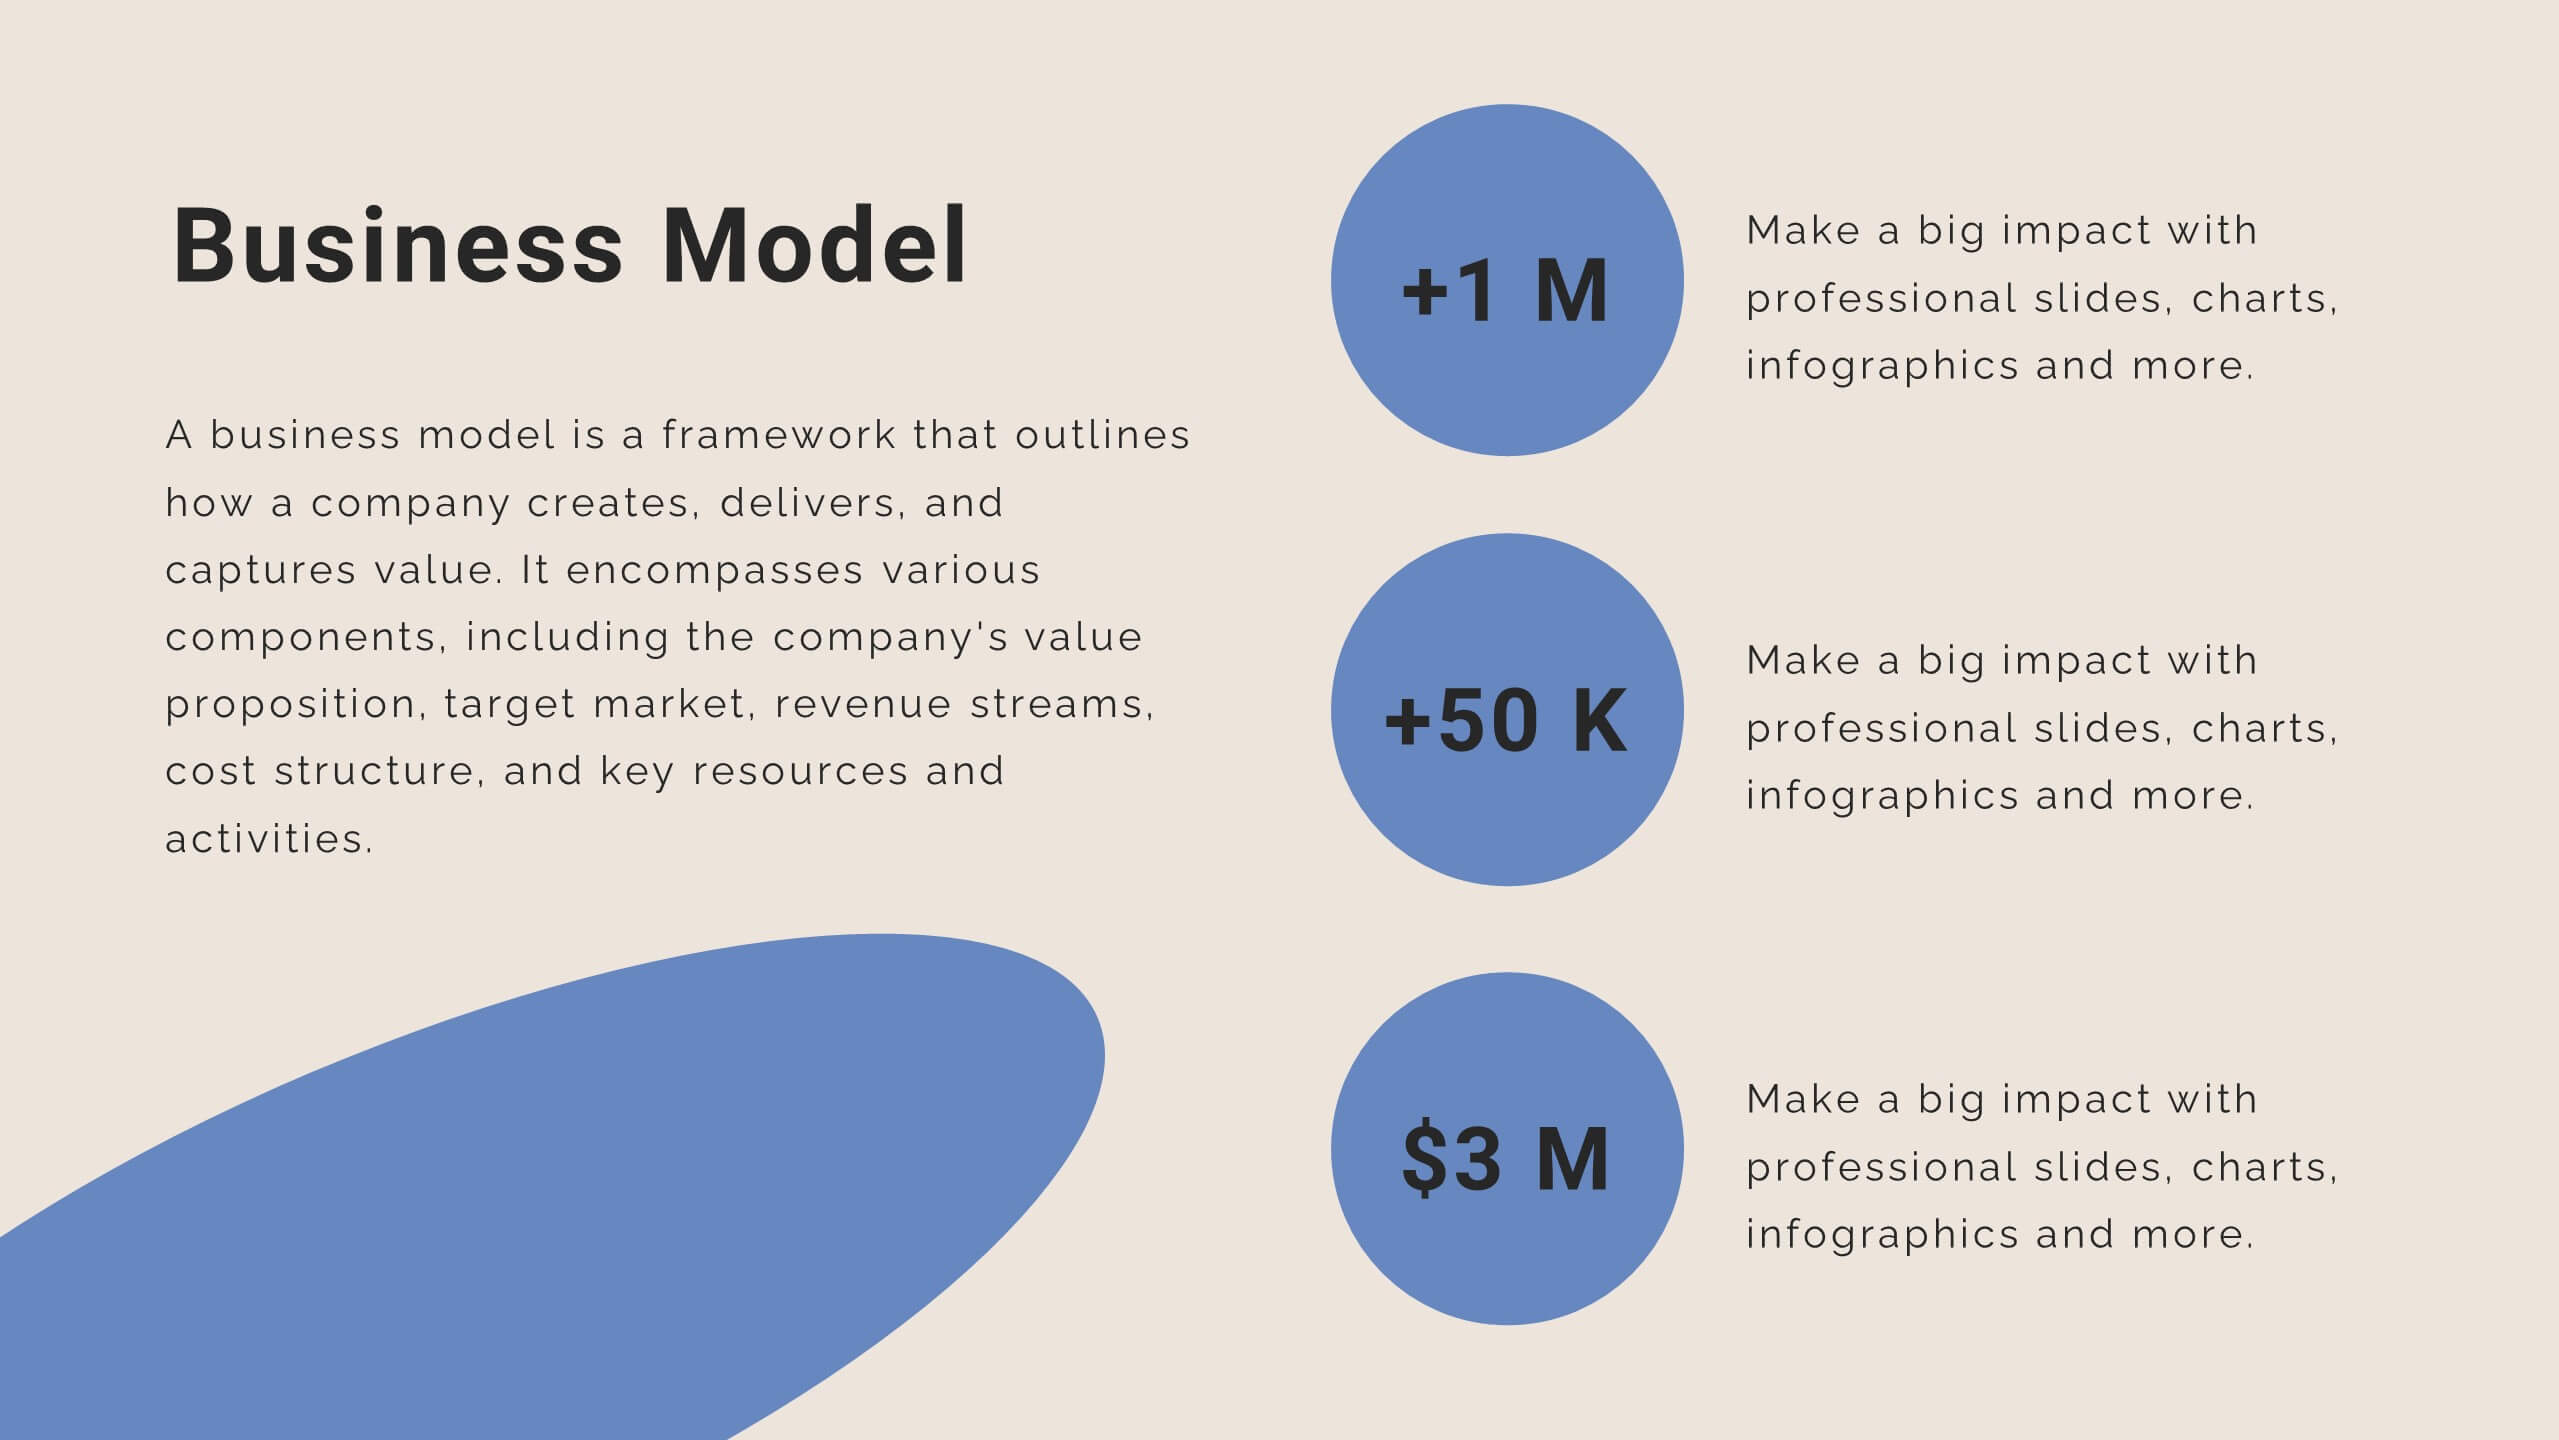
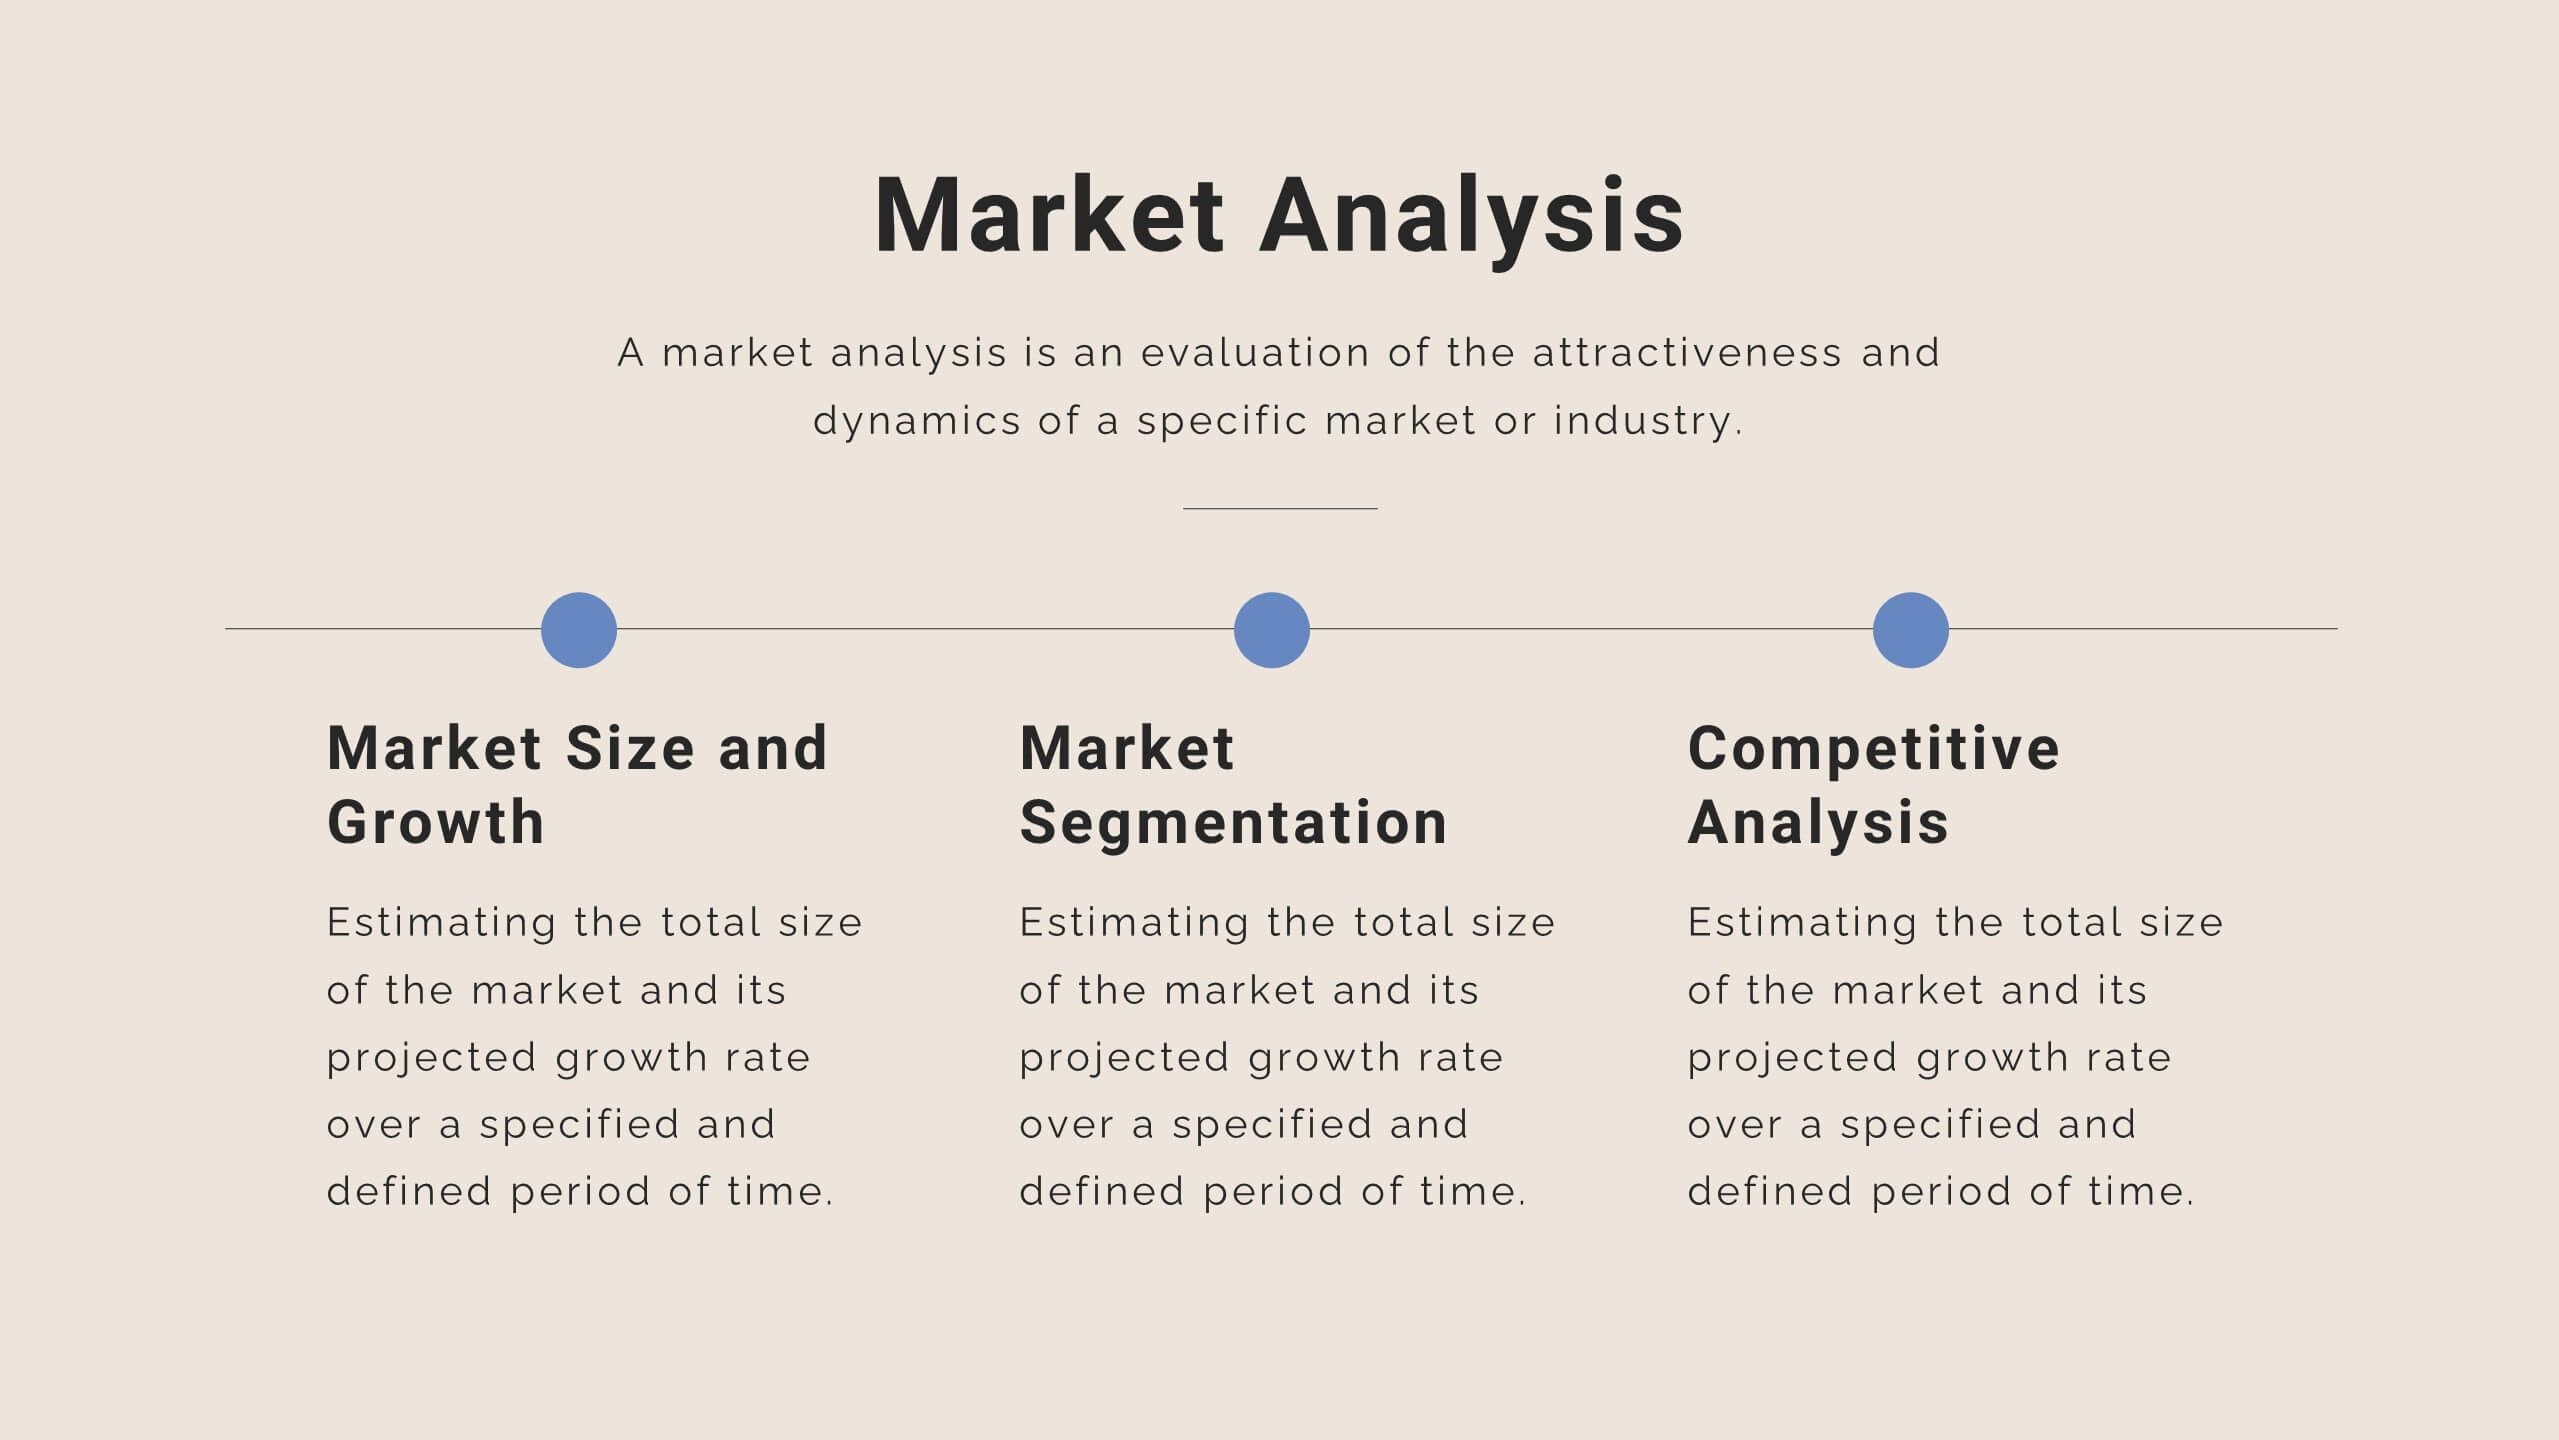
Mystic Startup Strategy Presentation
Launch your startup with confidence using this comprehensive funding proposal template! Perfect for showcasing your mission, vision, and business model to potential investors. Highlight your unique value proposition and growth plan with style. Compatible with PowerPoint, Keynote, and Google Slides, this template ensures your pitch stands out and secures the funding you need.


6 diapositivas
Internal and External Communication Plan
Visualize your communication strategy with this dual-channel megaphone infographic, perfect for showcasing internal and external messaging flows. Ideal for corporate updates, PR plans, or stakeholder communications. Fully editable in PowerPoint, Keynote, and Google Slides.


4 diapositivas
Decision Analysis Framework Presentation
Make every choice smarter with this structured and visually balanced template designed to showcase options, outcomes, and key insights. Ideal for strategy meetings or data-driven reports, it helps you present decisions with confidence and clarity. Fully editable and compatible with PowerPoint, Keynote, and Google Slides for seamless customization.


5 diapositivas
Teenage Suicide Awareness Infographics
Teenage suicide is a serious public health concern that requires awareness and attention. These vertical infographics are designed to raise awareness about teenage suicide, its risk factors, and prevention strategies. The goal of these infographics is to educate the audience, including parents, educators, and community members, about the importance of early intervention, mental health support, and creating a supportive environment for teenagers. The design elements included are carefully chosen to evoke empathy, compassion, and understanding. Fully customizable and compatible with Powerpoint, Keynote, and Google Slides.