


Características


¿Tienes alguna pregunta?
Recomendar


7 diapositivas
Cryptocurrency Prices Infographic
Cryptocurrency prices refer to the current or historical values of various cryptocurrencies in terms of a specific fiat currency or other cryptocurrencies. This infographic template is a visual journey into the ever-fluctuating world of digital currencies. This template serves as your gateway to understanding the trends and values of cryptocurrencies, empowering you to make informed decisions in this exciting financial realm. Compatible with Powerpoint, Keynote, and Google Slides. Use this infographic to easily present major cryptocurrencies as celestial bodies, emphasizing the vastness and potential of the crypto universe.


4 diapositivas
Root Cause Analysis for Problem Solving
Tackle problems from the inside out with this structured and easy-to-follow layout. This root cause analysis template helps you clearly map out underlying issues and visualize their impact in one slide. Ideal for team discussions, audits, and presentations—fully editable in PowerPoint, Keynote, and Google Slides for maximum flexibility.


4 diapositivas
Restaurant Menu Design Showcase Presentation
Showcase your food offerings with this stylish Restaurant Menu Design Template. Divided into clear sections—Menu, Drinks, and Desserts—it’s perfect for restaurants, cafés, or pop-up events. Fully editable in PowerPoint, Keynote, and Google Slides, this layout lets you present items cleanly with bold titles and organized structure for easy viewing.


4 diapositivas
Business Strategy Alternatives Presentation
Present and compare strategic choices effectively with the Business Strategy Alternatives Presentation template. Designed to highlight key decision points, competitive advantages, and alternative approaches, this slide is ideal for business strategy discussions, market positioning, and executive planning. Fully customizable for PowerPoint, Keynote, and Google Slides to fit your presentation needs.


4 diapositivas
Sustainable Farming Practices Presentation
Explore the essentials of sustainable farming with our visually engaging presentation template. Perfect for educational and advocacy purposes, it outlines key practices that promote environmental sustainability in agriculture. This template features easy-to-understand graphics and placeholders for comprehensive discussions on eco-friendly farming techniques.


8 diapositivas
Machine Learning Overview Presentation
The "Machine Learning Overview" presentation template features a central circular design that effectively illustrates the interconnectedness of various components in machine learning processes. Each segment of the circle is dedicated to a key area such as data acquisition, algorithm development, model training, validation, and deployment, which are critical to understanding and executing machine learning projects. This visual arrangement makes it easy to follow and is ideal for educational environments or professional settings where clarity and concise information delivery are essential.


6 diapositivas
Pathway and Options Framework Analysis Presentation
Navigate your business strategy with clarity using the Pathway and Options Framework Analysis Presentation. This slide features a horizontal hexagon progression that visually maps out five distinct stages or decision points. Ideal for illustrating phased development, strategic alternatives, or milestone-based planning. Each segment includes an icon and customizable title area for key data points. Use this clean, modern layout to engage stakeholders or clarify complex processes. Fully editable in PowerPoint, Keynote, and Google Slides.


5 diapositivas
Competitor Comparison Infographics
A Comparison Infographic is a type of visual representation that displays the similarities and differences between two or more items, concepts, or ideas. This template is perfect to help viewers easily make informed decisions based on the comparison. These infographics are visual representations of data that are used to compare two or more things. These infographics can be used to highlight the differences or similarities between different products, services, companies, or any other entities that can be compared. Included are charts, graphs, tables, and other visual elements to help present information in a clear manner.


6 diapositivas
Porter's Five Forces Management Infographic
Porter's Five Forces is a framework, that helps businesses understand the attractiveness and profitability of an industry by examining five key forces that shape its competitive landscape. These infographic templates provide a visually appealing and concise overview of Porter's Five Forces framework. They are designed to help businesses and professionals analyze the competitive dynamics of an industry and make informed strategic decisions. By using this to help your audience understand the forces that shape industry competitiveness, they can identify potential threats and opportunities to make informed decisions, and gain a competitive edge.


5 diapositivas
Budget Planning Finance Presentation
Visualize your financial strategy with this Budget Planning Finance Presentation. Featuring four plant pot icons representing different funding stages, this design helps highlight growth potential and budget allocation. Ideal for financial planning, investment proposals, and expense reports. Customize the text, colors, and icons easily in PowerPoint, Keynote, or Google Slides. Perfect for finance teams, consultants, and business managers.


7 diapositivas
Simple Schedule Infographic
Effortlessly structure your time with our simple schedule infographic. Rendered in a clean white canvas, enhanced with dependable blue tones and anchored with timeless black, our template is the epitome of clarity and organization. Equipped with streamlined infographics, universal icons, and adaptable image placeholders, it facilitates easy time management and daily planning. Seamlessly tailored for Powerpoint, Keynote, or Google Slides. A fundamental tool for project managers, event planners, educators, or any professional aiming to efficiently allocate their time. Plan with ease; let every slide bring order to your daily chaos.


6 diapositivas
Digital Mockup Infographic
This collection of digital mockup templates is expertly designed to showcase your digital products and services with clarity and impact. Whether you are presenting an app, website, or any other digital interface, these templates provide the perfect backdrop, illustrating how your designs perform across different devices such as smartphones, tablets, and desktop computers. The clean, modern aesthetic of each mockup is coupled with a user-friendly layout that emphasizes ease of use and visual appeal. The subtle color palettes and strategic use of space ensure that your product stands out, making these mockups a valuable tool for professionals in software development, digital marketing, and graphic design. Customizable elements allow you to adapt each template to fit your specific project needs, making it straightforward to insert your own screenshots and text. Use these mockups in client presentations, marketing materials, or portfolio showcases to communicate the functionality and aesthetics of your digital products effectively.


8 diapositivas
Travel Planning and Itinerary Overview Presentation
Pack your bags—this stylish template makes mapping adventures a breeze! Designed for trip overviews and itinerary planning, it includes world maps, must-see lists, weather forecasts, and schedules all in one layout. Perfect for travel agencies, bloggers, or wanderlust planners. Fully compatible with PowerPoint, Keynote, and Google Slides for easy customization.


7 diapositivas
Half Year Survey Results Infographic
Evaluating progress mid-year is essential for adapting and thriving. Our half-year survey results infographic, painted in vibrant hues of orange and blue, transforms raw data into visually appealing insights. Whether it's customer feedback, employee performance, or market trends, this template makes understanding findings both effortless and impactful. Ideal for business managers, data analysts, market researchers, and educators, it's designed to communicate complex survey results in an easily digestible manner. Fully compatible with PowerPoint, Keynote, and Google Slides, it's your companion for dynamic presentations that resonate and inform.


27 diapositivas
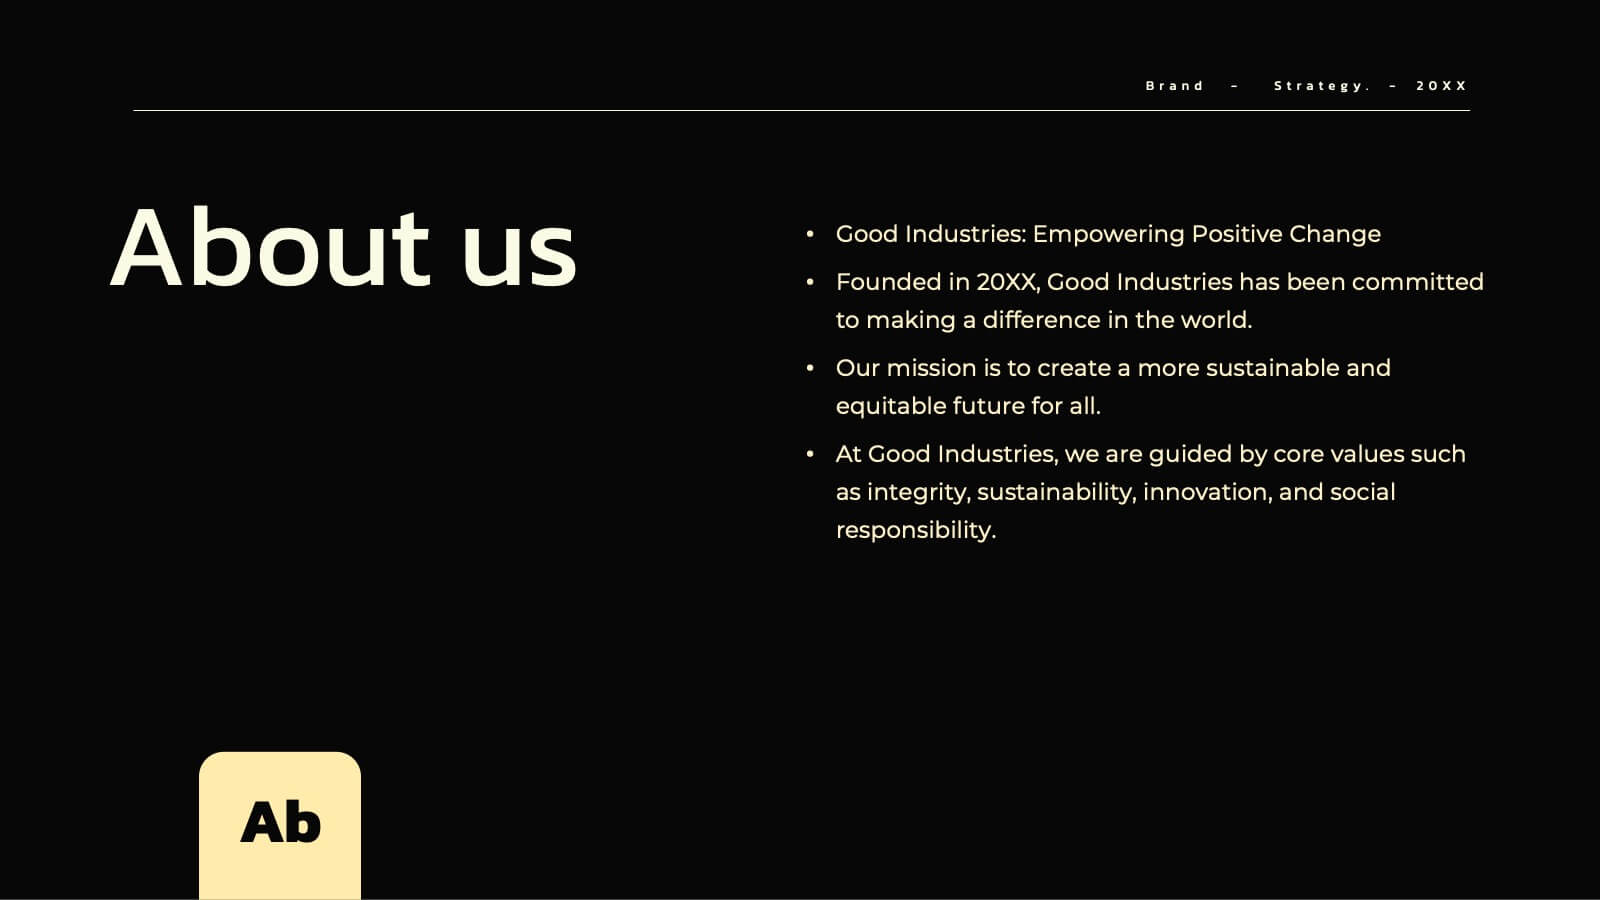
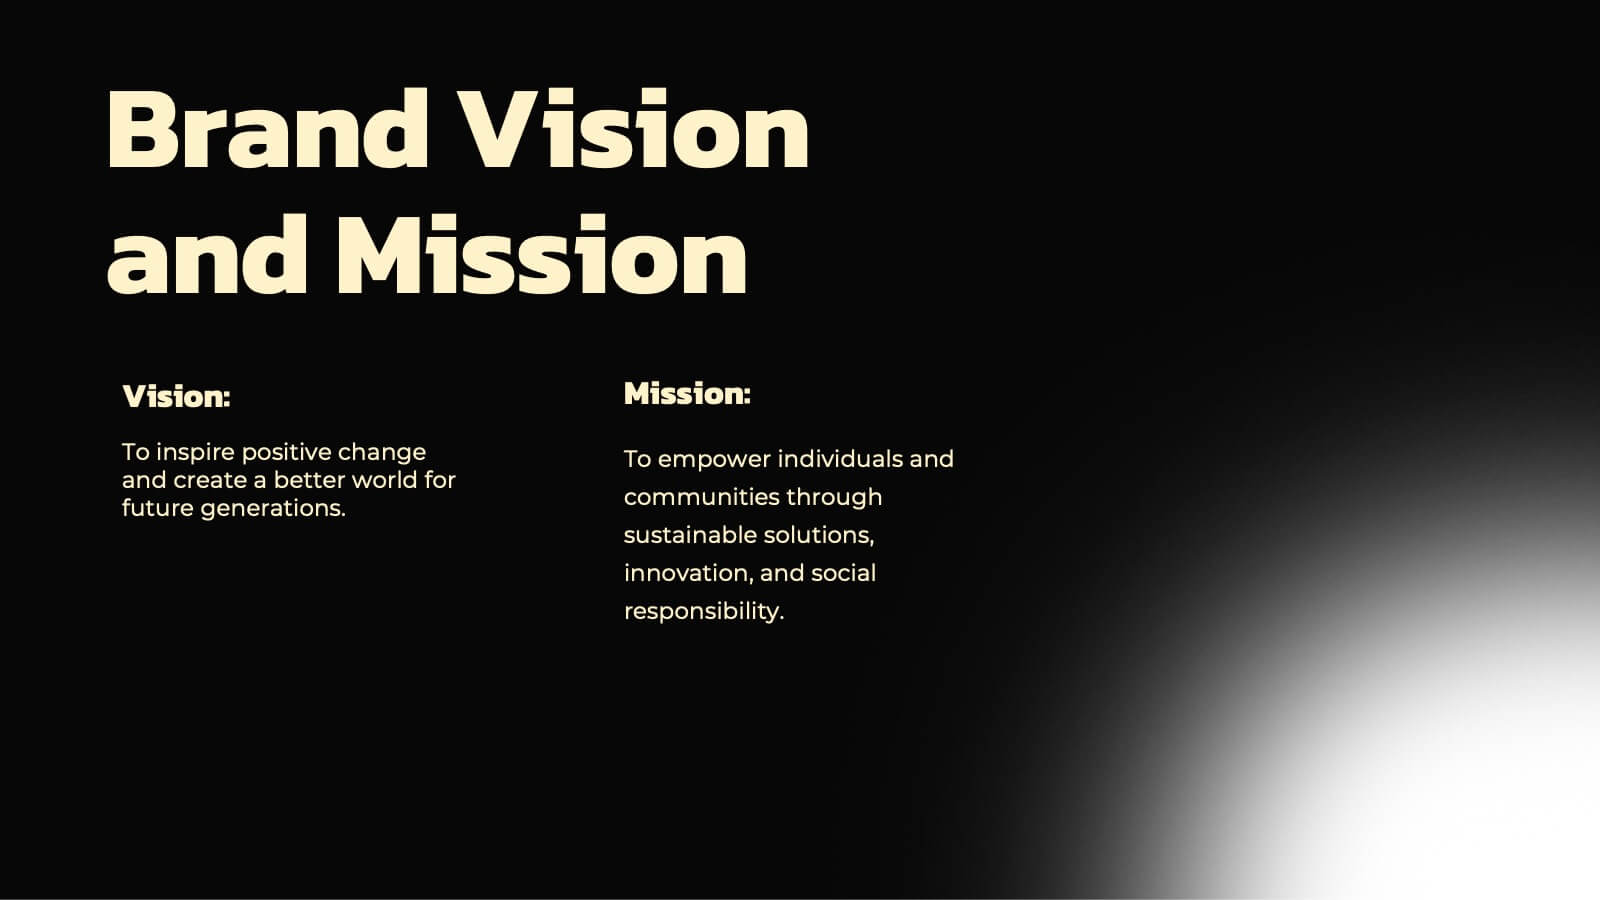
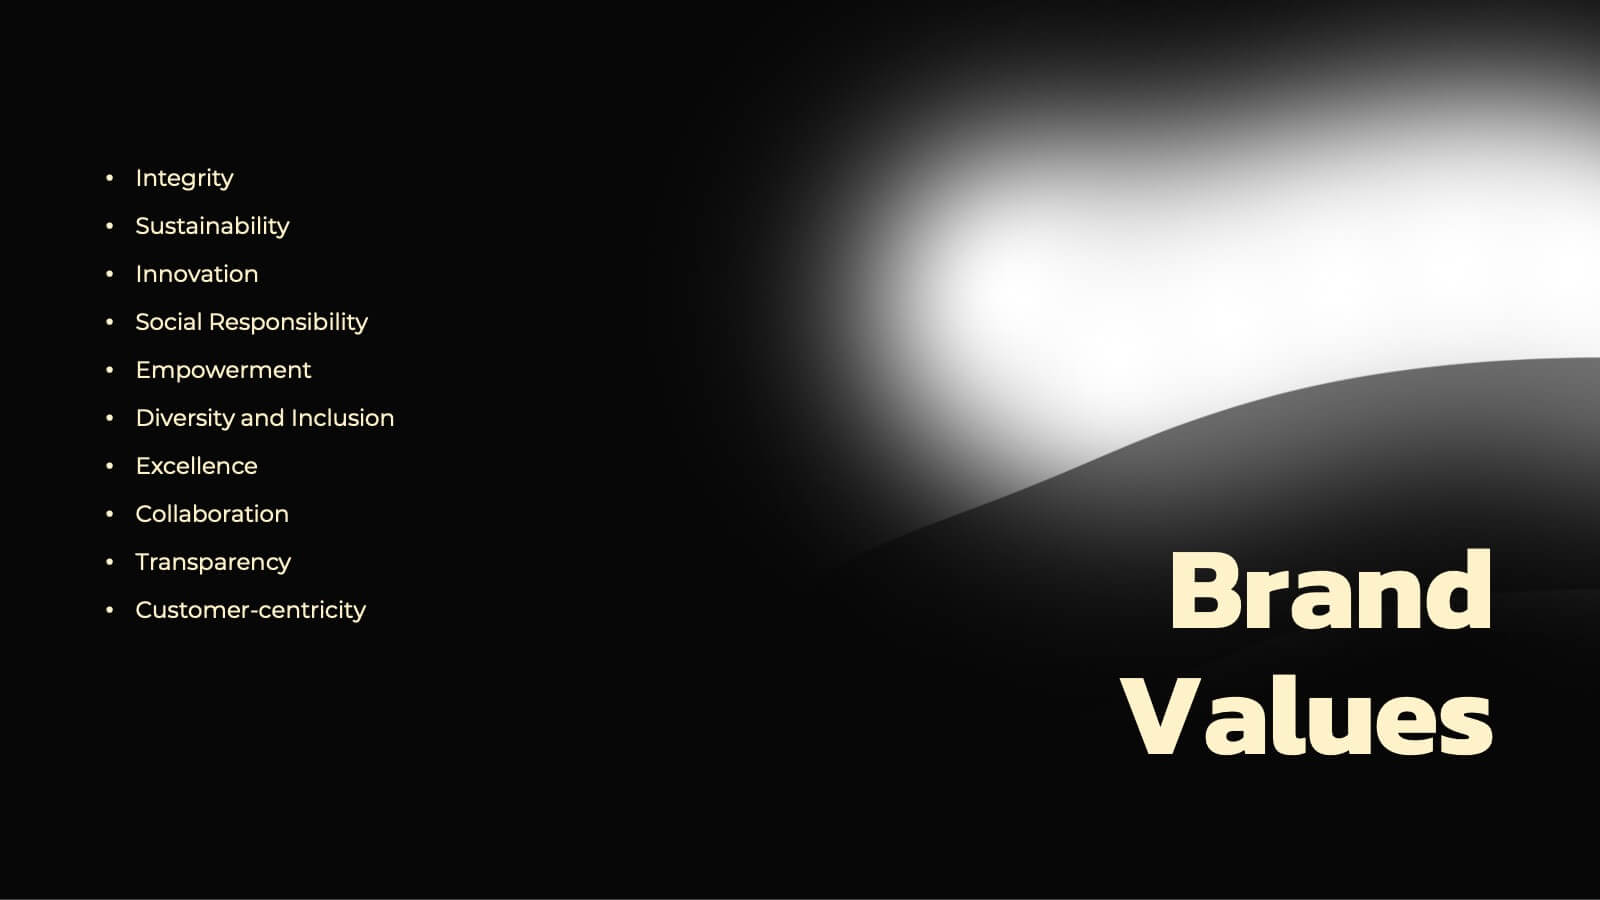
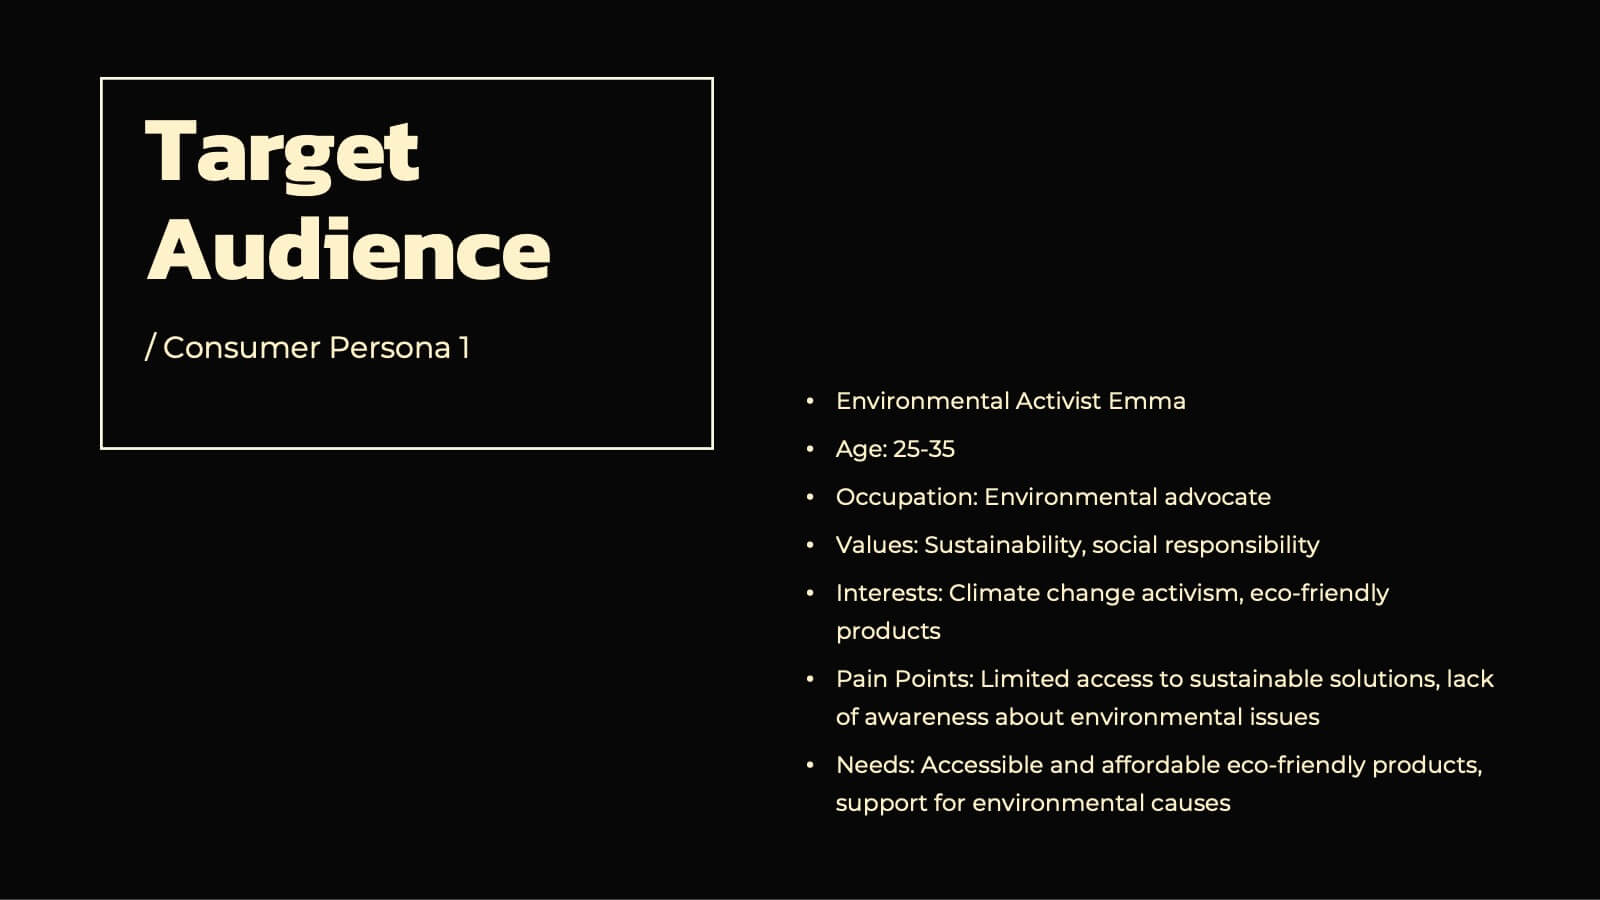
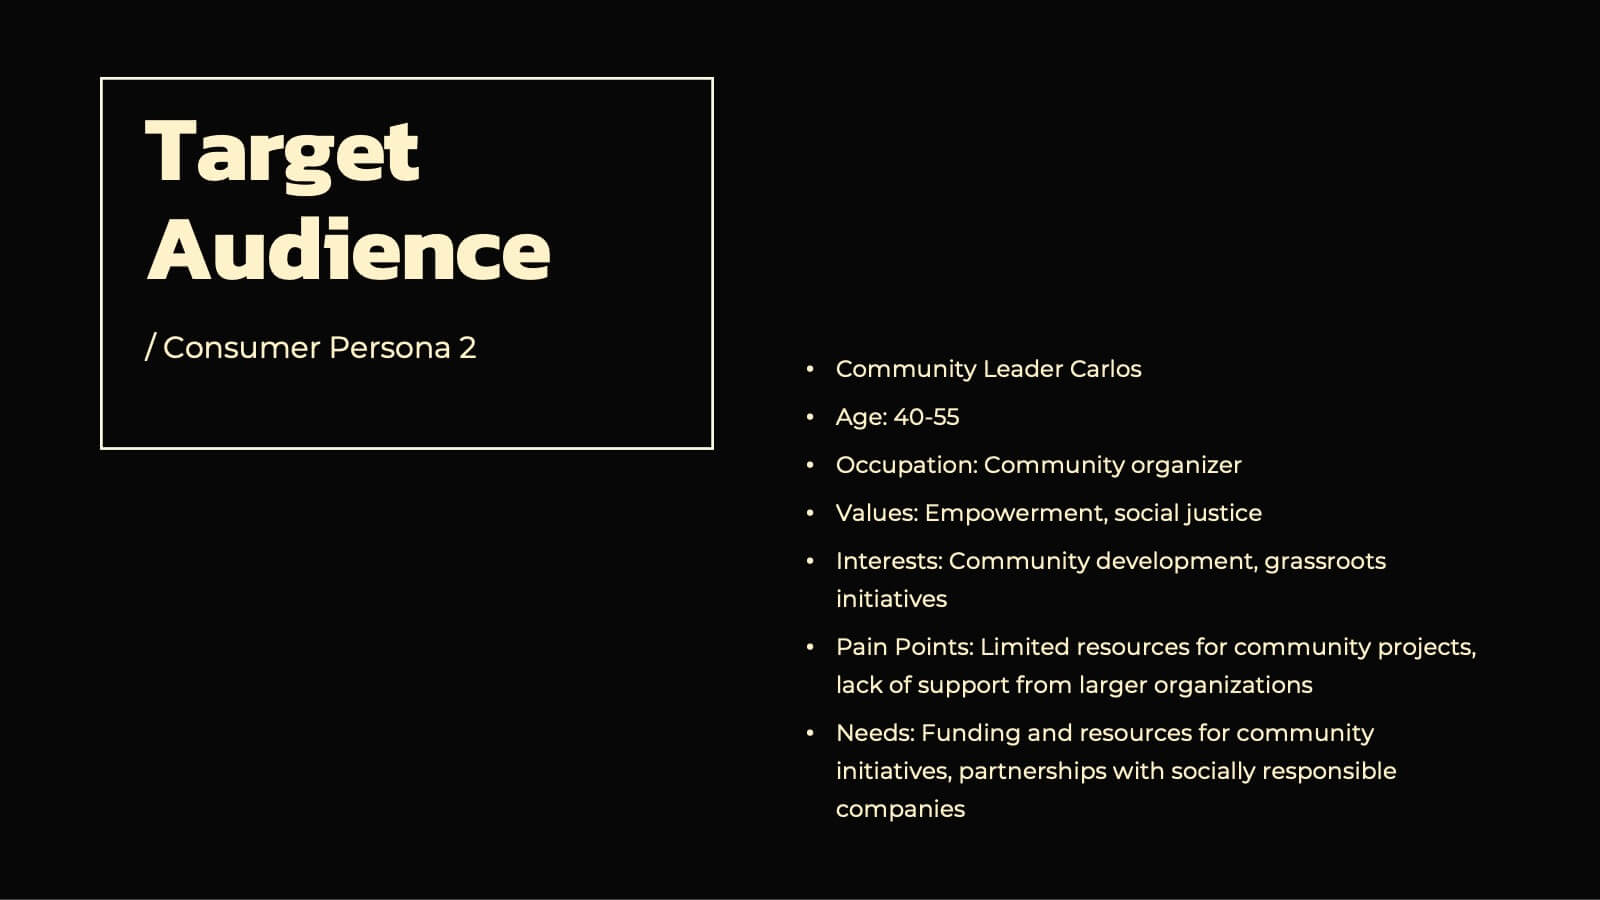
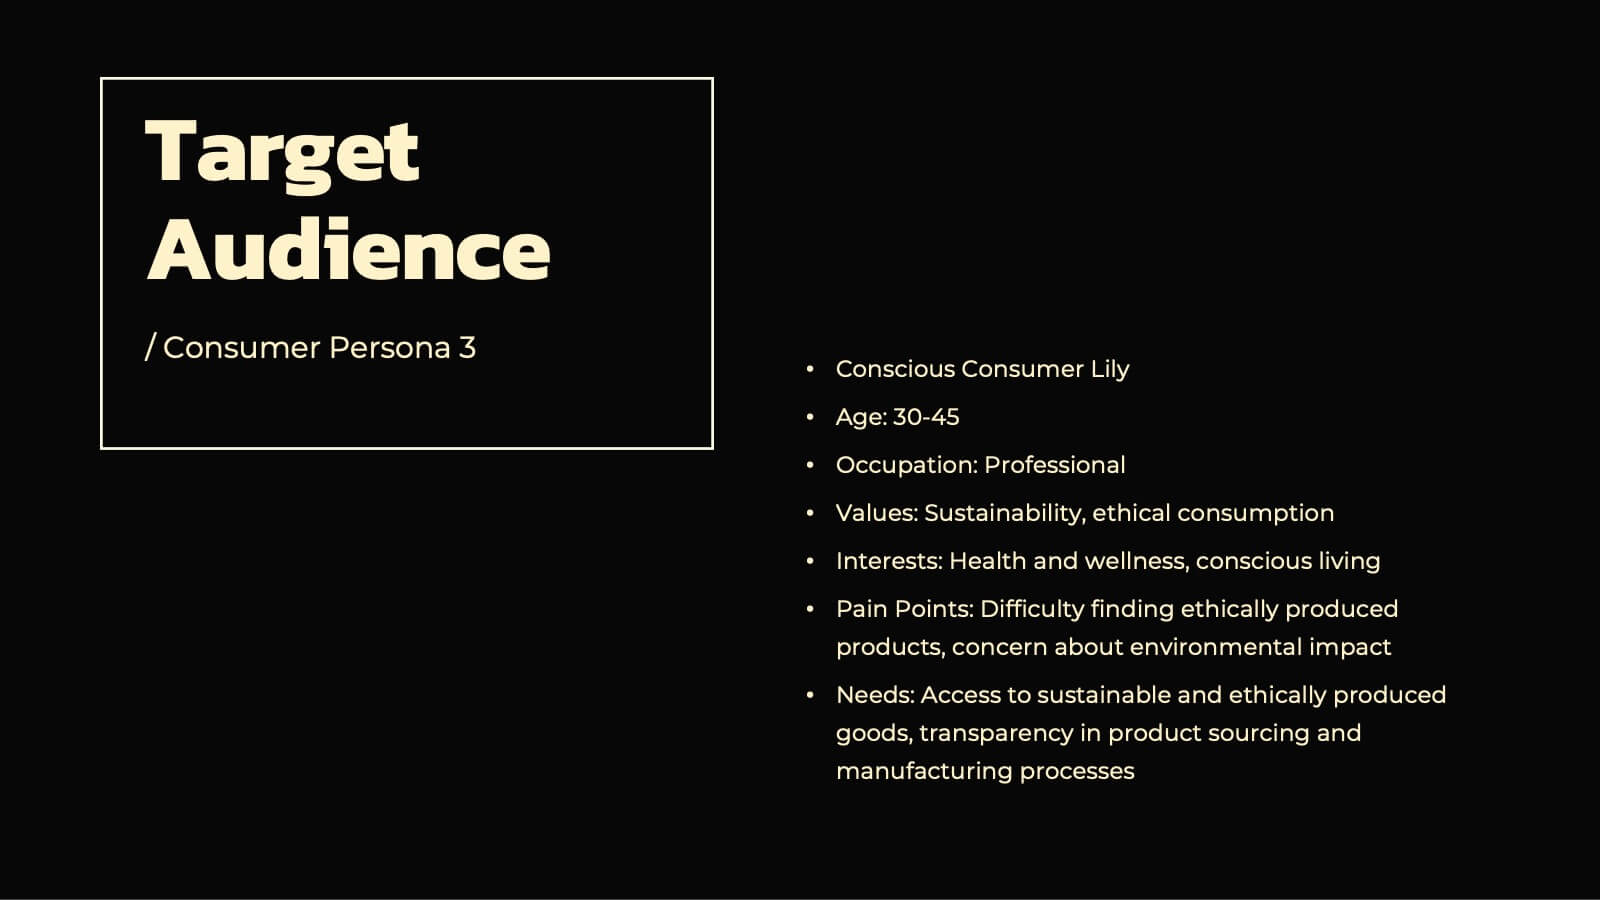
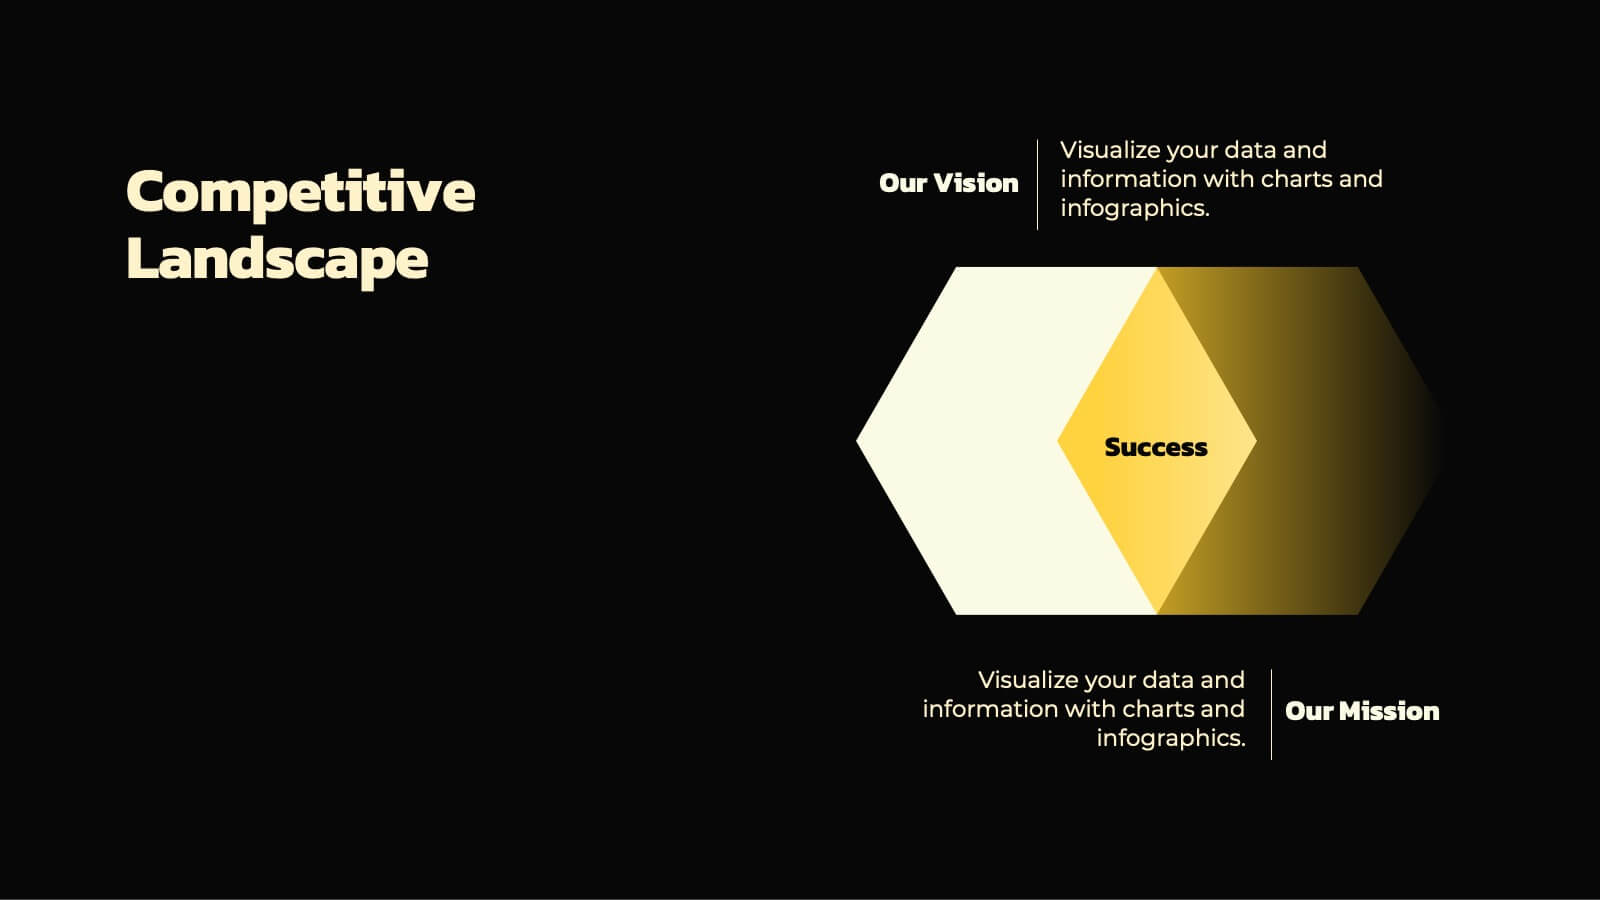
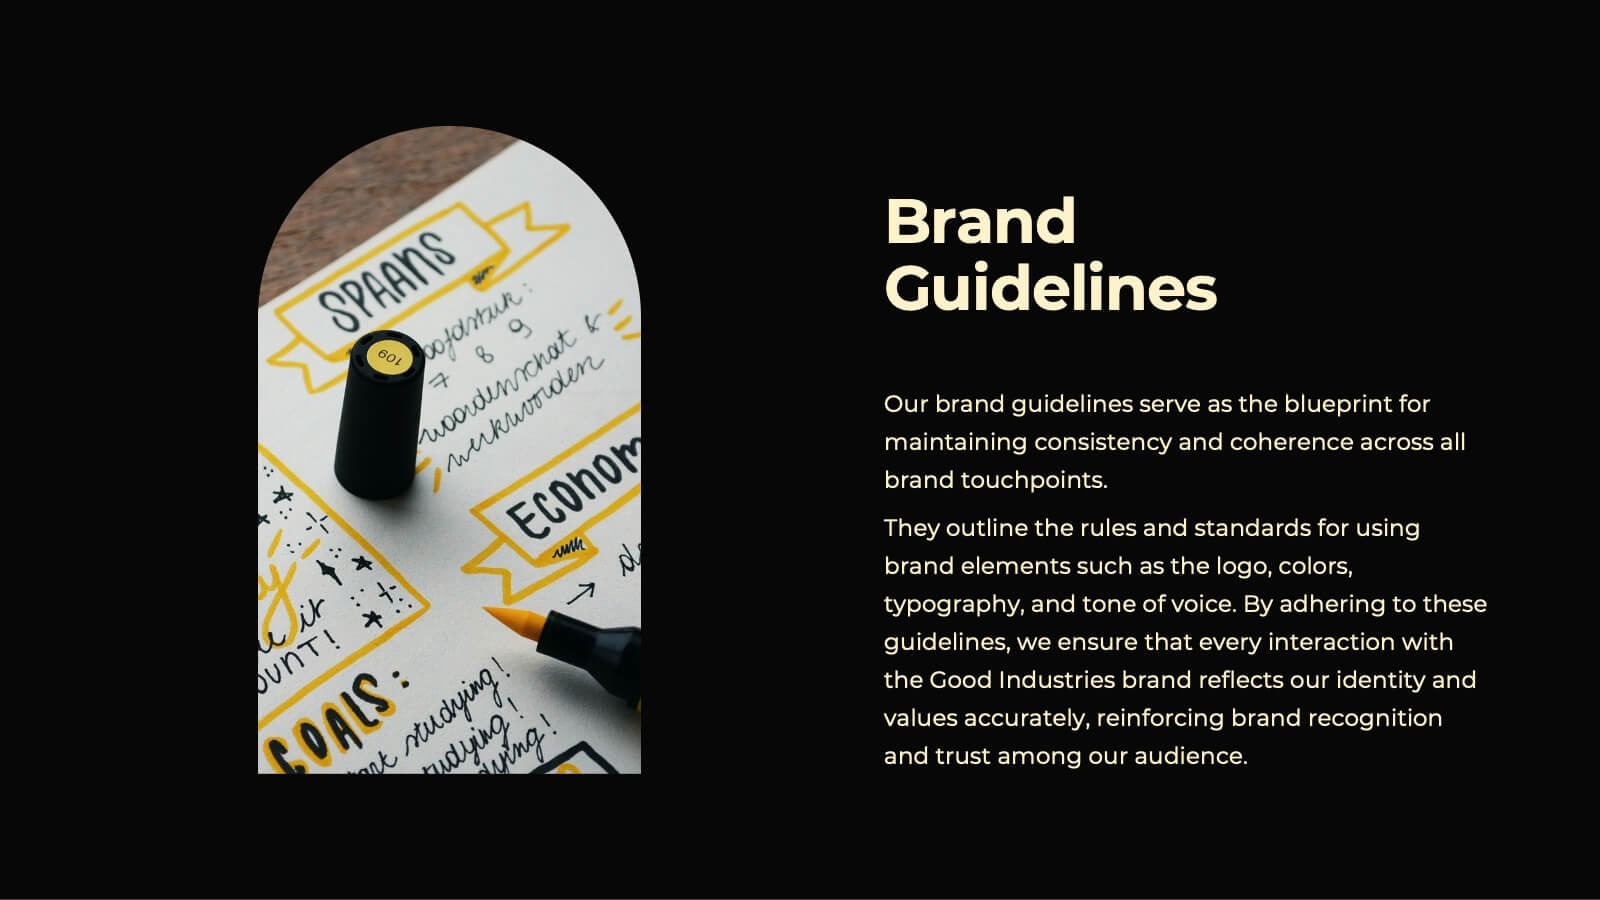
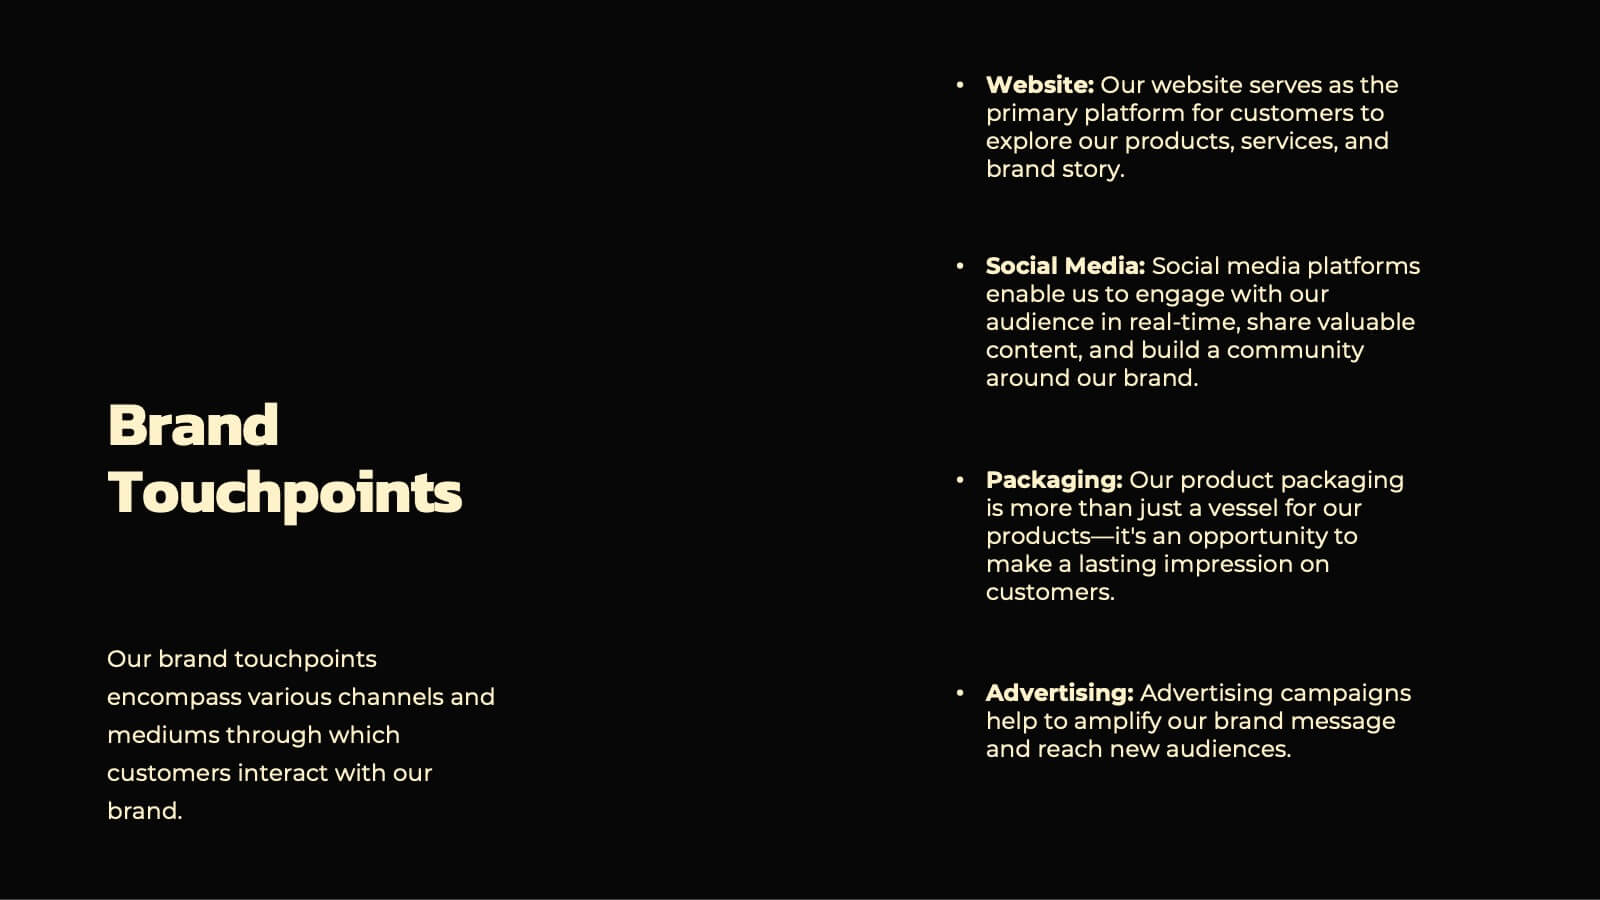
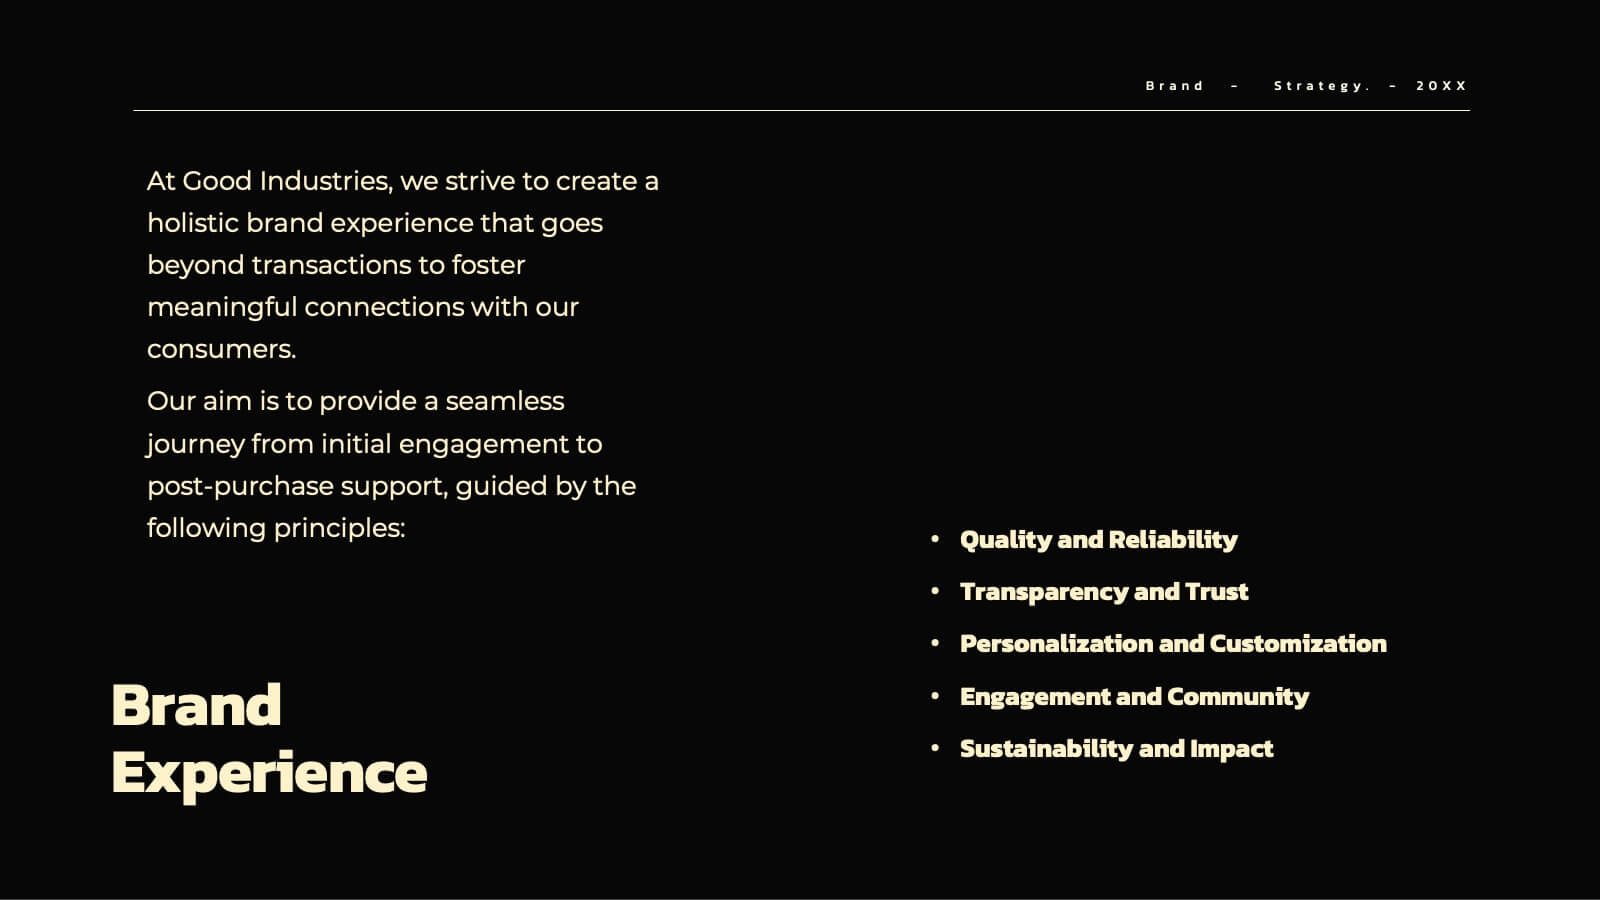
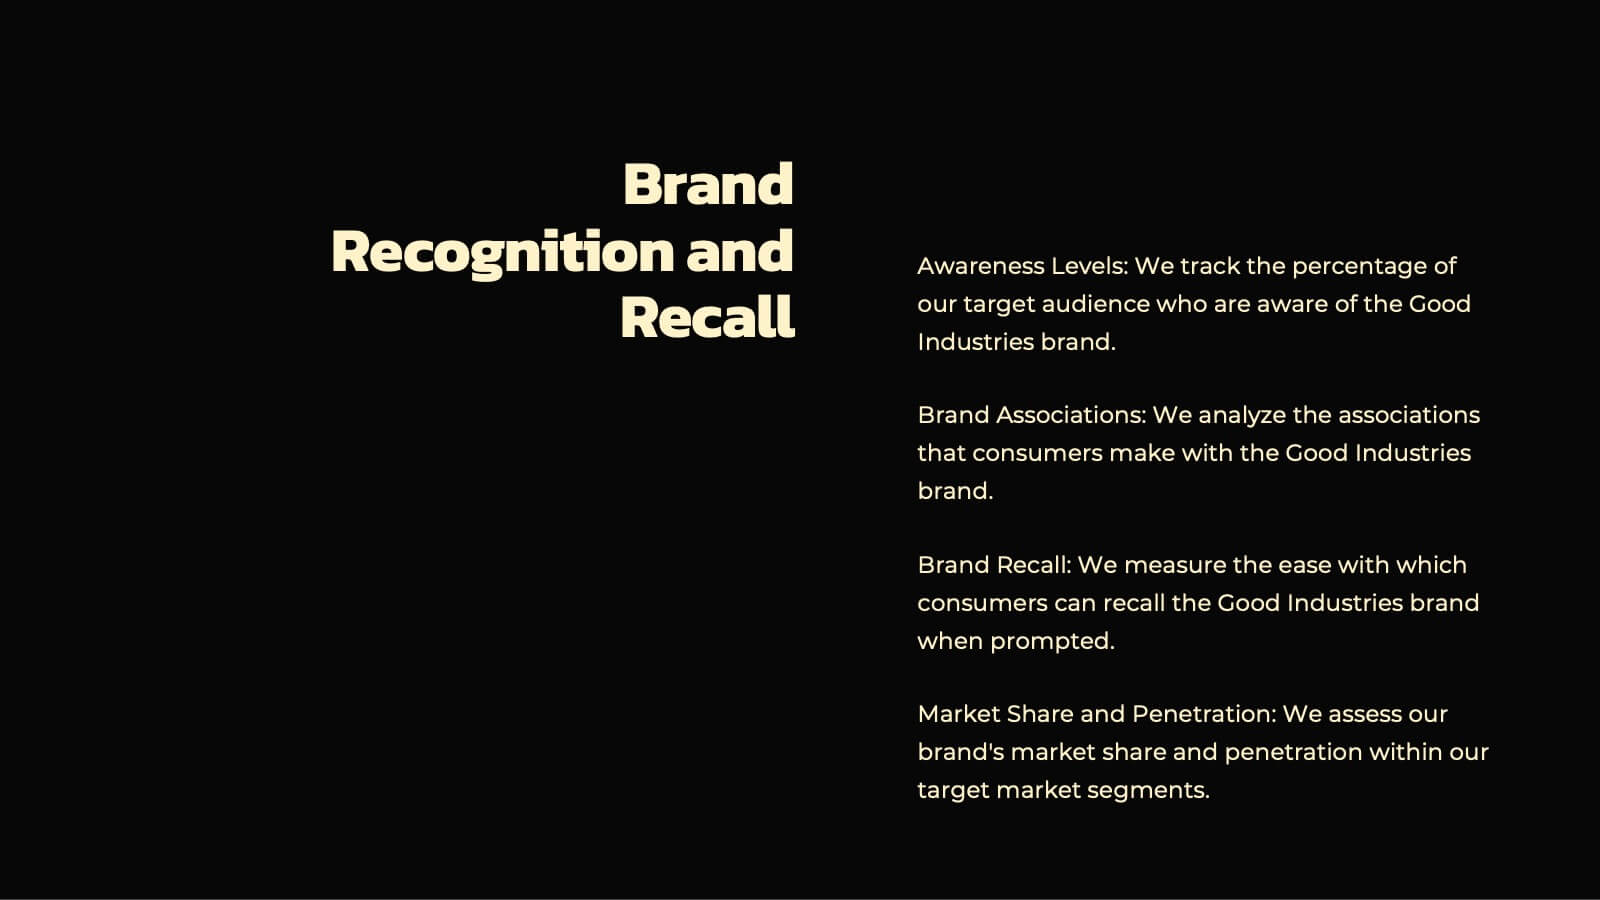
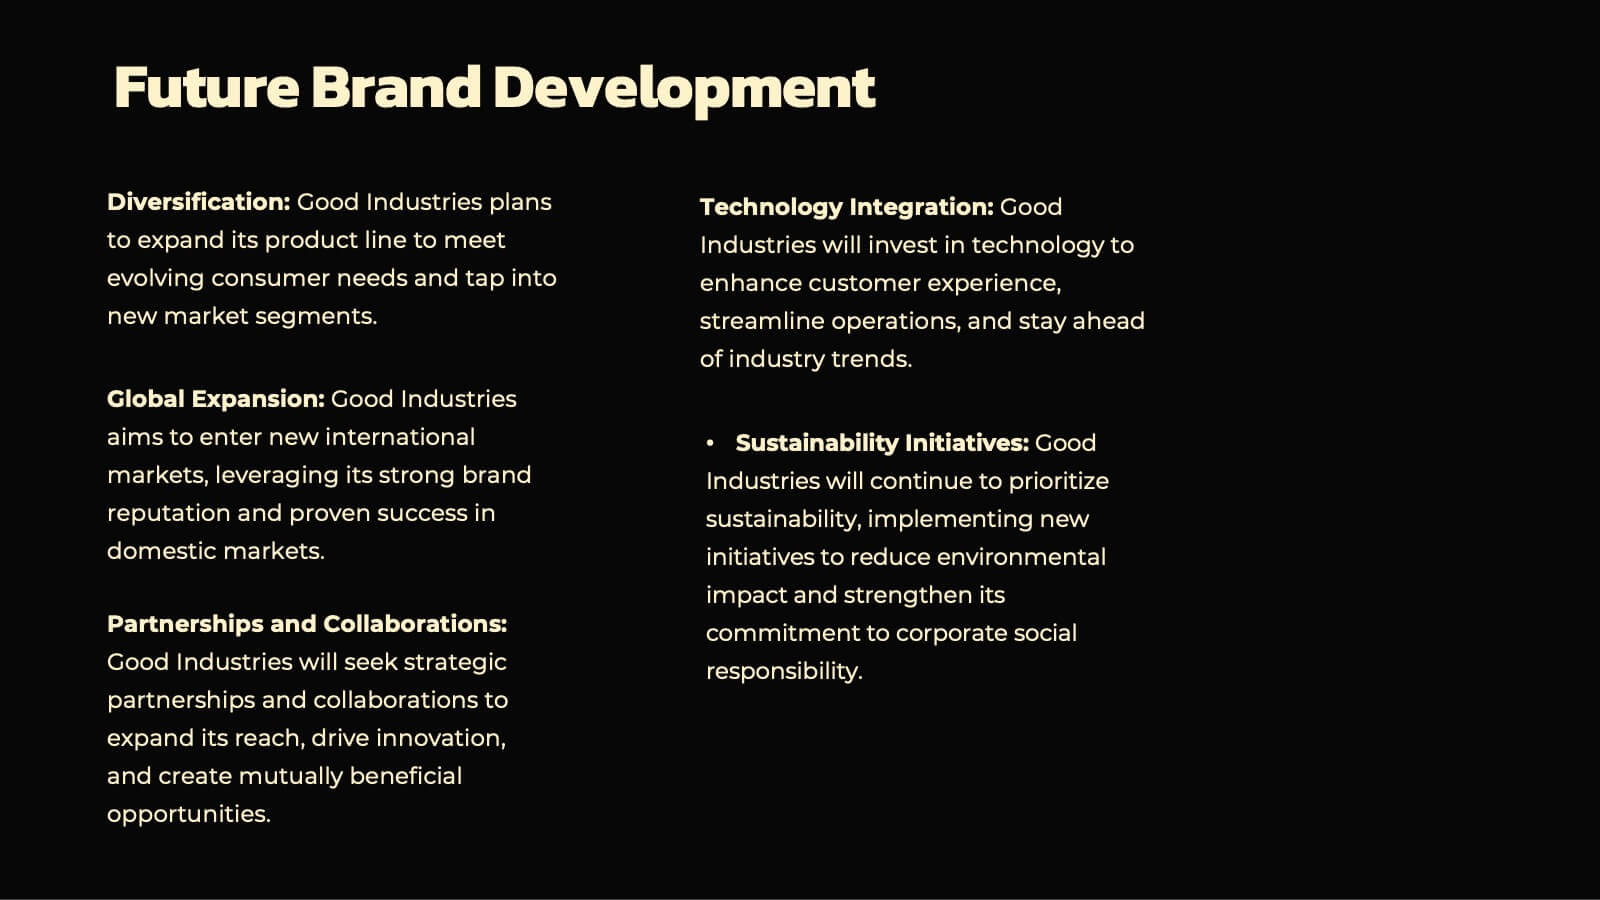
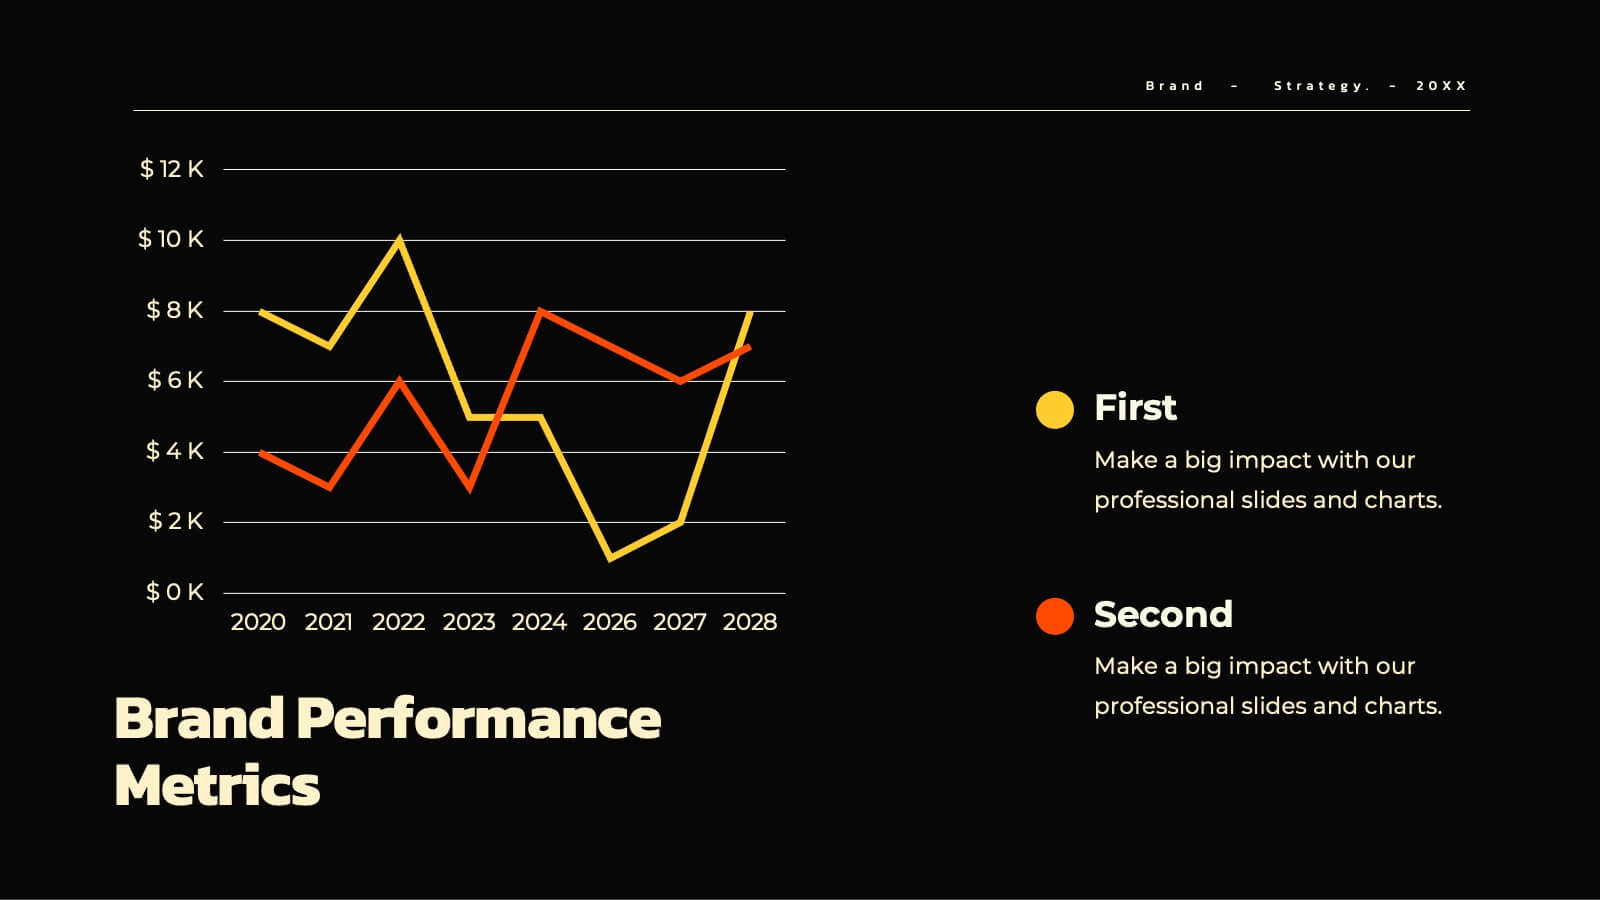
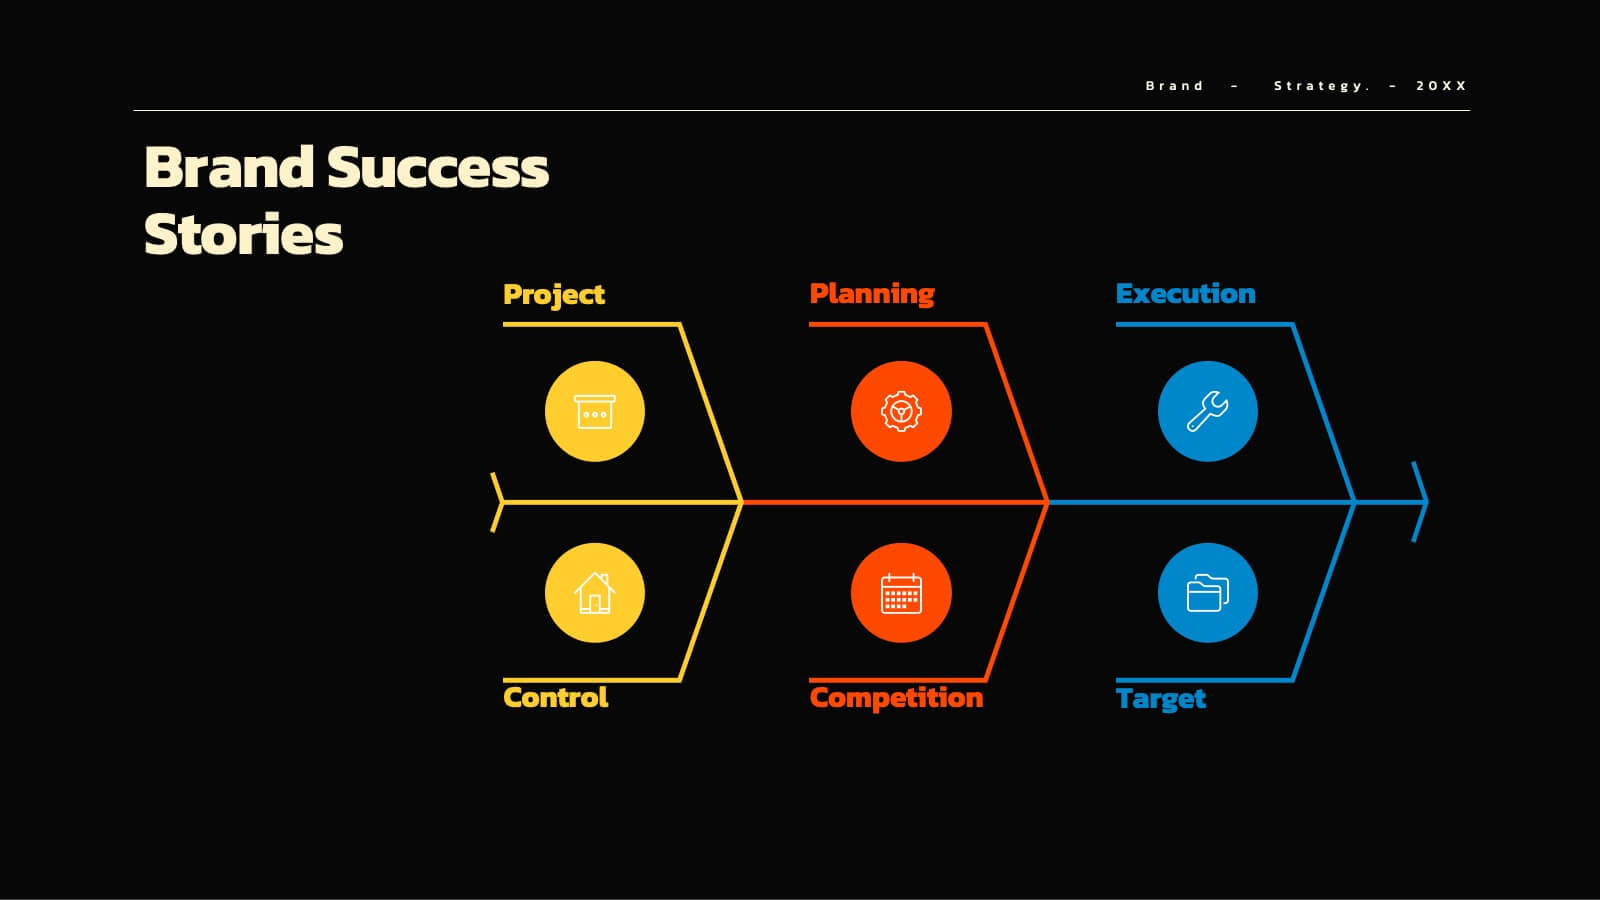
Aqua Brand Strategy Report Presentation
Make waves with this fresh, aqua-inspired presentation template, perfect for delivering a standout brand strategy report! Designed to help you showcase your brand's vision, market positioning, and strategic goals, it features a clean, modern layout that grabs attention. Compatible with PowerPoint, Keynote, and Google Slides for effortless customization.


21 diapositivas
Novaedge Professional Portfolio Showcase Presentation
Showcase your expertise with this elegant experience proposal presentation! Featuring sections like portfolio highlights, creative process, client testimonials, and pricing packages, it provides a complete overview of your work. Ideal for freelance professionals or agencies, this template ensures a polished presentation. Fully compatible with PowerPoint, Keynote, and Google Slides.


7 diapositivas
Stakeholder Strategy Infographic
Empower your organization's approach to its stakeholders with our stakeholder strategy infographic. Colored in a mix of vibrant orange, crisp white, and bold red, this infographic not only informs but also captures attention. Ideal for business strategists, project managers, and team leaders, it visually dissects the intricate layers of stakeholder engagement and strategy. Its design includes specialized graphics, tailored icons, and strategic image placeholders to guide your storytelling. Whether you're presenting in PowerPoint, Keynote, or Google Slides, this template is your key to a well-orchestrated stakeholder communication.