


Características


¿Tienes alguna pregunta?
Recomendar


10 diapositivas
Key Takeaways List Presentation
Streamline your key points with our "Key Takeaways List Presentation" template. This versatile infographic design offers a clear, structured format for enumerating crucial information across four distinct stages. Each stage is visually represented with vibrant, color-coded sections to ensure readability and impact. Whether you're summarizing a meeting, outlining project steps, or highlighting important data, this template provides a straightforward way to communicate your message effectively. Compatible with PowerPoint, Keynote, and Google Slides, it's ideal for professionals seeking to make their presentations more engaging and organized.


5 diapositivas
Climate Change Activism Infographics
Climate change activism refers to the efforts of individuals, organizations, and communities that are dedicated to raising awareness about the urgent need to address and mitigate the impacts of climate change. These vertical infographics are powerful and visually compelling presentations that aim to raise awareness about the pressing issue of climate change and inspire action towards a sustainable future. This template is ideal for environmental organizations, activists, educators, and anyone seeking to educate the public about climate change and the urgent need for collective action. Fully compatible with powerpoint, Keynote, and Google Slides.


7 diapositivas
Target Customer Profile Infographic
This Target Customer Profile infographic template is designed to help businesses clearly define and present their ideal customer segments. Available for PowerPoint, Google Slides, and Keynote, it includes various sections to detail demographics, customer needs, purchasing habits, and more. With a clean layout and a warm color scheme of oranges and blues, it facilitates the easy organization of customer information. Icons and comparison charts enable users to visualize customer motivations, goals, and product alignment efficiently. Ideal for marketers and business planners, this template simplifies the process of profiling target customers in a visually engaging and informative manner.


5 diapositivas
SMART Objective Planning for Success Presentation
Turn your goal-setting process into a clear, actionable strategy with this SMART Objective Planning slide. Designed around the SMART framework—Specific, Measurable, Achievable, Relevant, Time-bound—this layout helps you articulate objectives with clarity and focus. Each segment features a bold letter with icons and editable descriptions beneath. Ideal for planning sessions, strategic reviews, and team alignment meetings. Compatible with PowerPoint, Keynote, and Google Slides.


3 diapositivas
Visual Breakdown with Tree Diagram Format Presentation
Illustrate growth stages, concepts, or layered development with the Visual Breakdown with Tree Diagram Format Presentation. This creative design uses three tree icons—seedling, sapling, and mature tree—to represent progression or hierarchy. Ideal for timelines, product evolution, or strategic planning. Fully editable in PowerPoint, Keynote, and Google Slides.


6 diapositivas
Cloud IT Infrastructure Design Presentation
Transform the way you explain cloud systems with this modern, data-driven presentation. Ideal for outlining infrastructure layers, deployment strategies, or network operations, it uses a clean, cloud-inspired layout for clarity and impact. Fully customizable and compatible with PowerPoint, Keynote, and Google Slides for a smooth, professional presentation experience.


6 diapositivas
Business Growth Metrics Butterfly Chart
Highlight performance patterns and opportunities with the Business Growth Metrics Butterfly Chart Presentation. This engaging layout uses mirrored radial segments to present six growth indicators—ideal for tracking progress across two categories, departments, or timeframes. The butterfly-shaped curves draw the viewer’s attention to the center, making comparisons intuitive and visually balanced. Fully customizable in PowerPoint, Keynote, and Google Slides, this template is perfect for showcasing KPI trends, sales metrics, or marketing performance.


4 diapositivas
Workforce Skills Gap Plan Presentation
Ignite smarter workforce planning with a clear, engaging visual that highlights current capabilities, needed competencies, and actionable steps to close performance gaps. This presentation helps leaders map priorities, streamline development efforts, and strengthen team readiness for future demands. Fully compatible with PowerPoint, Keynote, and Google Slides.


6 diapositivas
Professional Business Plan Presentation
Make every idea count with a clean, professional presentation that helps you communicate your business strategy clearly and confidently. Ideal for showcasing goals, market insights, and performance plans, it delivers structure with style. Fully compatible with PowerPoint, Keynote, and Google Slides for easy customization and seamless presentation design.


5 diapositivas
Patient Care and Hospital Management Presentation
Communicate critical aspects of Patient Care and Hospital Management with this structured presentation template. Featuring a unique IV-drip-inspired design, this layout visually represents the flow of healthcare processes, making it ideal for hospitals, medical institutions, and healthcare professionals. Use it to outline treatment protocols, patient management strategies, and operational workflows. Fully editable and compatible with PowerPoint, Keynote, and Google Slides for seamless customization.


26 diapositivas
Warm Tones Real Estate Presentation
Create an engaging and inviting Warm Tone Real Estate presentation with this easy to use template. The color scheme of this welcoming template features warm tones to set the mood for a peaceful, natural environment. The cover slide features emerald green and brown, while the next two slides use warmer brown, tan shades, keeping the same theme going. Fully customizable, this template is ready to help you sell and promote properties quickly and easily. This layout is perfect for showcasing properties with a premium feel that’ll inspire confidence in both buyers and sellers alike.


8 diapositivas
Target Audience Segmentation Strategy Presentation
Refine your marketing approach with the Target Audience Segmentation Strategy presentation. This professionally designed slide helps you identify, analyze, and visualize key audience segments to enhance your outreach. Perfect for marketers, business strategists, and data analysts, this editable template ensures a clear, data-driven approach to customer targeting. Compatible with PowerPoint, Keynote, and Google Slides.
8 diapositivas
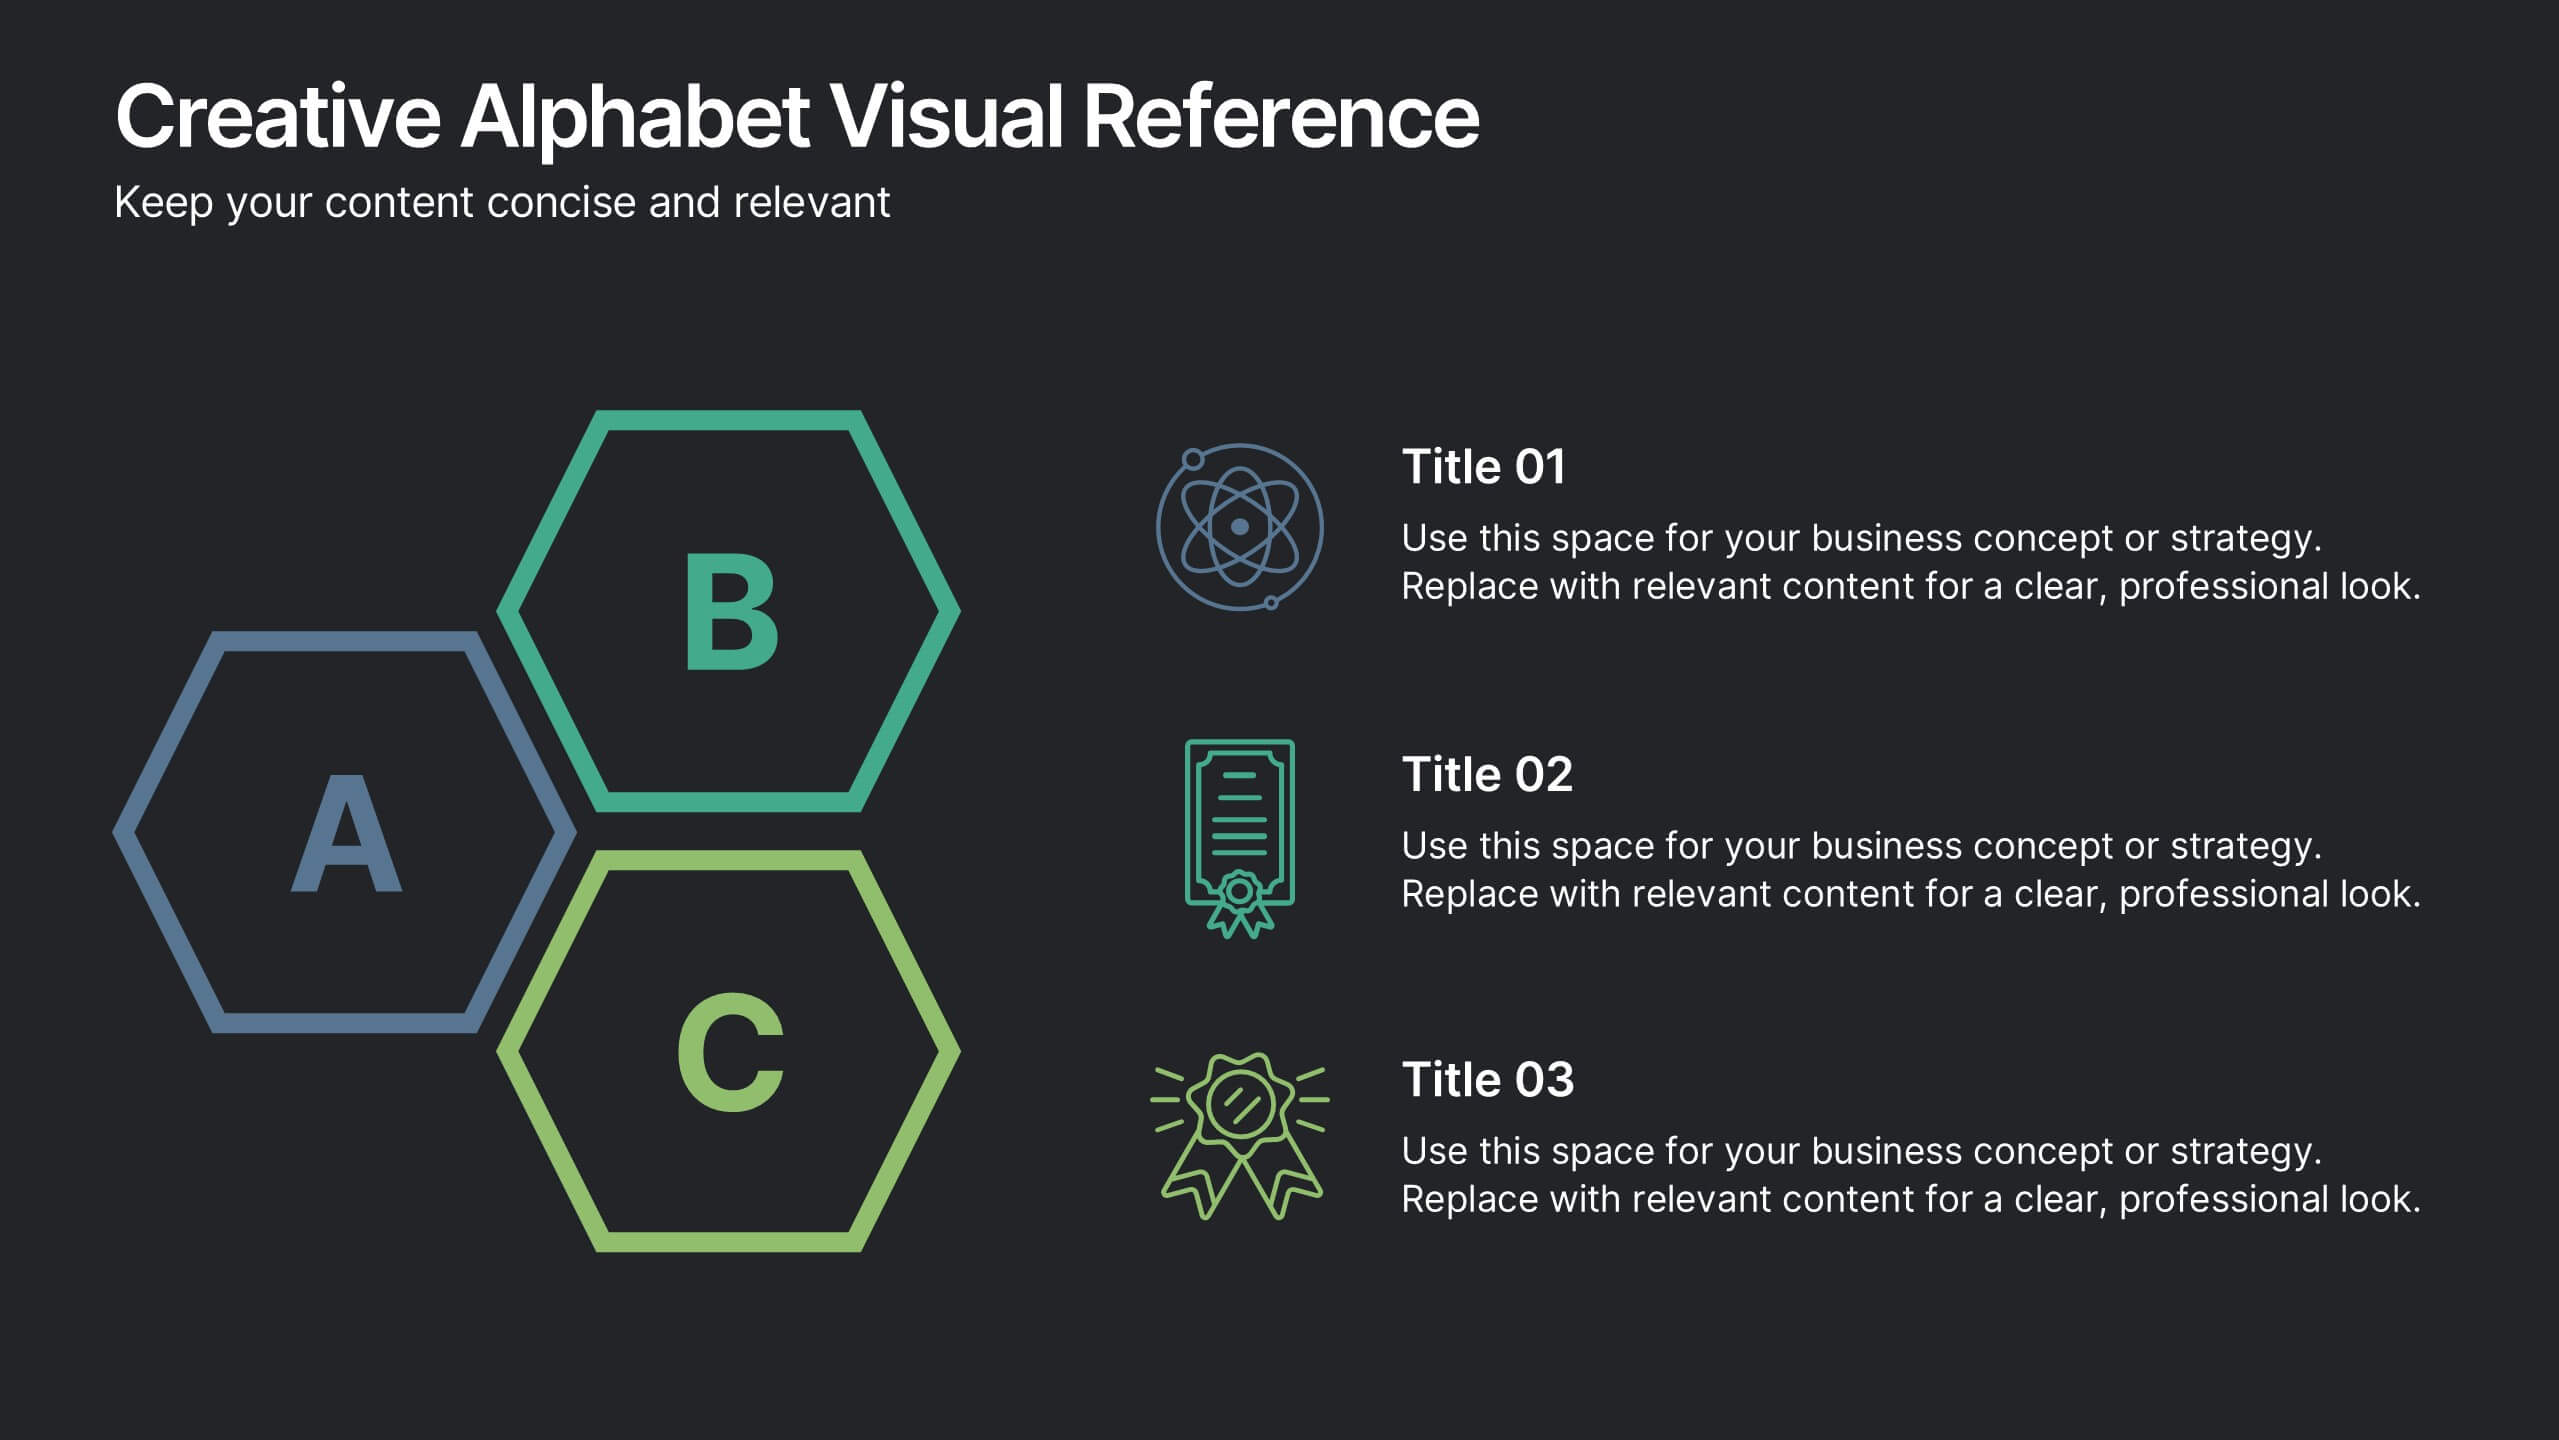
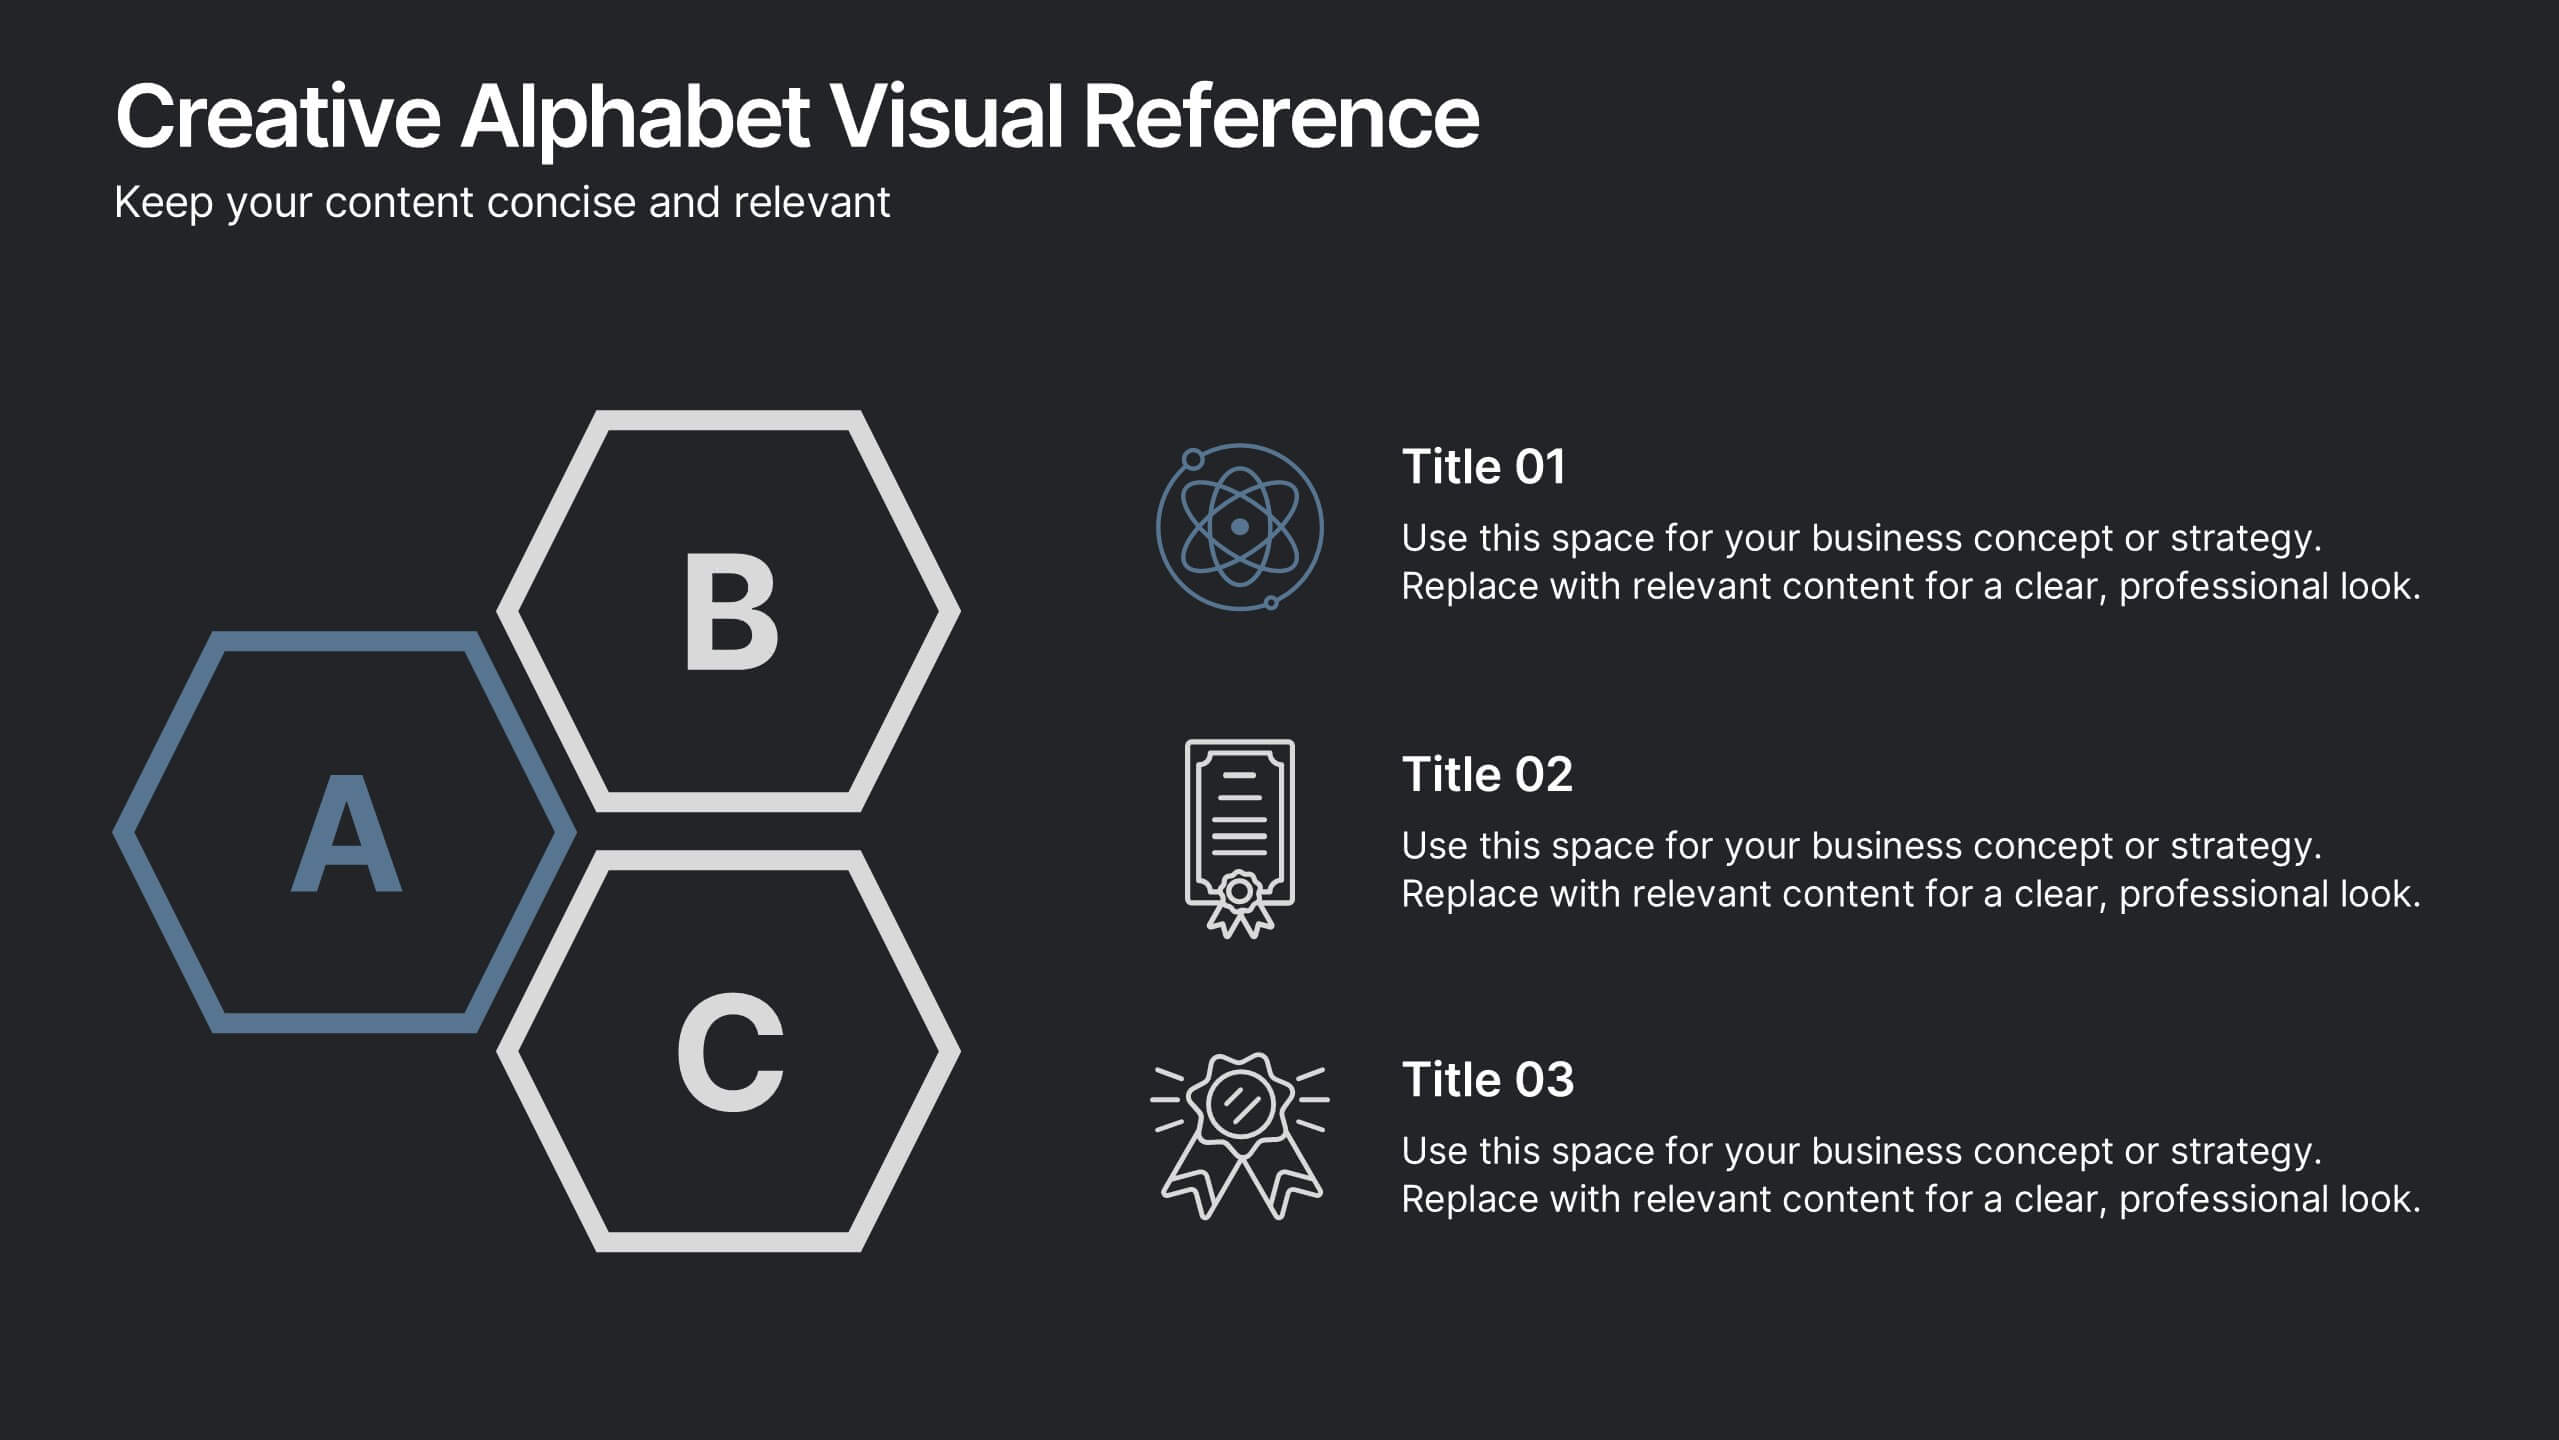
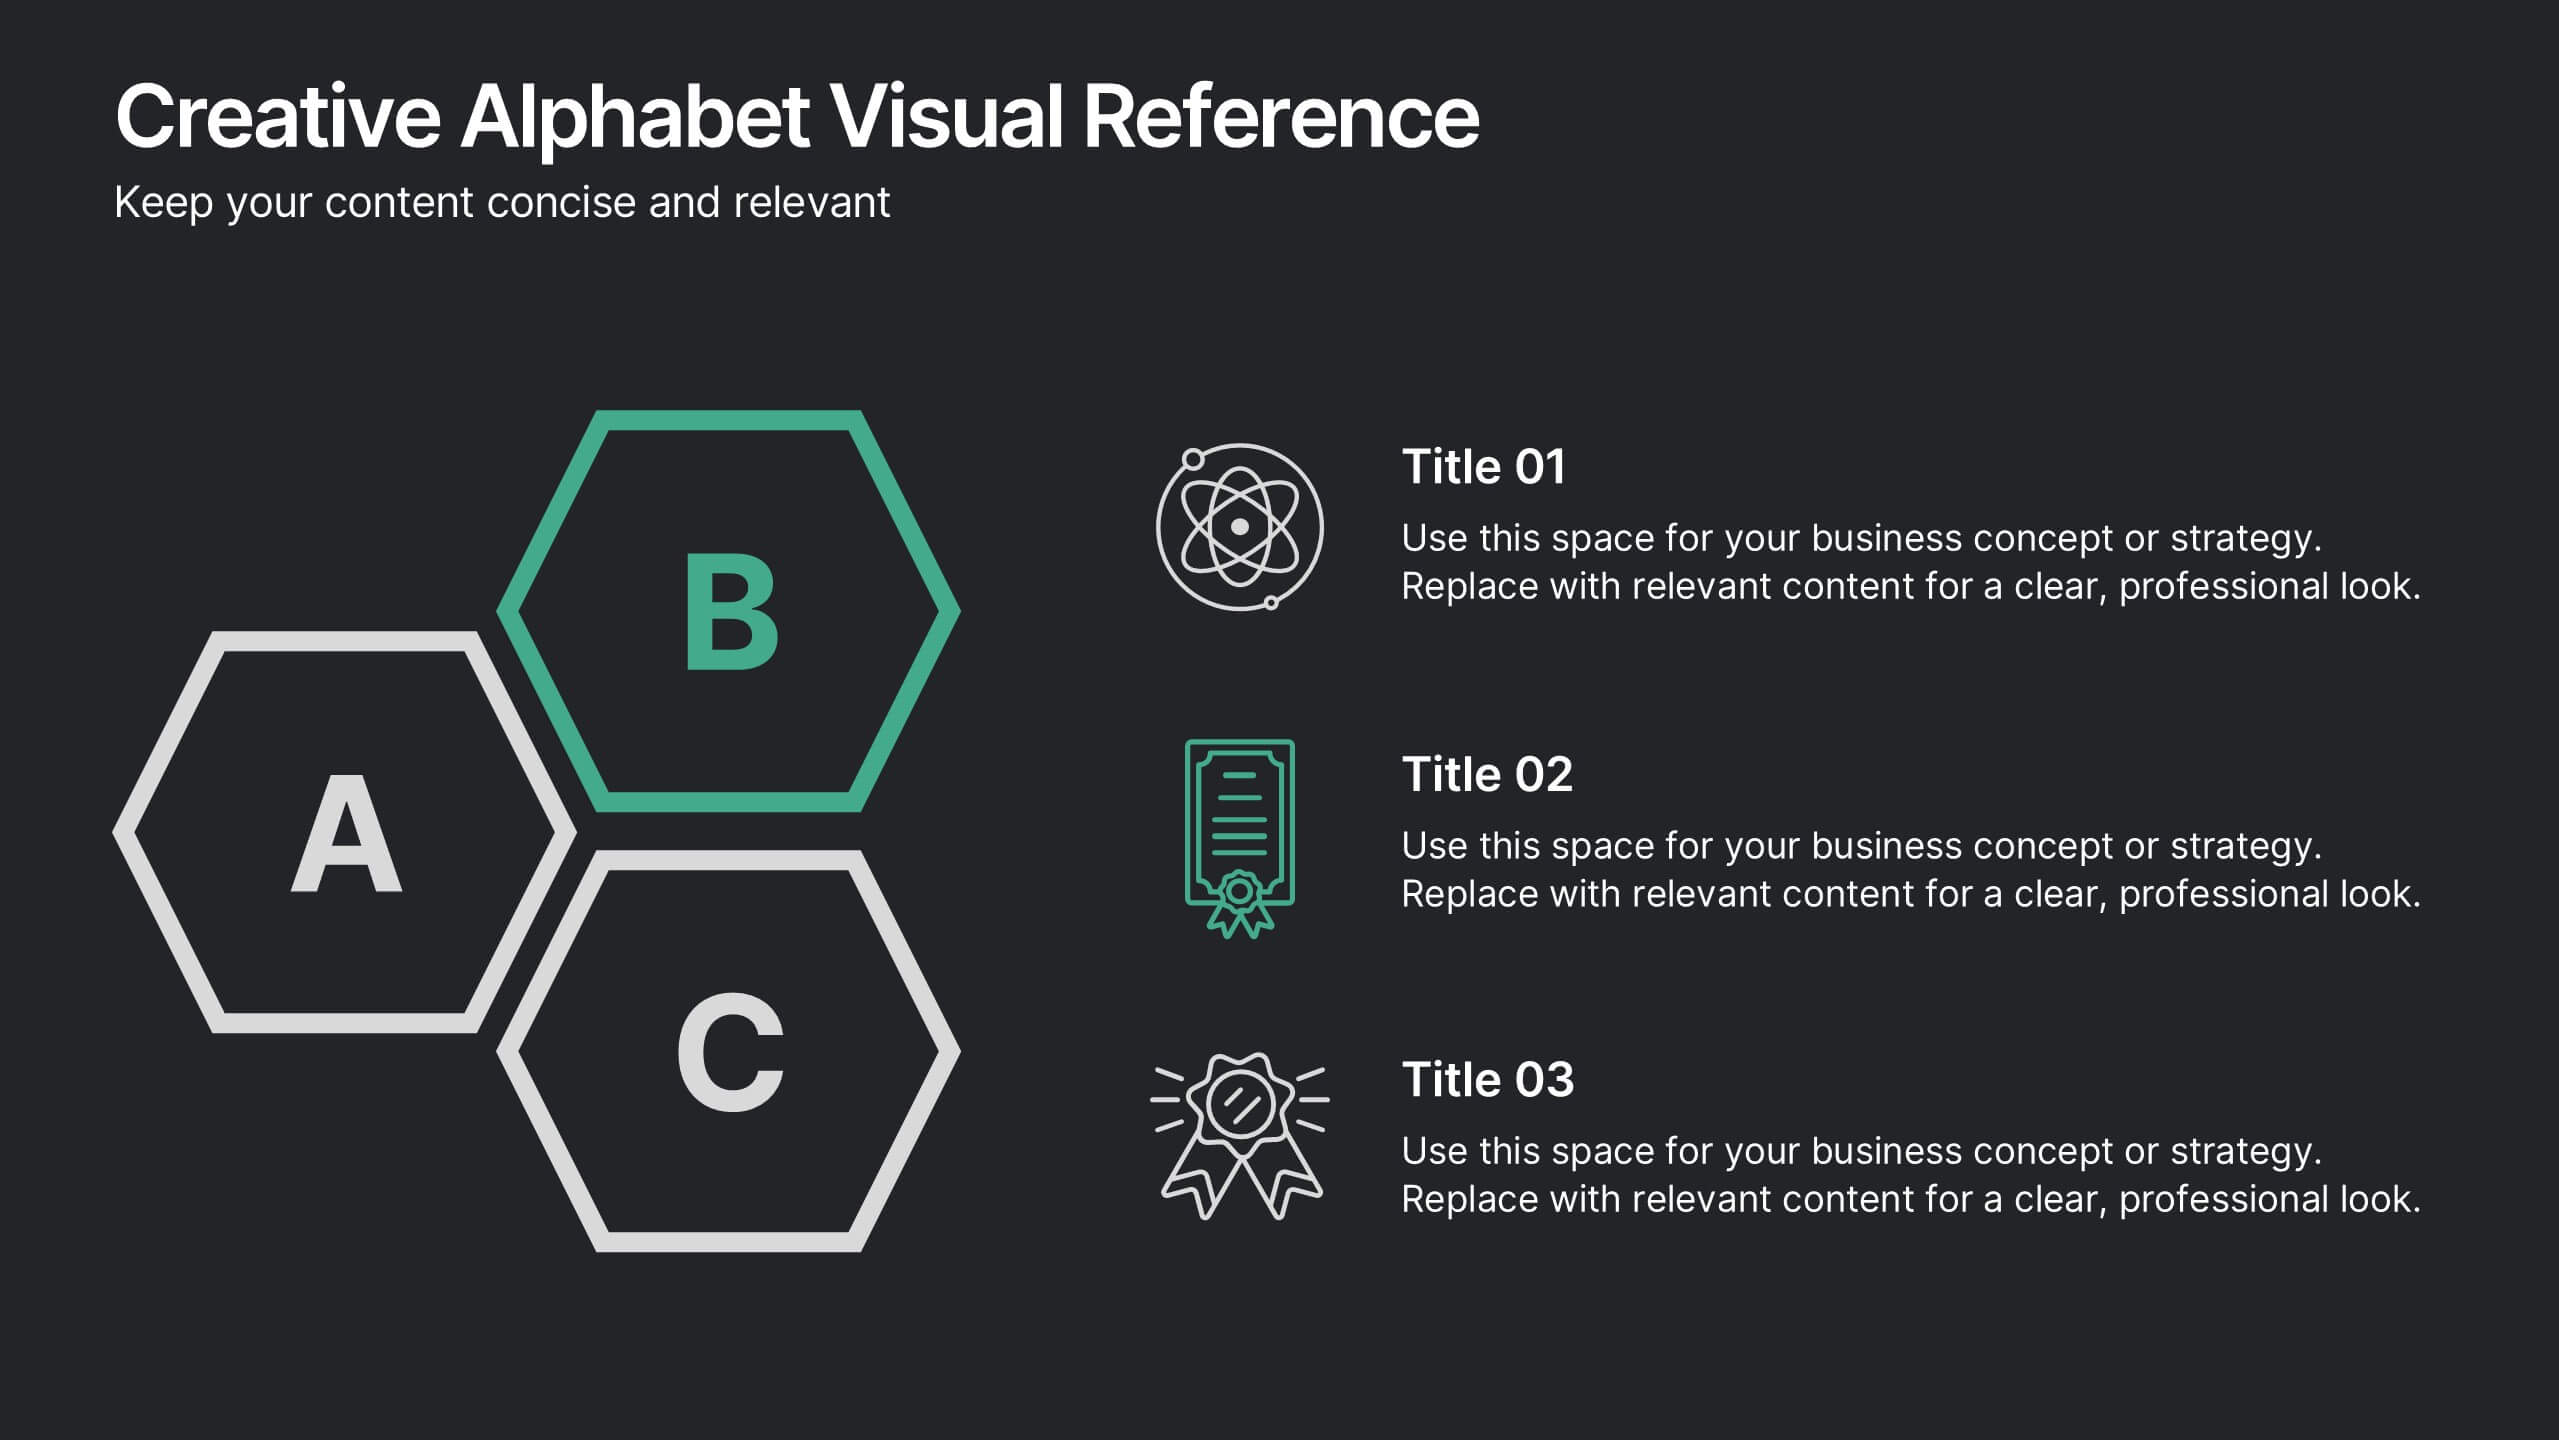
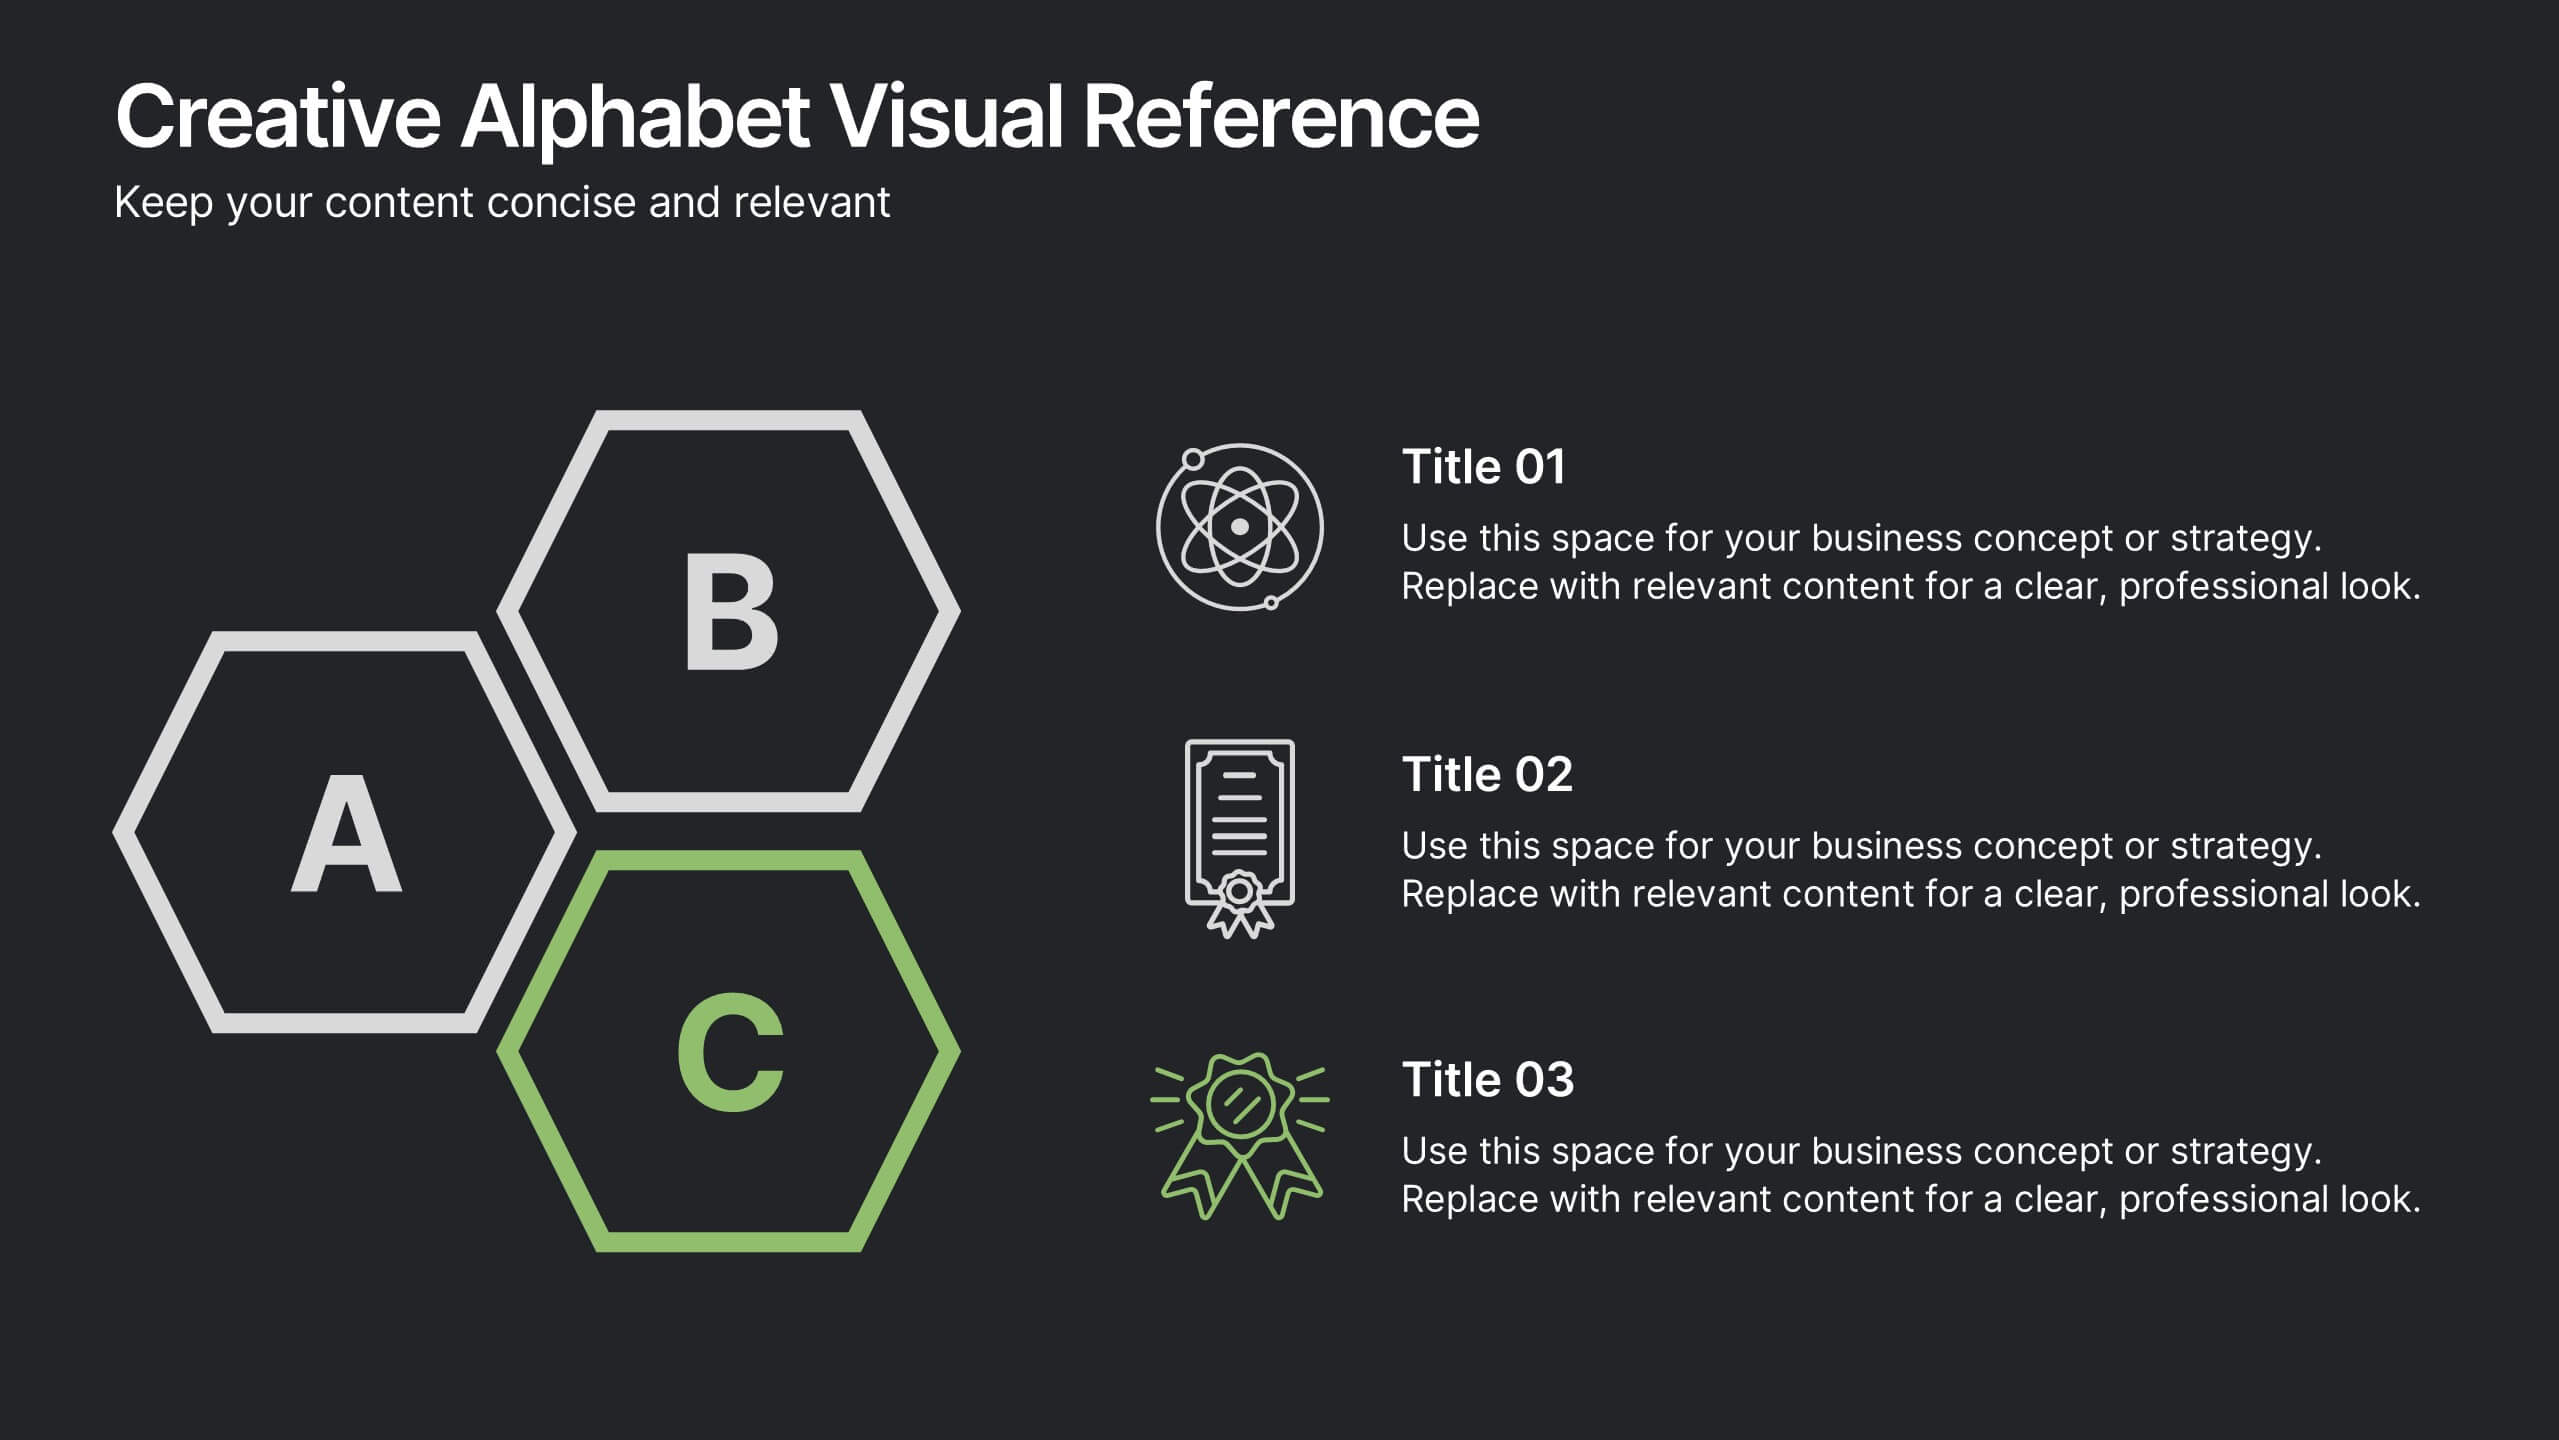
Creative Alphabet Visual Reference Presentation
This creative presentation uses a bold A–B–C visual structure to highlight key points in a clean, modern layout. Ideal for overviews, comparisons, or step-by-step frameworks. Fully customizable in Canva, it balances design and clarity—perfect for business strategies, education, or visual storytelling with strong alphabetical cues and icon integration.


6 diapositivas
Results & Milestones Shown with Numbers
Track progress and showcase success with the Results & Milestones Shown with Numbers Presentation. This visual timeline highlights five key steps using numbered markers connected by a path—perfect for reporting achievements, product phases, or strategic milestones. Fully editable in PowerPoint, Keynote, and Google Slides.


8 diapositivas
Territorial Reach Map of United States Presentation
Showcase your national footprint with the Territorial Reach Map of United States Presentation. This slide visually highlights specific states and aligns them with key data points—perfect for illustrating market penetration, sales concentration, or operational presence. Designed for clarity and impact, it's fully customizable in Canva, PowerPoint, and Google Slides.


5 diapositivas
Quarterly Action Planning Roadmap Presentation
Stay organized with the Quarterly Action Planning Roadmap Presentation. This clear, grid-based layout is perfect for mapping out priorities, goals, and deliverables across four quarters. Ideal for business planning, team tracking, and strategic reviews. Fully editable in PowerPoint, Keynote, Google Slides, and Canva for flexible customization.


23 diapositivas
Fantara Product Launch Pitch Deck Presentation
Launch your product with confidence using this bold and engaging pitch deck presentation template. Featuring key slides such as problem statement, market opportunity, revenue model, and growth projections, it helps you effectively present your business idea. Ideal for startups and entrepreneurs. Compatible with PowerPoint, Keynote, and Google Slides for easy customization.