


Características


¿Tienes alguna pregunta?
Recomendar


8 diapositivas
Workforce Skills Gap Analysis Presentation
Identify and Bridge Workforce Skill Gaps! This Workforce Skills Gap Analysis template provides a structured approach to assess, compare, and close competency gaps within an organization. Designed with interactive bar chart visuals, it enables HR professionals, managers, and training specialists to track employee skill levels, identify gaps, and align workforce development strategies. Fully customizable in PowerPoint, Keynote, and Google Slides, this template ensures a clear and data-driven approach to workforce planning and professional growth.


22 diapositivas
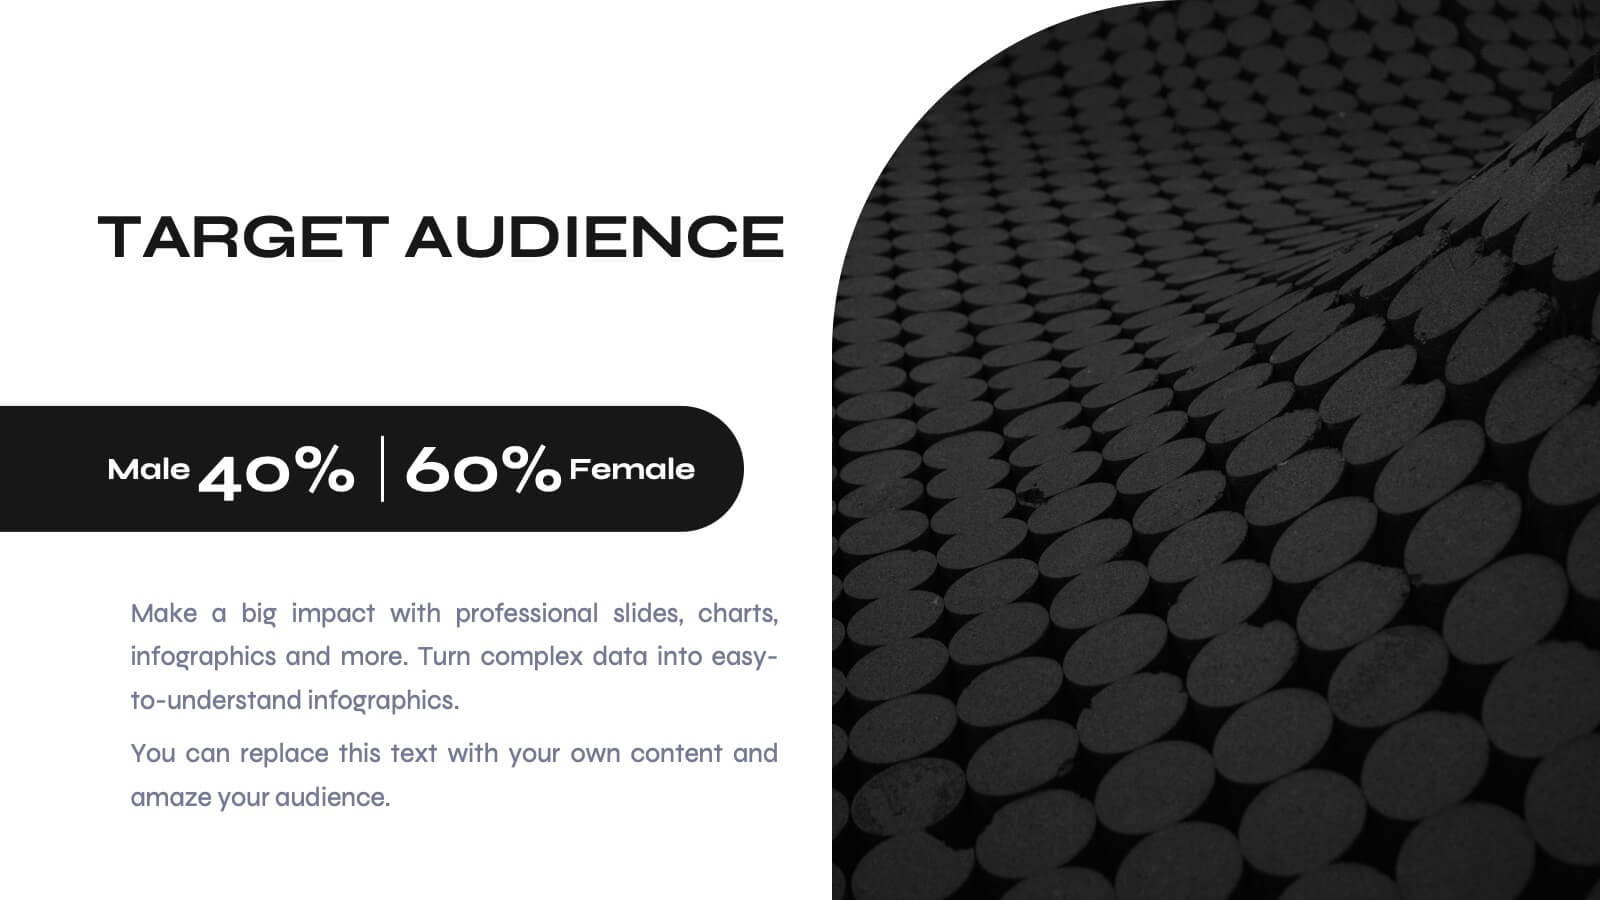
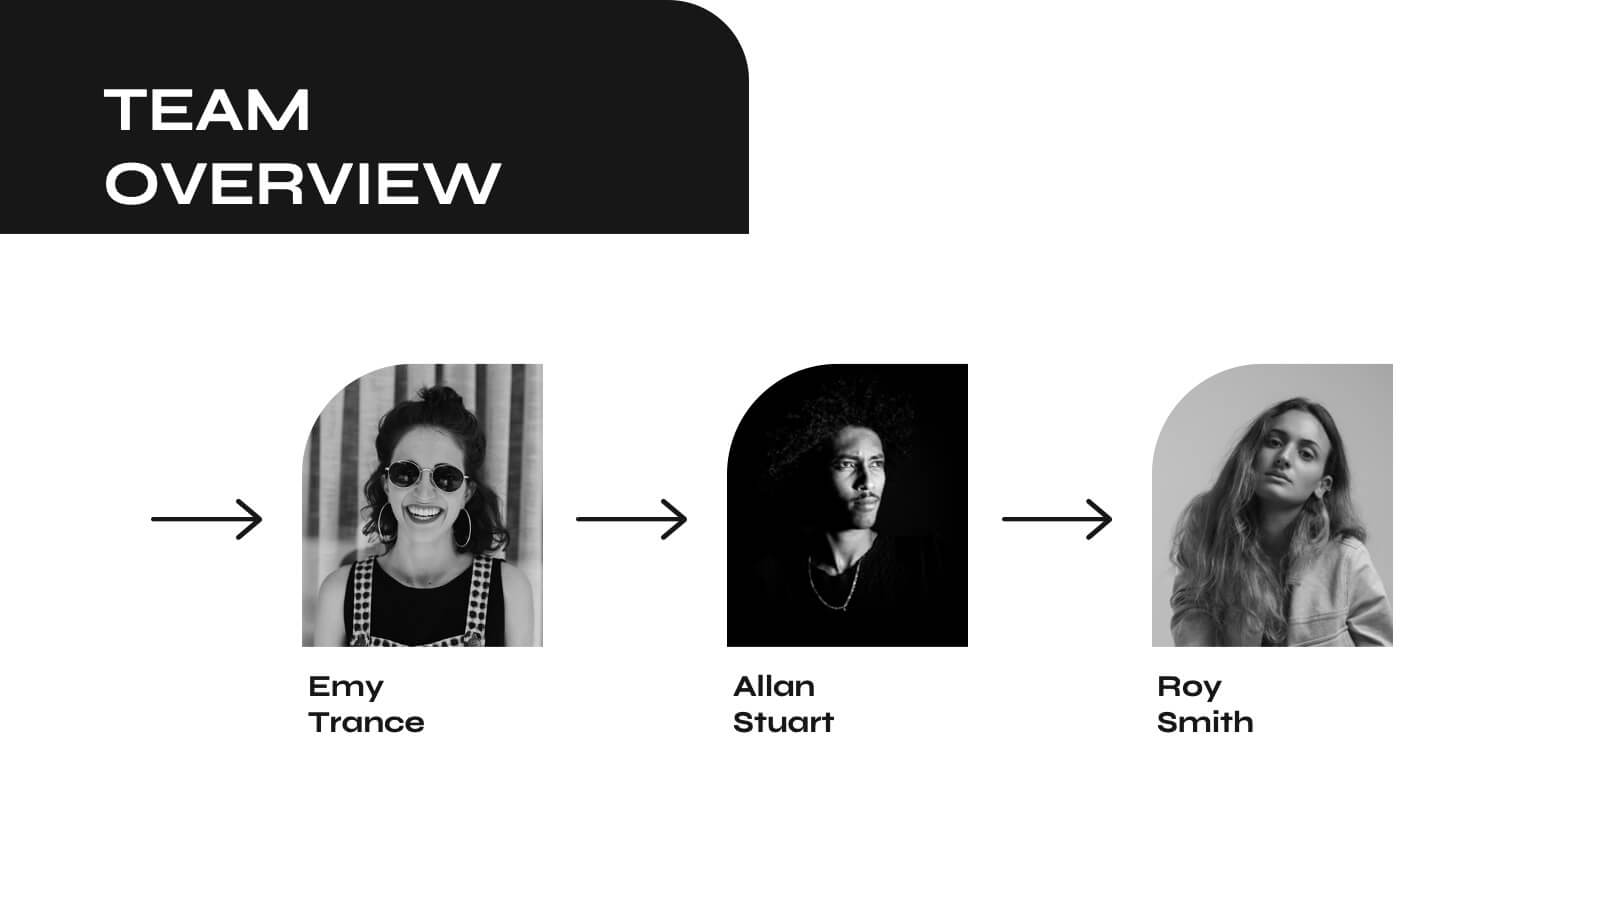
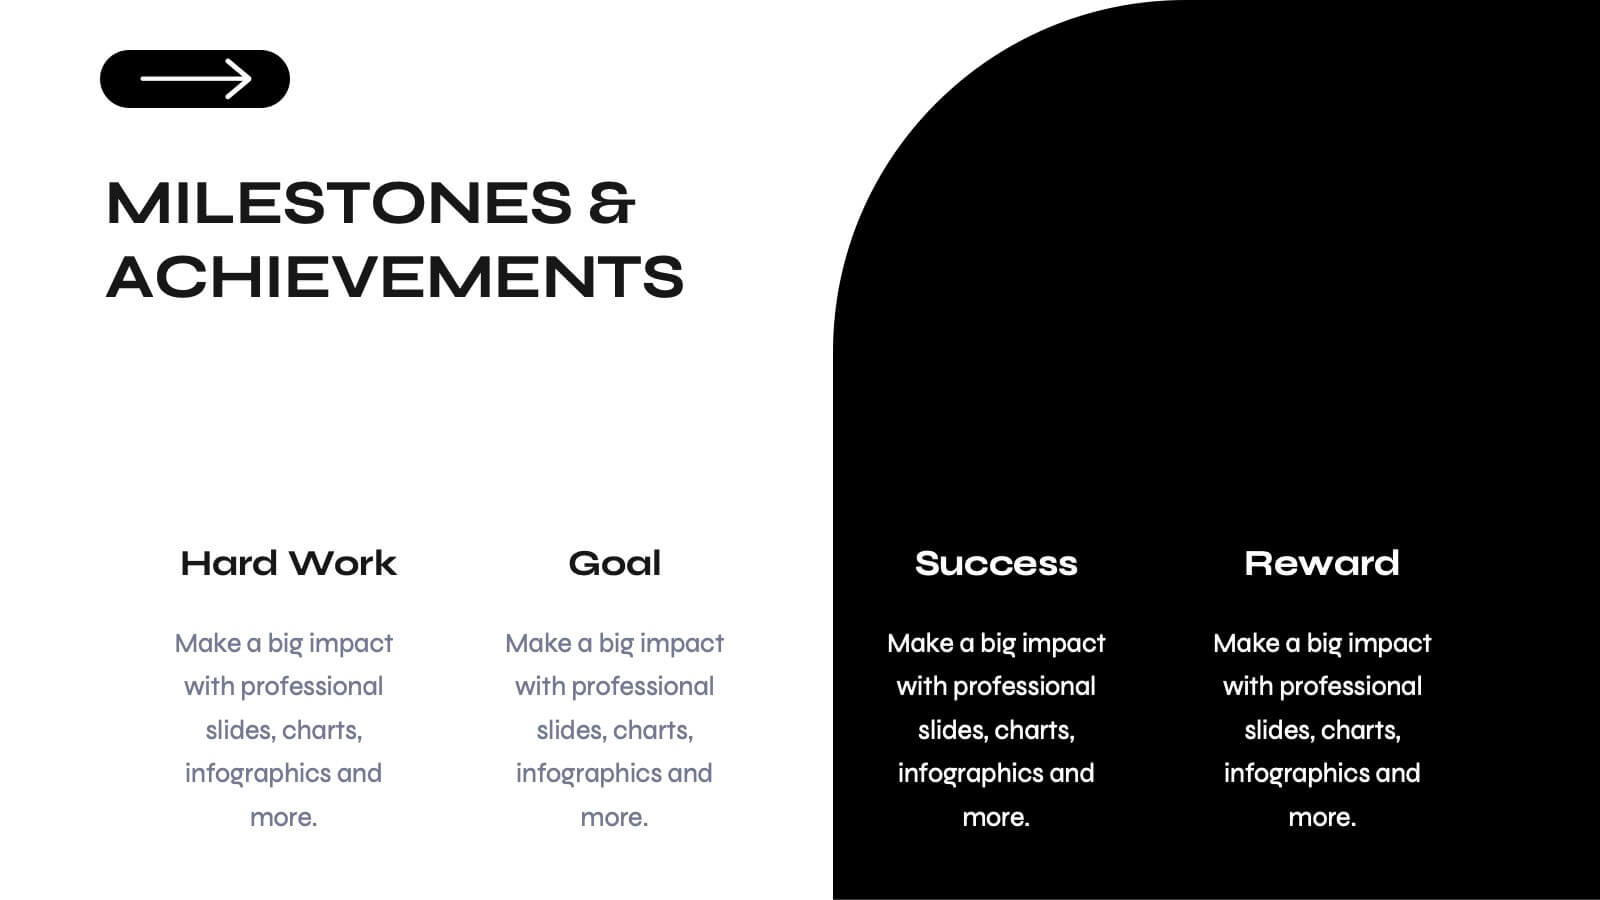
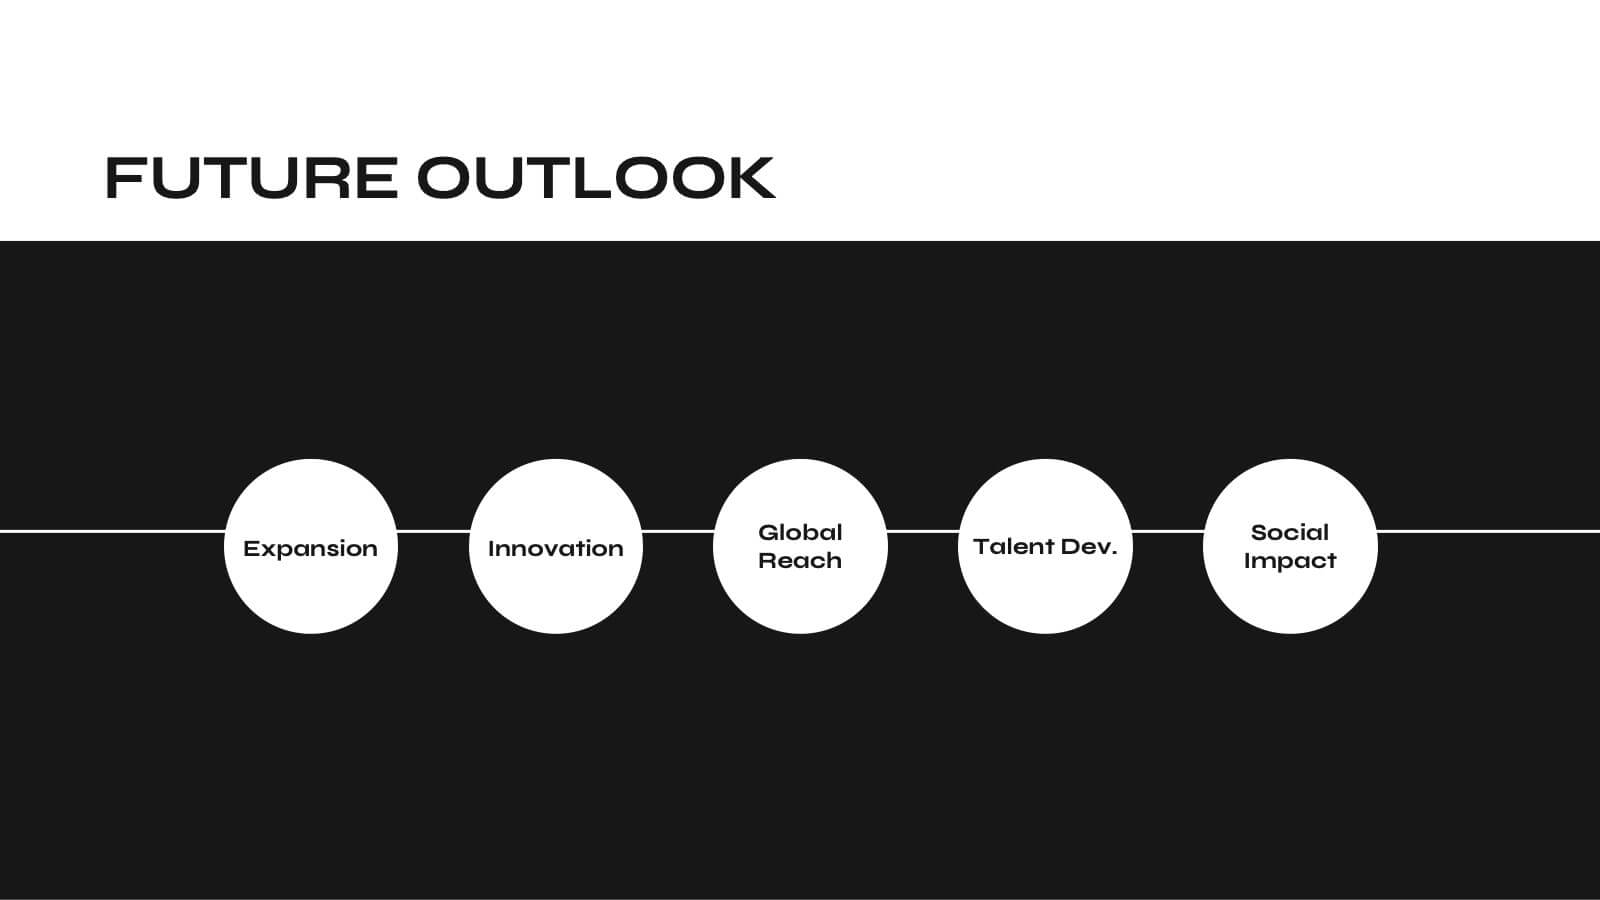
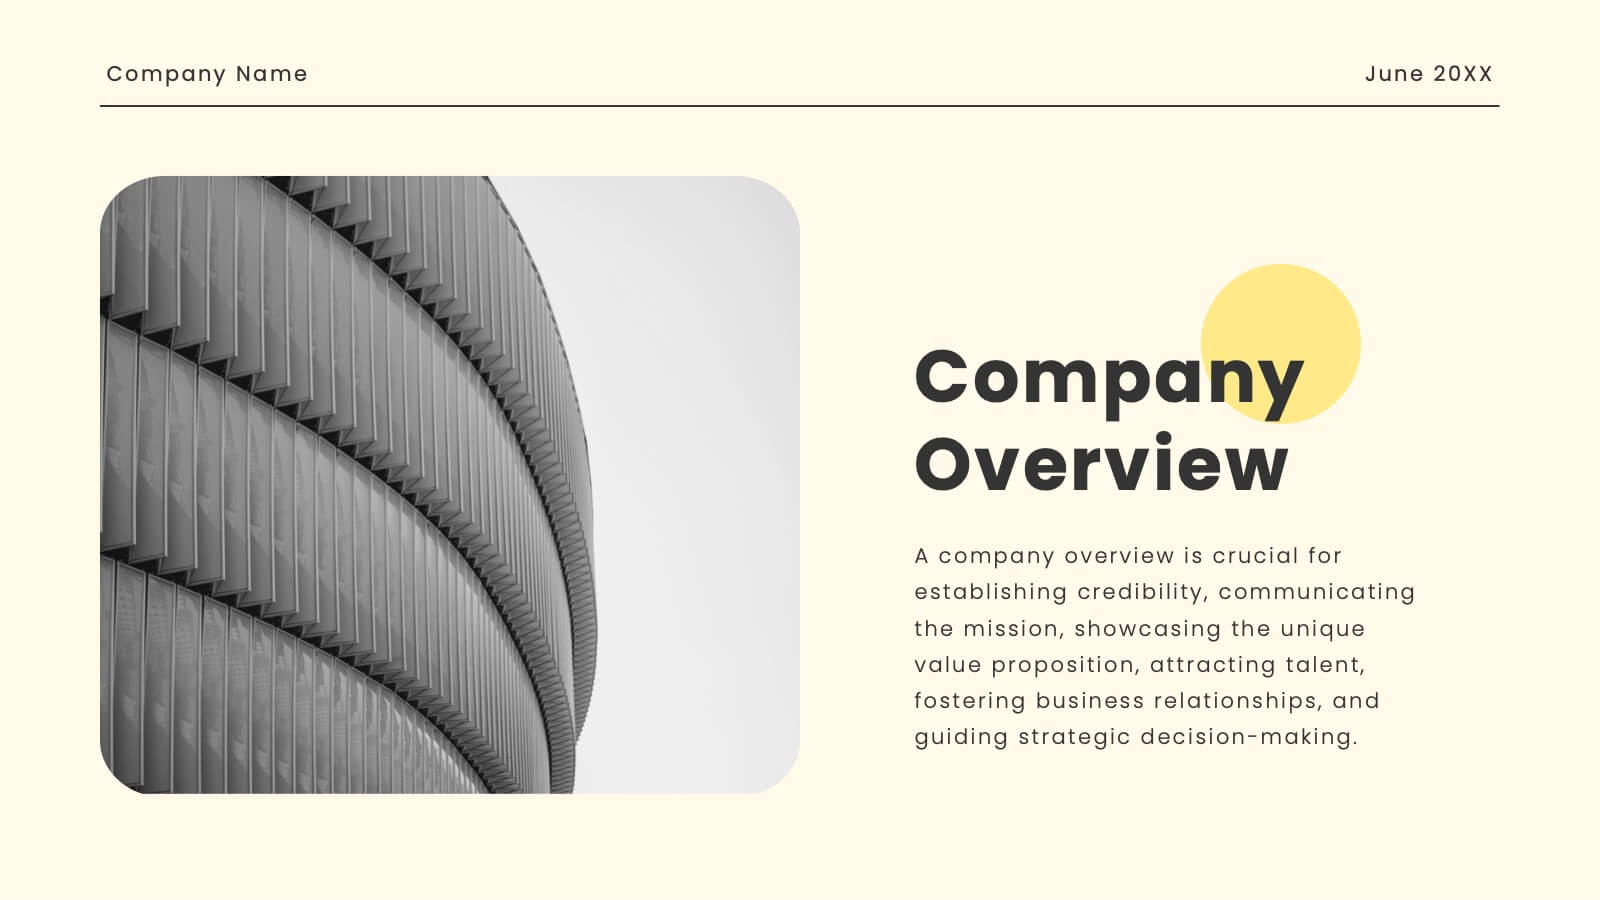
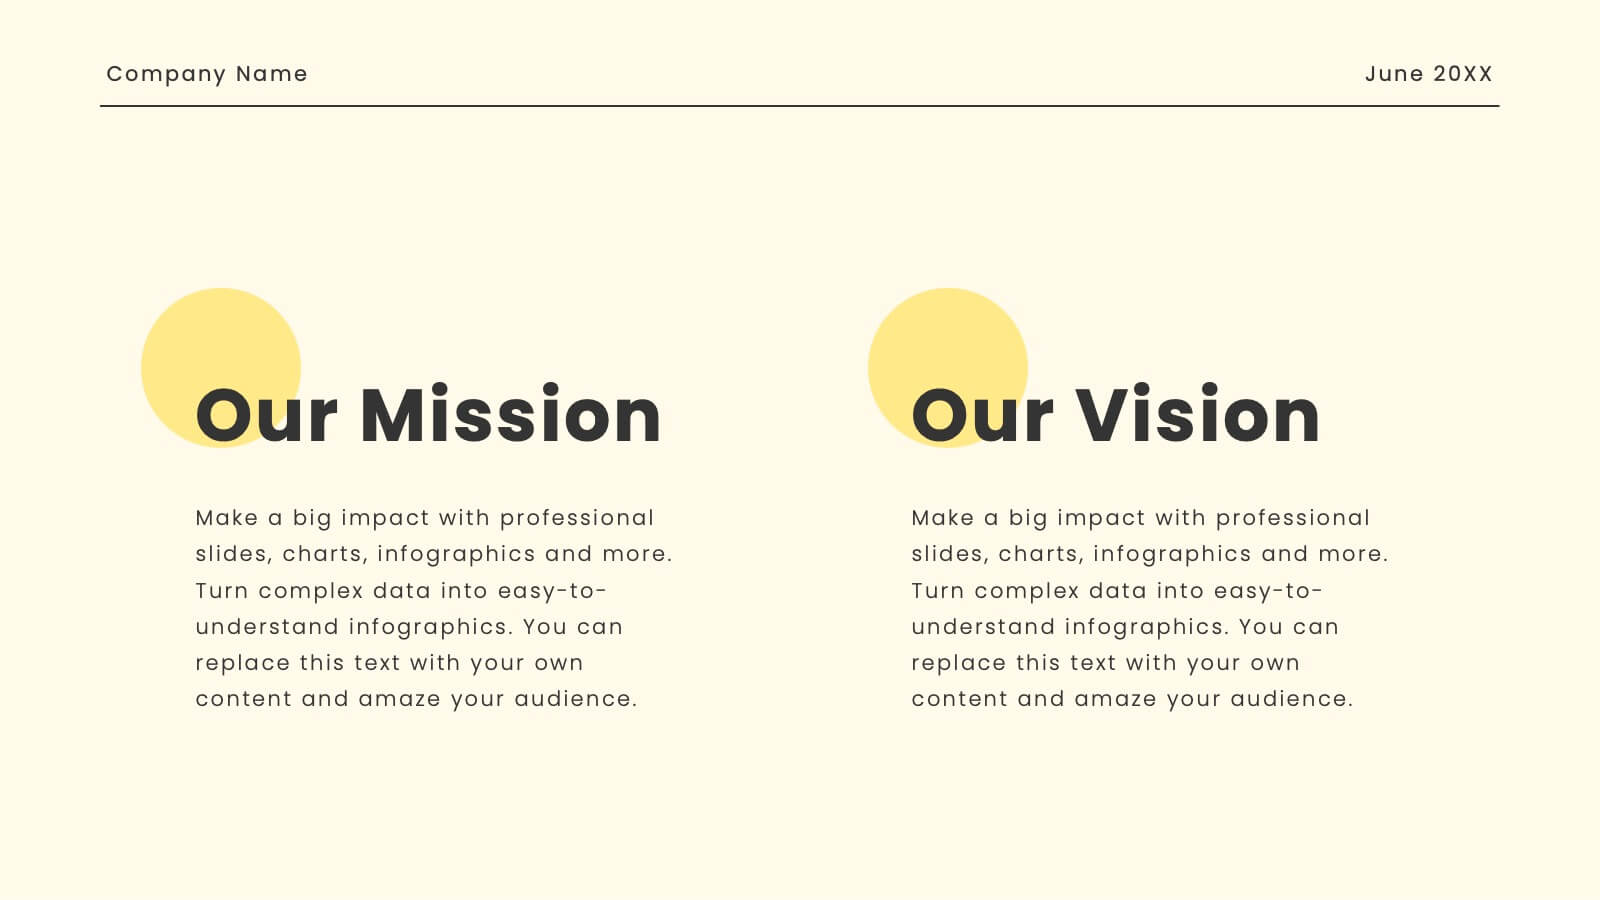
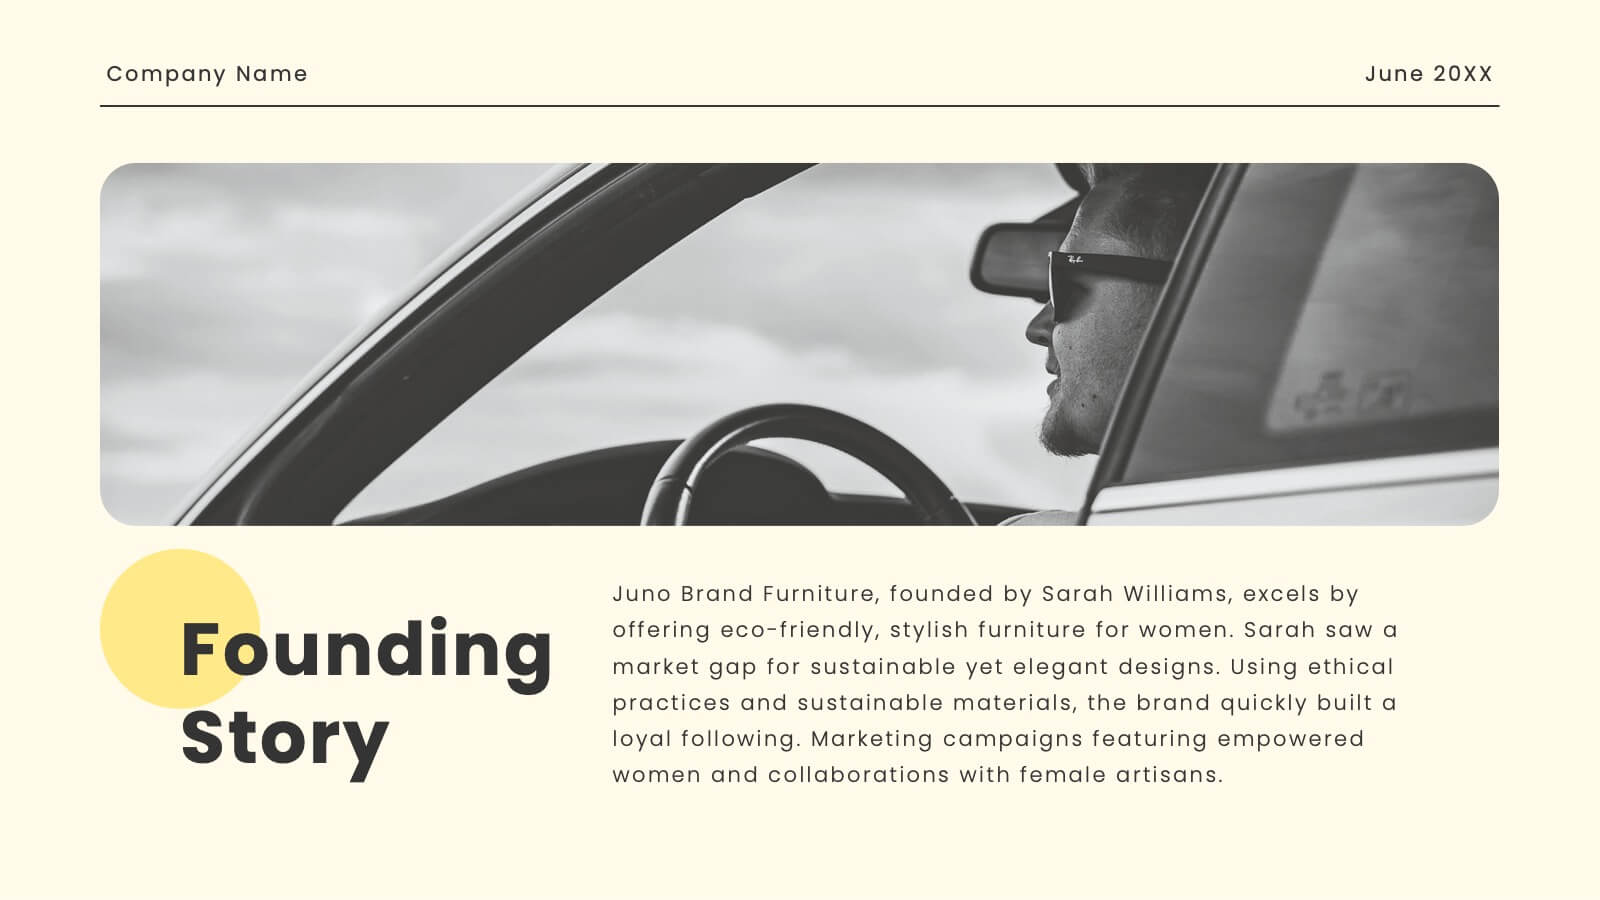
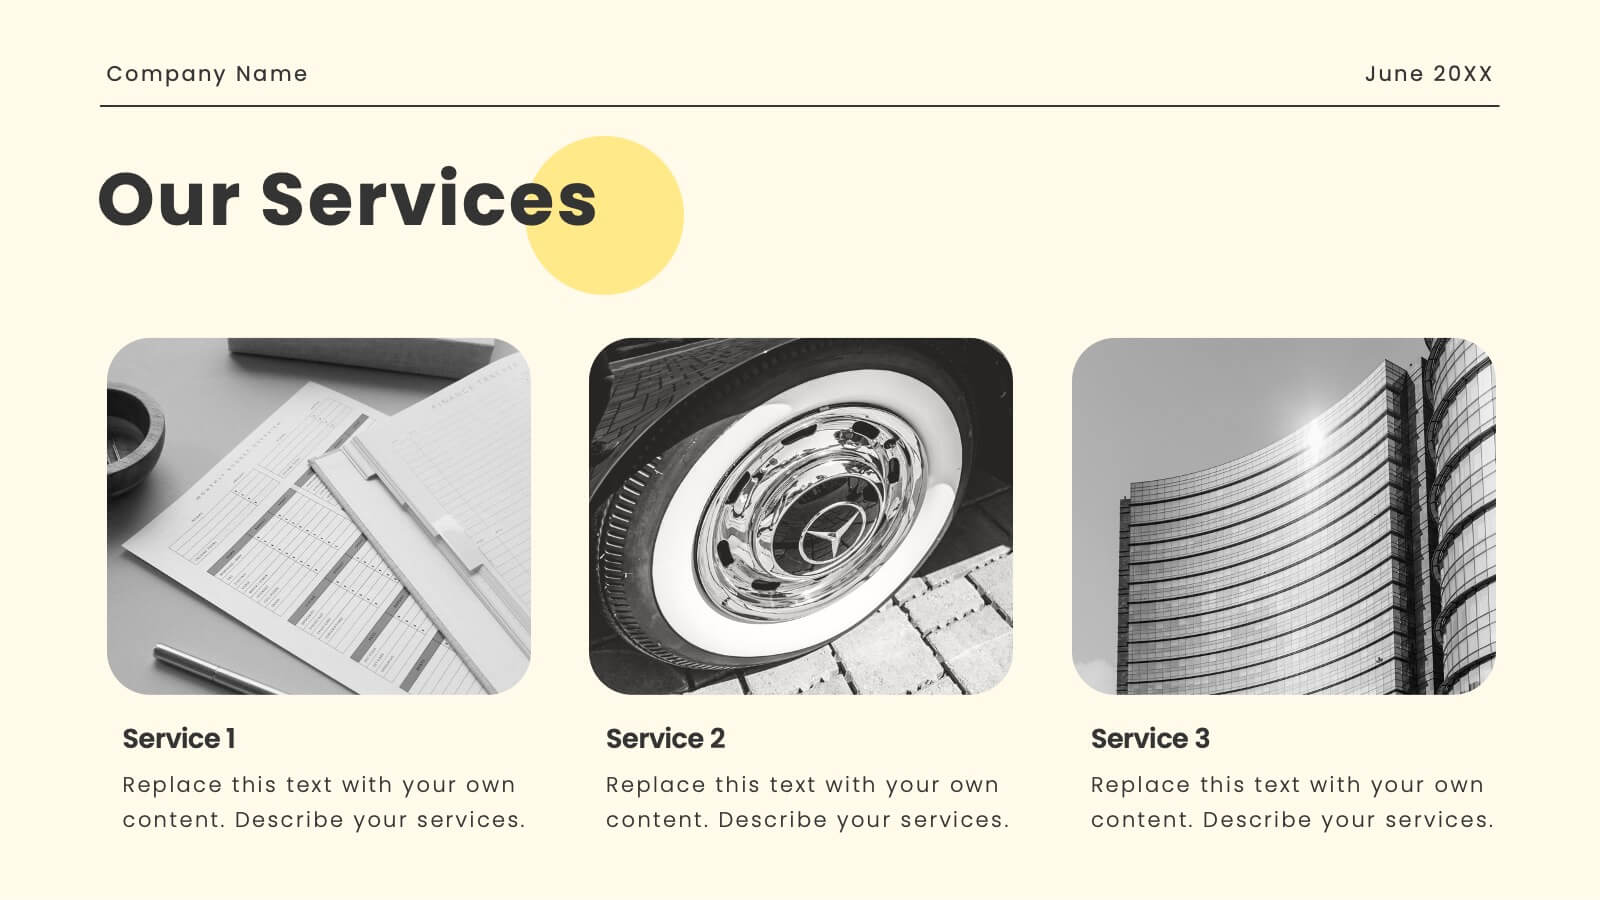
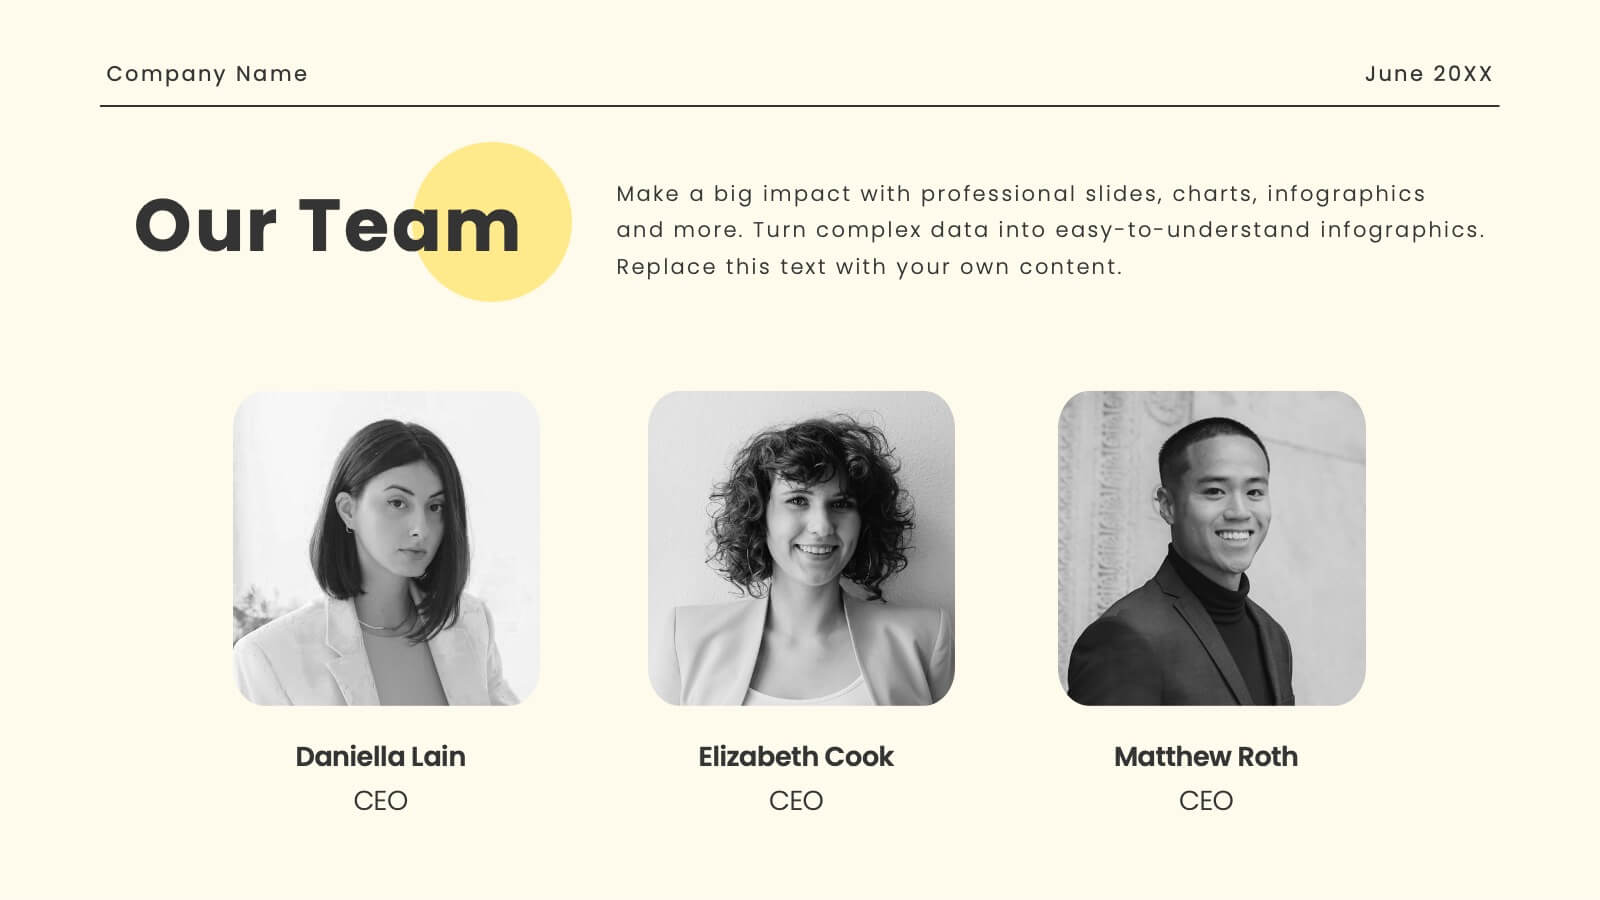
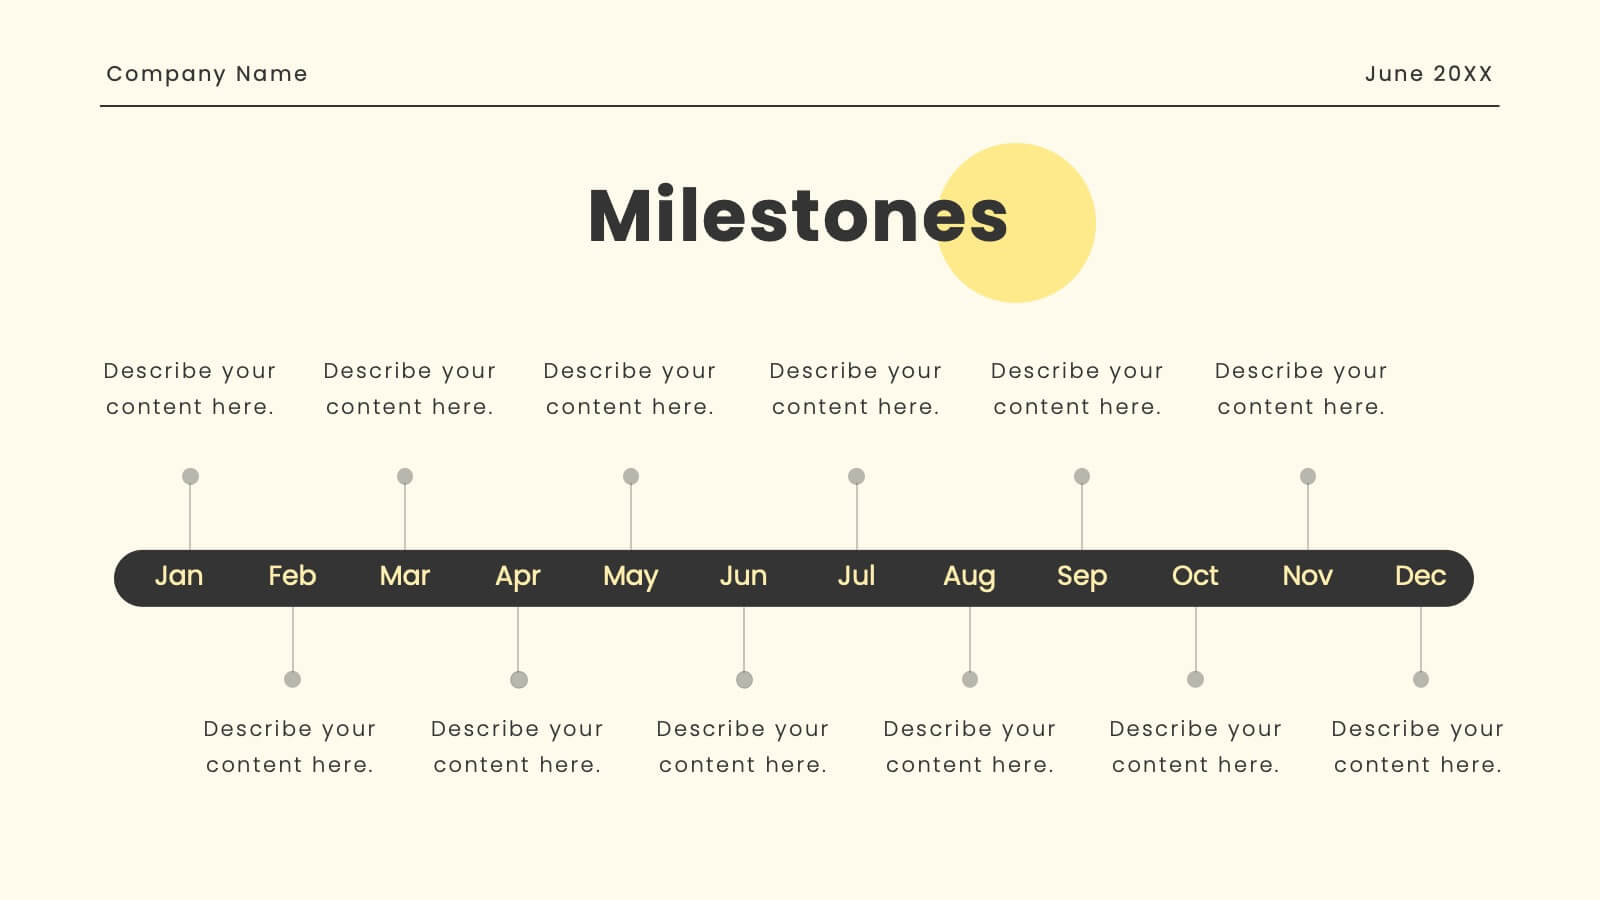
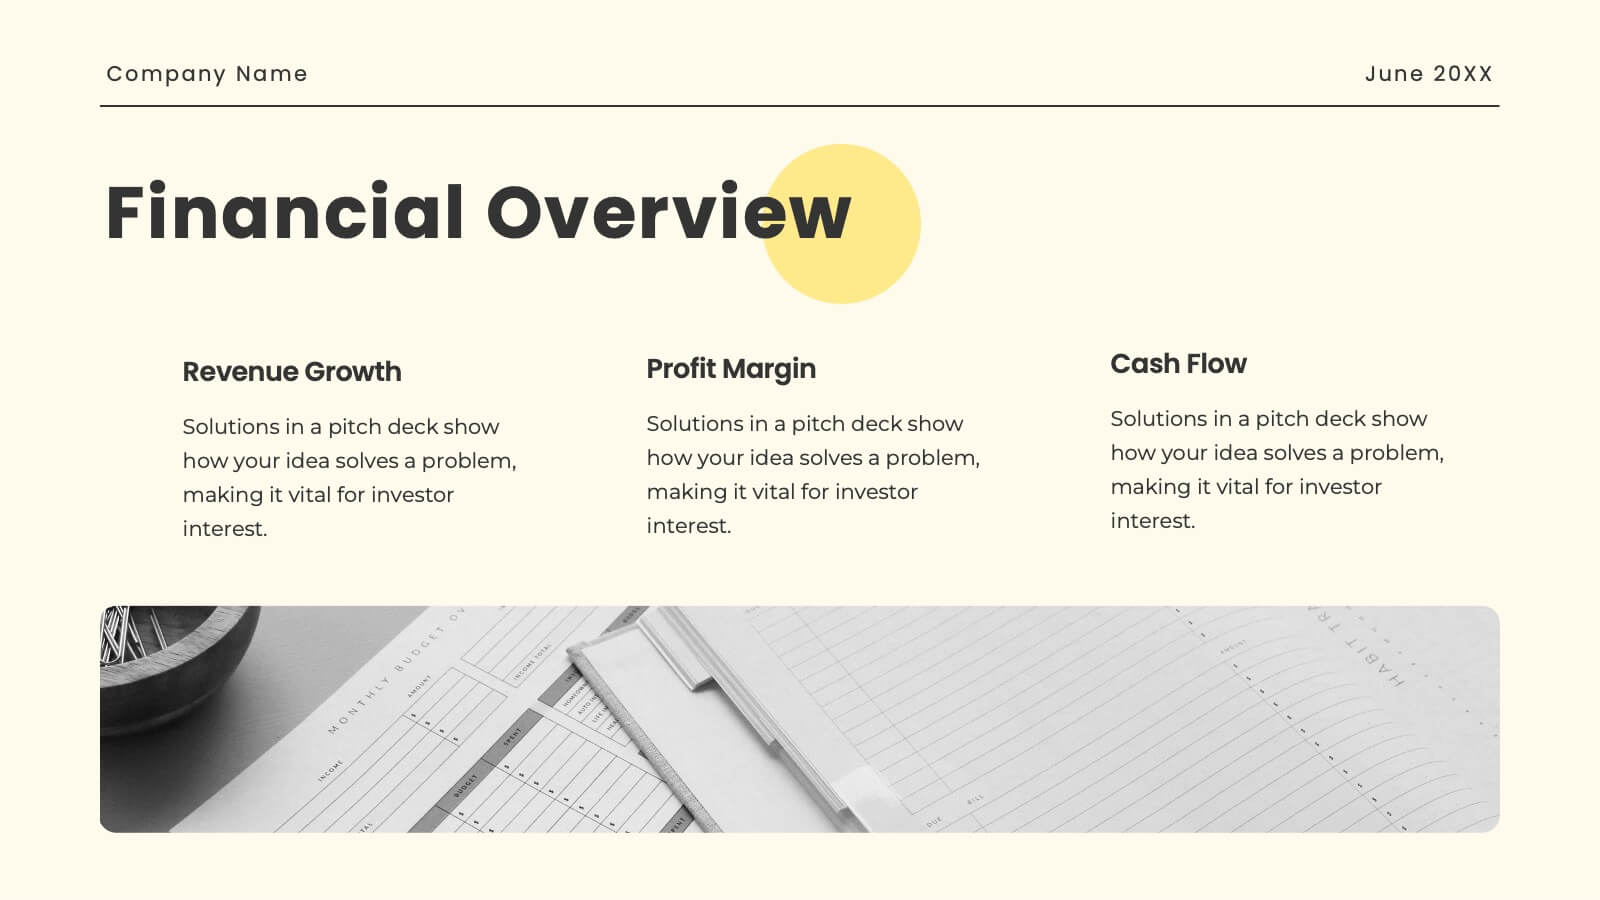
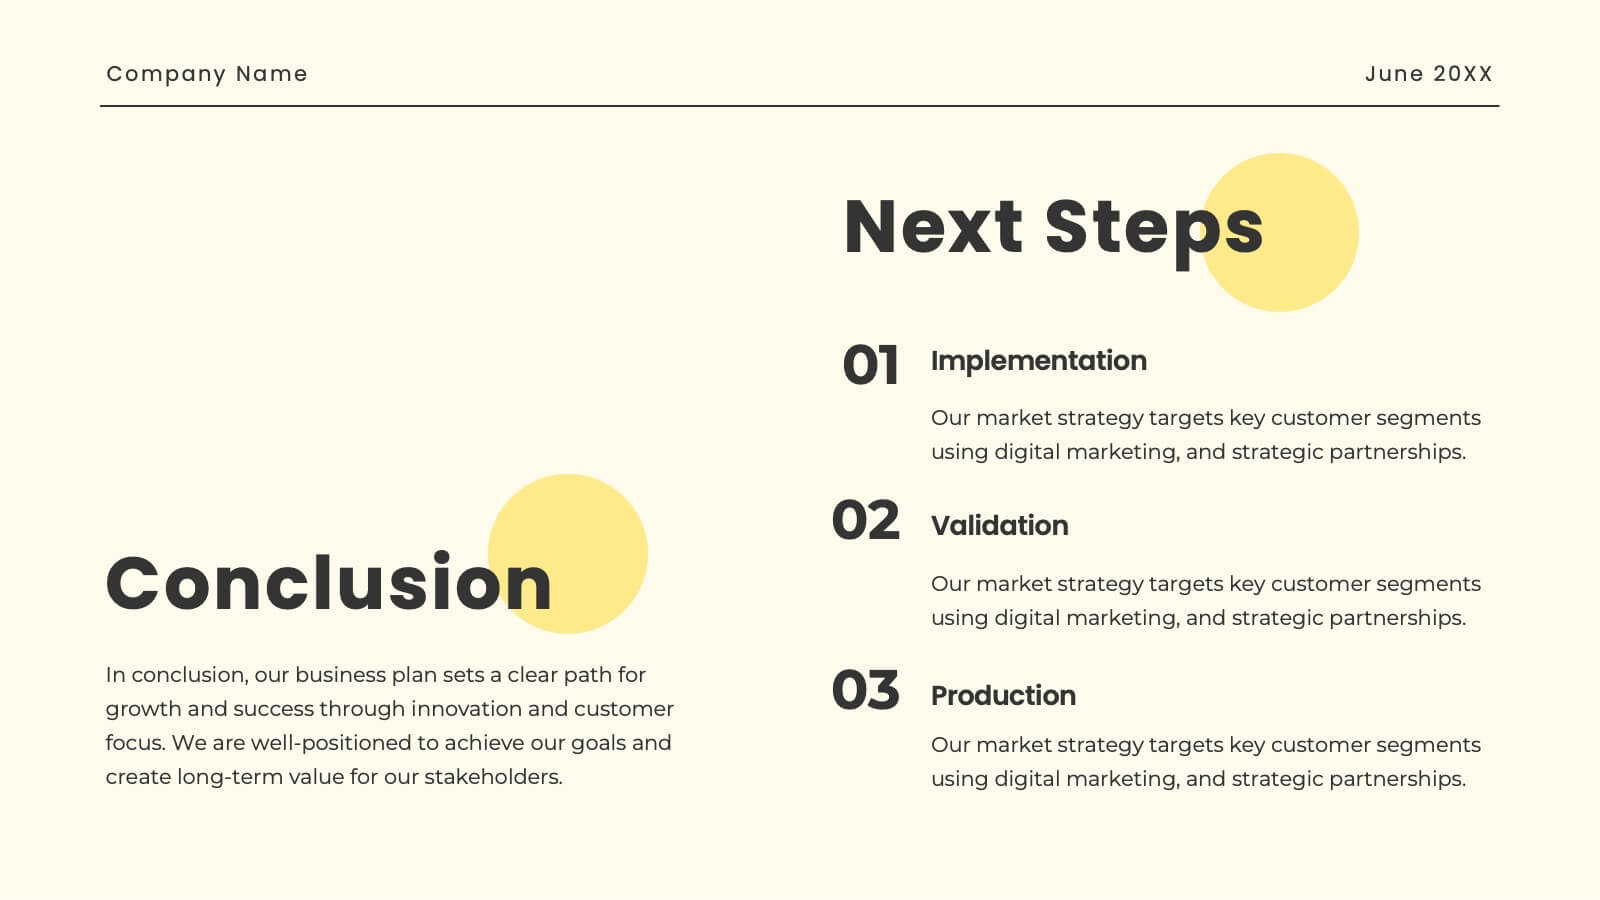
Wave Startup Strategy Presentation
Pitch your startup strategy with this modern, vibrant template! It covers essentials like mission, vision, product overview, market analysis, and growth plans. Perfect for highlighting your team, financials, and milestones. Seamlessly compatible with PowerPoint, Keynote, and Google Slides for a smooth, professional presentation every time.


5 diapositivas
Root Cause Analysis Fishbone Format Presentation
Break down complex problems with the Root Cause Analysis Fishbone Format Presentation. Designed to identify contributing factors visually, this diagram helps teams analyze causes across multiple categories—ideal for quality control, troubleshooting, and process improvement. Fully editable in Canva, PowerPoint, or Google Slides for effortless customization.


6 diapositivas
Blue Ocean Strategy Business Model
Capture new market spaces with this innovative Blue Ocean Strategy slide. Designed with a dynamic hourglass visual, it helps you showcase differentiation and low-cost strategies clearly. Perfect for business strategy sessions, growth planning, and innovation discussions. Fully editable in PowerPoint, Keynote, and Google Slides.


4 diapositivas
Professional Business Meeting Agenda Presentation
Efficiently structure your next corporate gathering with the "Professional Business Meeting Agenda" presentation template. Its geometrically appealing layout organizes discussion points in a visually captivating manner, encouraging effective communication and engagement. Perfect for strategizing sessions, this template ensures that every item on your agenda is highlighted with clarity. Compatible across PowerPoint, Keynote, and Google Slides, it’s designed to make every meeting more productive.


21 diapositivas
Inventra Creative Portfolio Presentation
Make a lasting impression with this sleek and modern creative portfolio presentation template. Perfect for showcasing your artistic journey, featured projects, unique style, and client testimonials. Highlight your creative process, pricing, and services with a bold and professional layout. Fully customizable in PowerPoint, Keynote, and Google Slides.


4 diapositivas
Surface vs Depth Model Iceberg Presentation
Uncover the unseen with this Surface vs Depth Model Iceberg presentation. Designed to highlight the contrast between visible factors (15%) and underlying elements (85%), this layout is ideal for business analysis, user behavior, or strategic planning. Fully editable in Canva, PowerPoint, and Google Slides for seamless customization.


6 diapositivas
Digital Mockup Infographic
This collection of digital mockup templates is expertly designed to showcase your digital products and services with clarity and impact. Whether you are presenting an app, website, or any other digital interface, these templates provide the perfect backdrop, illustrating how your designs perform across different devices such as smartphones, tablets, and desktop computers. The clean, modern aesthetic of each mockup is coupled with a user-friendly layout that emphasizes ease of use and visual appeal. The subtle color palettes and strategic use of space ensure that your product stands out, making these mockups a valuable tool for professionals in software development, digital marketing, and graphic design. Customizable elements allow you to adapt each template to fit your specific project needs, making it straightforward to insert your own screenshots and text. Use these mockups in client presentations, marketing materials, or portfolio showcases to communicate the functionality and aesthetics of your digital products effectively.


5 diapositivas
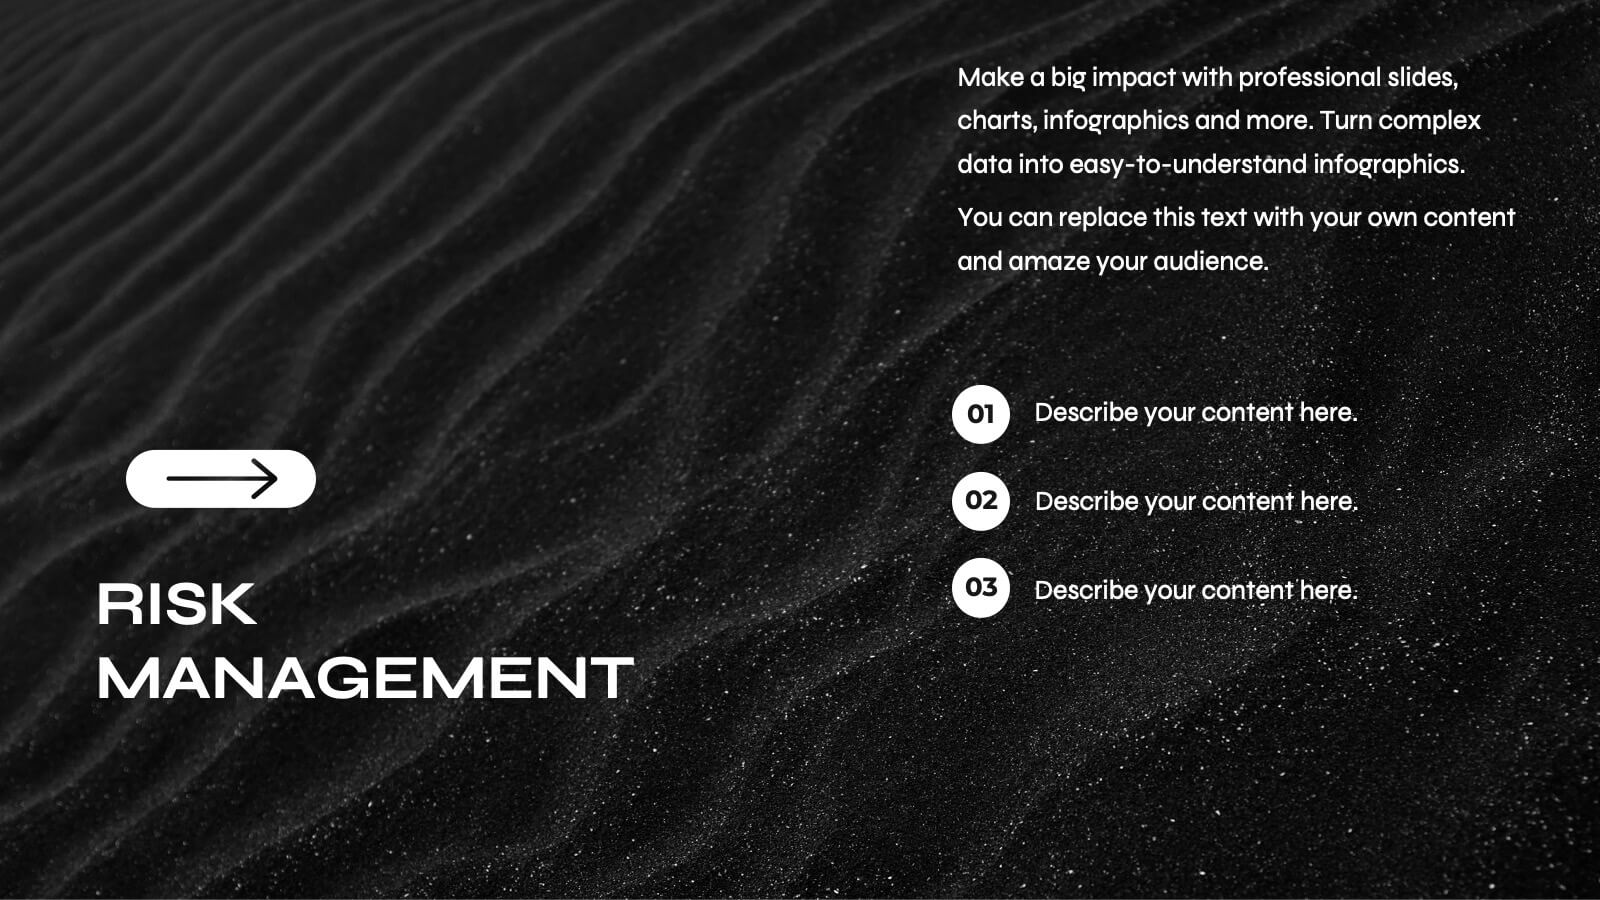
Insurance Policy Structure Presentation
Add a touch of creativity to your financial reports with this clean and modern presentation design. Perfect for explaining coverage breakdowns, risk management strategies, or policy frameworks, it simplifies complex ideas through visuals. Fully editable and compatible with PowerPoint, Keynote, and Google Slides for a seamless presentation experience.


26 diapositivas
Financial Literacy Simple Presentation
Our "Financial Literacy" template is a must-have for anyone teaching money management, savings, and investment strategies. Compatible with PowerPoint, Keynote, and Google Slides, it makes financial education accessible and engaging. Introduce the basics with "Financial Literacy: Creating a Smarter Tomorrow" and outline your agenda with the "Table of Contents." The "Meet Our Team" slide can spotlight your financial experts, and the "Three Option Slide" breaks down key concepts like budgeting, saving, and investing. The "This is your big image slide" can visualize financial goals, while "Earn, Save, Invest, Protect." reinforces sound financial habits. Use "This is your Chart Slide" to present data on spending patterns and "Brain Infographic" to explore the psychology of spending. The template's clean design and customizable features make it easy to tailor your financial literacy presentation to any audience, ensuring that your message on smart money management is clear and impactful.

23 diapositivas
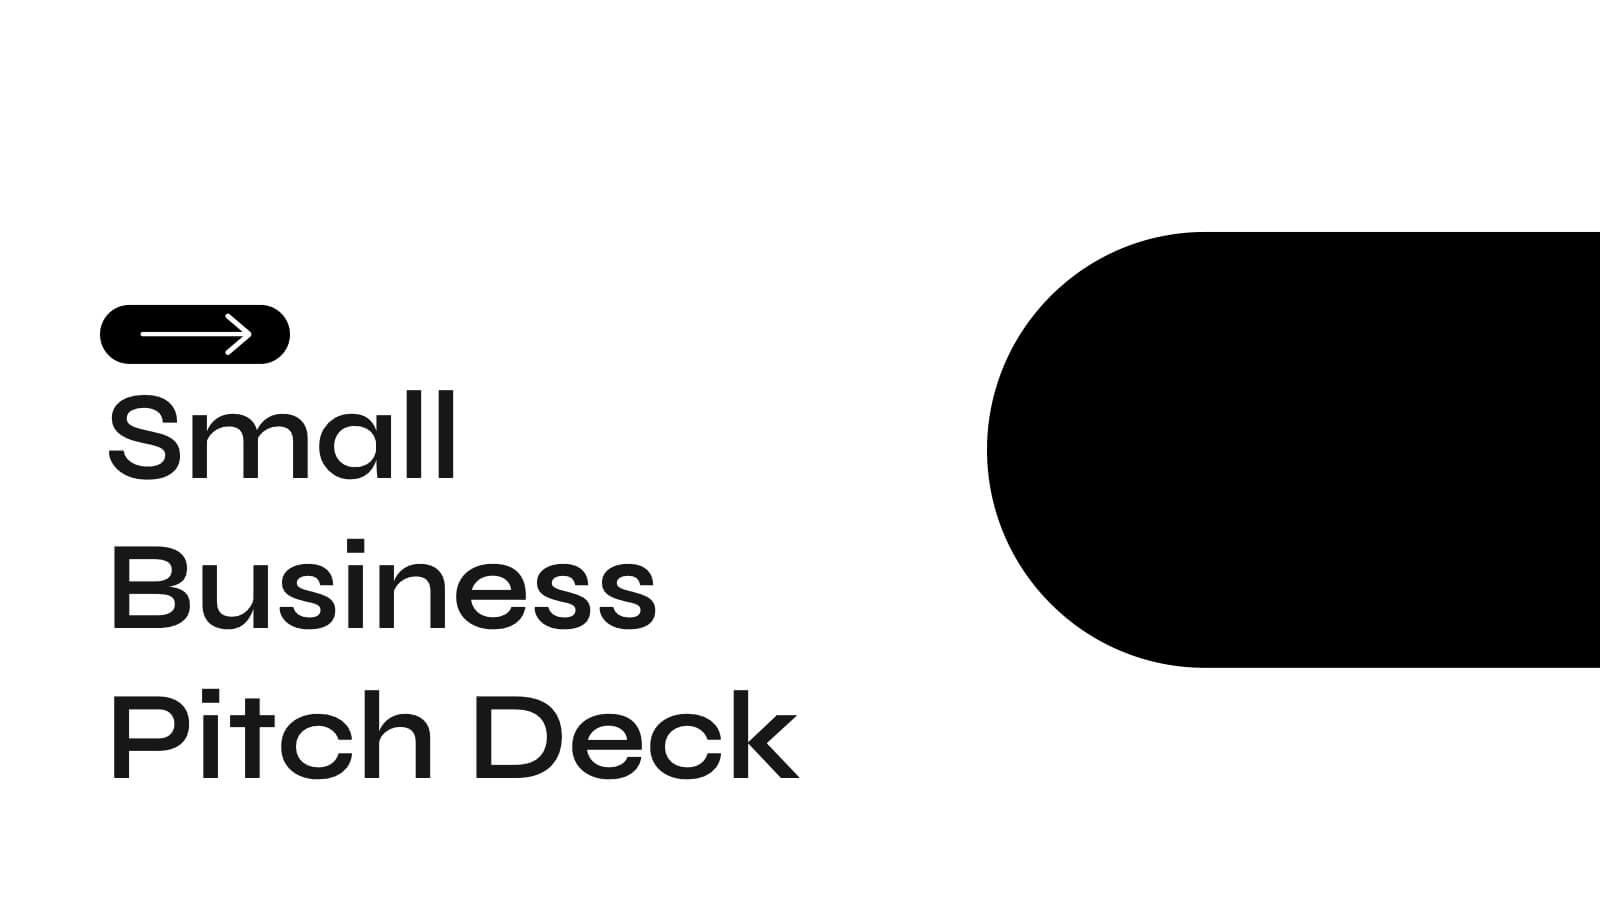
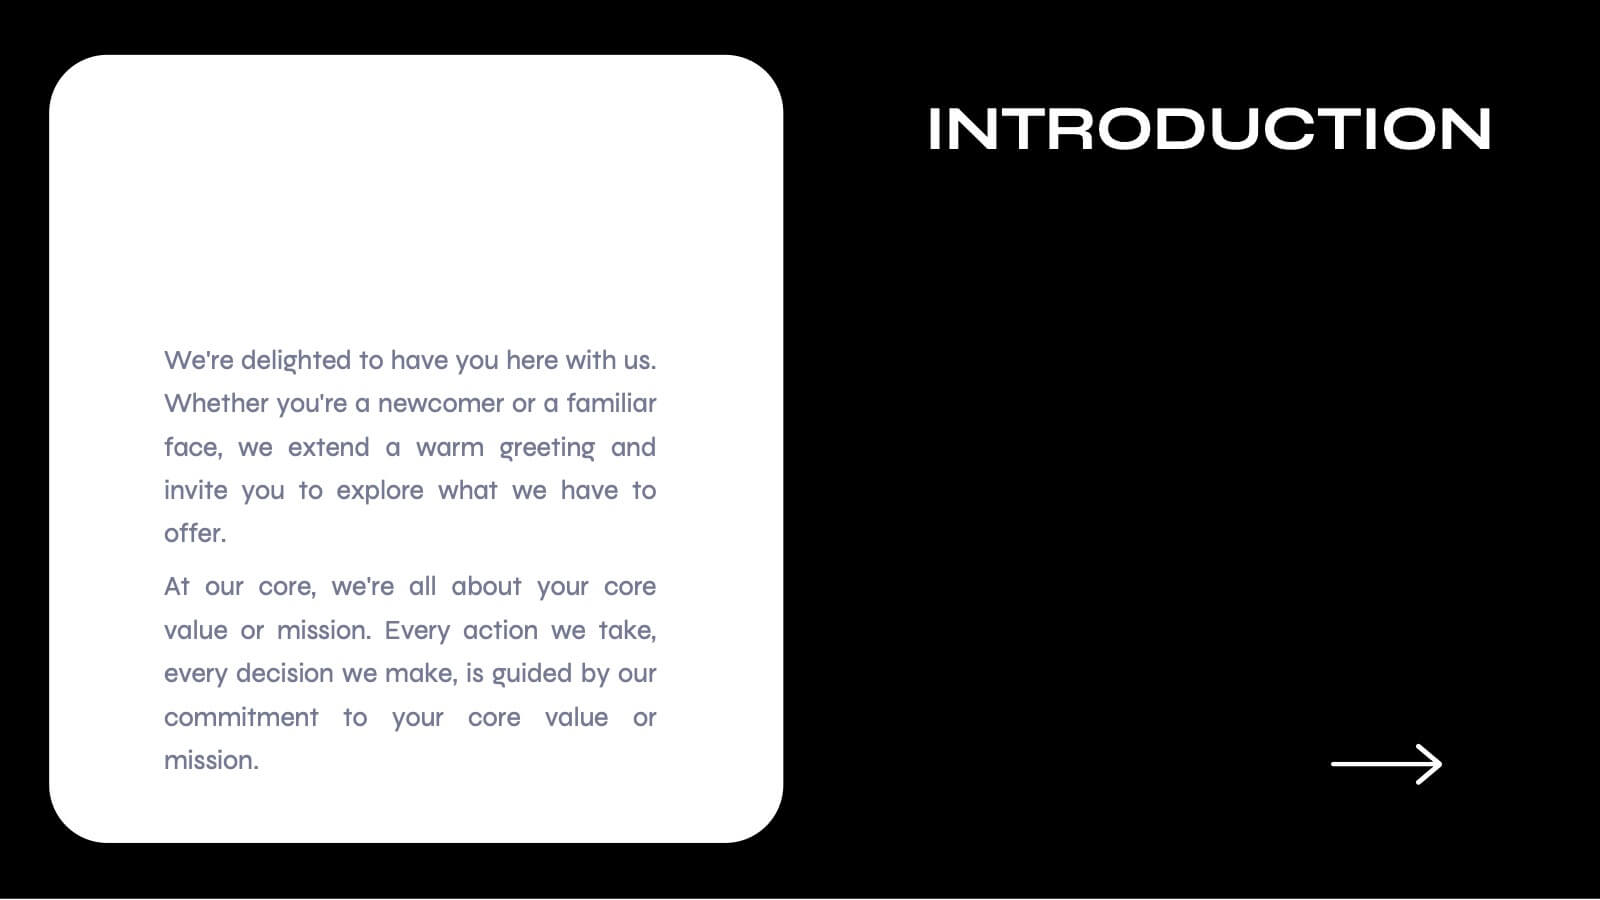
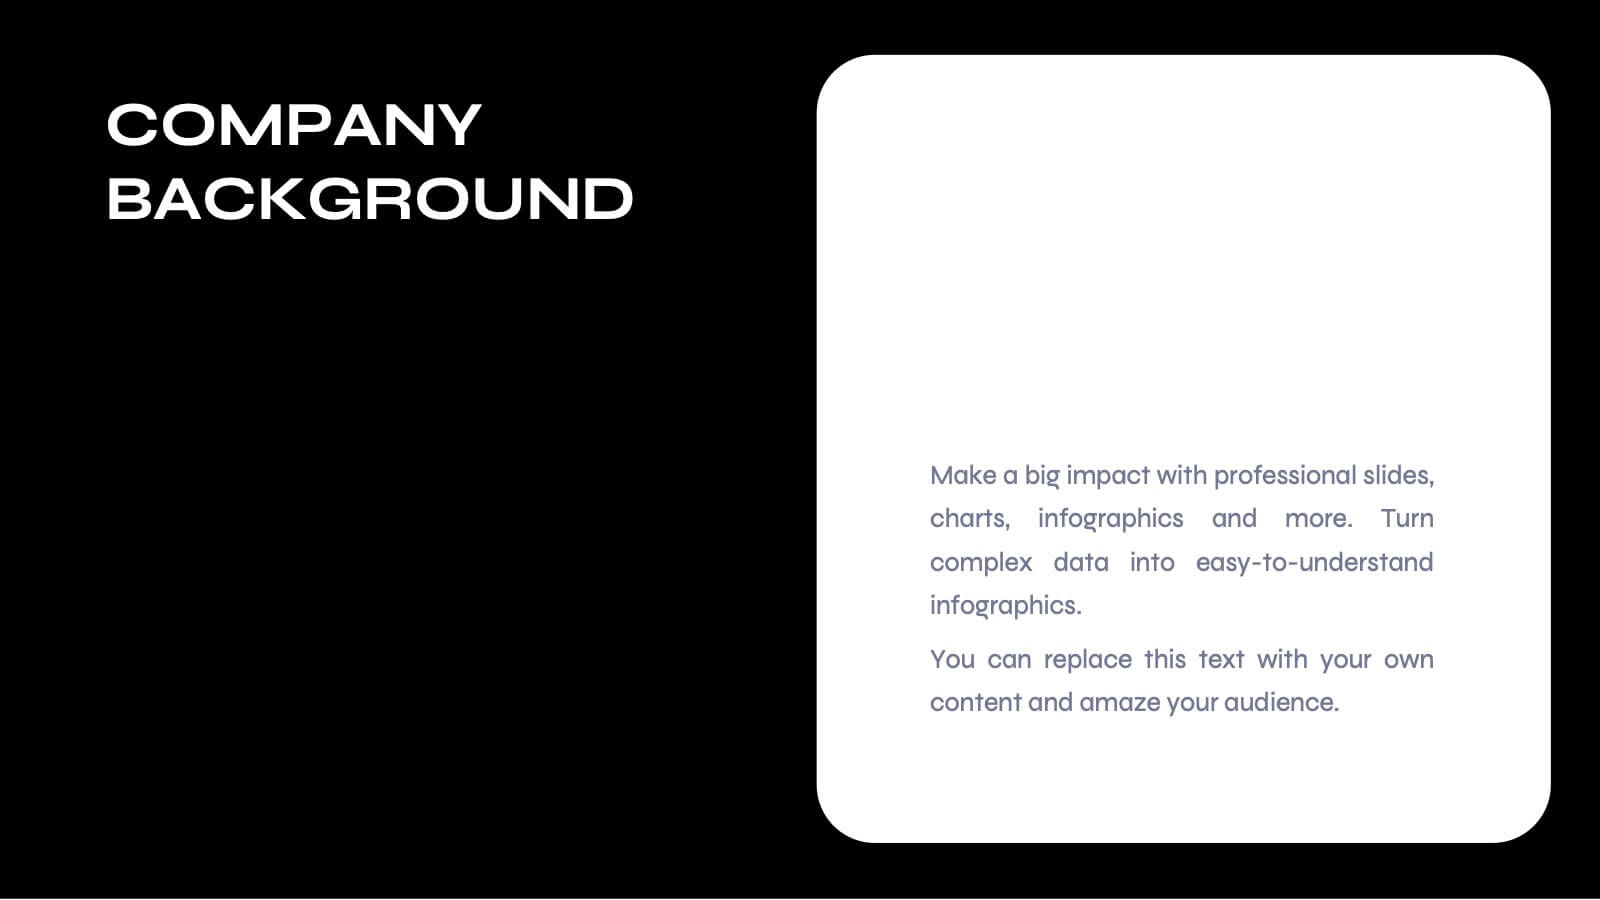
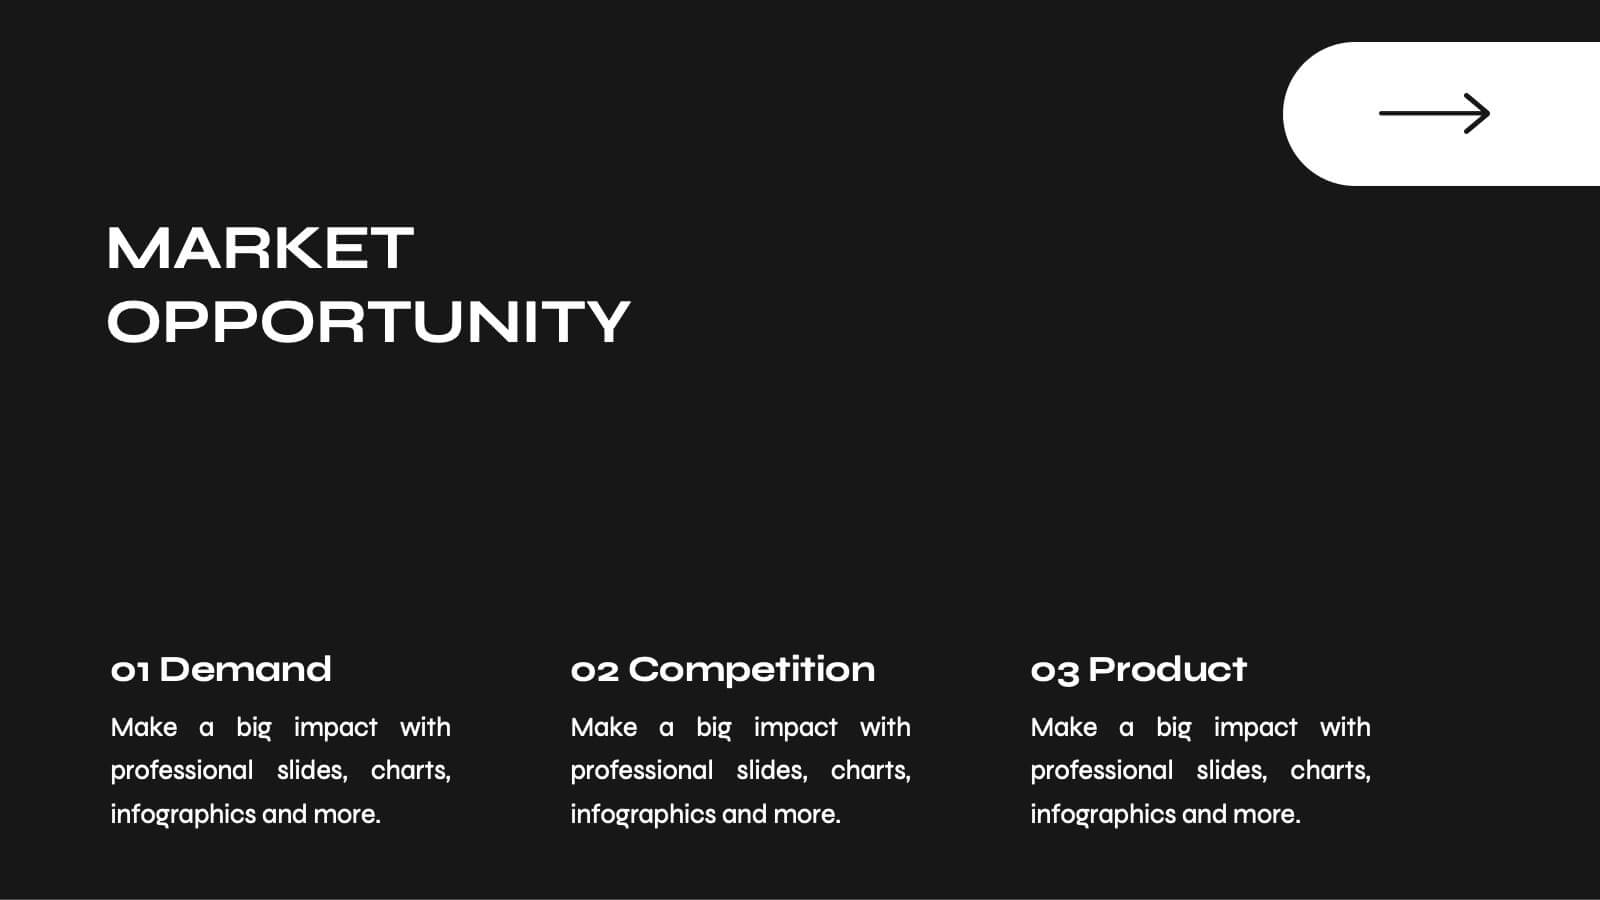
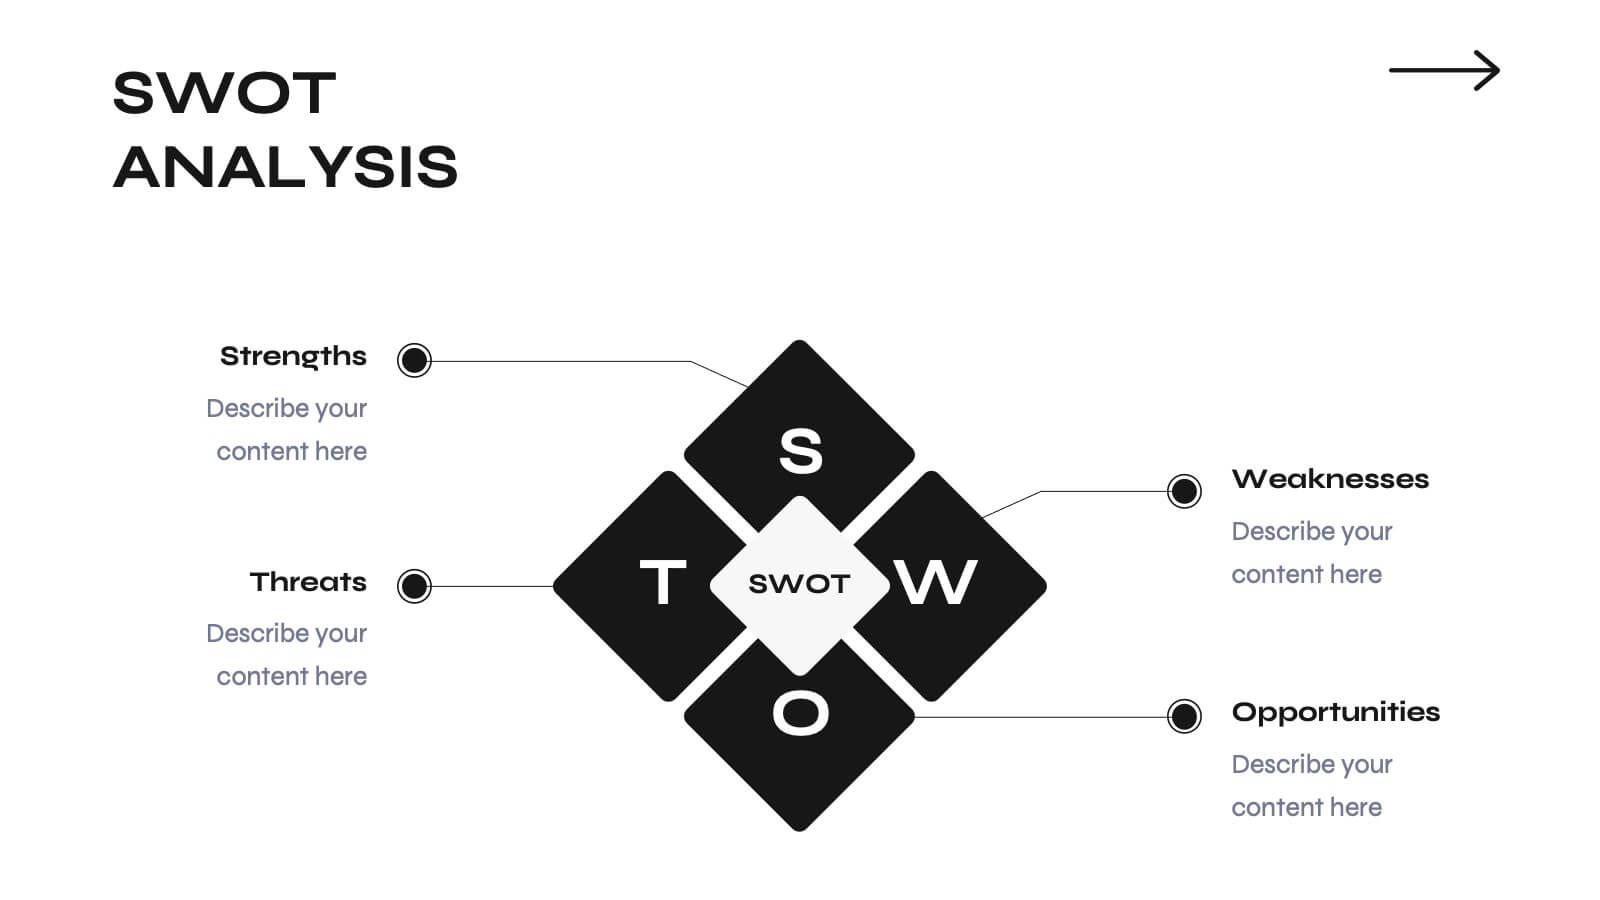
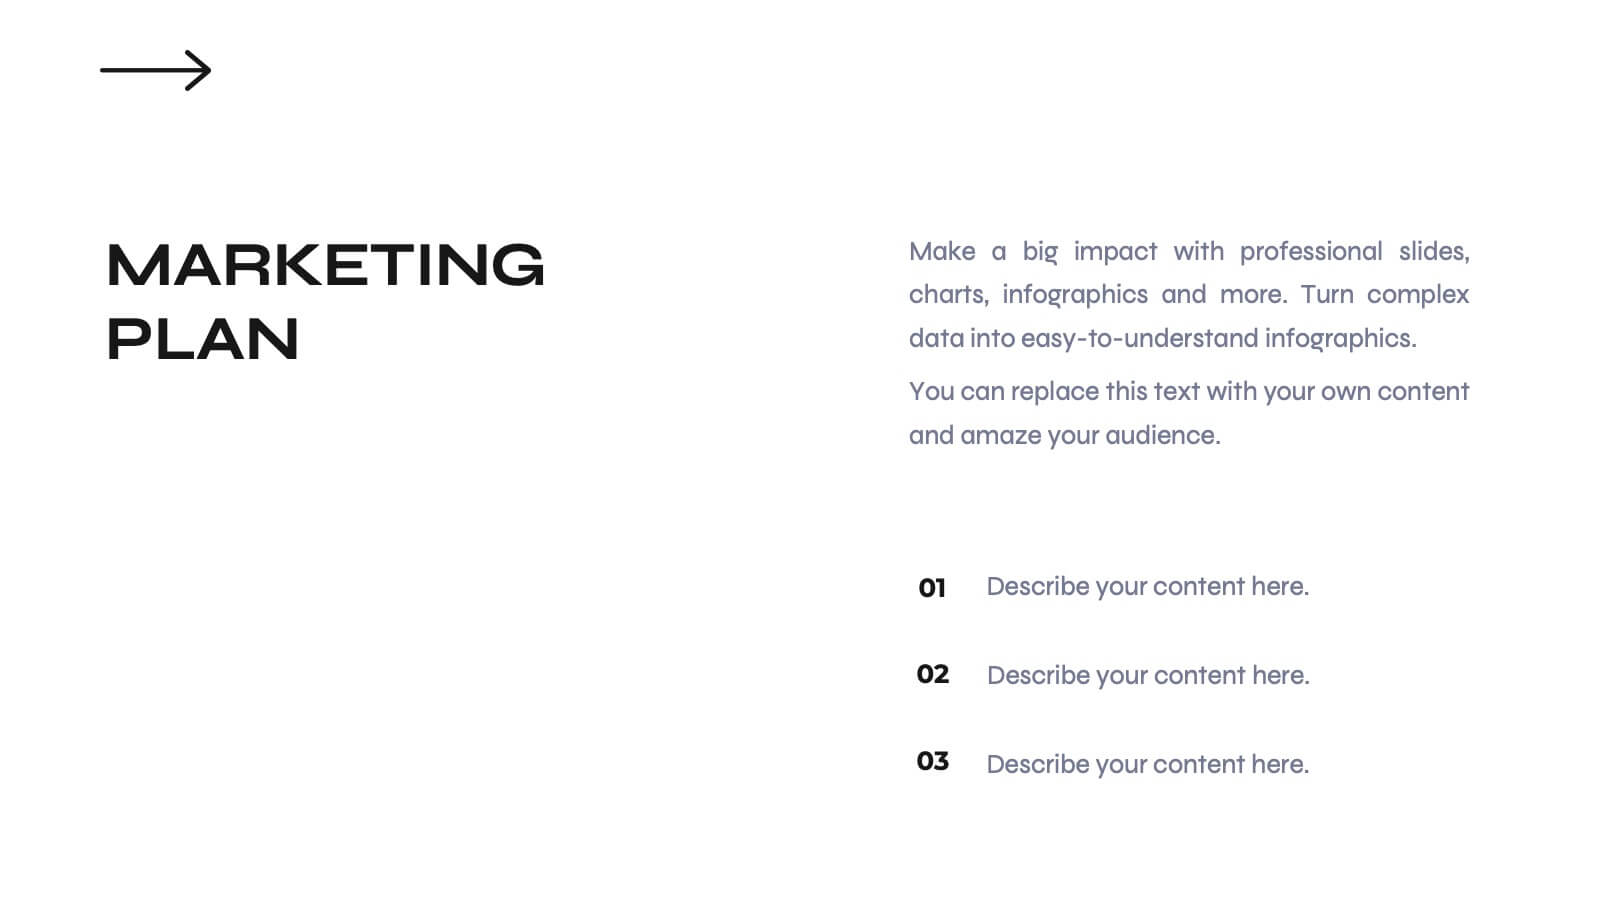
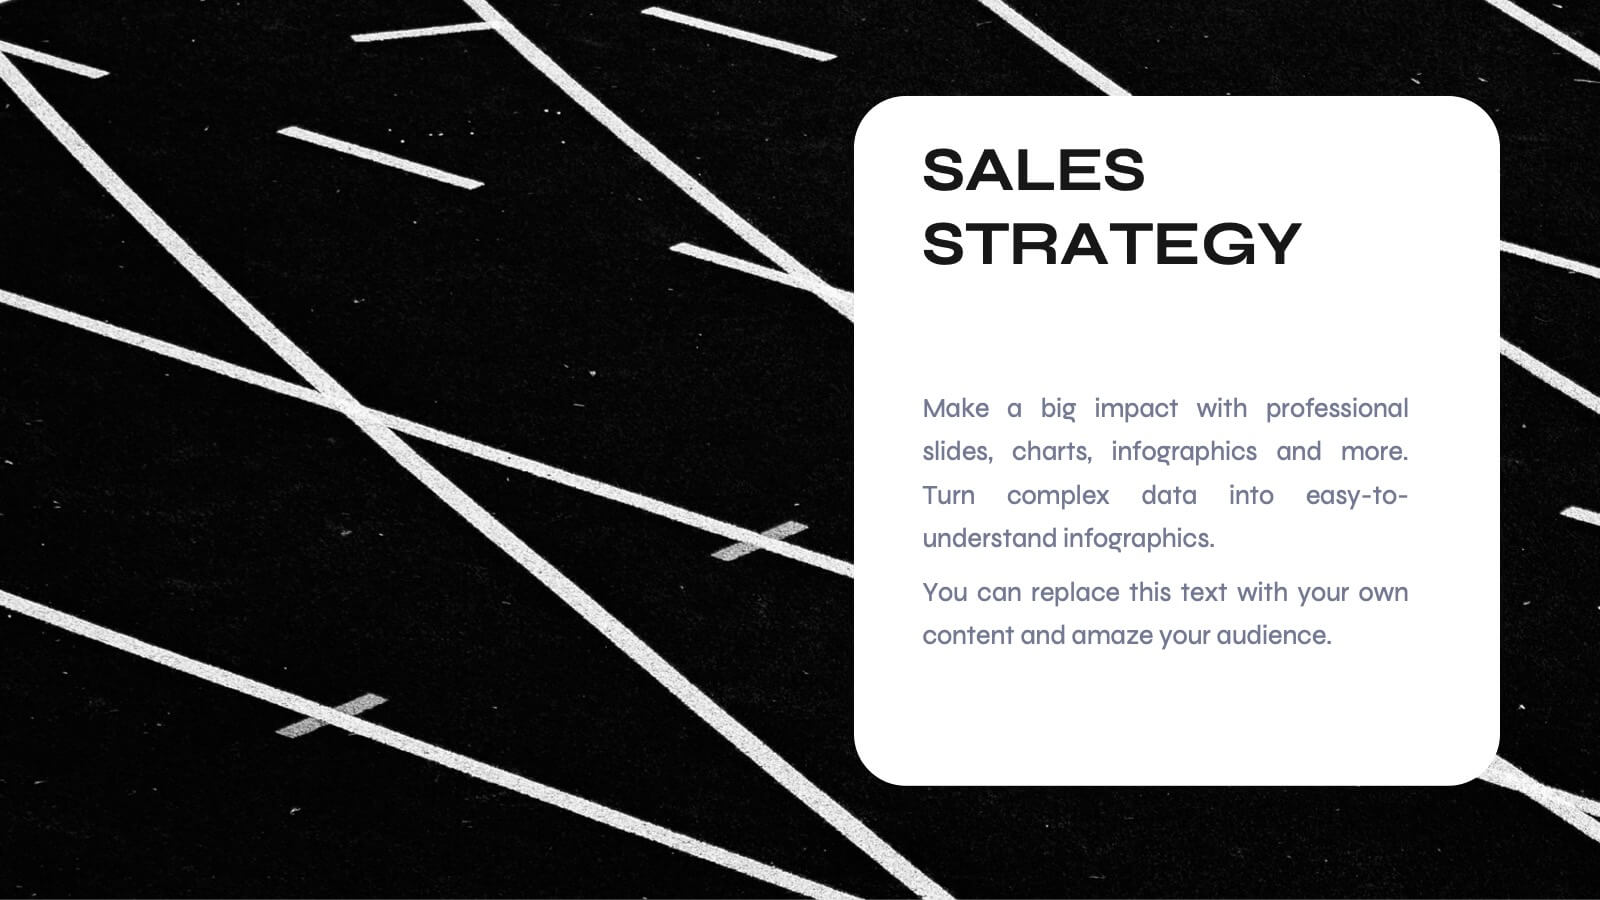
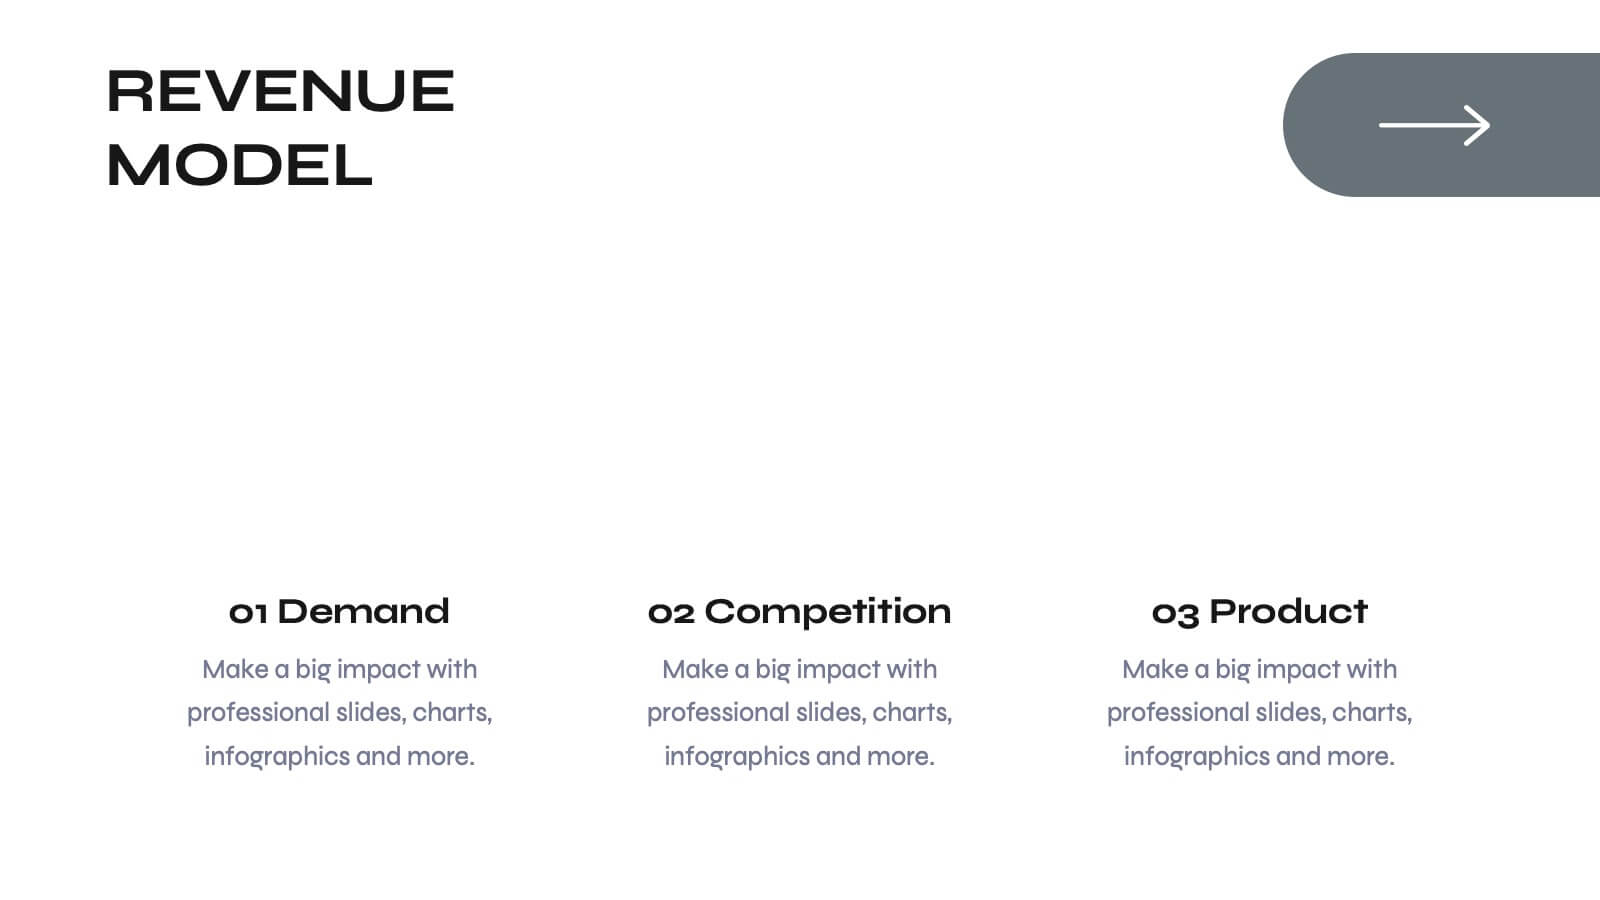
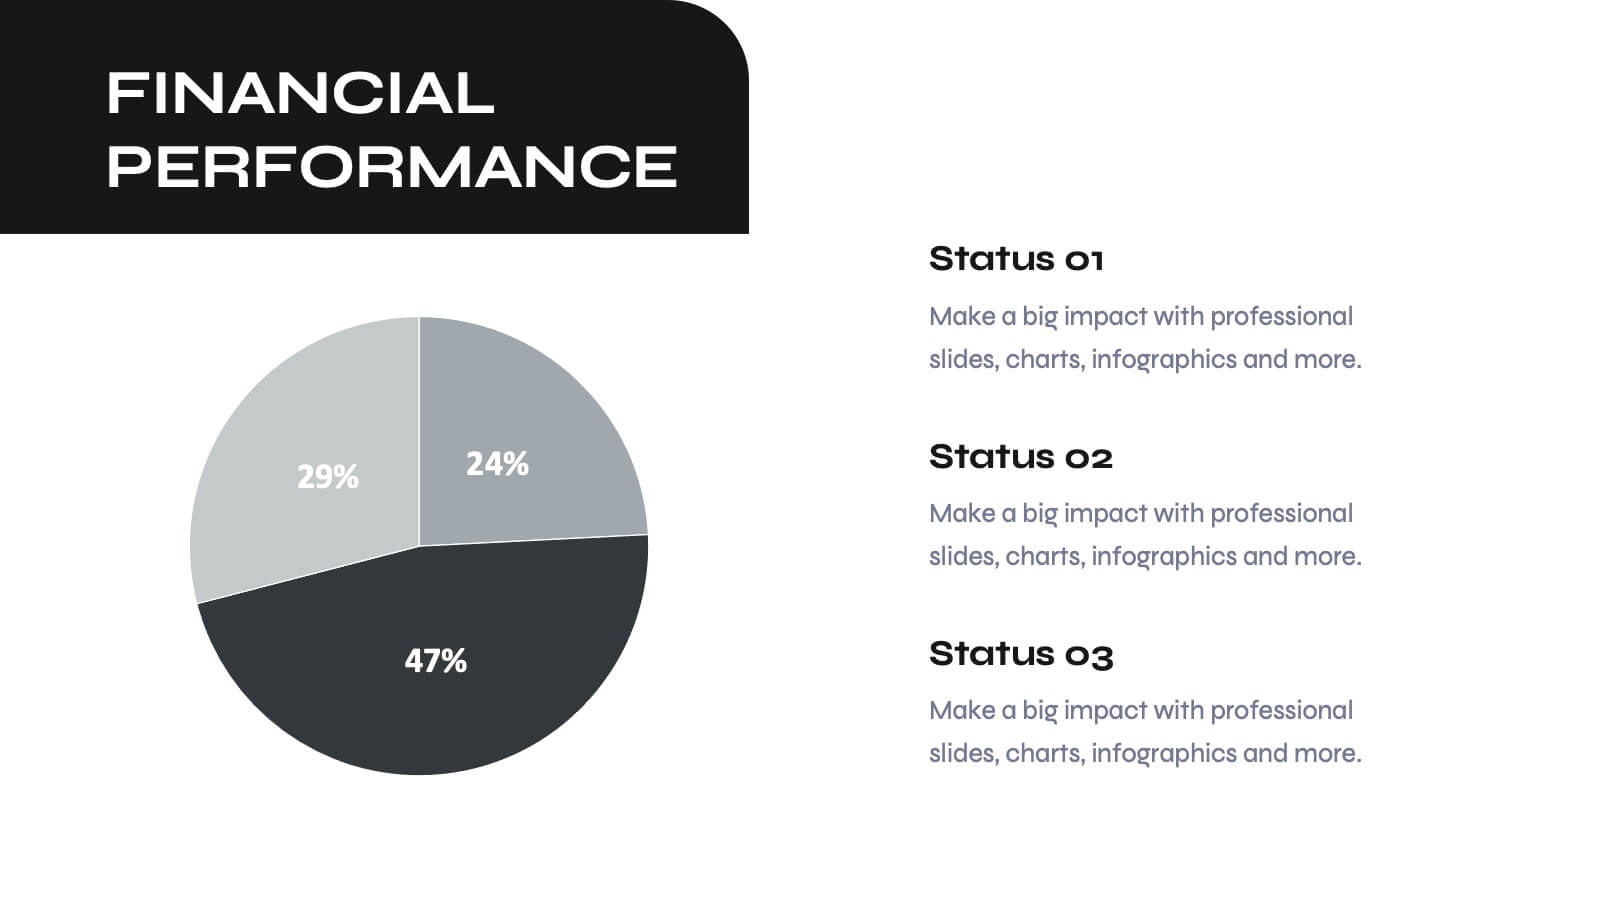
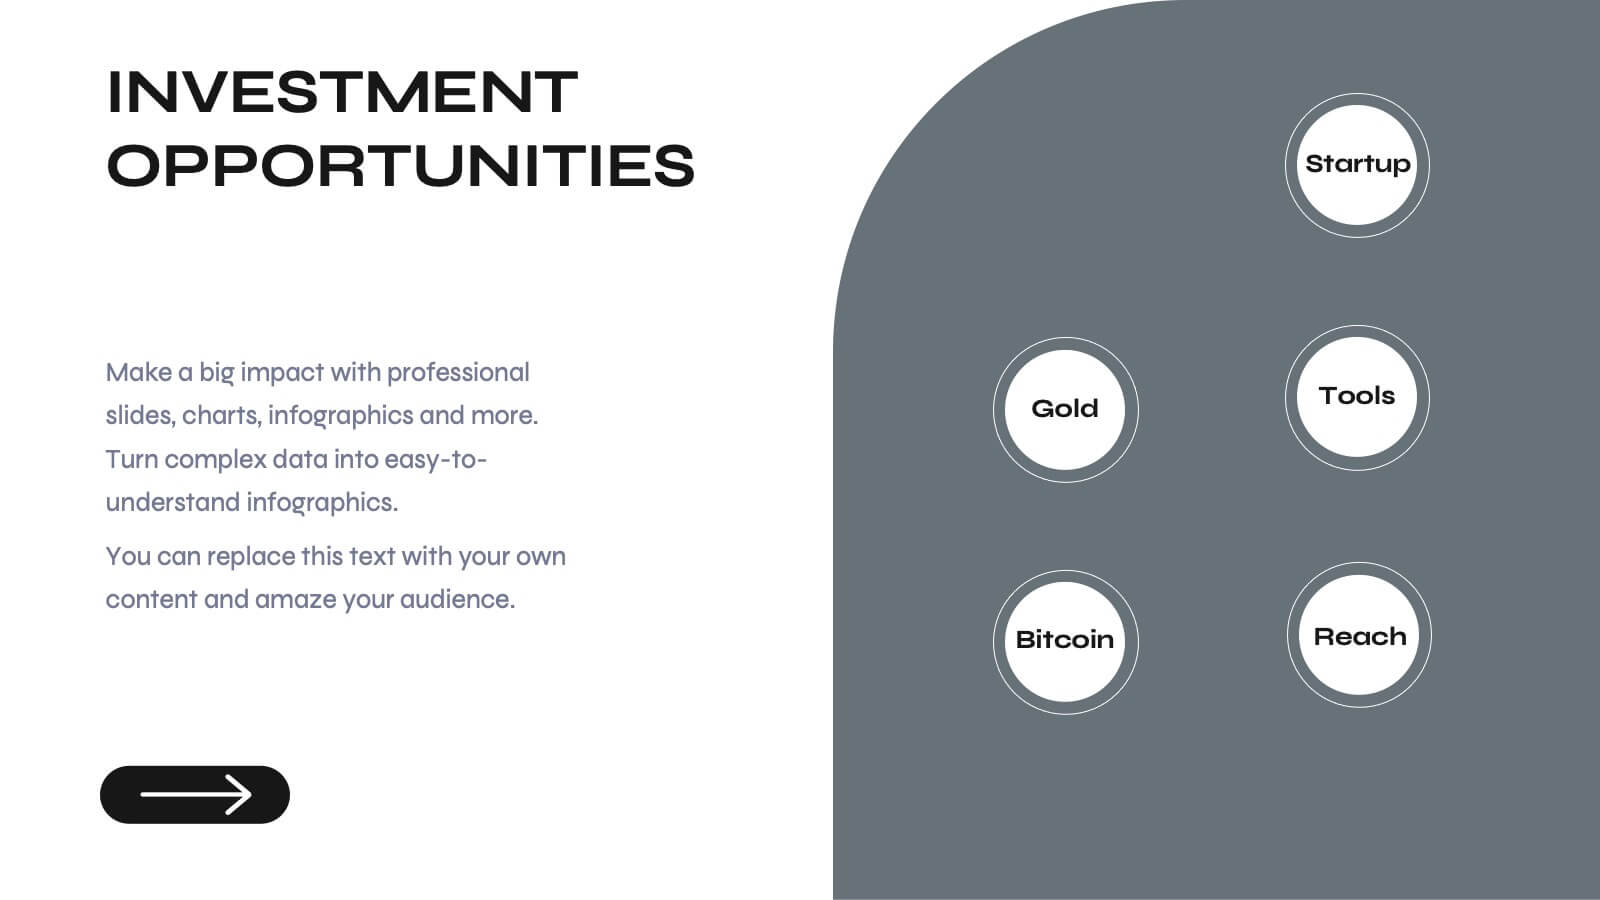
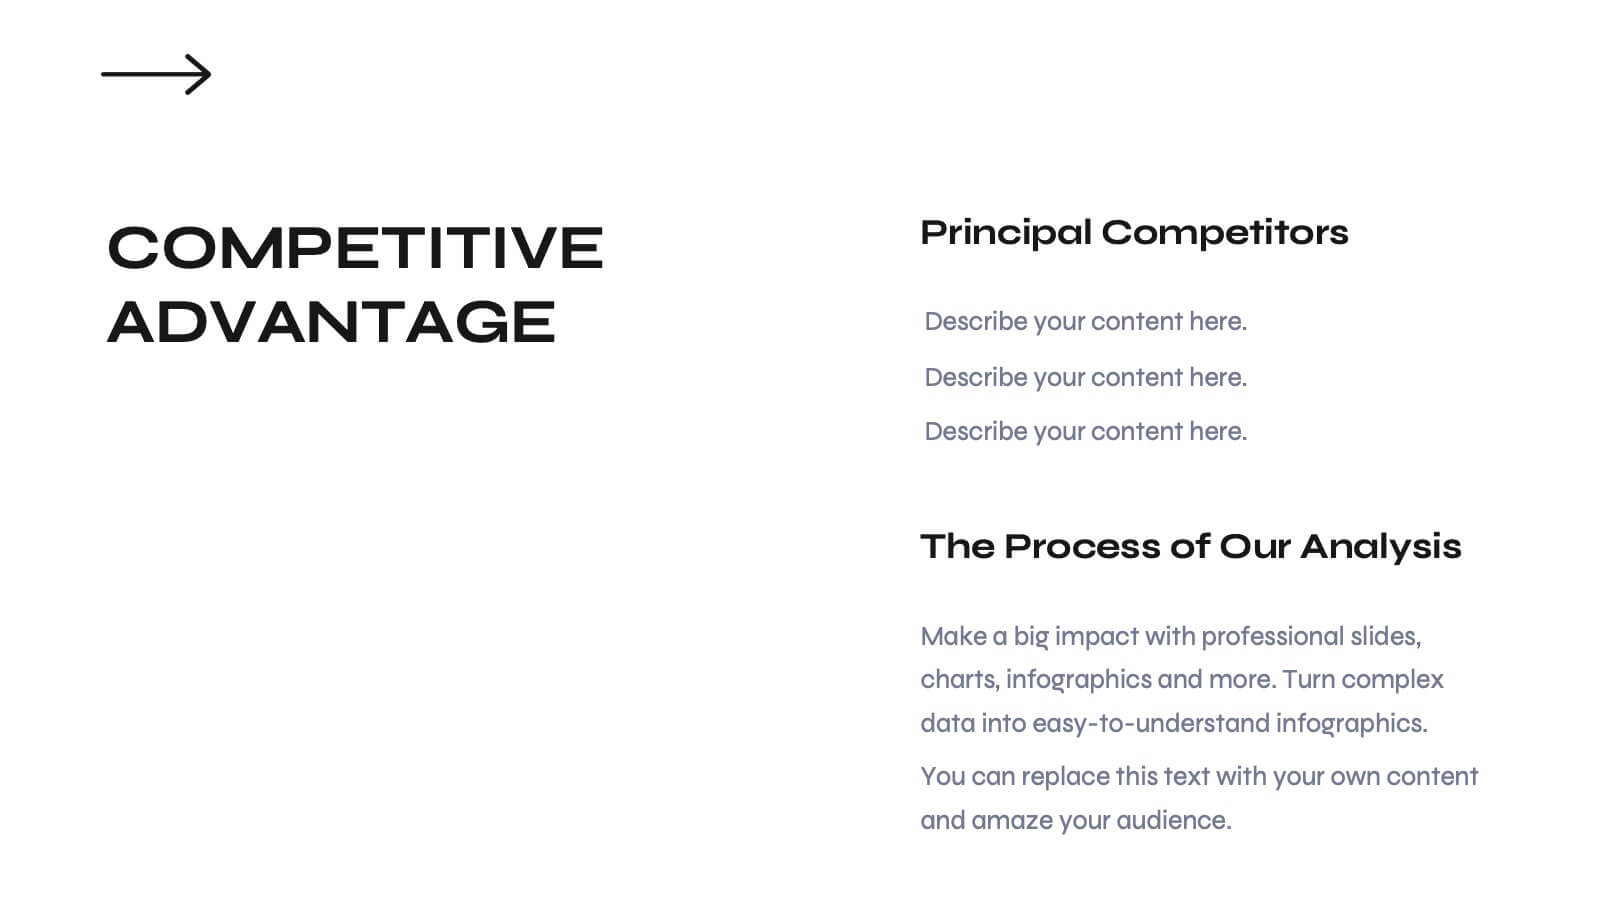
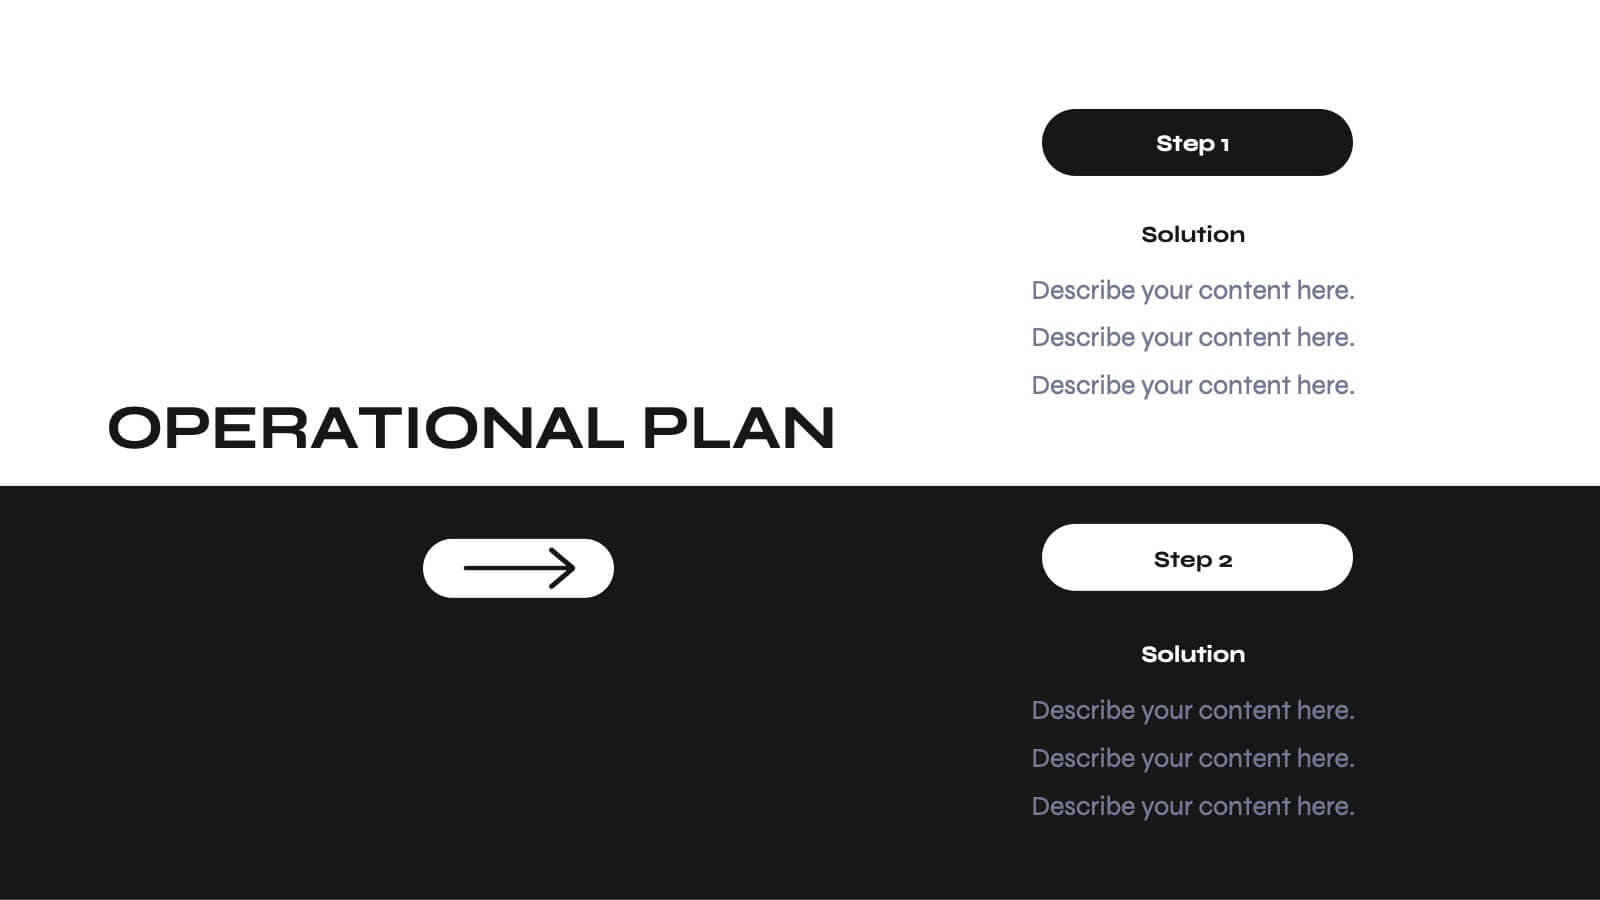
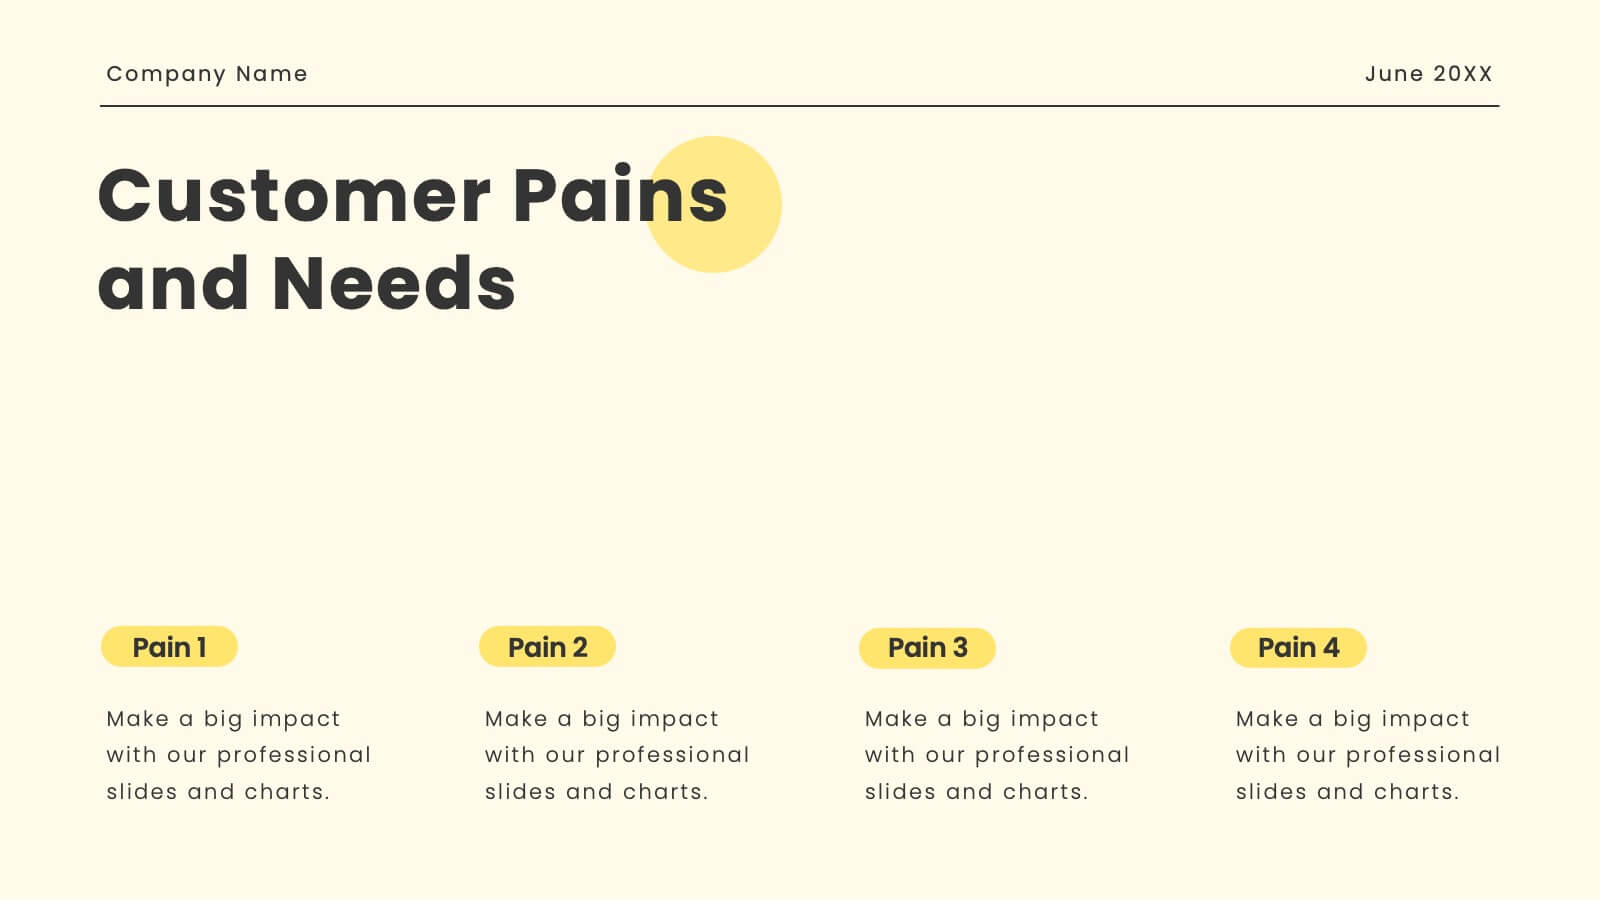
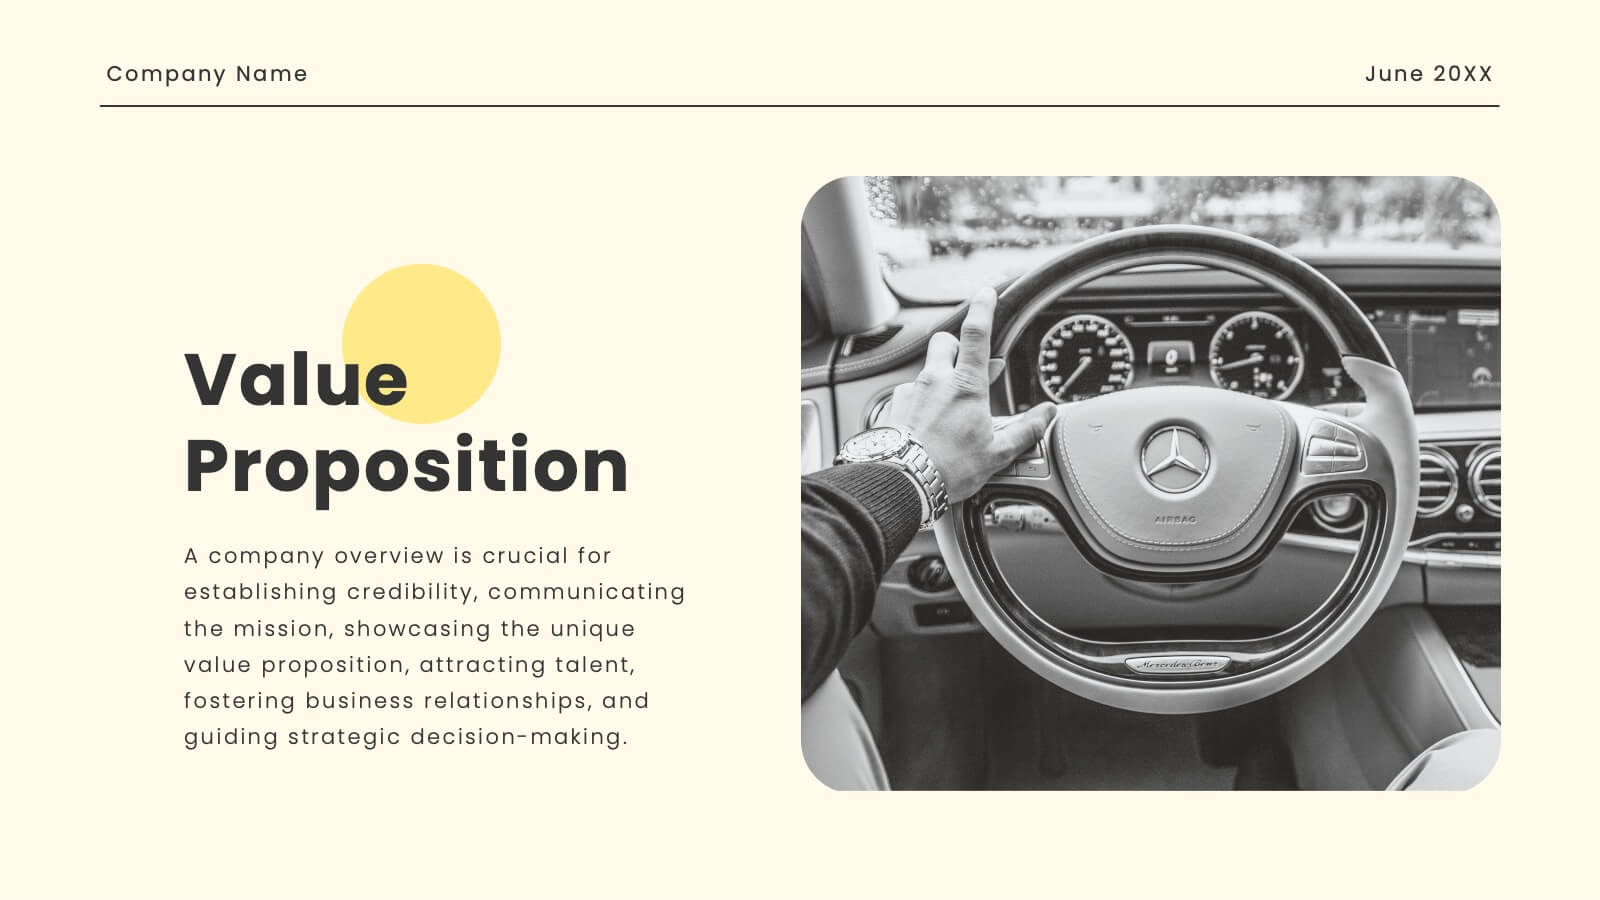
Odyssey Small Business Pitch Deck Presentation
Elevate your business pitch with this sleek, monochrome presentation template. Perfect for presenting company backgrounds, market opportunities, and financial performance, it features a minimalist design that enhances clarity and impact. Highlight your value proposition and strategic plans to captivate investors. Compatible with PowerPoint, Keynote, and Google Slides, it ensures seamless presentations on any platform.


23 diapositivas
Kitsune Startup Strategy Presentation
This startup strategy template is designed for clear communication of business vision, target market, and unique value proposition. It also includes slides for marketing strategies, team introduction, and financial overview. Its clean, professional layout makes it ideal for investors or stakeholders. Compatible with PowerPoint, Keynote, and Google Slides for easy customization.


21 diapositivas
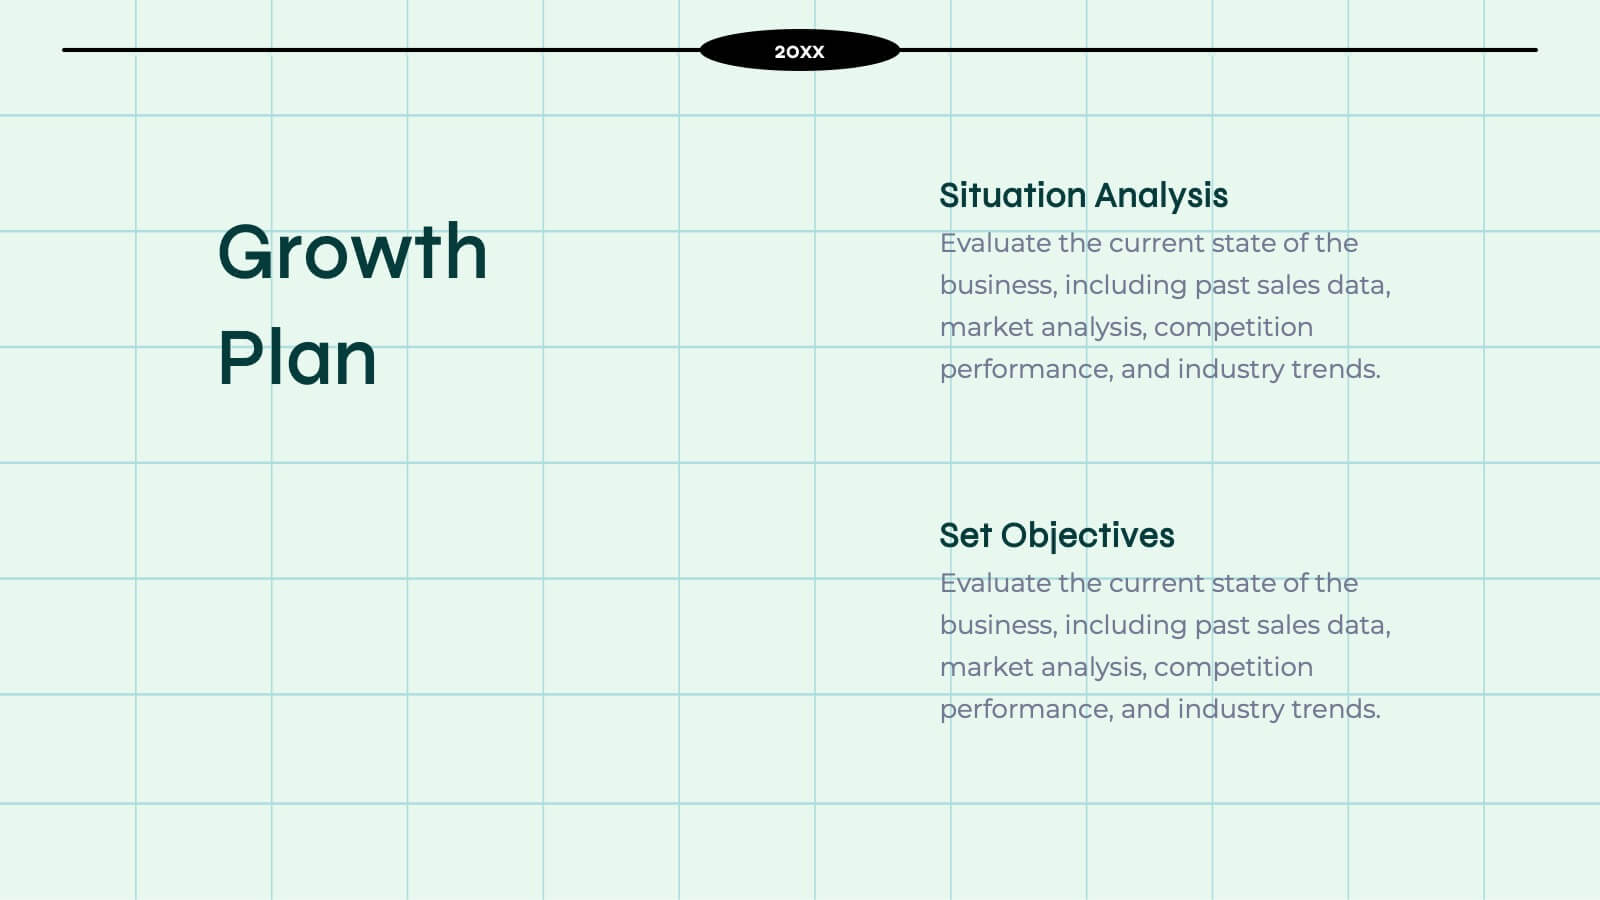
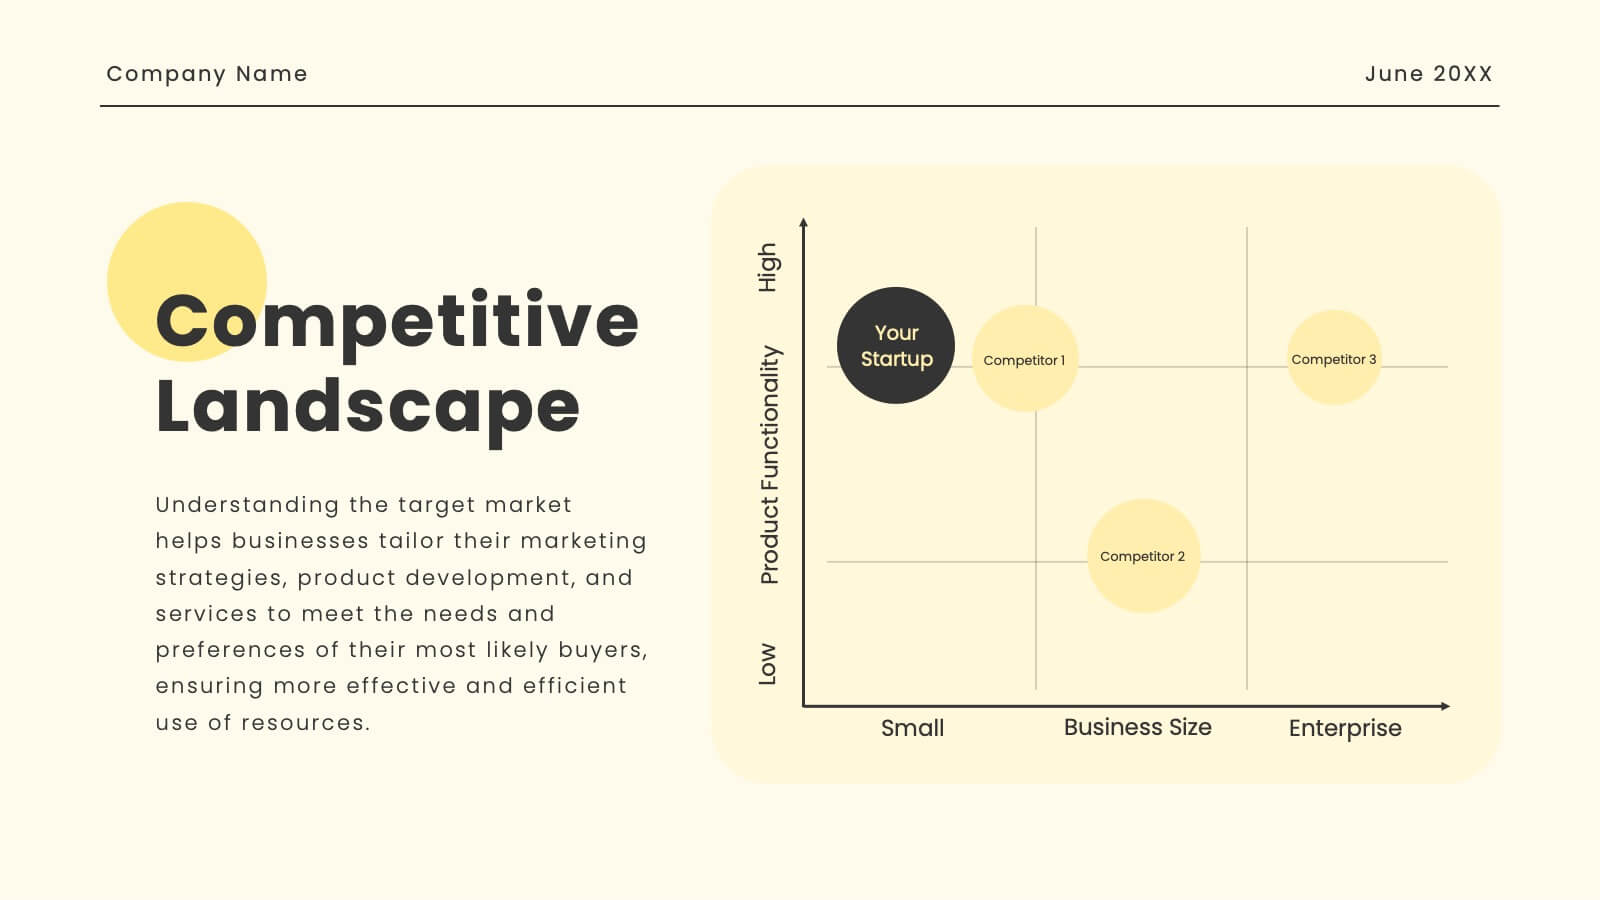
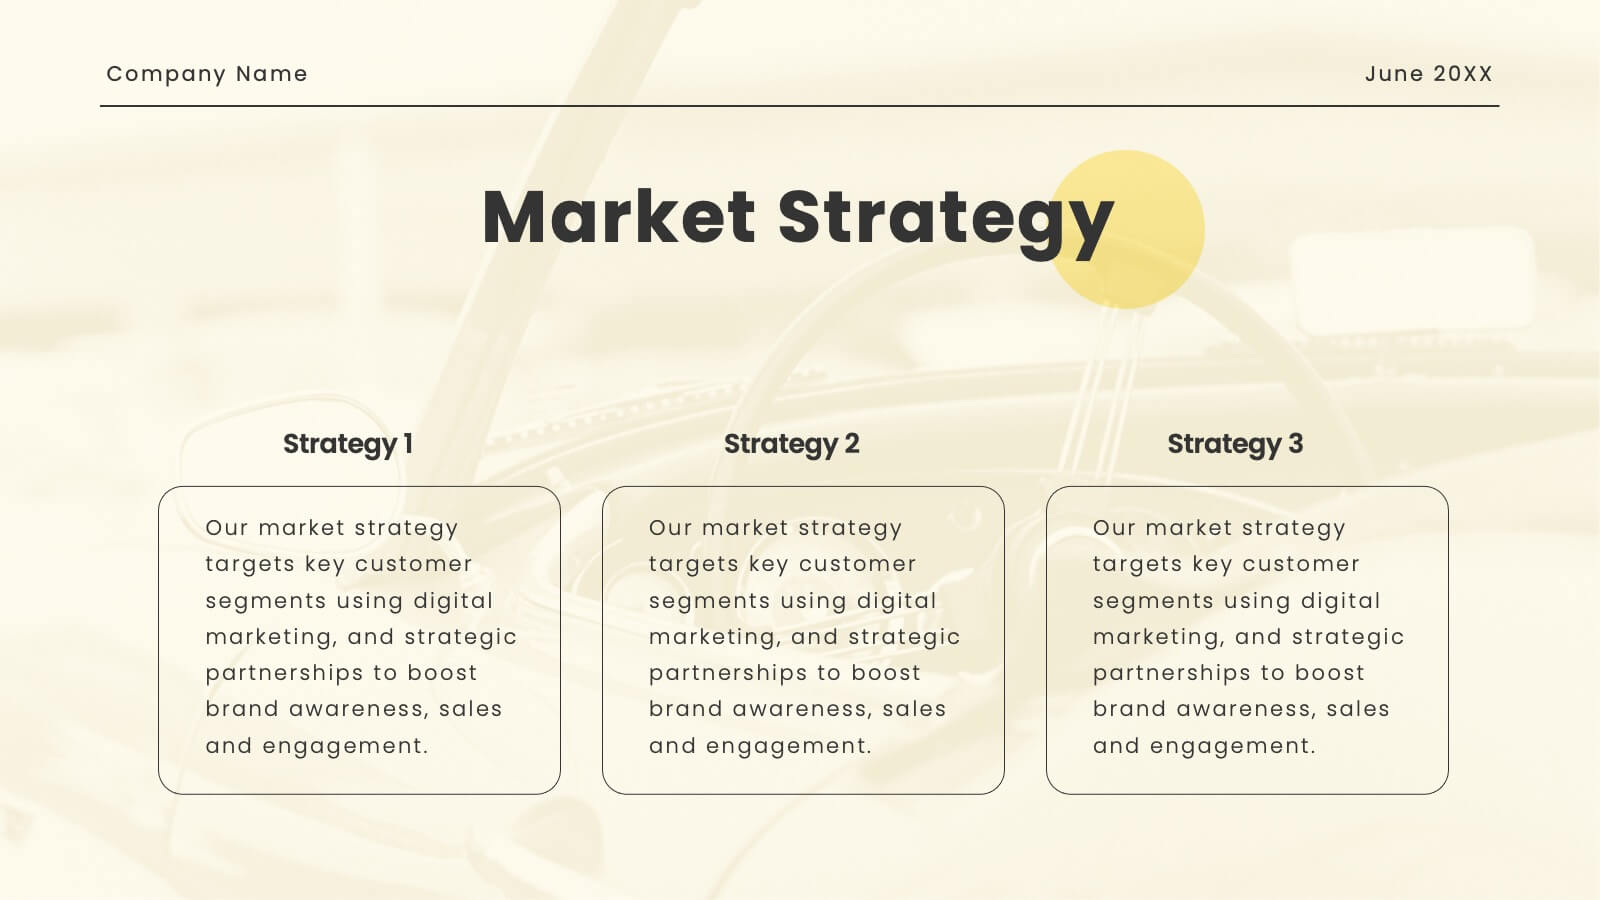
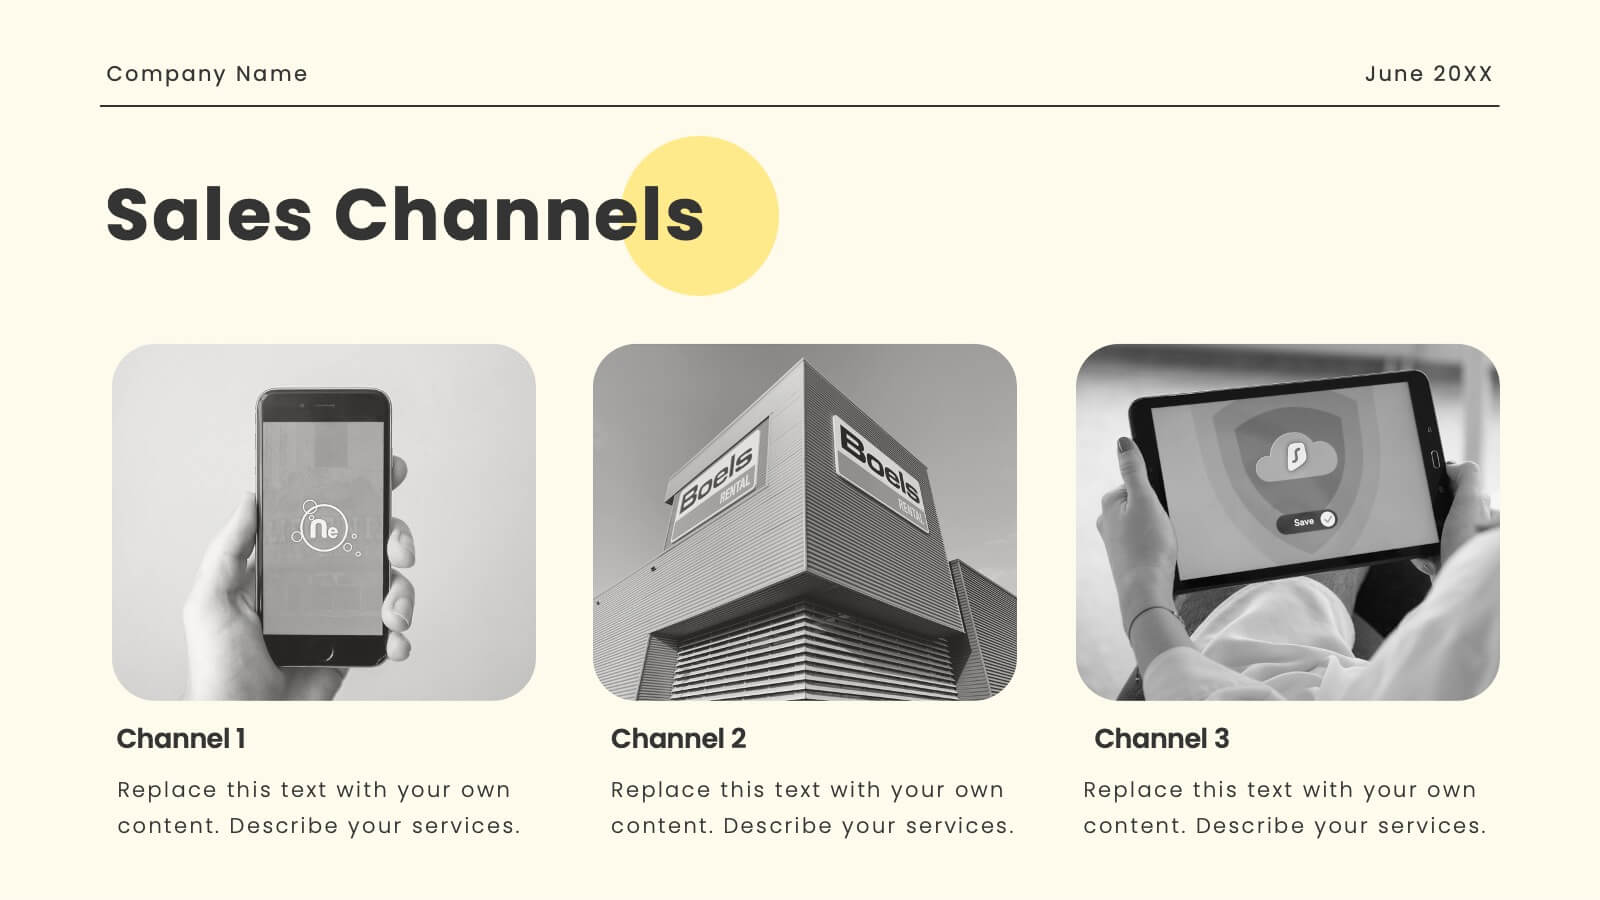
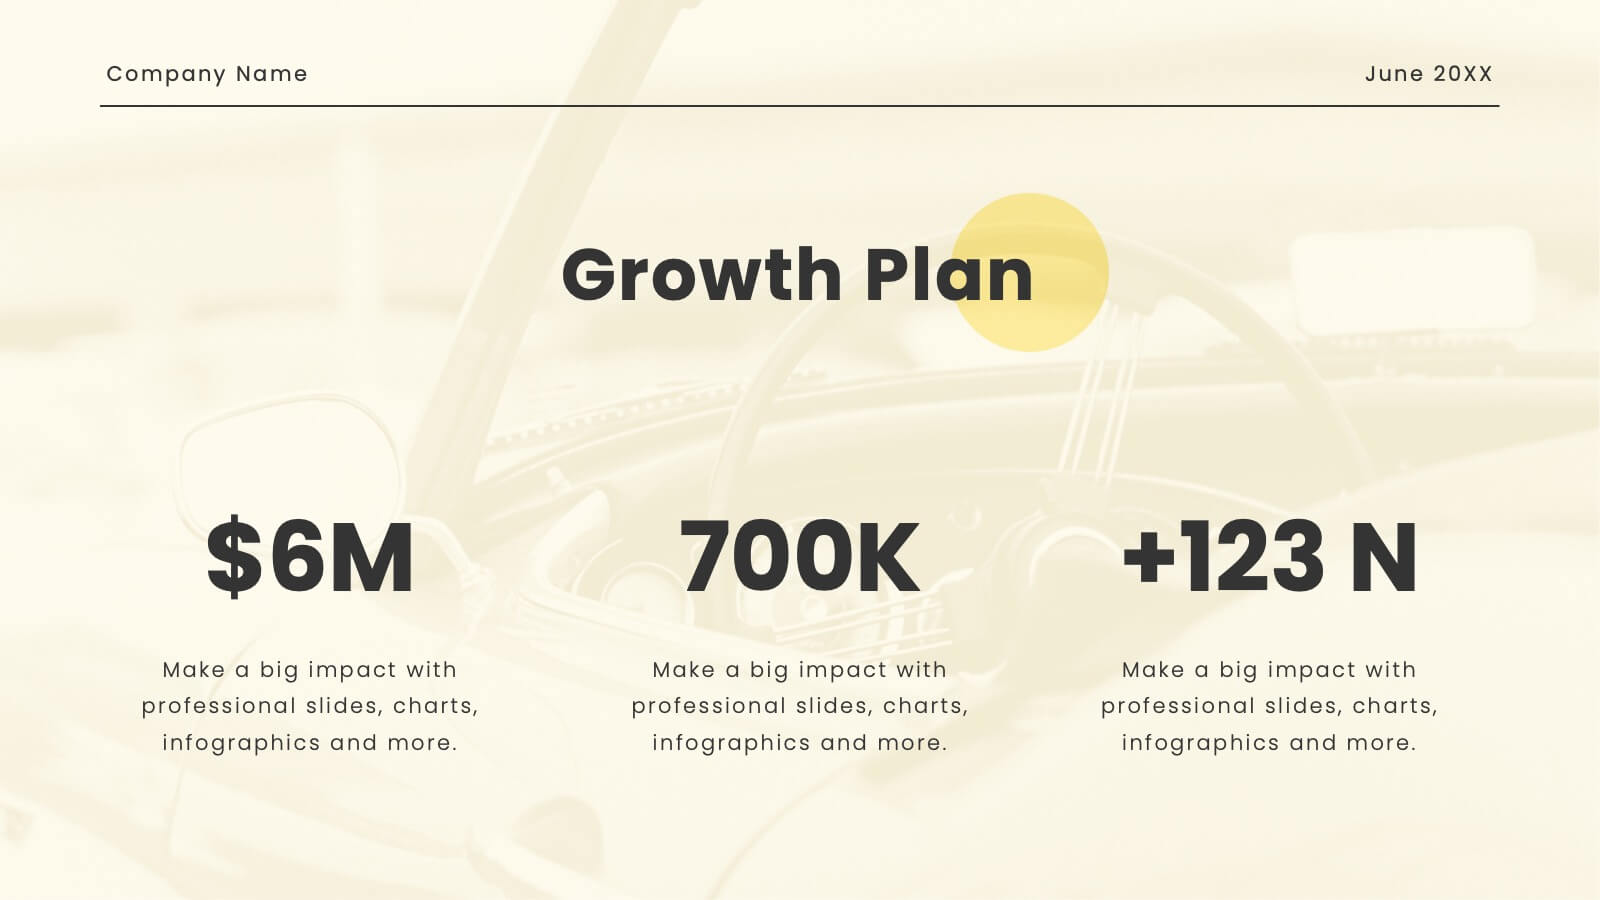
Oasis Startup Business Plan Presentation
Present your corporate business plan with confidence! This template includes sections for company overview, mission, vision, services, target market, and more. Showcase your market strategy, sales channels, growth plan, and financial overview. Perfect for conveying a professional and comprehensive business plan. Compatible with PowerPoint, Keynote, and Google Slides. Impress your audience today!


7 diapositivas
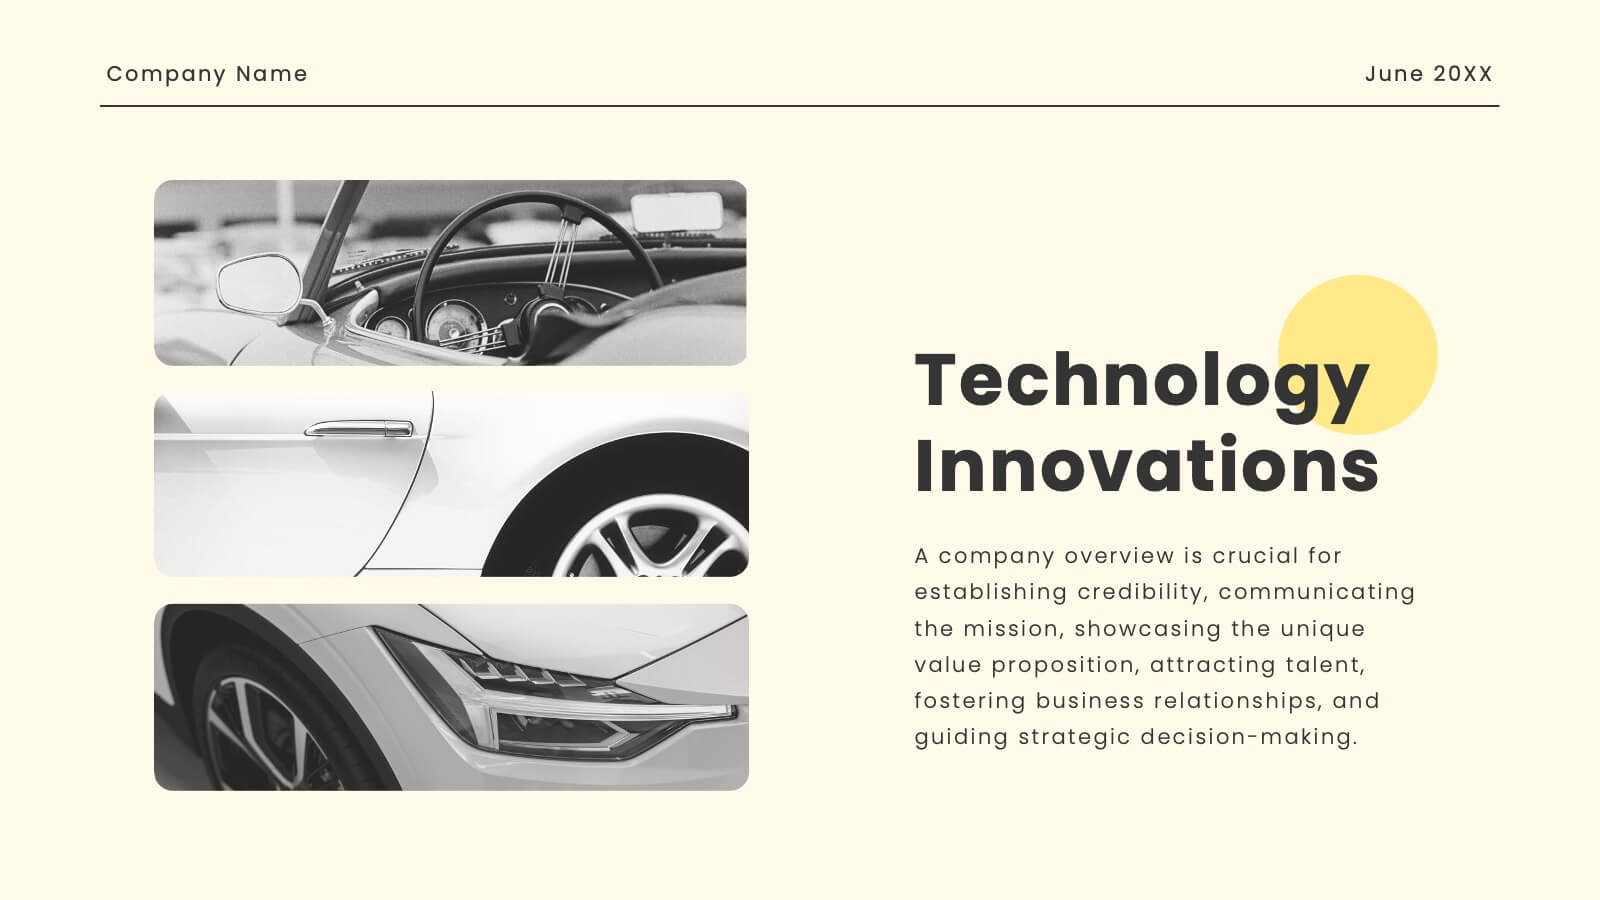
Innovation Technology Infographics
Innovation technology refers to the application of technology or the use of innovative approaches to create new products, services, processes, or business models. This infographic template is designed to showcase the cutting-edge technologies shaping our future. Let the vibrant visuals and insightful content guide you through the exciting realm of innovation and technology. Compatible with Powerpoint, Keynote, and Google Slides. Fully customizable, explore this infographic and step into the future. The visuals are designed to ignite your imagination and enlighten your audience about the limitless potential of innovation and technology.


6 diapositivas
Wellness Program and Health Strategy Presentation
Bring your strategy to life with this clean and creative visual! This presentation template uses a six-part flower design to help you showcase your wellness goals, health strategies, or program pillars with clarity and balance. It’s fully editable and works perfectly in PowerPoint, Keynote, and Google Slides for flexible customization.


10 diapositivas
Concept Mapping with Bubble Map
Break down complex ideas into visual clusters with this hexagon-style concept mapping template. Designed to organize information into thematic groups, it's ideal for brainstorming, mind mapping, or presenting strategies and workflows. Each section uses color-coded bubble maps for easy navigation. Fully editable in PowerPoint, Keynote, and Google Slides.


6 diapositivas
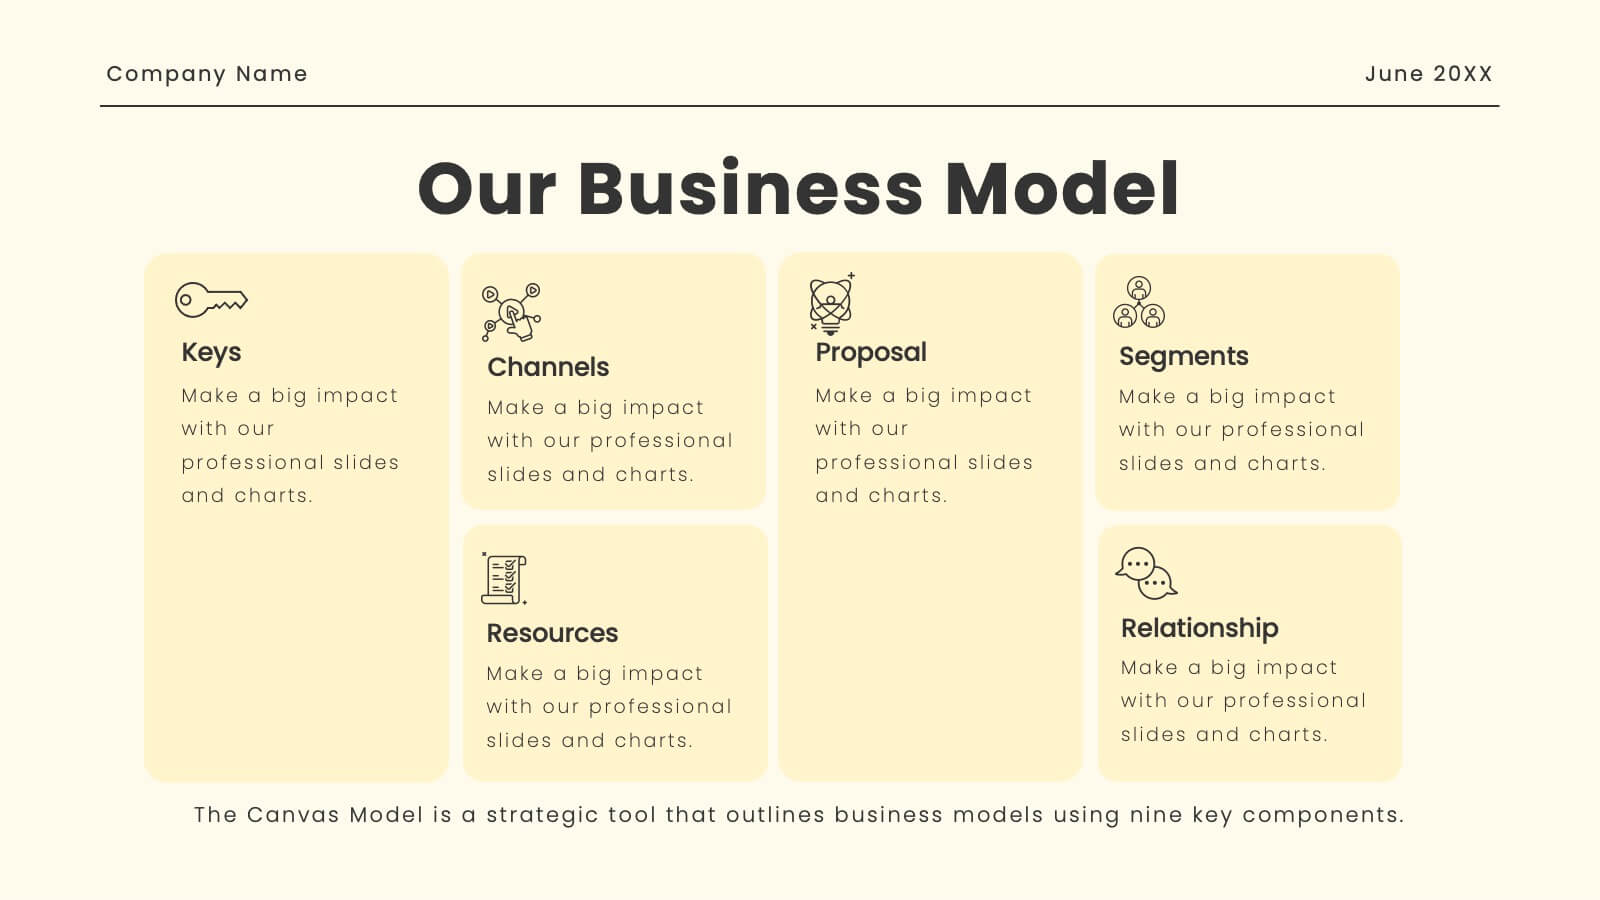
6-Stage Business Cycle Presentation
The "6-Stage Business Cycle Presentation" template expertly outlines the progression of business processes through a visually appealing circular diagram, perfect for detailed strategic presentations. This template features six interconnected stages, each distinguished by unique colors and intuitive icons, simplifying complex business concepts into digestible segments. Central placeholders allow for concise titles and brief descriptions, enhancing clarity and comprehension. Ideal for business analysts, strategists, and educators, this tool facilitates the effective communication of developmental cycles, operational processes, and strategic evaluations. Use this template in board meetings, workshops, or educational sessions to convey the cyclical nature of business tasks and strategies efficiently.