


Características


¿Tienes alguna pregunta?
Recomendar


4 diapositivas
Career Onboarding 30 60 90 Day Presentation
Start strong with a clean, uplifting layout that makes each milestone in the onboarding journey feel clear, motivating, and easy to follow. This presentation helps you outline expectations, track early progress, and communicate development goals with confidence and clarity. Fully editable and compatible with PowerPoint, Keynote, and Google Slides.


6 diapositivas
Professional Title Infographic
This collection of professional presentation templates is meticulously designed to meet a variety of business needs, blending visual appeal with practical functionality. The templates are versatile, allowing professionals to effectively communicate complex data, strategic insights, and operational updates. One template is perfect for detailed data visualization, helping to highlight trends and insights that are crucial for data-driven decision-making. Another template focuses on team introductions, ideal for building a connection between your team and the audience, whether in stakeholder meetings or internal briefings. For marketing strategies, there's a template designed to outline customer demographics and behaviors, which is essential for tailoring marketing campaigns and product development. The collection also includes templates for financial reporting and pricing strategies, ensuring that financial data is communicated clearly and efficiently. Additionally, a strategic analysis template aids in outlining key business strengths, weaknesses, opportunities, and threats, supporting strategic planning and risk management. Overall, these templates are a valuable tool for any professional looking to present information clearly and compellingly in various business contexts.


7 diapositivas
Financial Health and Budget Planning Presentation
Present your budgeting journey with clarity using the Financial Health and Budget Planning Presentation. This slide features a horizontal flow diagram with six editable steps—perfect for outlining savings strategies, expense tracking, or financial goals. Each icon-based block helps highlight key actions. Fully customizable in PowerPoint, Canva, and Google Slides.


7 diapositivas
Framework Infographics Presentation Template
A framework infographic is a visual representation of a structured approach or system for addressing a problem, organizing information, or making decisions. Our framework infographic is designed to help you understand complex concepts and to provide a visual roadmap that can be easily followed. This template makes an impact with a professional design, customizable text and graphics, and compelling visual content. If you need to display and share information, charts, graphs or lists in a creative way this template will guide you through each step to create a professional looking infographic.


21 diapositivas
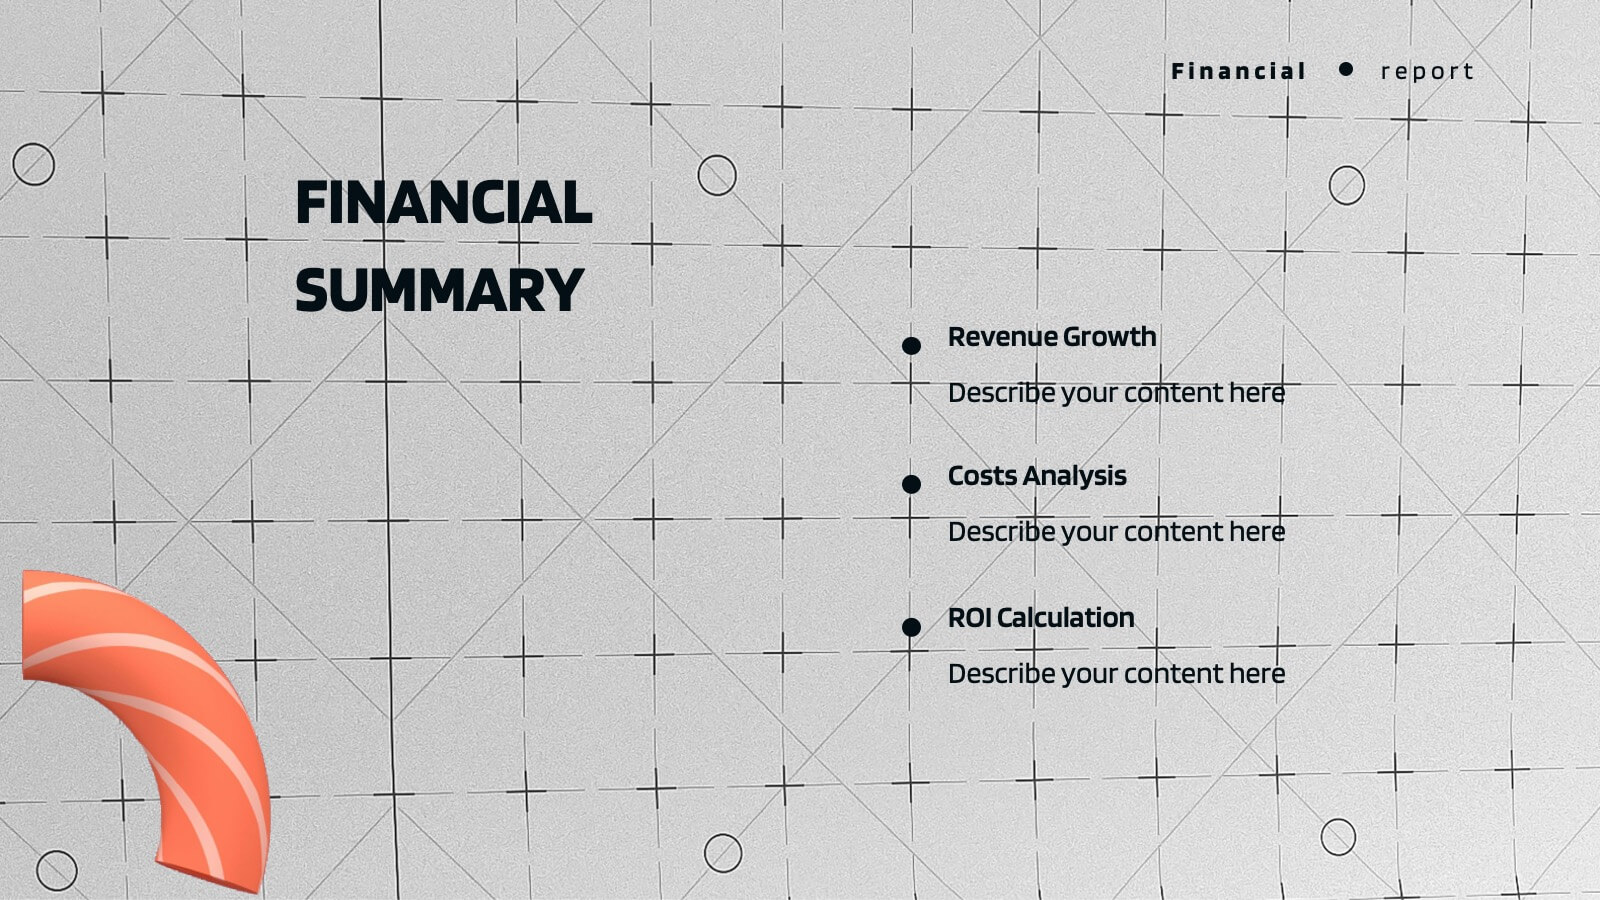
Synergywave Financial Report Presentation
Deliver your financial insights with clarity using this comprehensive report presentation! It covers key sections like performance metrics, sales updates, market trends, and strategic initiatives, ensuring all critical data is well-organized. Whether for stakeholders or internal reviews, this template ensures seamless communication. Fully compatible with PowerPoint, Keynote, and Google Slides.
8 diapositivas
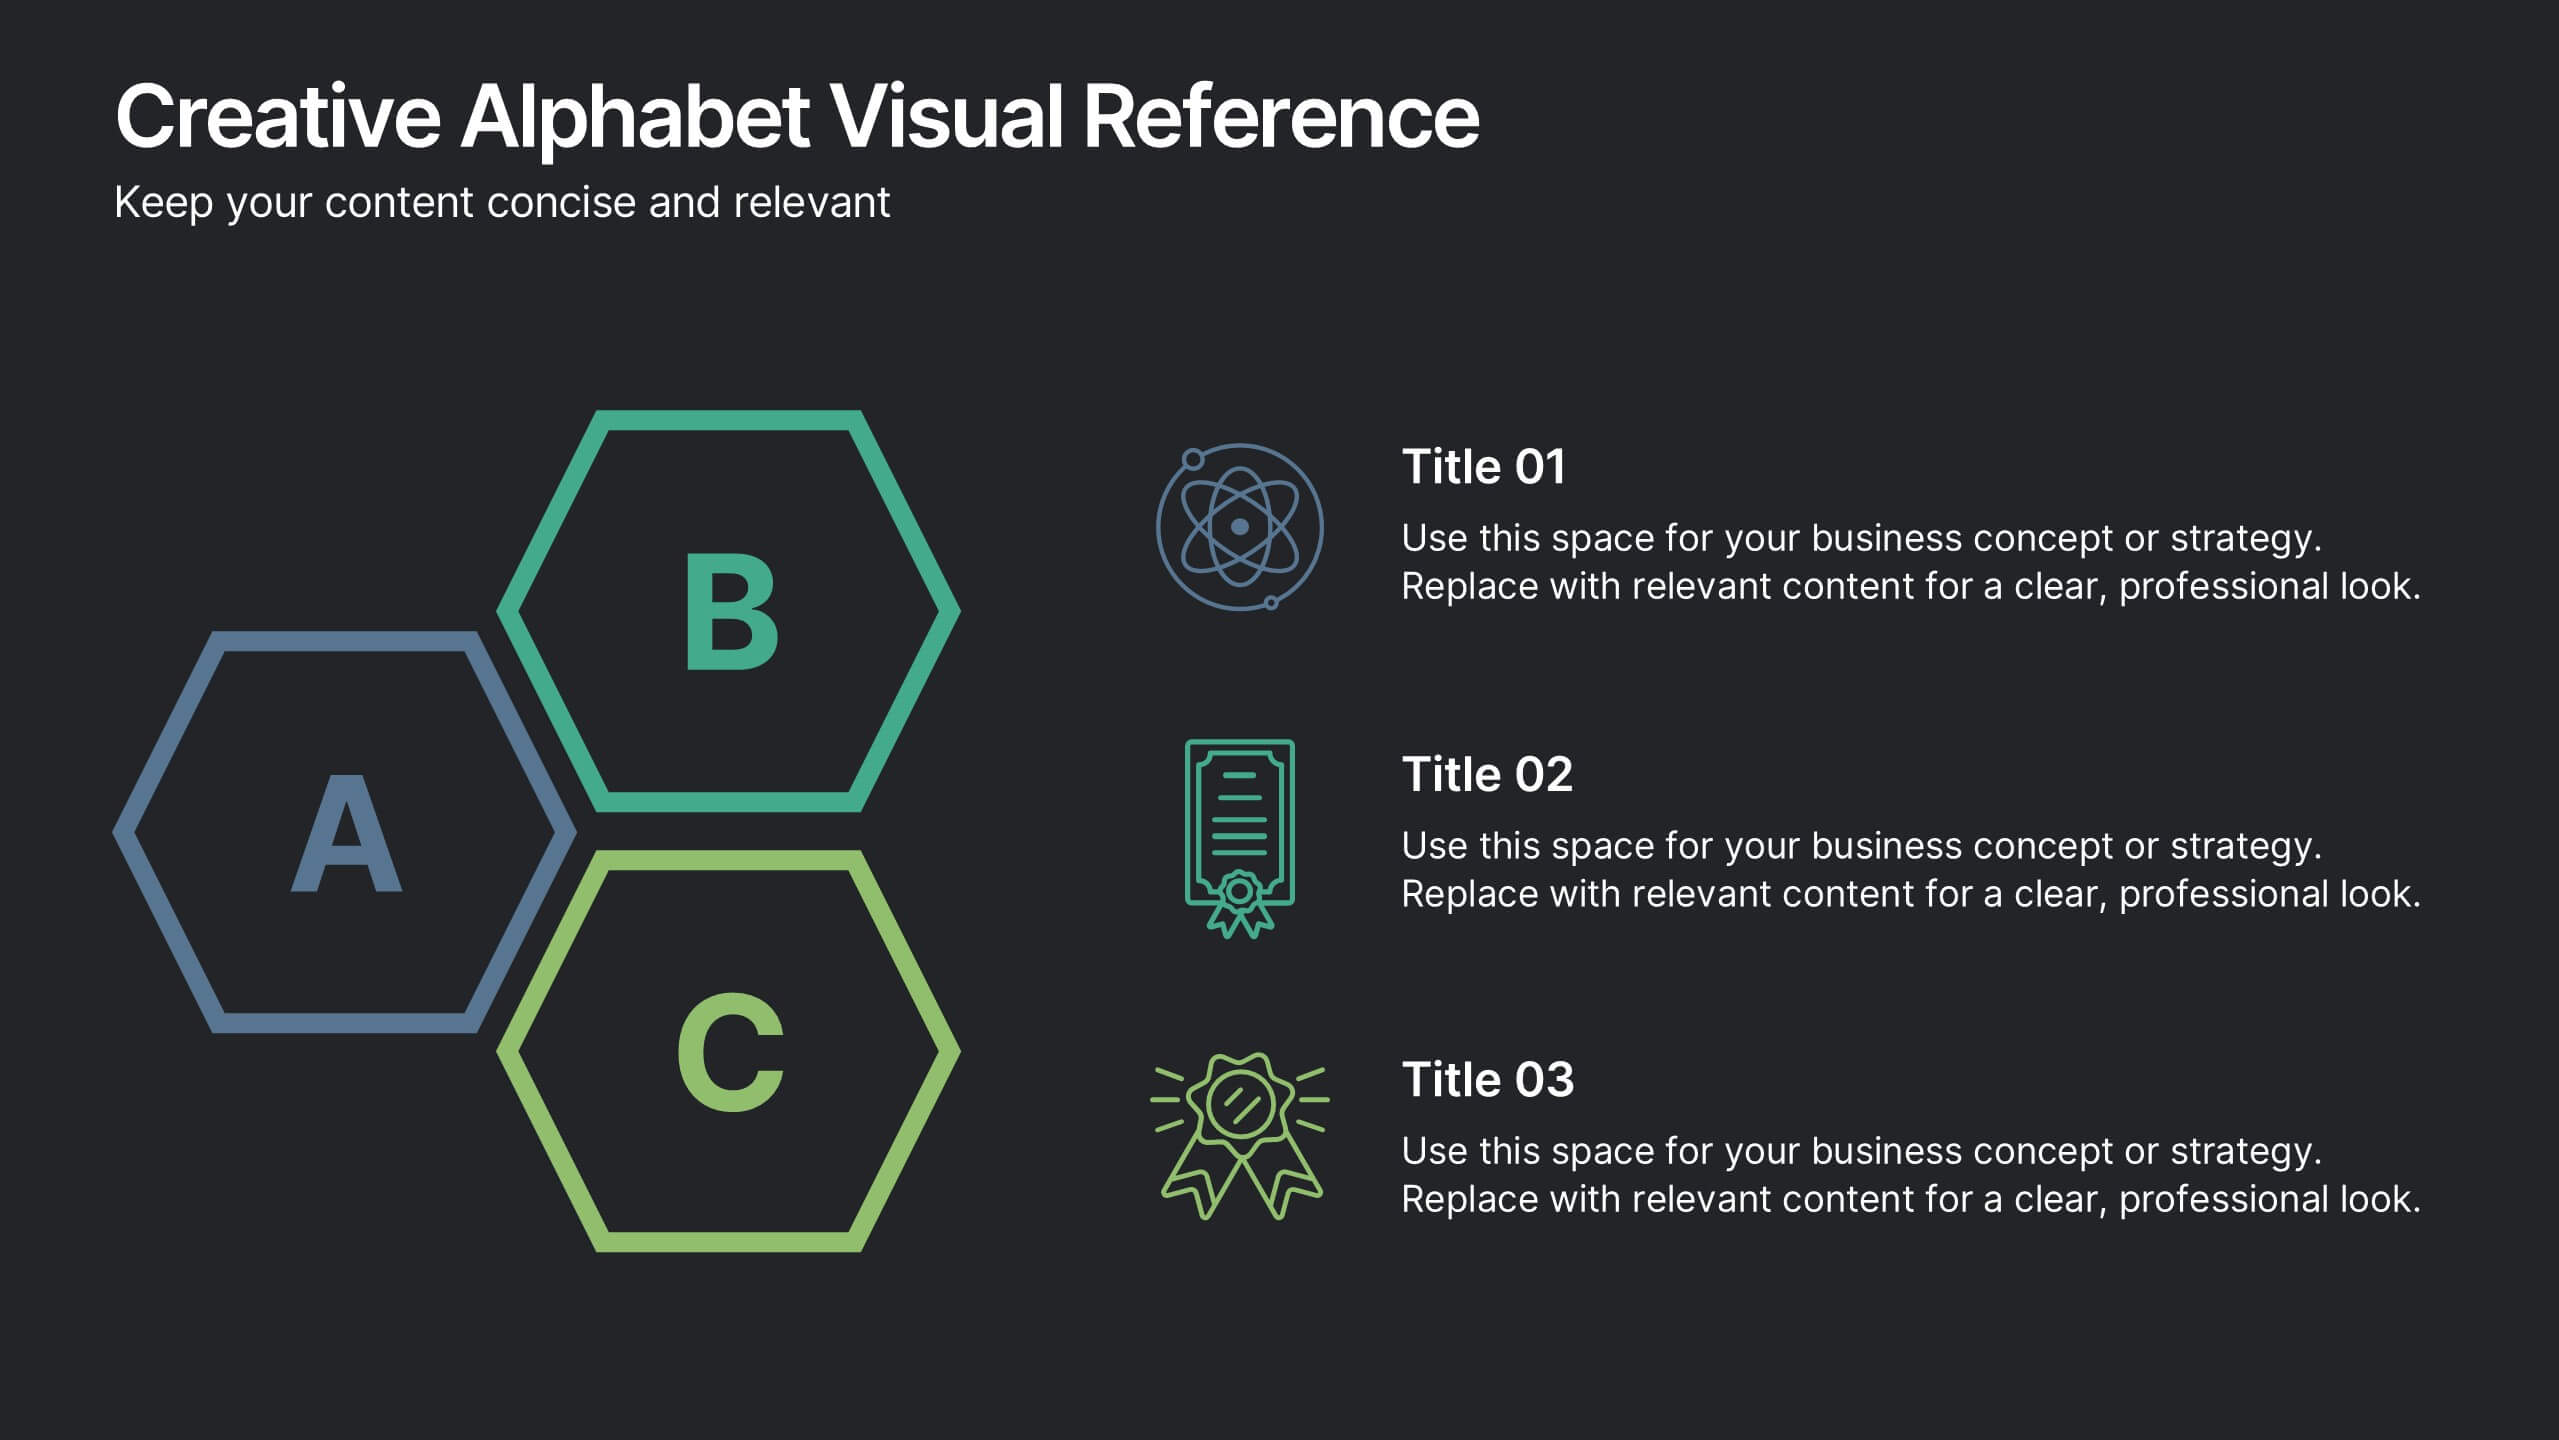
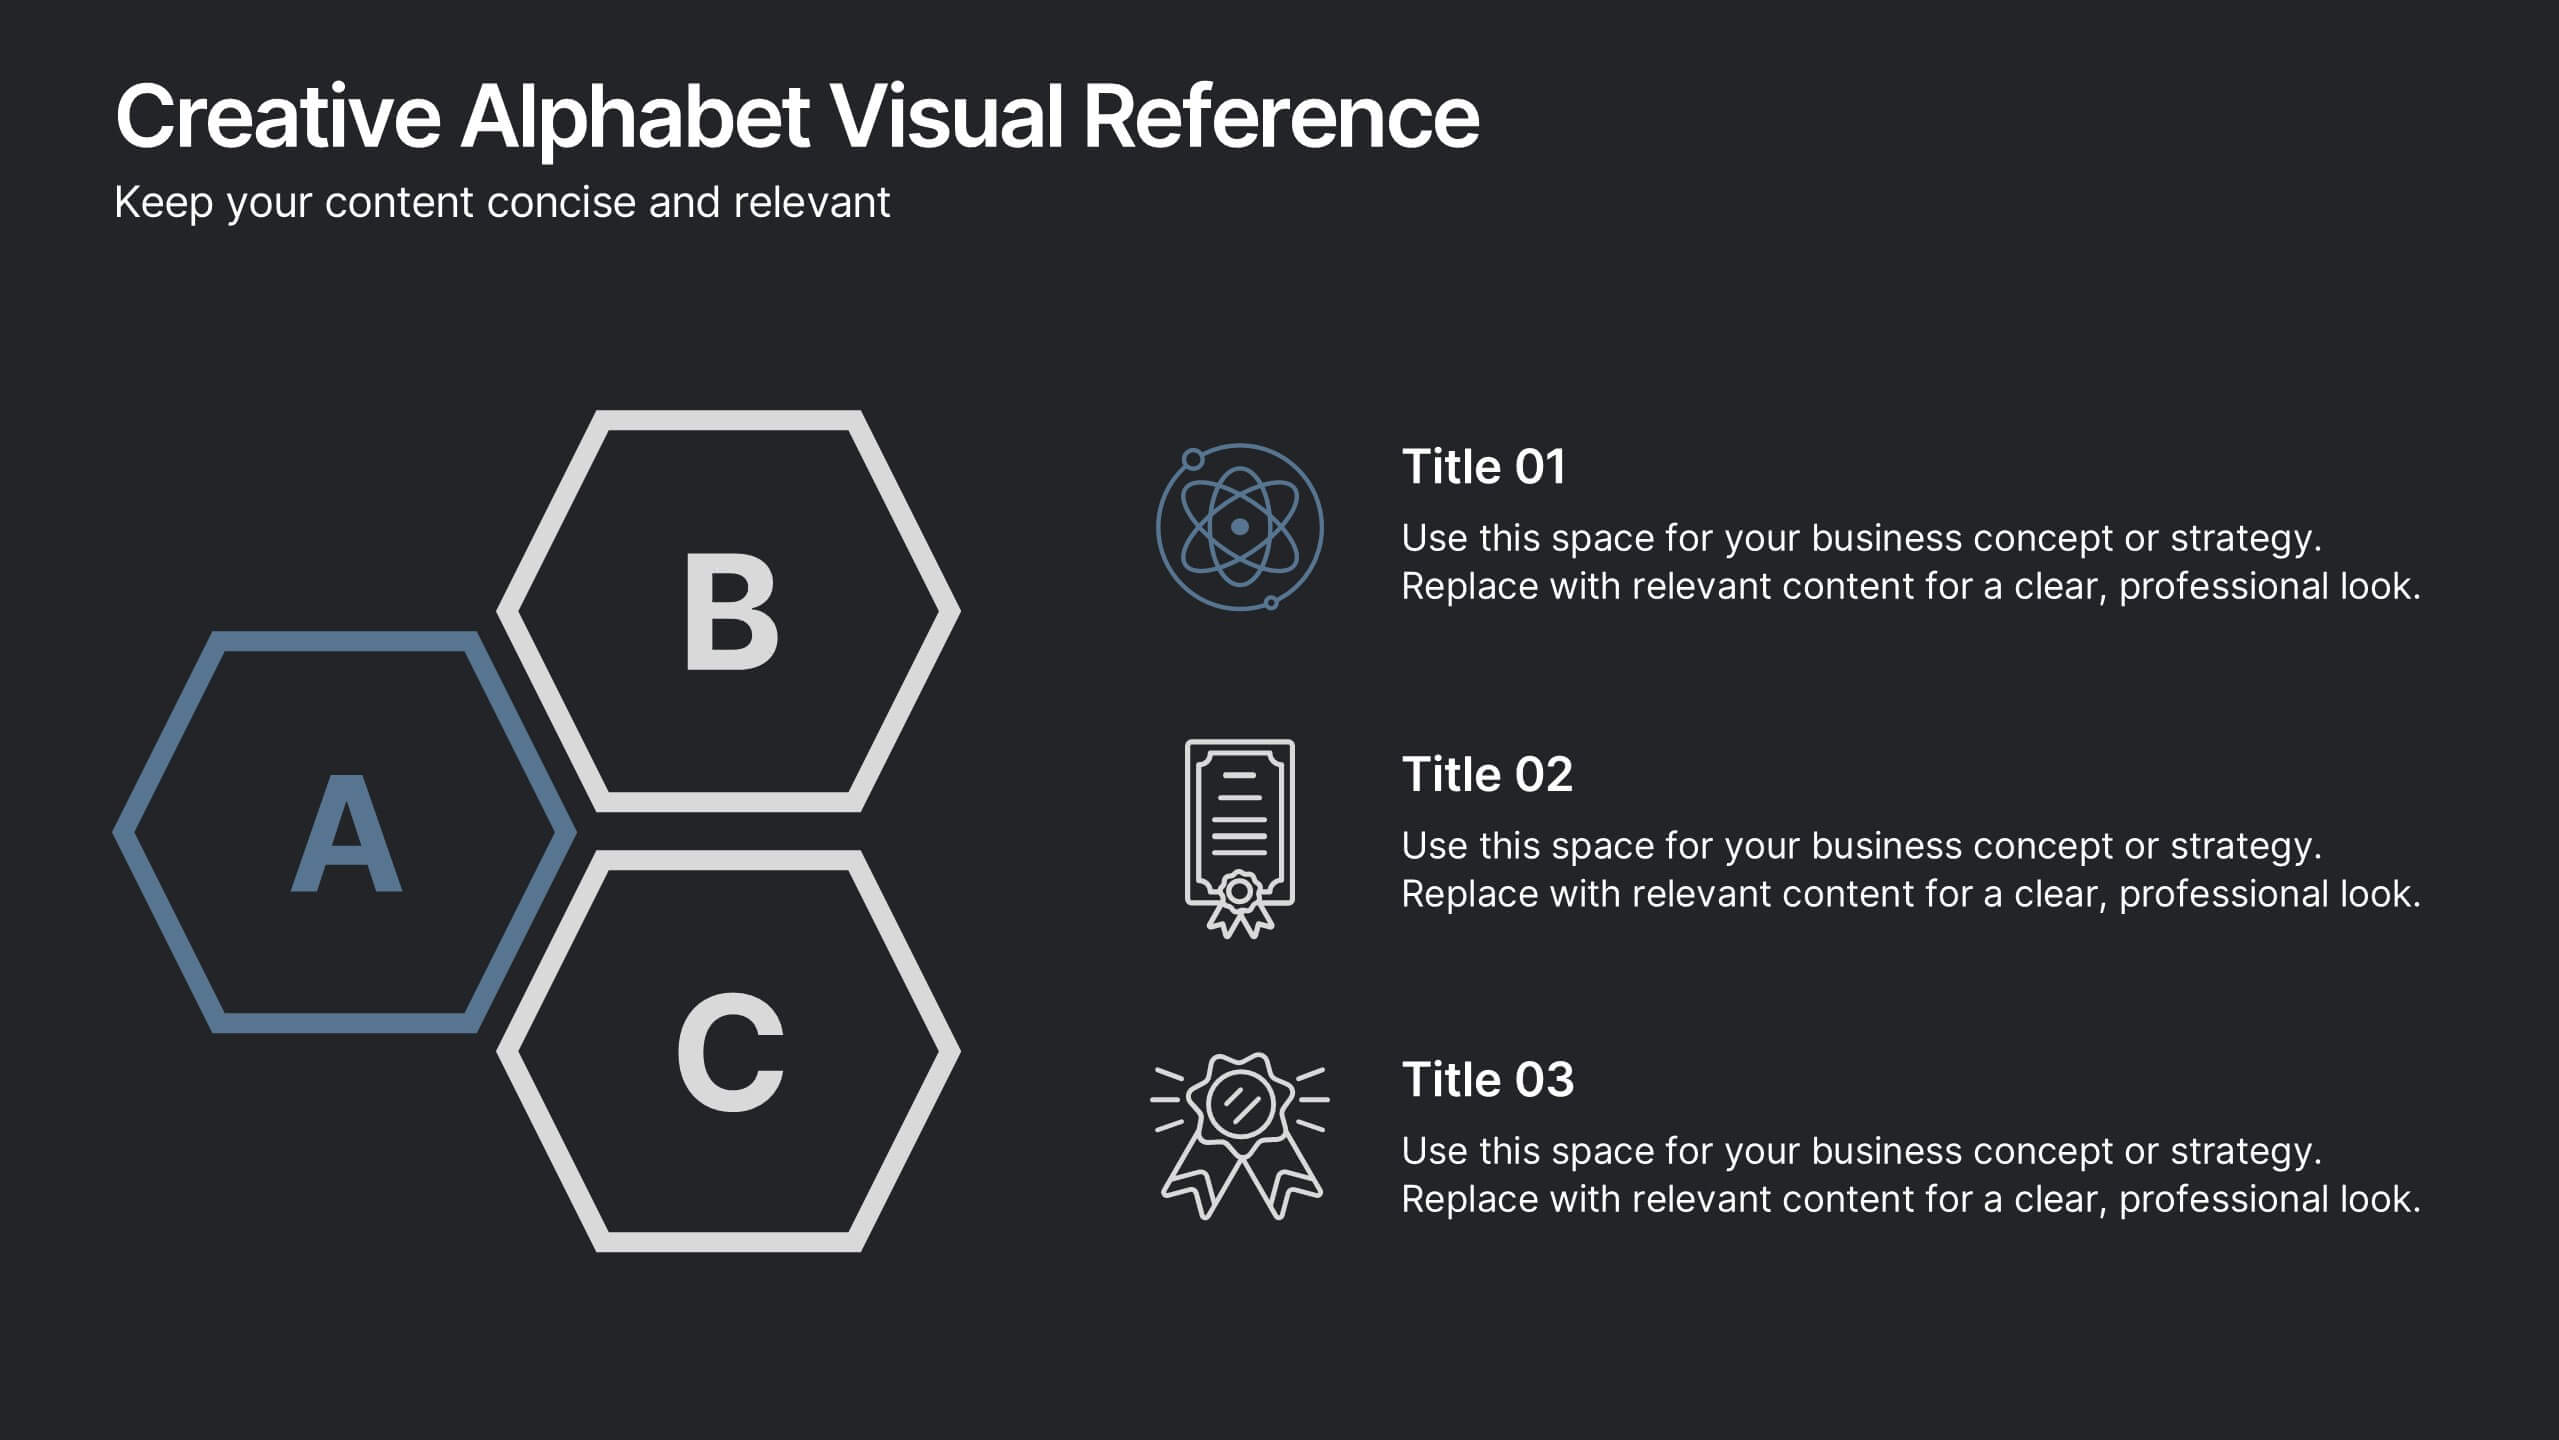
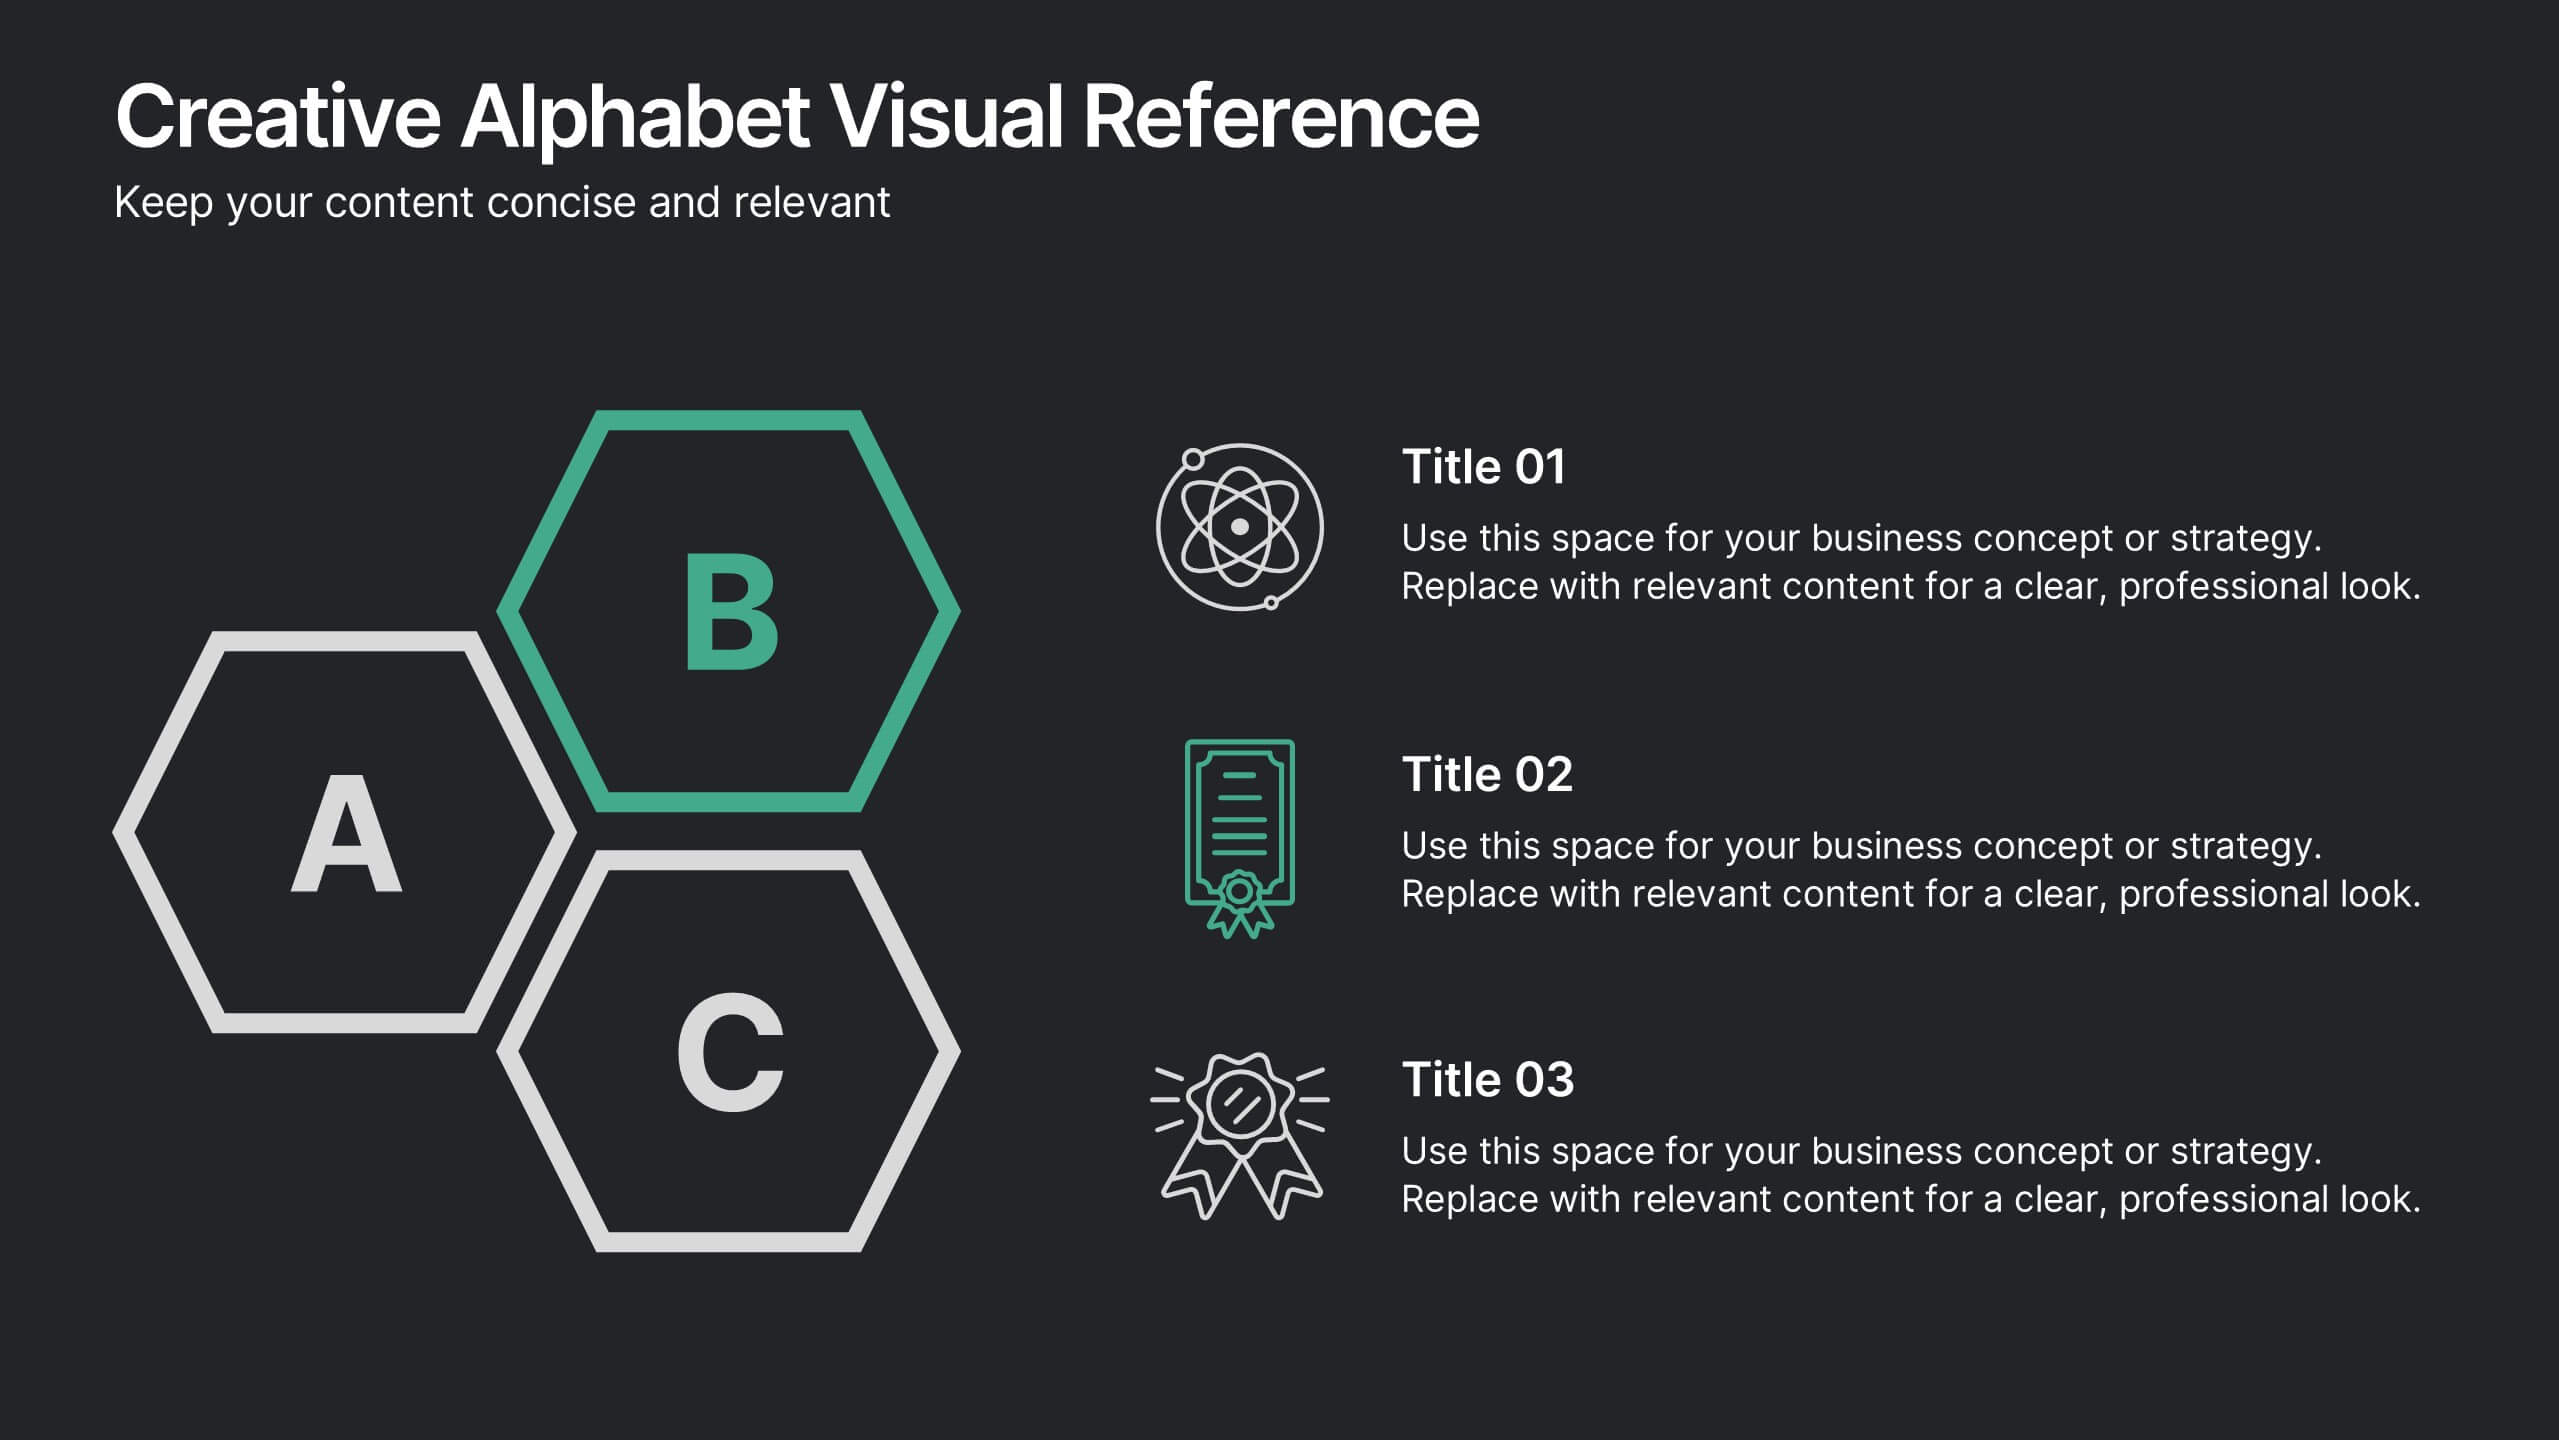
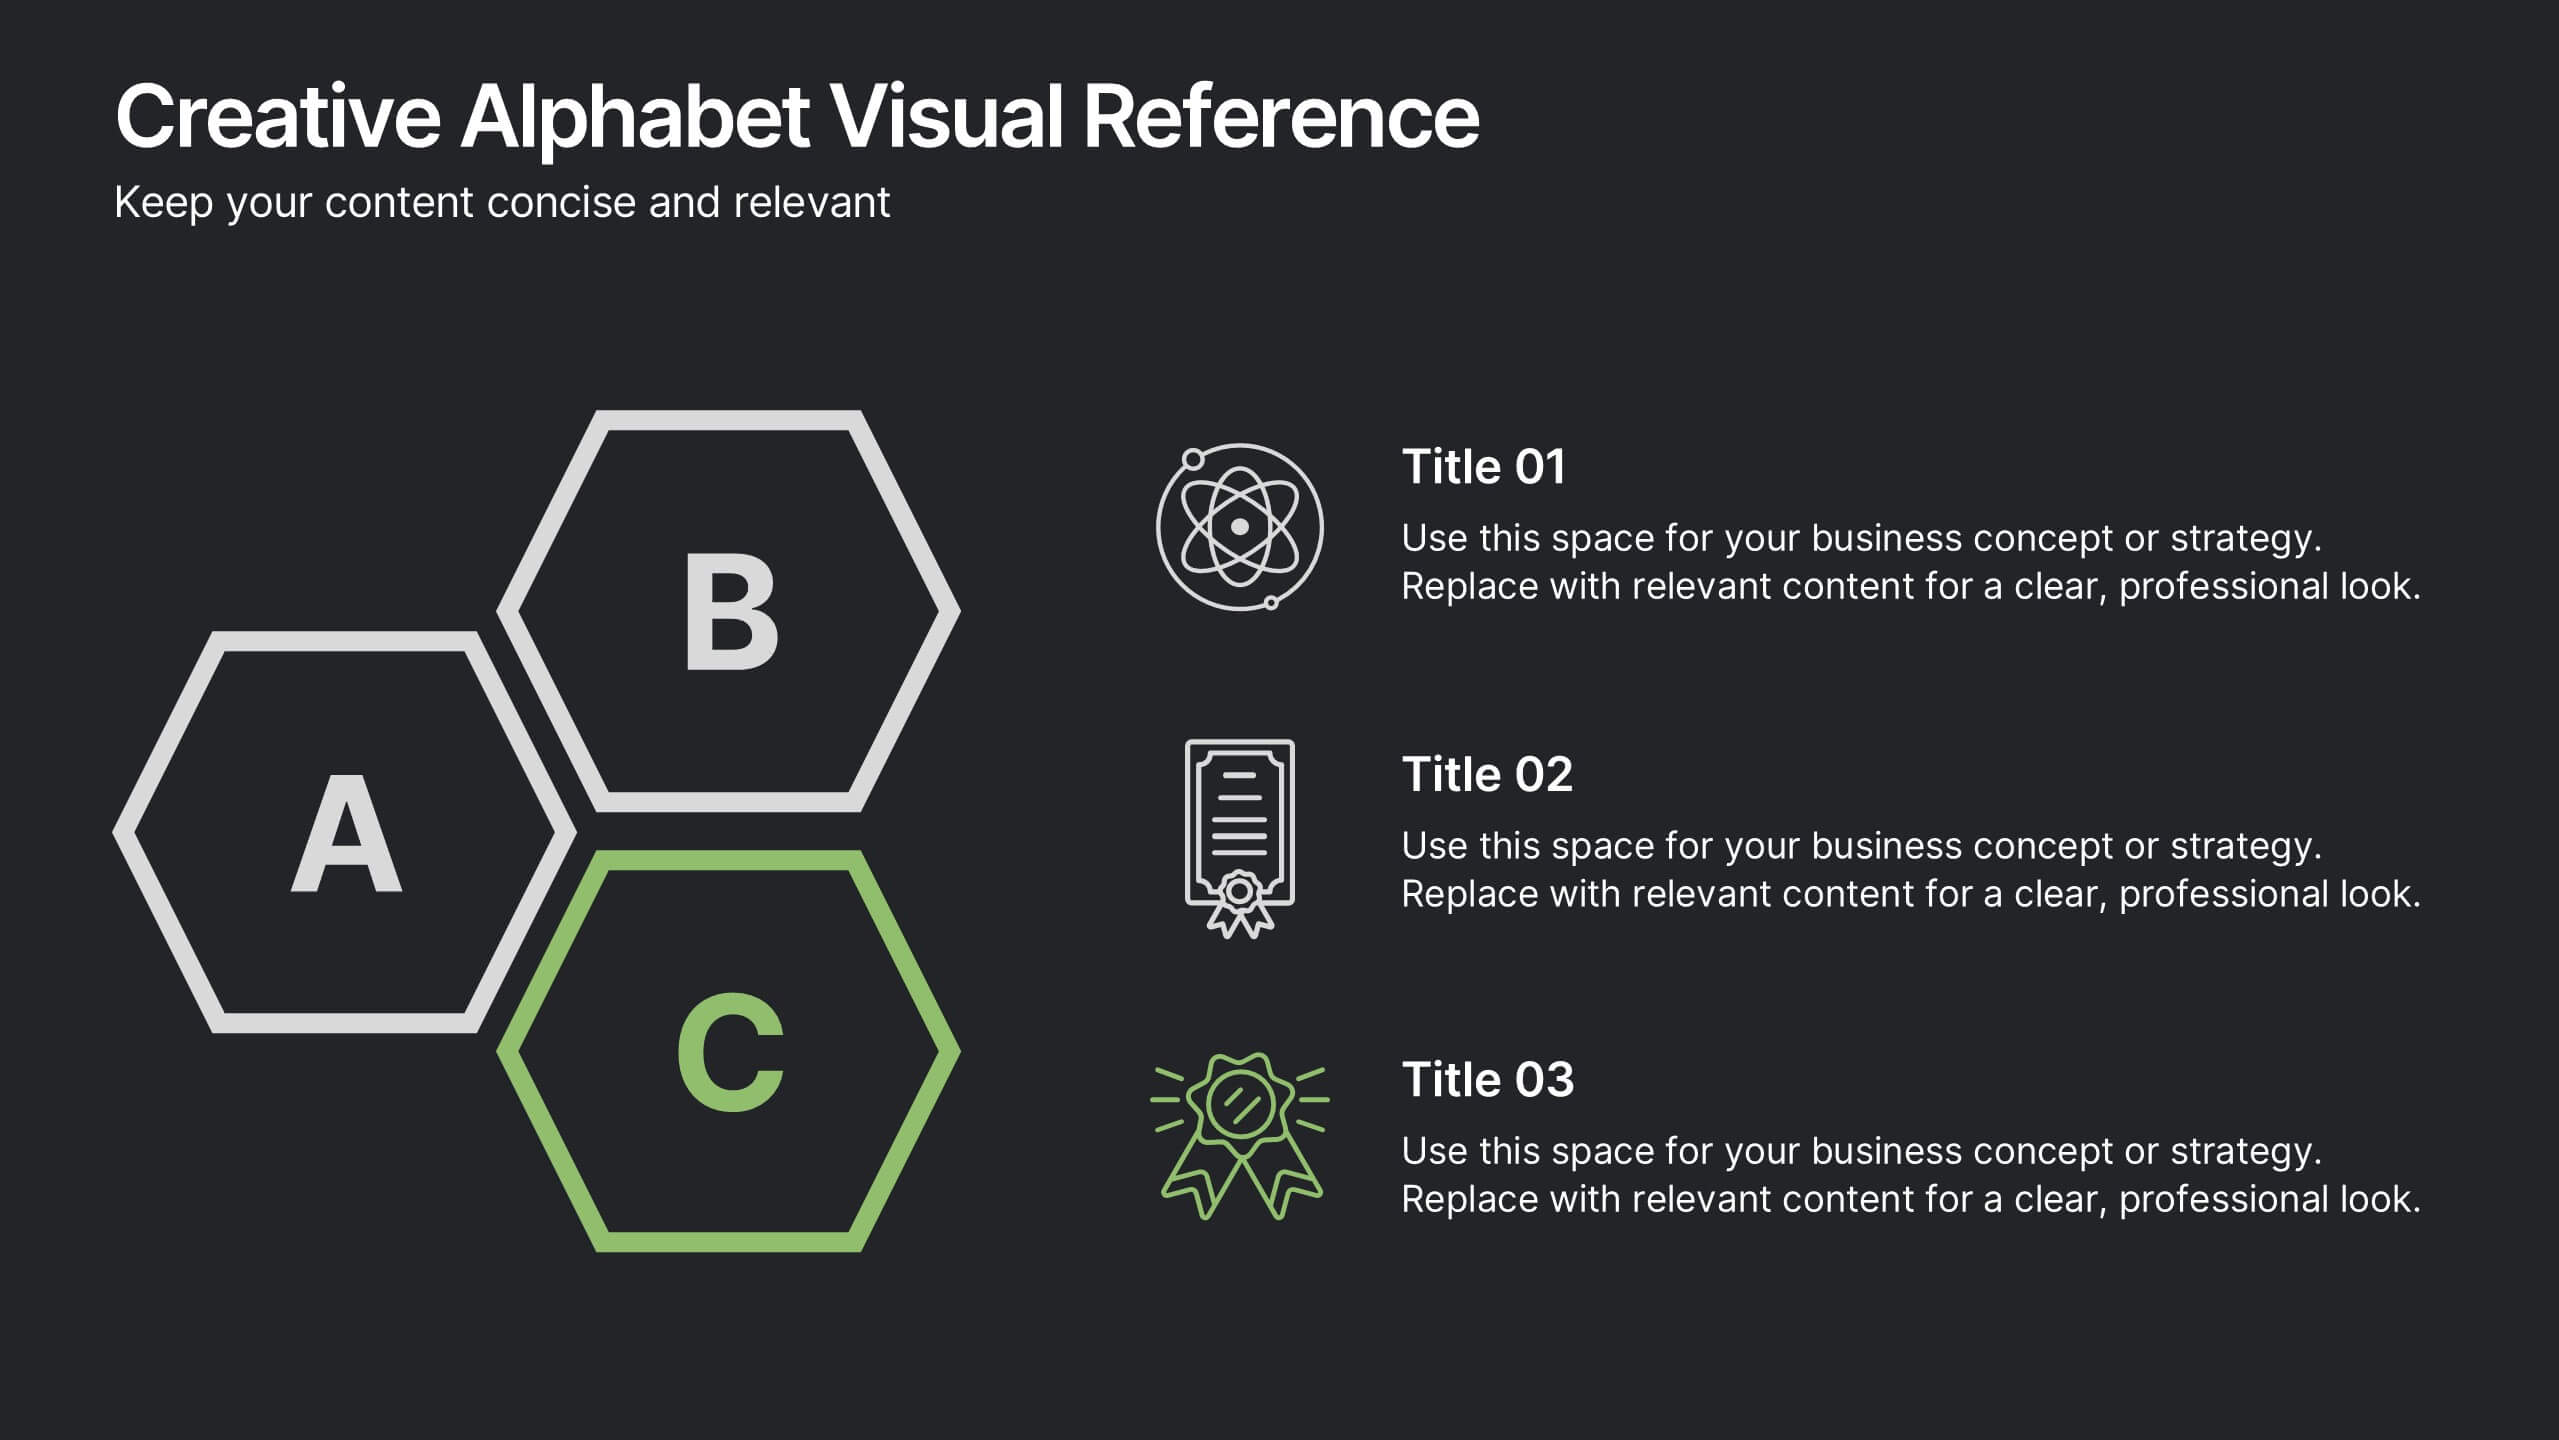
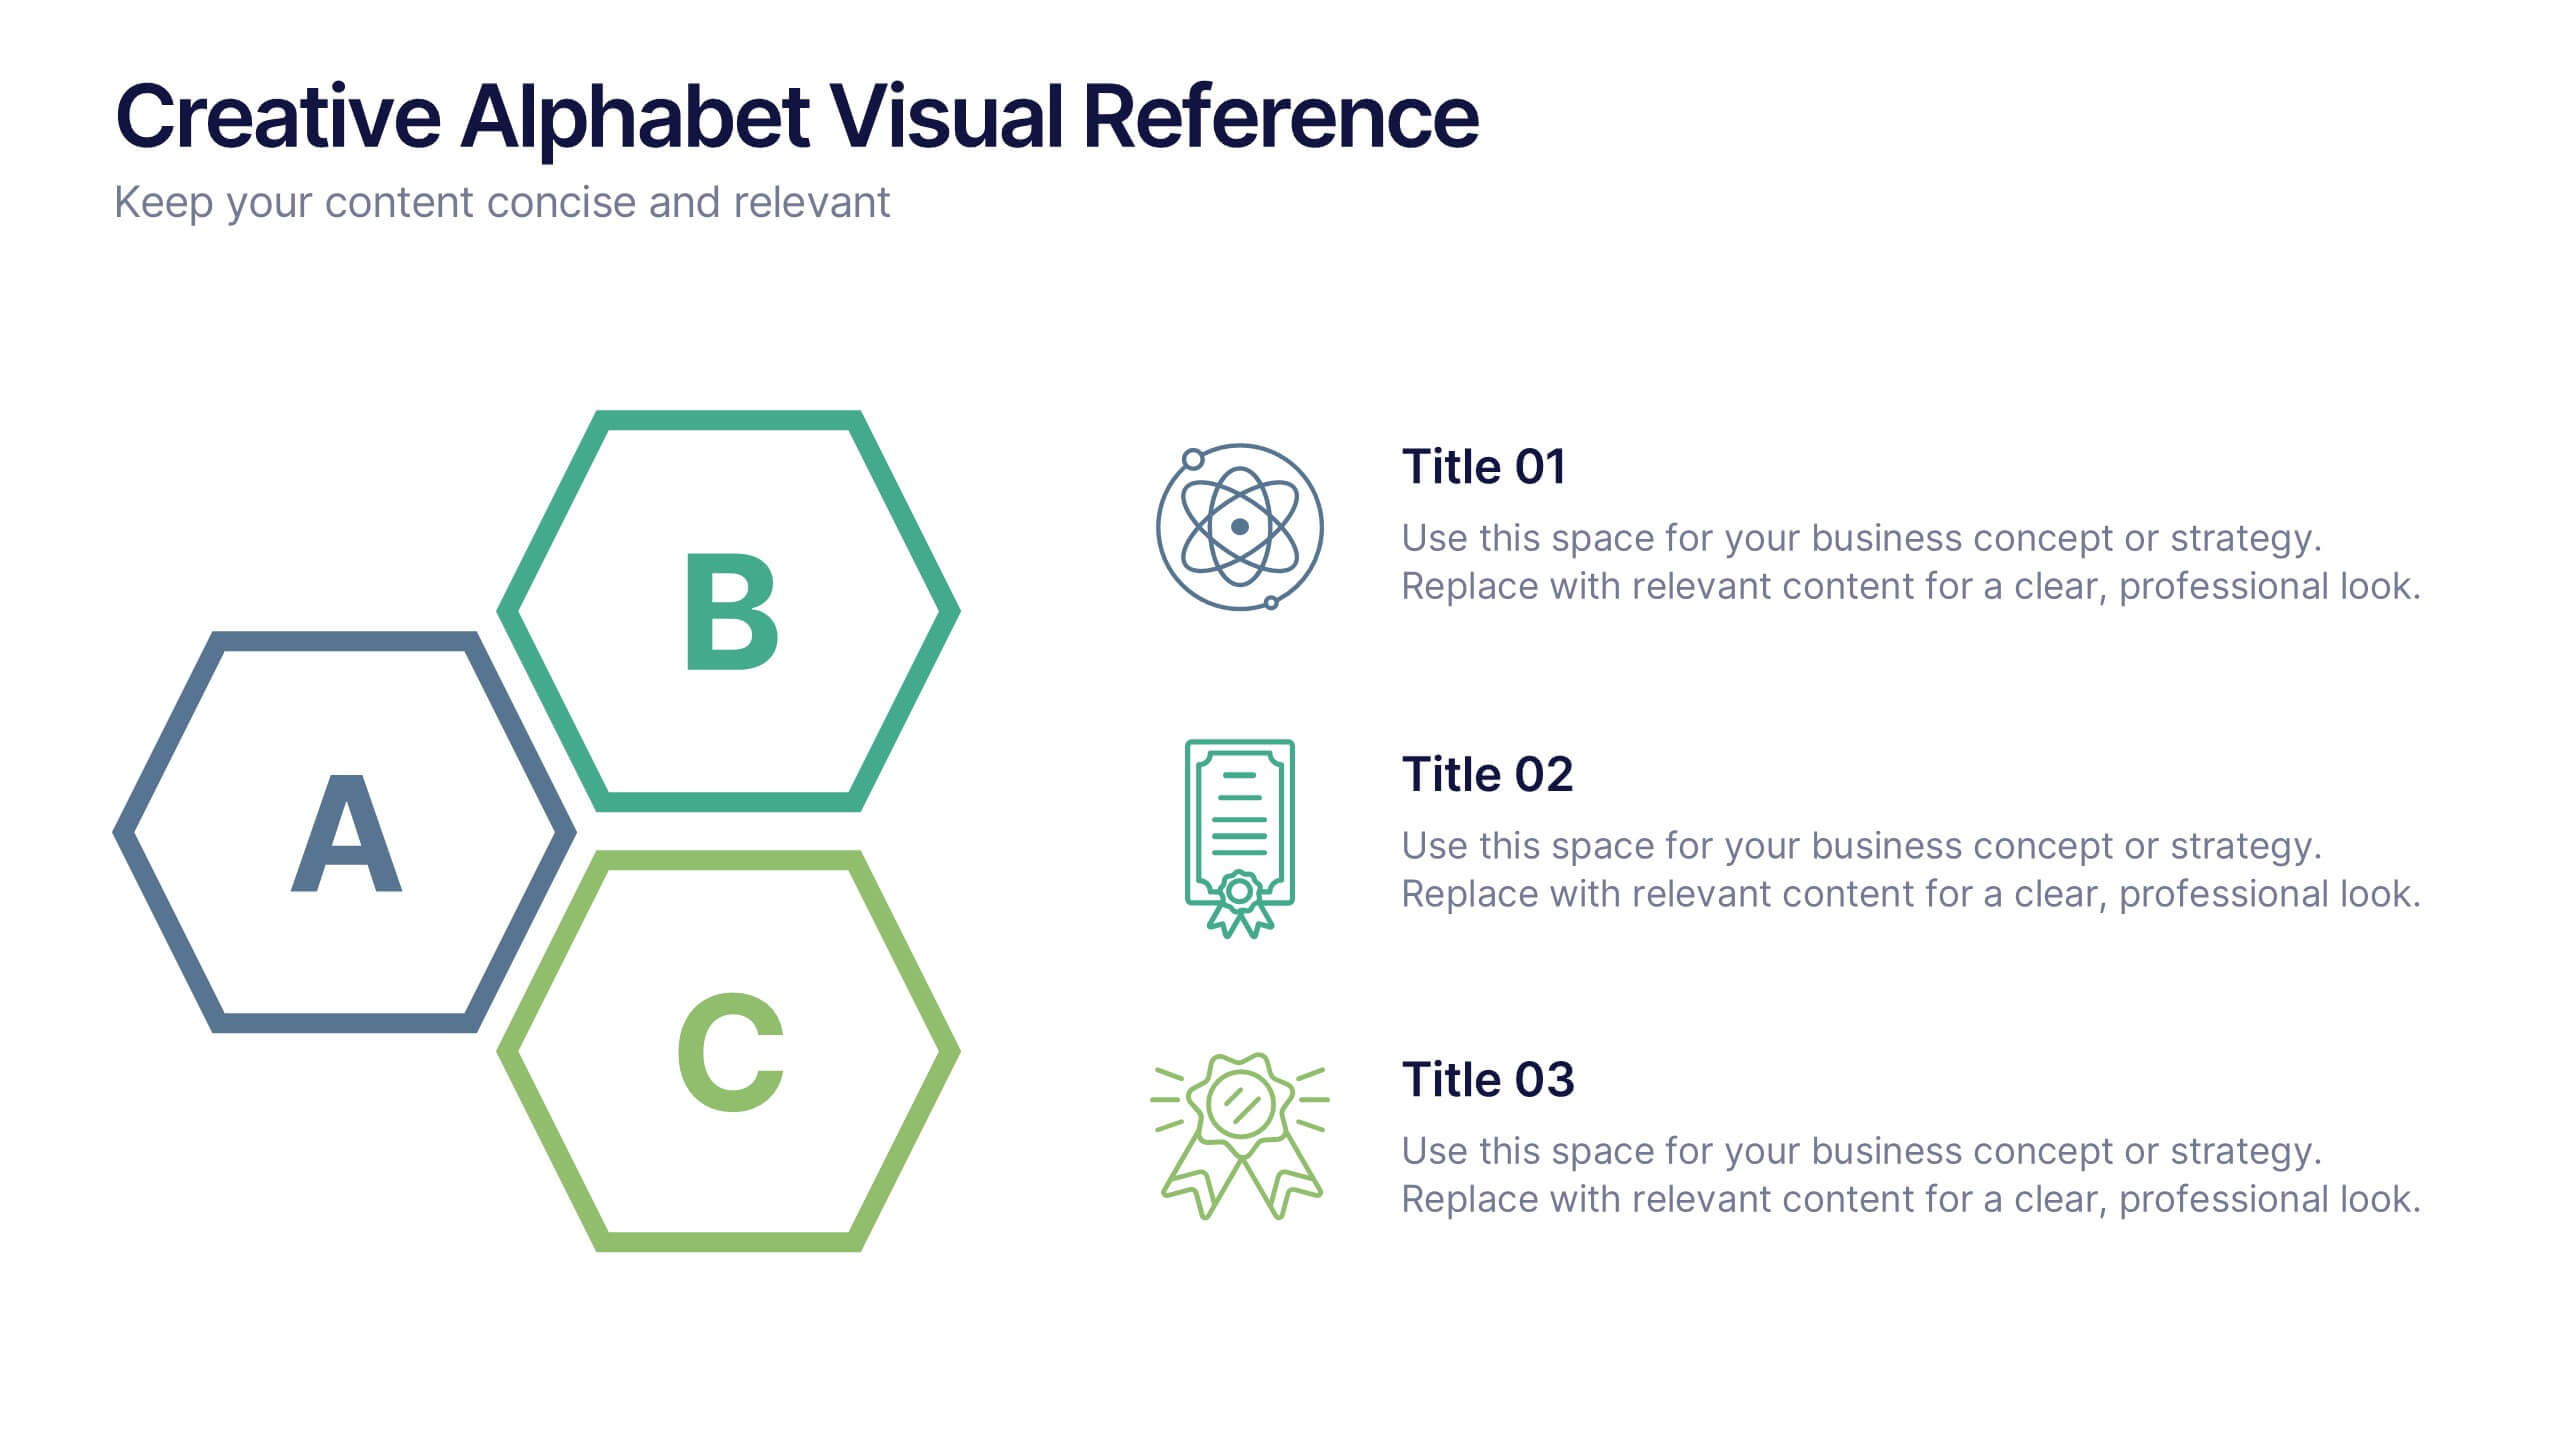
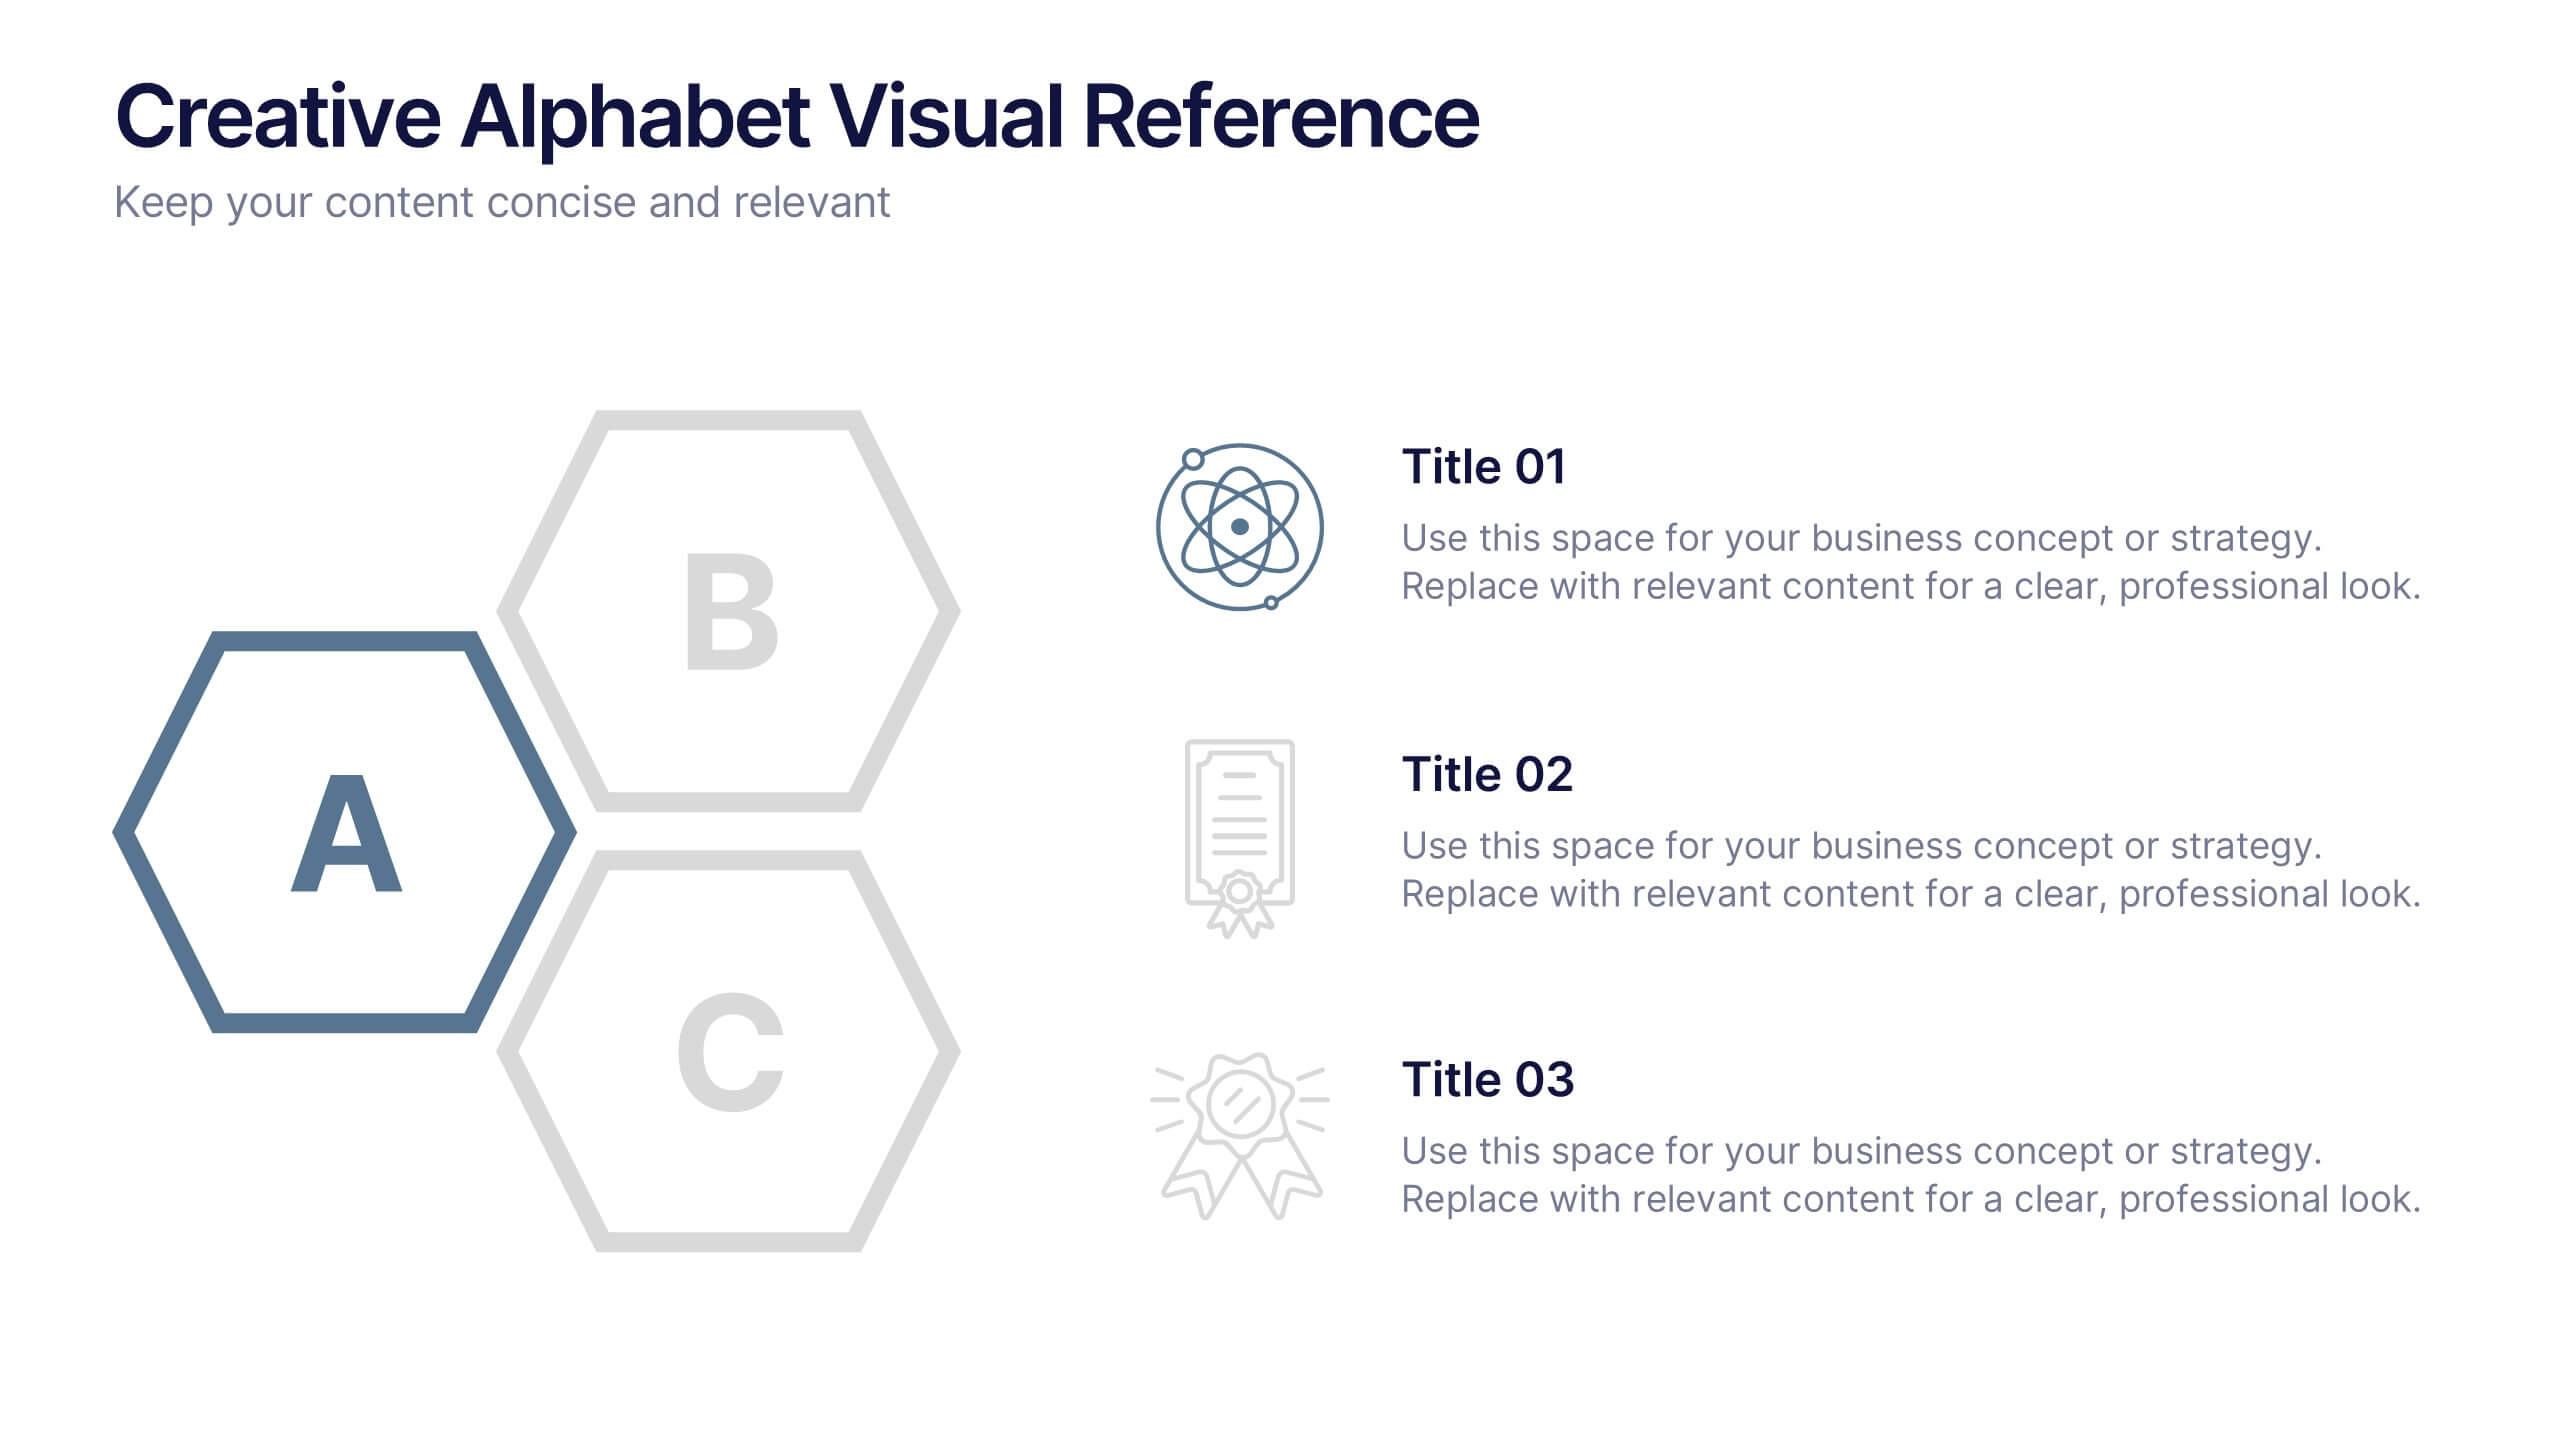
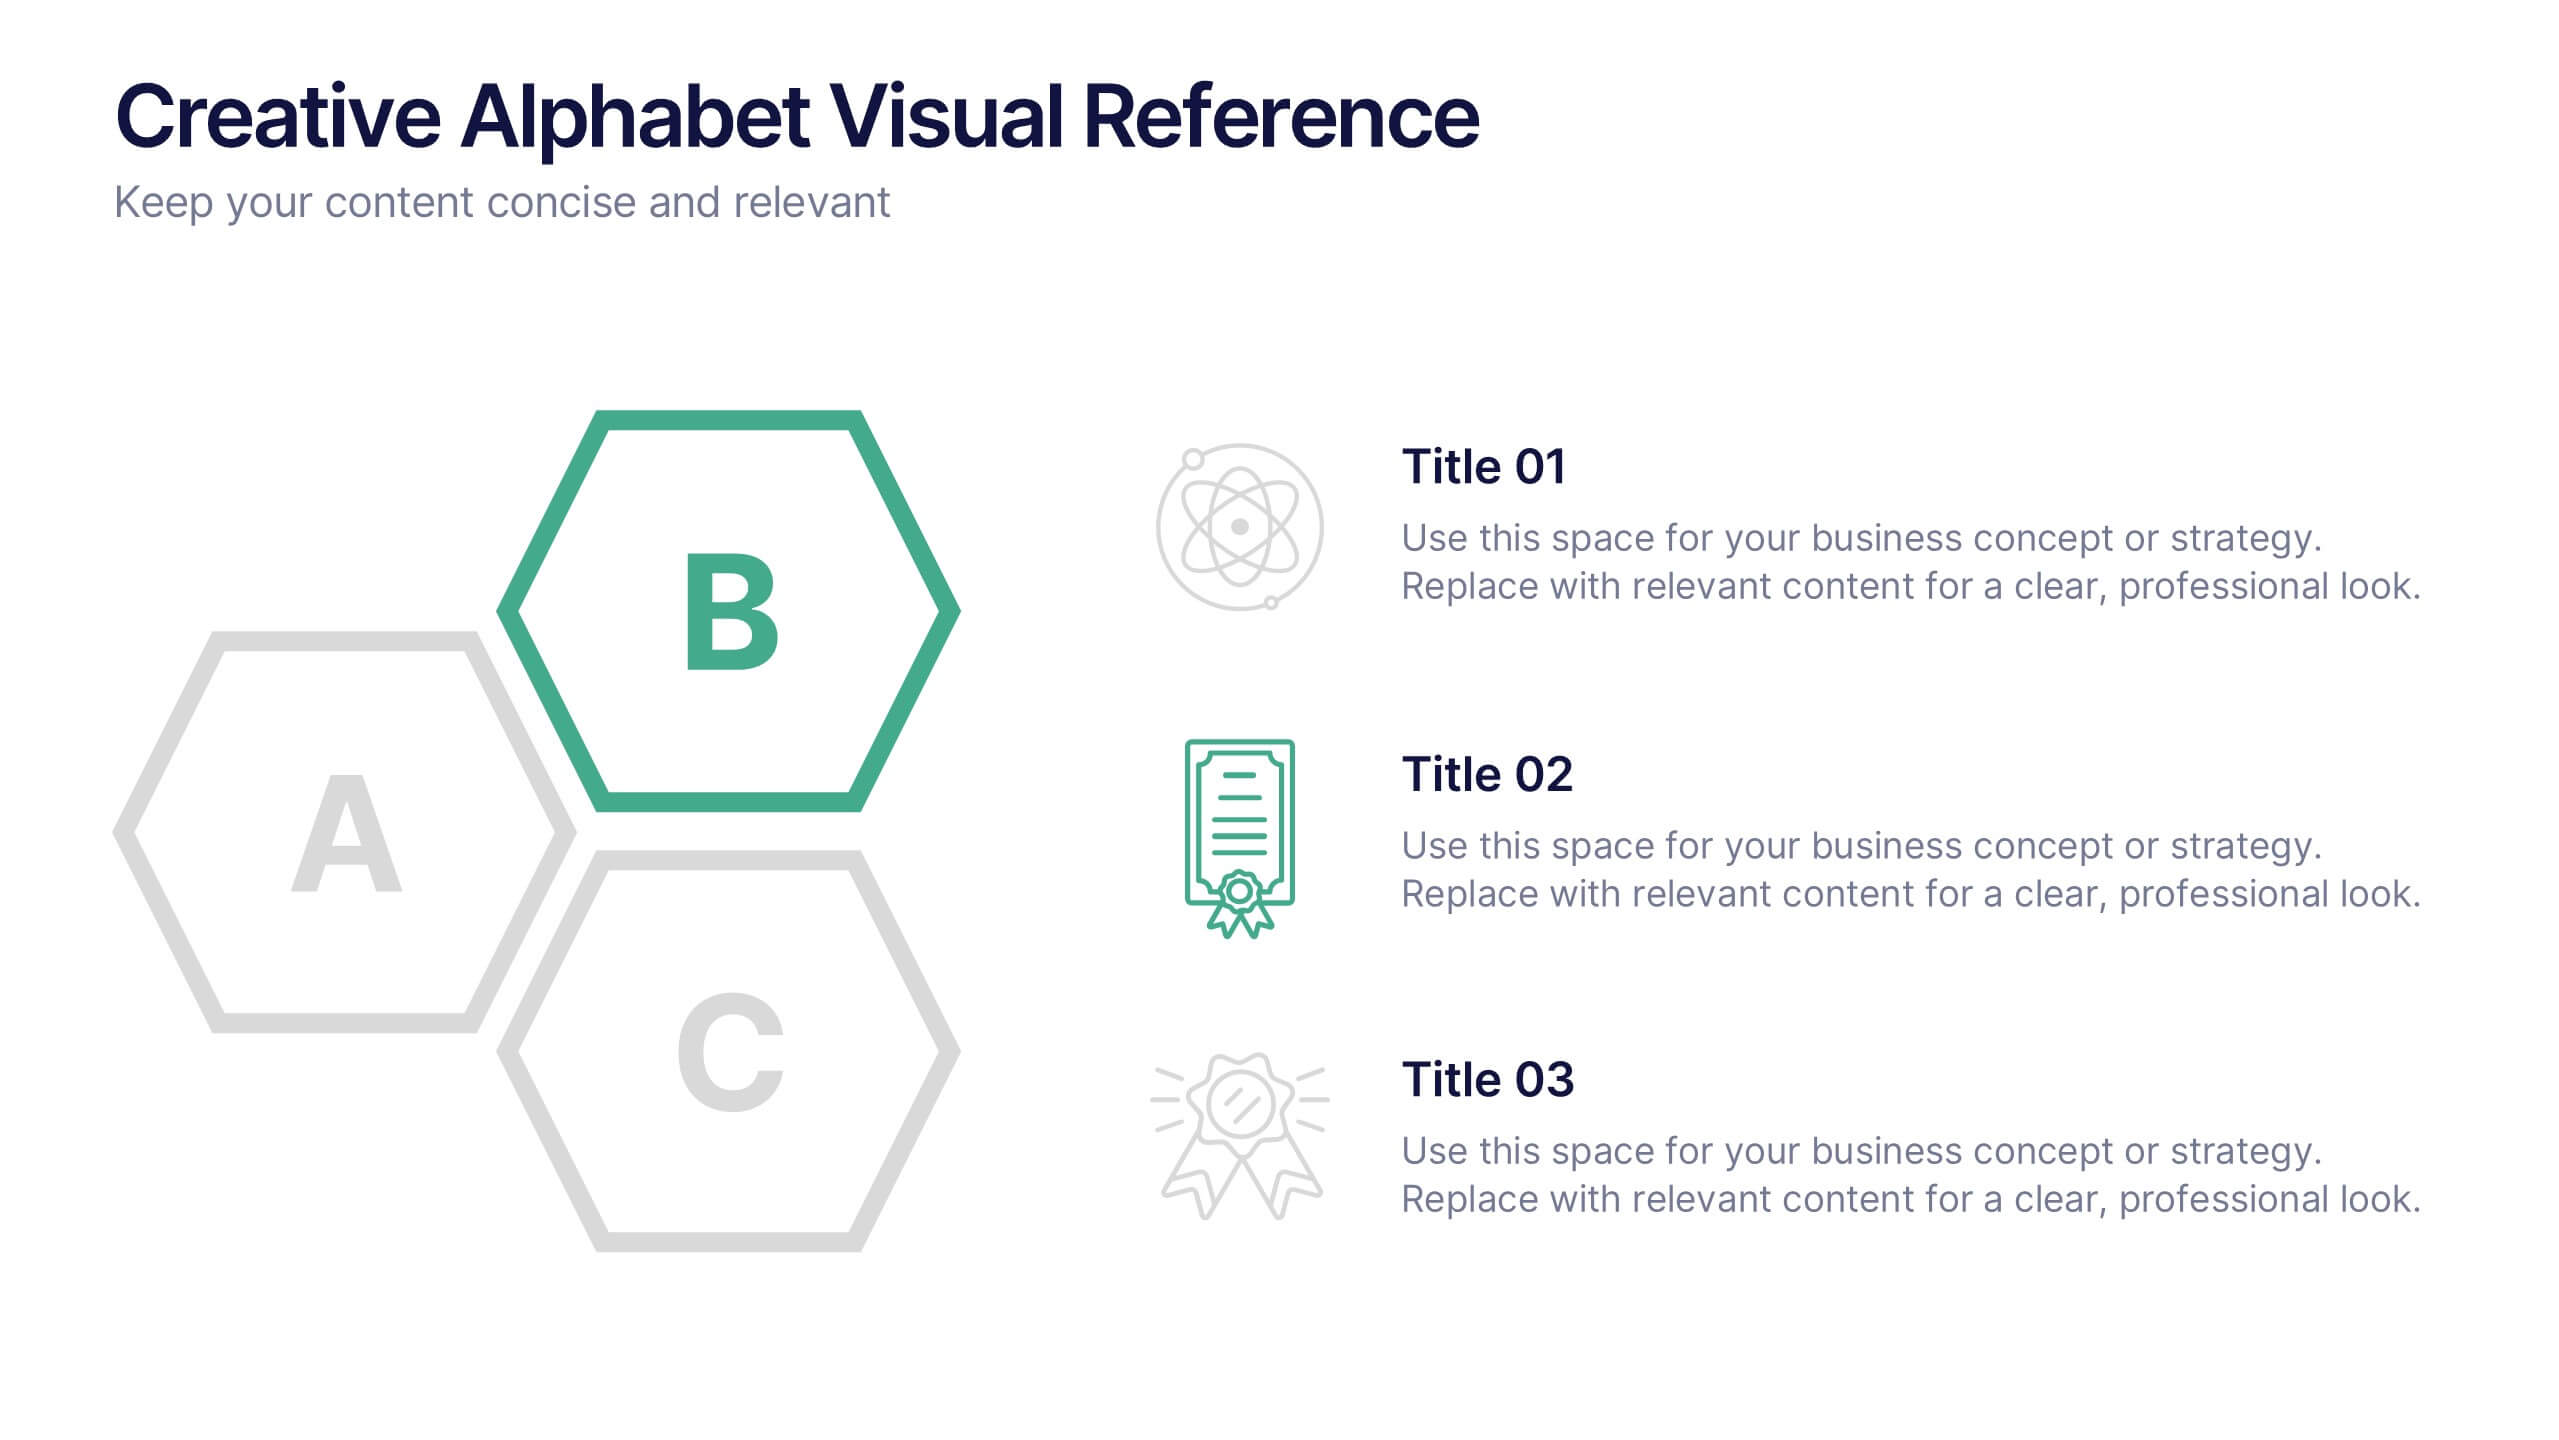
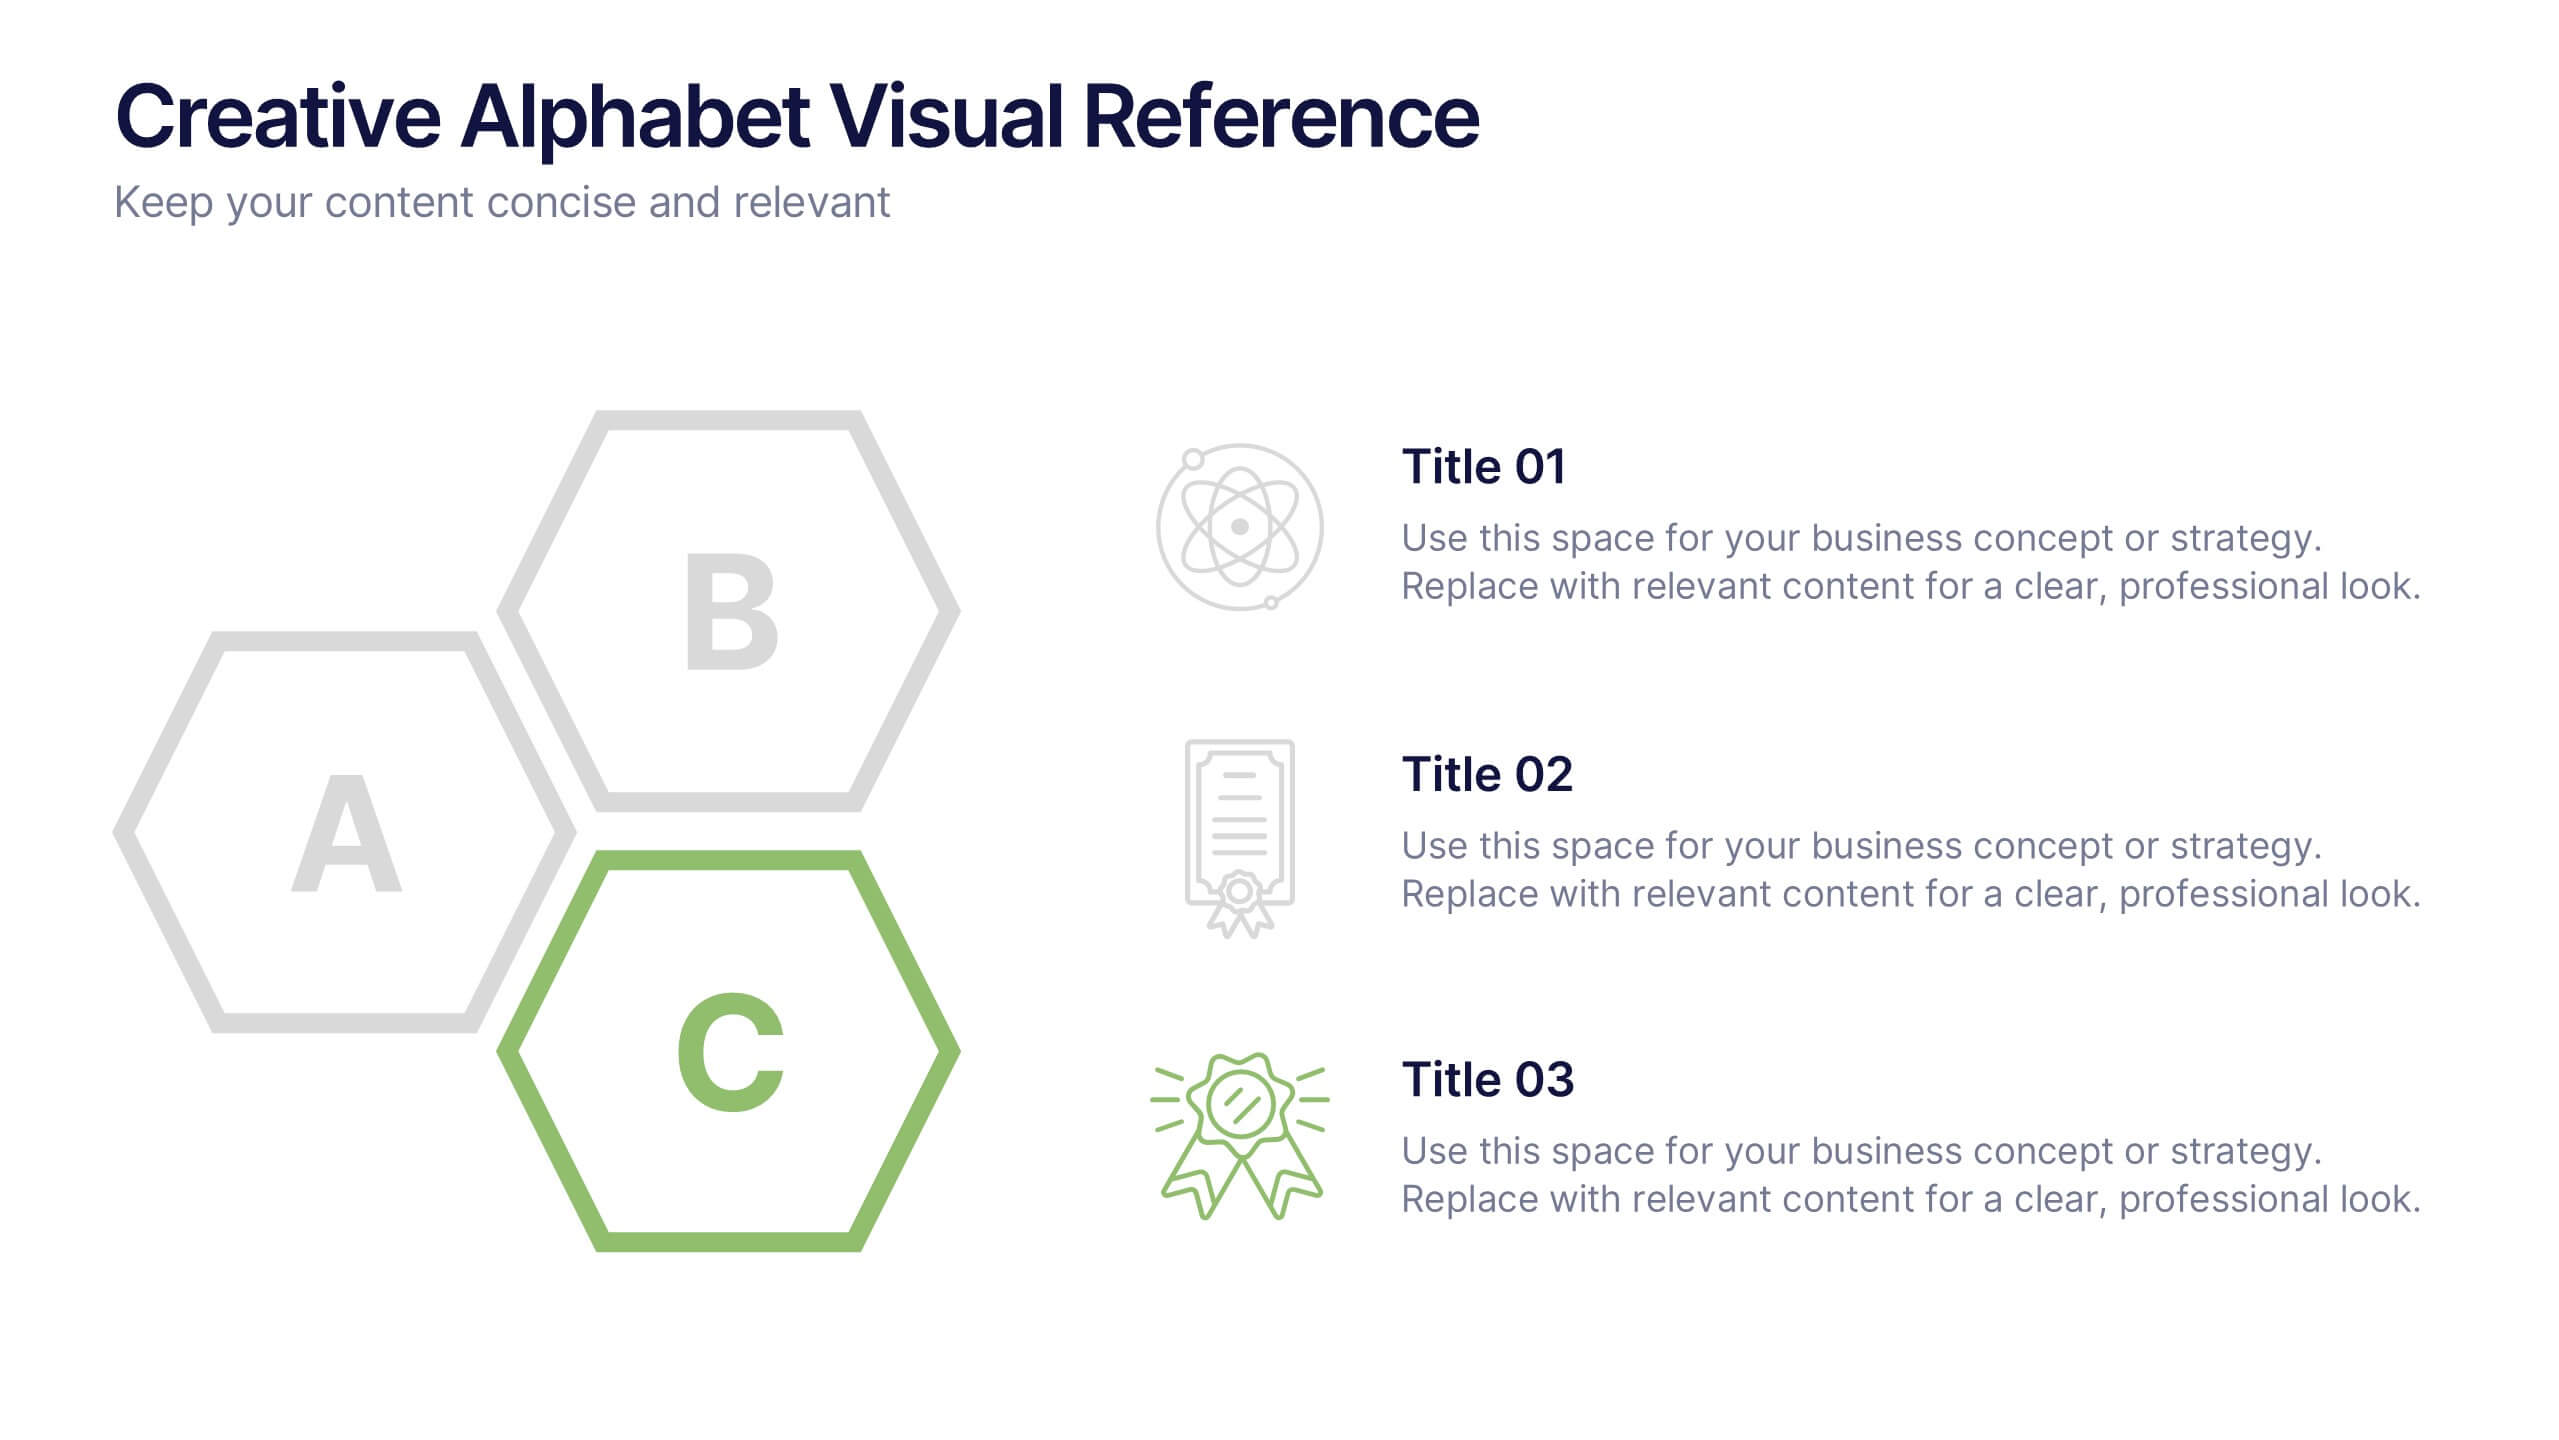
Creative Alphabet Visual Reference Presentation
This creative presentation uses a bold A–B–C visual structure to highlight key points in a clean, modern layout. Ideal for overviews, comparisons, or step-by-step frameworks. Fully customizable in Canva, it balances design and clarity—perfect for business strategies, education, or visual storytelling with strong alphabetical cues and icon integration.


7 diapositivas
Work From Home Infographic Presentation Template
A Work From Home Infographic is a visual representation of data related to working from home. This infographic can be used as a guide to get you through some of the best opportunities available. Use this template to get the necessary tools to start working from home. Use this infographic to show your audience how many people work from home by adding statistics, tips and interesting facts. This template is designed to effectively communicate complex information in a simple format, making it great for exploring the topic of working from home. This is a perfect way to promote your business!


4 diapositivas
Cause-Effect Relationships Bowtie Format Presentation
Clearly illustrate the connection between causes and outcomes with the Cause-Effect Relationships Bowtie Format Presentation. Designed to simplify complex business logic, this layout uses a symmetrical bowtie shape to contrast contributing factors with resulting effects. Ideal for strategy, operations, or risk analysis. Fully editable in Canva, PowerPoint, Google Slides, and Keynote.


6 diapositivas
Stages of the Product Life Cycle Presentation
Illustrate the evolution of a product from launch to decline with the Stages of the Product Life Cycle presentation. This vibrant, segmented chart template visualizes key phases—Introduction, Growth, Maturity, and Decline—making it perfect for marketers, product managers, and strategists. Each stage is color-coded and icon-marked to enhance clarity and engagement. Fully customizable in PowerPoint, Keynote, and Google Slides.


6 diapositivas
Comparative Analysis with Butterfly Chart Presentation
The "Comparative Analysis with Butterfly Chart" presentation template offers a visually striking way to compare and contrast data between two entities, such as Supplier A and Supplier B, across multiple variables. This format is particularly useful for presentations aiming to showcase cost comparisons, performance evaluations, or any side-by-side metric analysis in a concise and impactful way. Each variable is represented by a row of circles, where the color intensity and the number of circles filled can denote different levels of achievement or value, making it clear at a glance where strengths and disparities lie.


12 diapositivas
Real Estate Business Proposal Presentation
Present your Real Estate Business Proposal with this structured and visually compelling template. Designed for real estate professionals, investors, and agencies, this slide helps communicate investment strategies, market opportunities, and property insights effectively. Fully customizable and compatible with PowerPoint, Keynote, and Google Slides for seamless editing.


23 diapositivas
Echo Startup Pitch Deck Template Presentation
This sleek pitch deck template is perfect for showcasing your startup’s potential. Highlight your problem, solutions, revenue model, and unique value proposition in a professional format. It's fully customizable, easy to use, and compatible with PowerPoint, Keynote, and Google Slides, making it ideal for impressing investors.


7 diapositivas
Industrial Safety Infographic
Industrial safety, also known as occupational safety, pertains to the management of processes and conditions within industrial settings to ensure the safety, health, and well-being of workers and the general public. This impactful infographic template encapsulates the essentials for fostering a secure and hazard-free industrial environment. Compatible with Powerpoint, Keynote, and Google Slides. The customizable set of icons represents emergency response actions, underlining the need for rapid and efficient responses in critical situations. Build a foundation of safety that fosters a secure and thriving work environment.


10 diapositivas
4-Step Business Process Presentation
Present your ideas with clarity and impact using this clean, structured layout made for professionals who value organization and design. Perfect for outlining strategies, steps, or lists, it keeps your message focused and engaging. Easily customizable and fully compatible with PowerPoint, Keynote, and Google Slides for polished results.


5 diapositivas
Compete-Free Market Space Creation Presentation
The Compete-Free Market Space Creation Presentation is designed to help illustrate a strategic shift toward innovation-led market growth. This circular diagram layout allows you to highlight four essential focus areas—each with customizable icons, titles, and supporting text. Ideal for presenting frameworks based on Blue Ocean Strategy, business differentiation, or uncontested market exploration. The clean, professional design supports storytelling with clarity and flow, making it perfect for consultants, business strategists, and executive teams. Fully editable in PowerPoint, Keynote, and Google Slides for maximum flexibility.


6 diapositivas
Education Through Gamified Learning Presentation
Make learning fun and engaging with the Education Through Gamified Learning Presentation. This creative slide layout uses a playful interface with progress-style icons and a “Play” button to simulate game-based education paths. Ideal for educators, trainers, and eLearning designers. Fully customizable in Canva, PowerPoint, Keynote, and Google Slides.


7 diapositivas
Competitive Analysis Using Strategy Wheel
Highlight your competitive edge with this dynamic strategy wheel diagram. Designed to visually compare up to six business components, this slide is ideal for showcasing strengths, weaknesses, or market positioning. Perfect for strategic planning sessions, it’s fully editable in PowerPoint, Keynote, and Google Slides.