


Características


¿Tienes alguna pregunta?
Recomendar


4 diapositivas
Organic Farming Overview Presentation
Present your sustainable agriculture strategies with this organic farming overview template, featuring vibrant icons and clean layouts. Perfect for eco-friendly initiatives, farm project plans, and environmental reports. Fully editable in Canva, PowerPoint, and Google Slides, allowing you to adjust colors, icons, and text to align with your branding and goals.


6 diapositivas
Risk and Return Investment
Illustrate the delicate balance between risk and reward with this visual concept. This presentation uses a see-saw metaphor to compare investment risk versus financial return, ideal for finance professionals, consultants, and educators. Fully customizable in PowerPoint, Keynote, and Google Slides.


4 diapositivas
Project Timeline & Milestone Presentation
Stay on track and visualize your progress with this Project Timeline & Milestone Presentation. Perfect for project managers and team leads, this template features a clean Gantt-style layout that spans multiple months, allowing you to clearly map out tasks, timelines, and key milestones. Use it to enhance stakeholder reporting or internal planning sessions. Fully editable in PowerPoint, Keynote, and Google Slides.


6 diapositivas
Pattern-Based Layouts Using Geometry
Present your process, timeline, or flow with clarity using the Pattern-Based Layouts Using Geometry Presentation. This clean, step-by-step format uses bold numbered icons and curved geometric blocks to guide viewers through five key stages. Ideal for sequential content, strategies, or workflows. Easily customizable in PowerPoint, Keynote, and Google Slides.


7 diapositivas
Timeline Logistics Infographic
A timeline infographic is a visual representation of the history of your company, product or service. This infographic template is the perfect way to show off your knowledge of a subject while also making it easy for your audience to digest all the information you've presented on hand. This infographic can be used to show the growth of your business. It’s also a great way to show the growth of your career. This template is simple and easy to use, but it’s also very powerful. You can add any icons you want and customize any text on the infographic. Compatible with Powerpoint, Keynote, and Google Slides. This is perfect for any occasion!


20 diapositivas
Lullabyne Design Portfolio Presentation
Showcase your creative work with this modern and professional design portfolio presentation. Covering essential elements like design briefs, mood boards, prototypes, and implementation plans, this template helps you present your work with clarity and style. Fully customizable and available for PowerPoint, Keynote, and Google Slides.


10 diapositivas
Startup Executive Overview Template Presentation
Bring your startup’s big picture to life in one smart, visual swoop! This infographic presentation template helps you map out key insights and milestones in a clean, modern layout. Ideal for pitching ideas, aligning teams, or showcasing growth strategies. Fully compatible with PowerPoint, Keynote, and Google Slides for easy editing.


5 diapositivas
Oil Industry Production Infographic
The Oil Industry is an essential component of the global economy, as oil and natural gases are primary sources of energy. This vertical infographic template is a visual representation of data related to the extraction and production of oil and its byproducts. Use this to include statistics and key facts about oil production, including the top oil-producing countries, and the different methods used for extracting and processing oil. This infographic is compatible with PowerPoint, Keynote, and Google Slides, and can be easily edited to match your branding and style to help you effectively communicate your message.


25 diapositivas
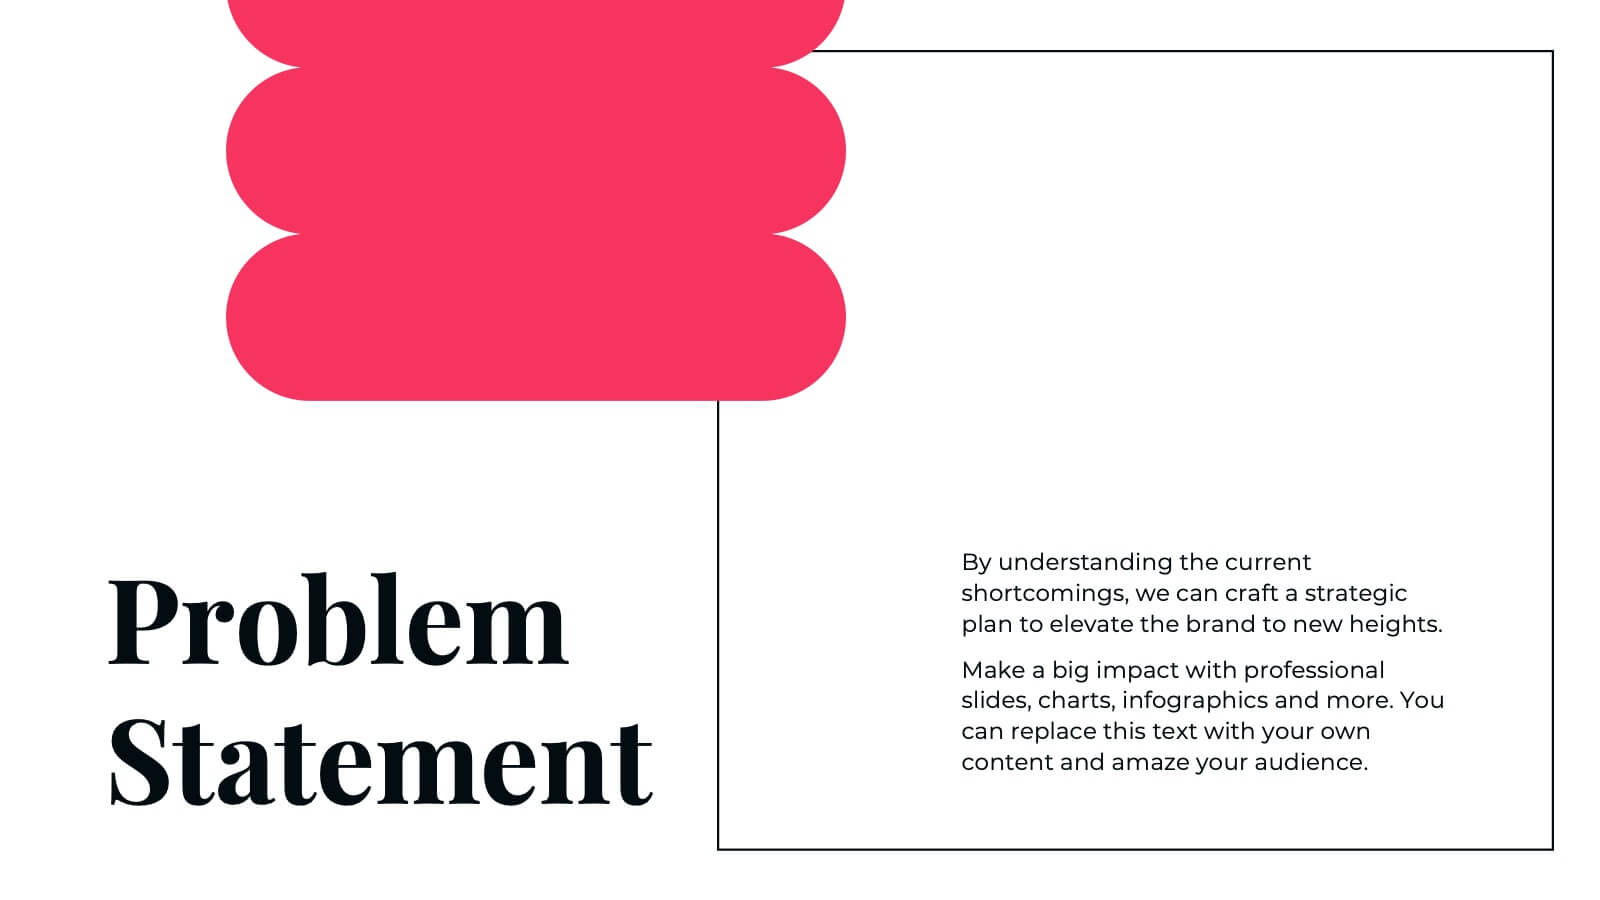
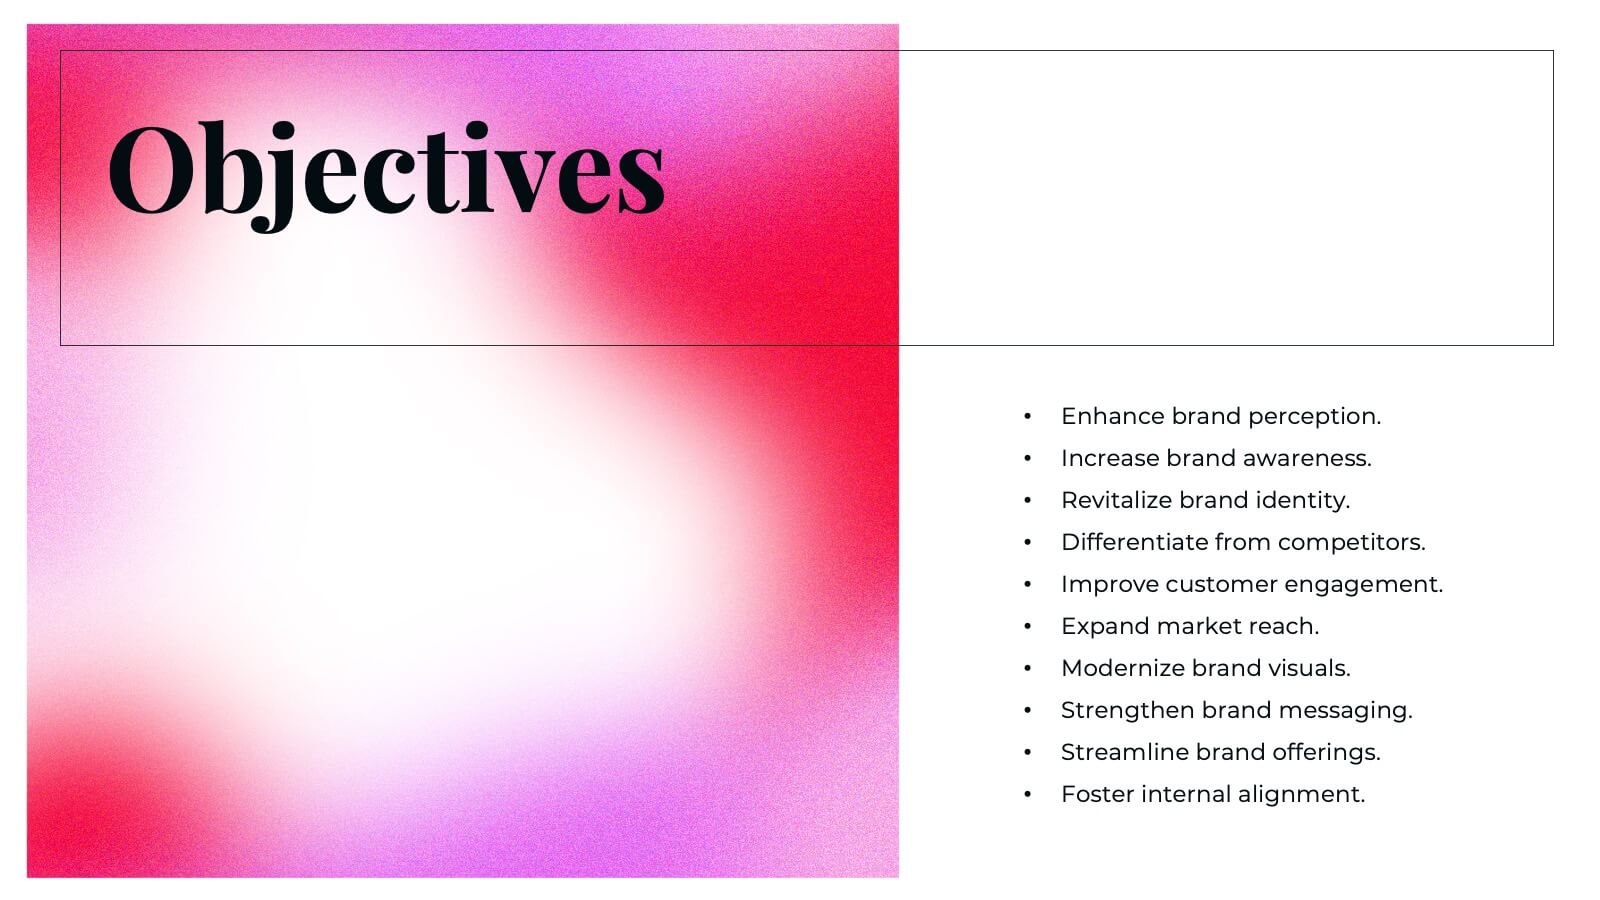
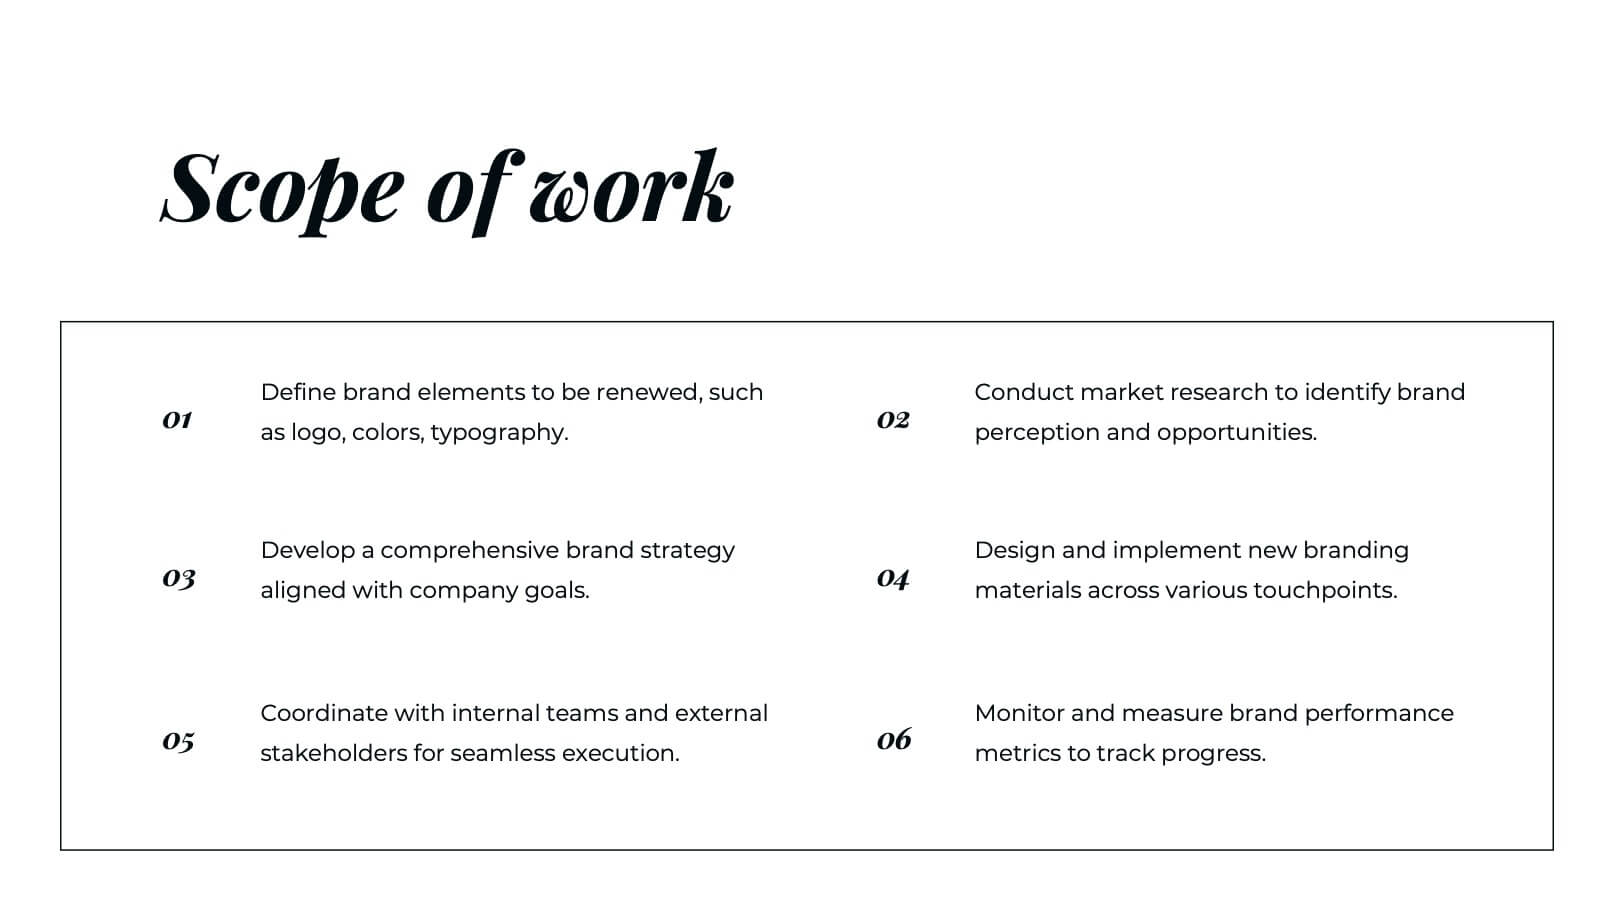
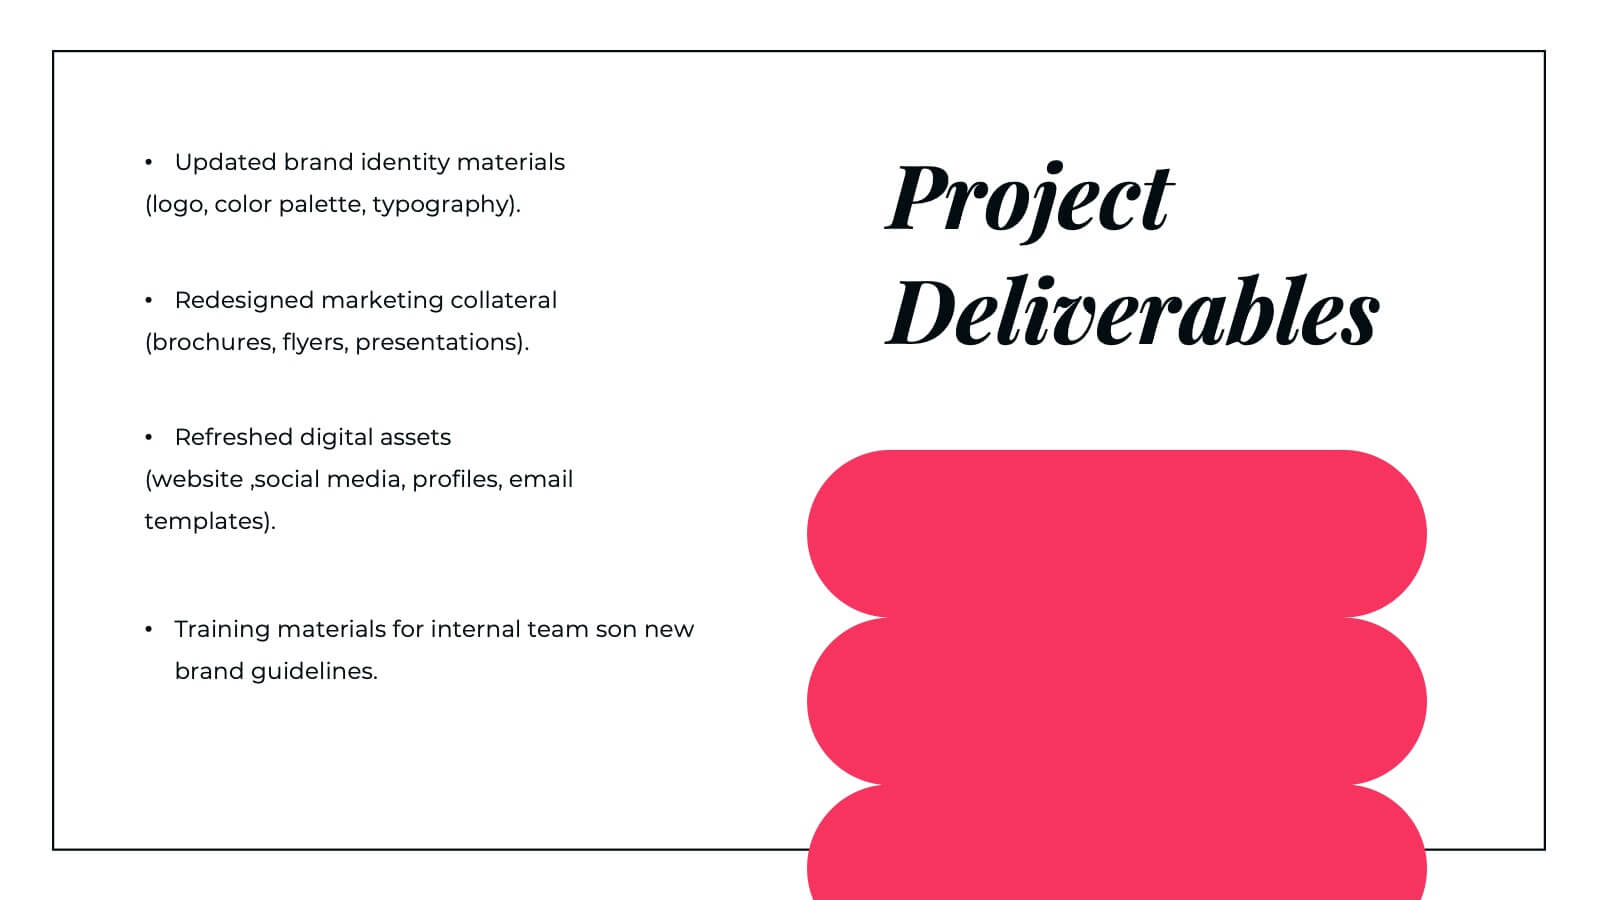
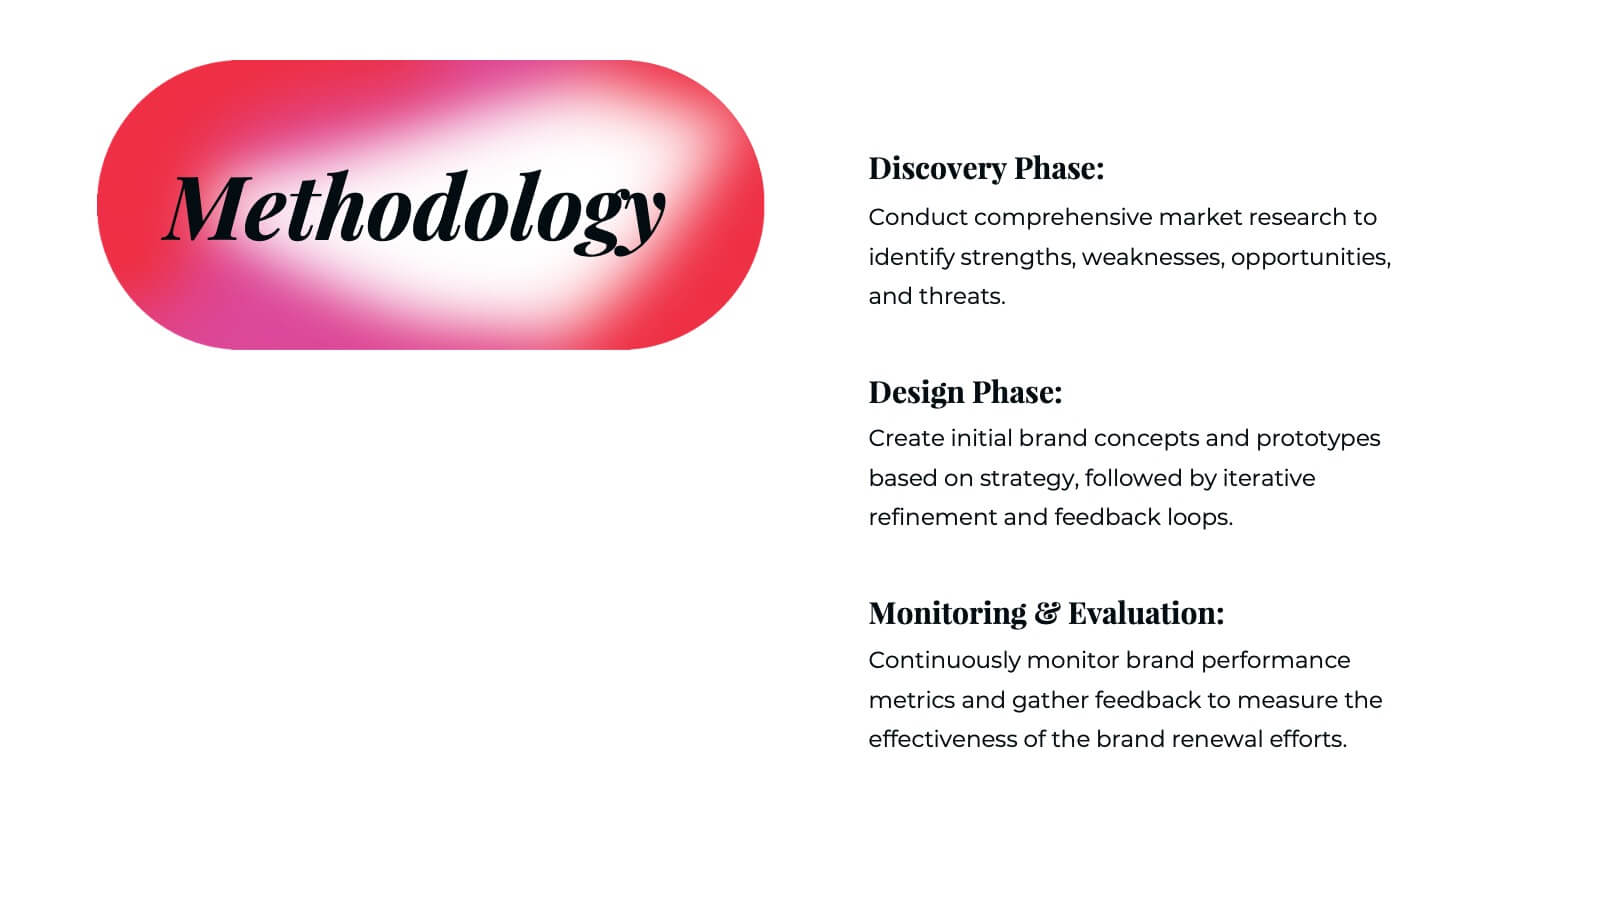
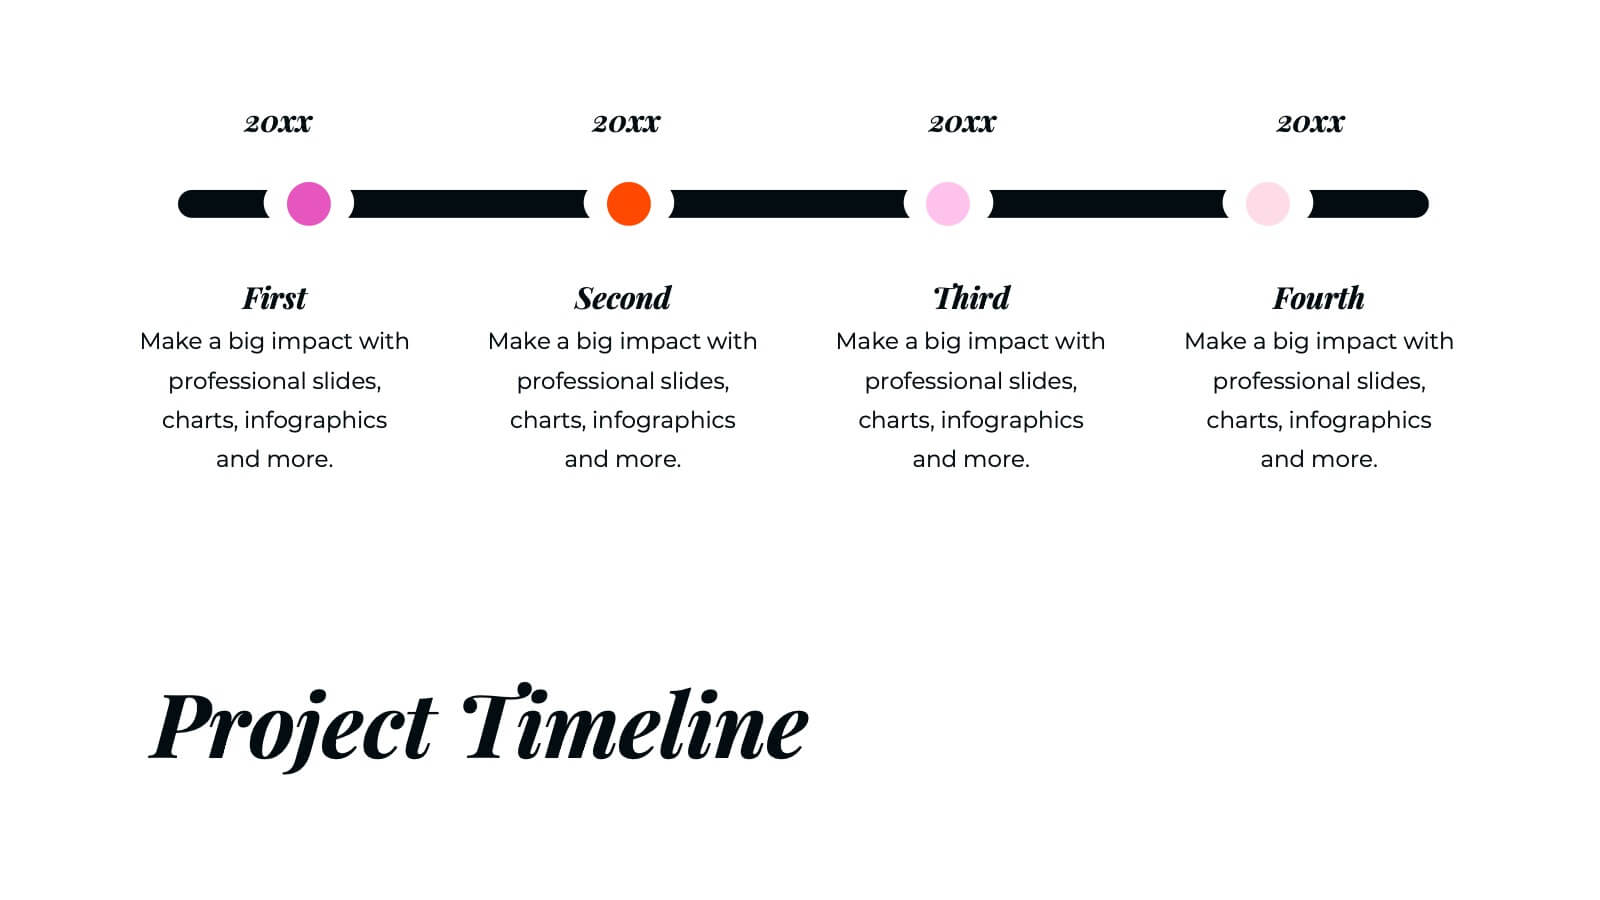
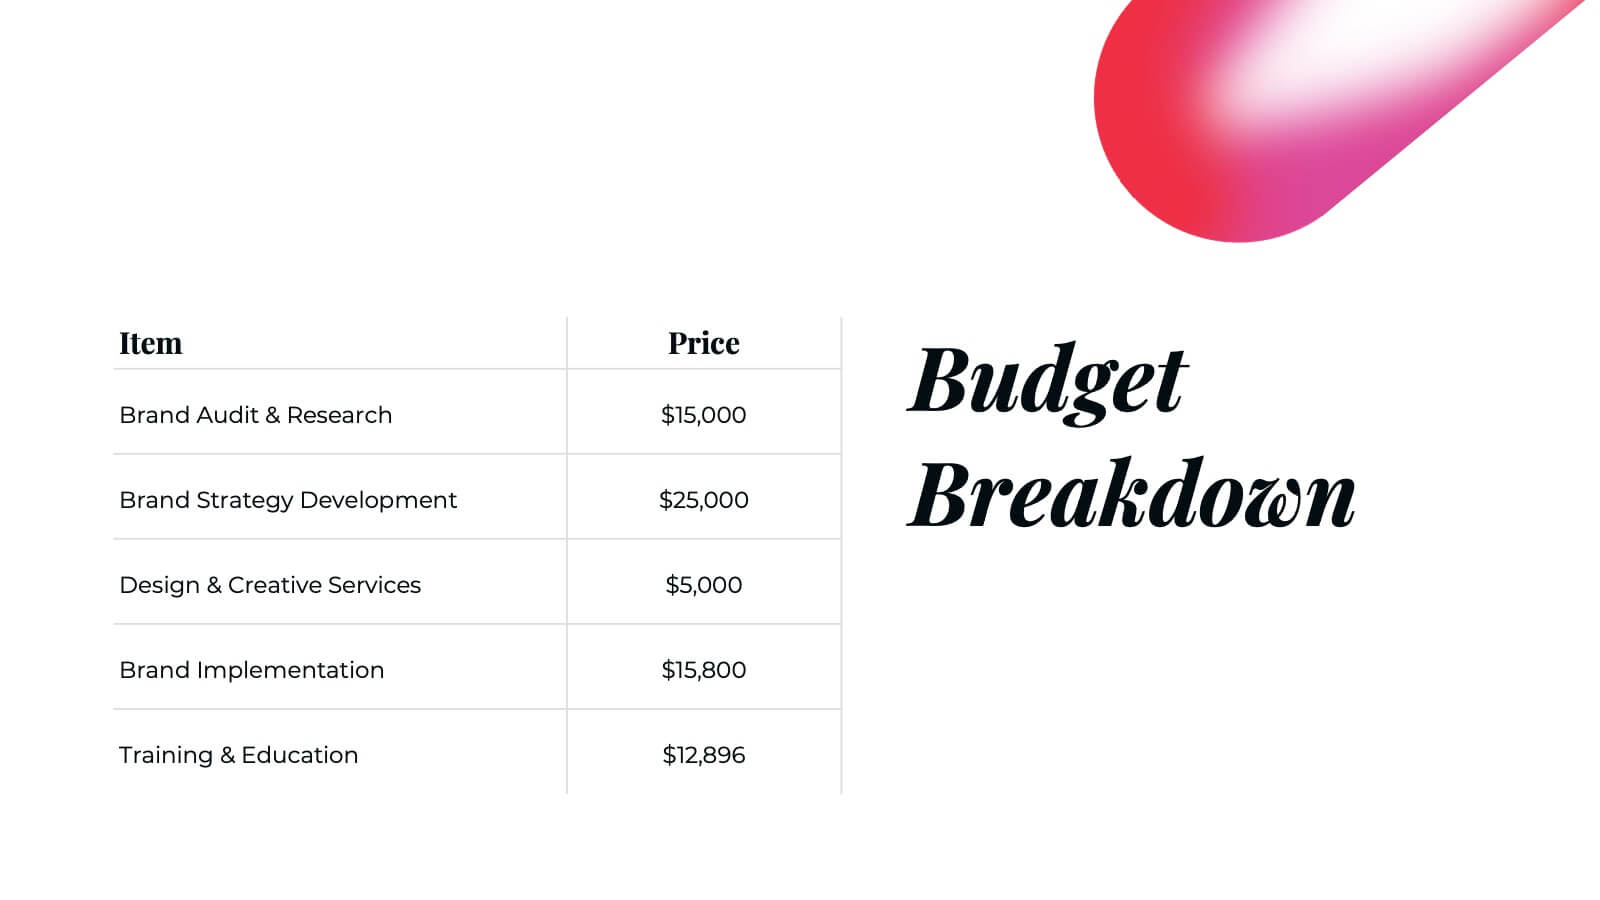
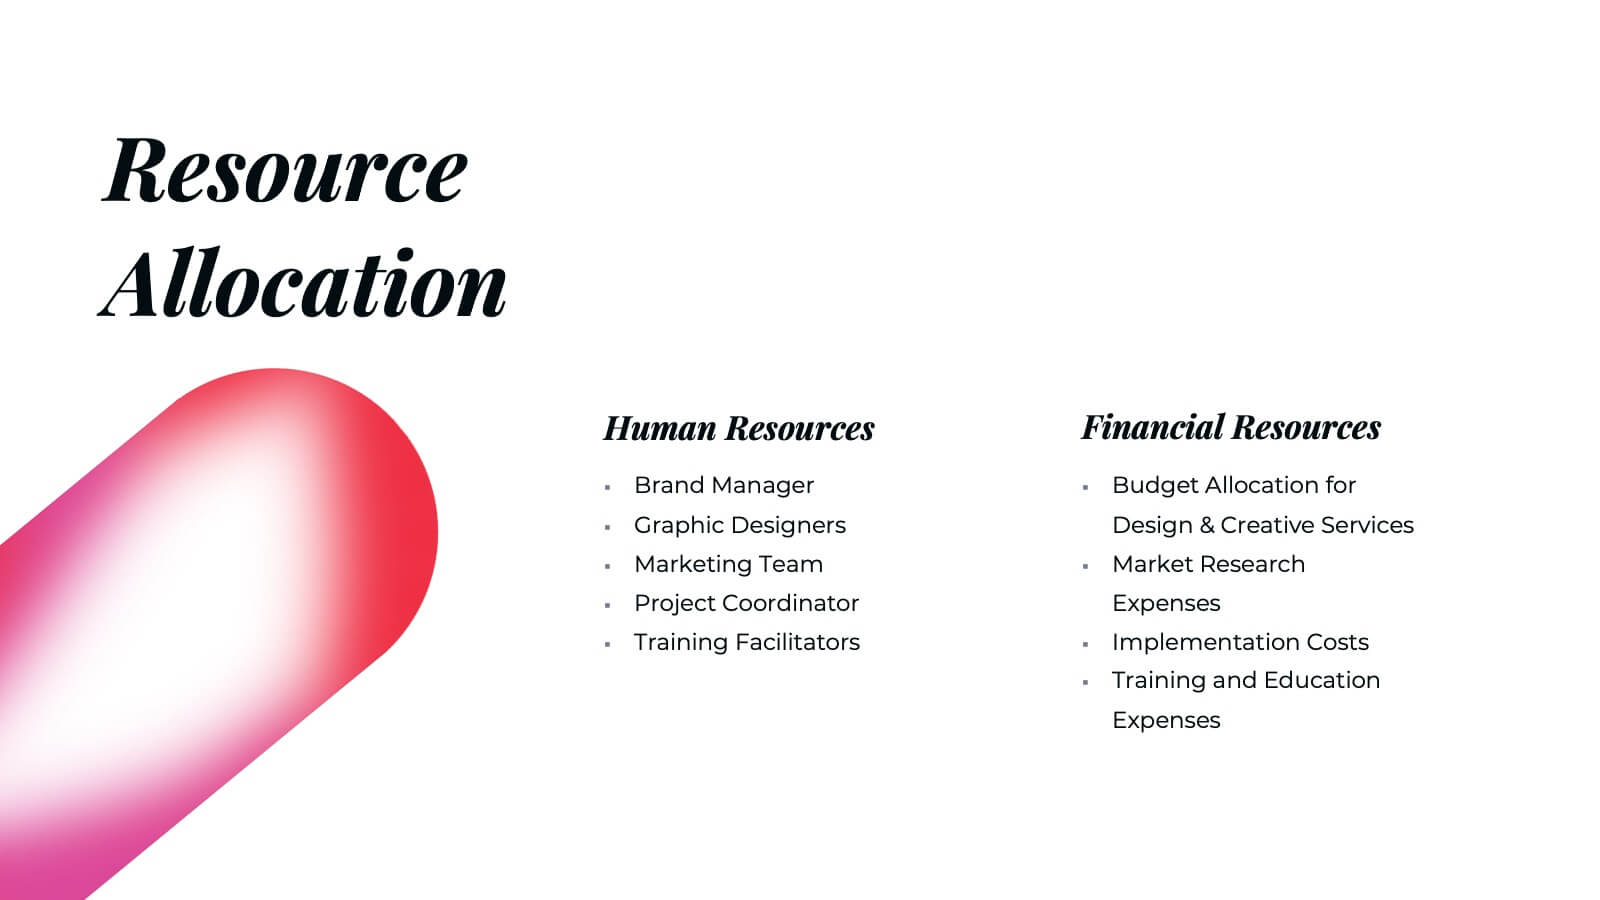
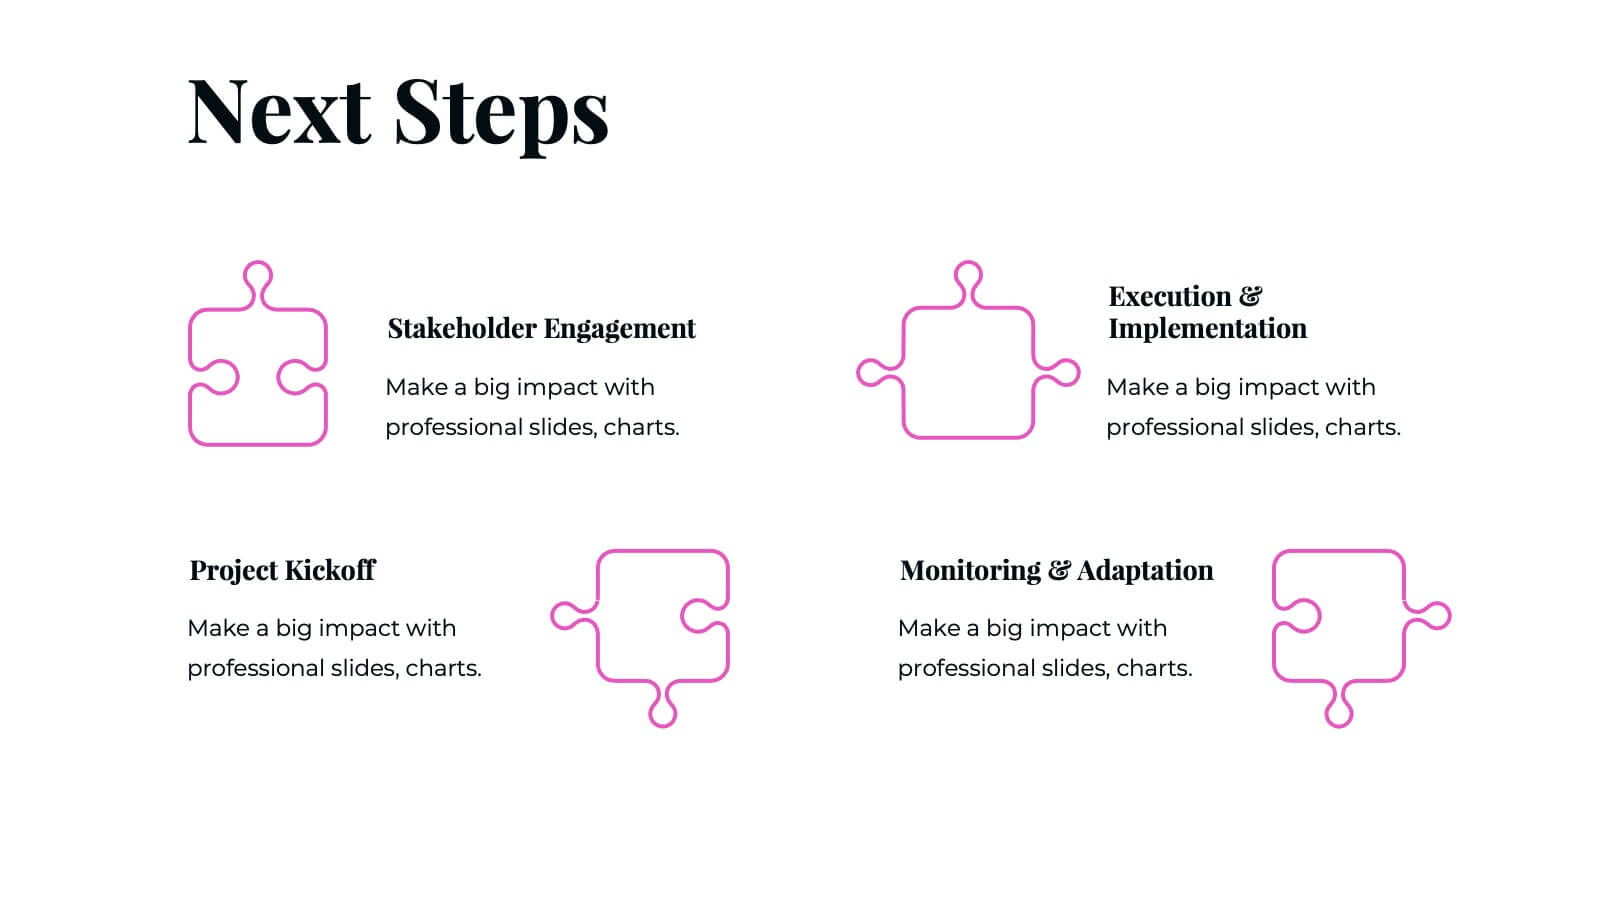
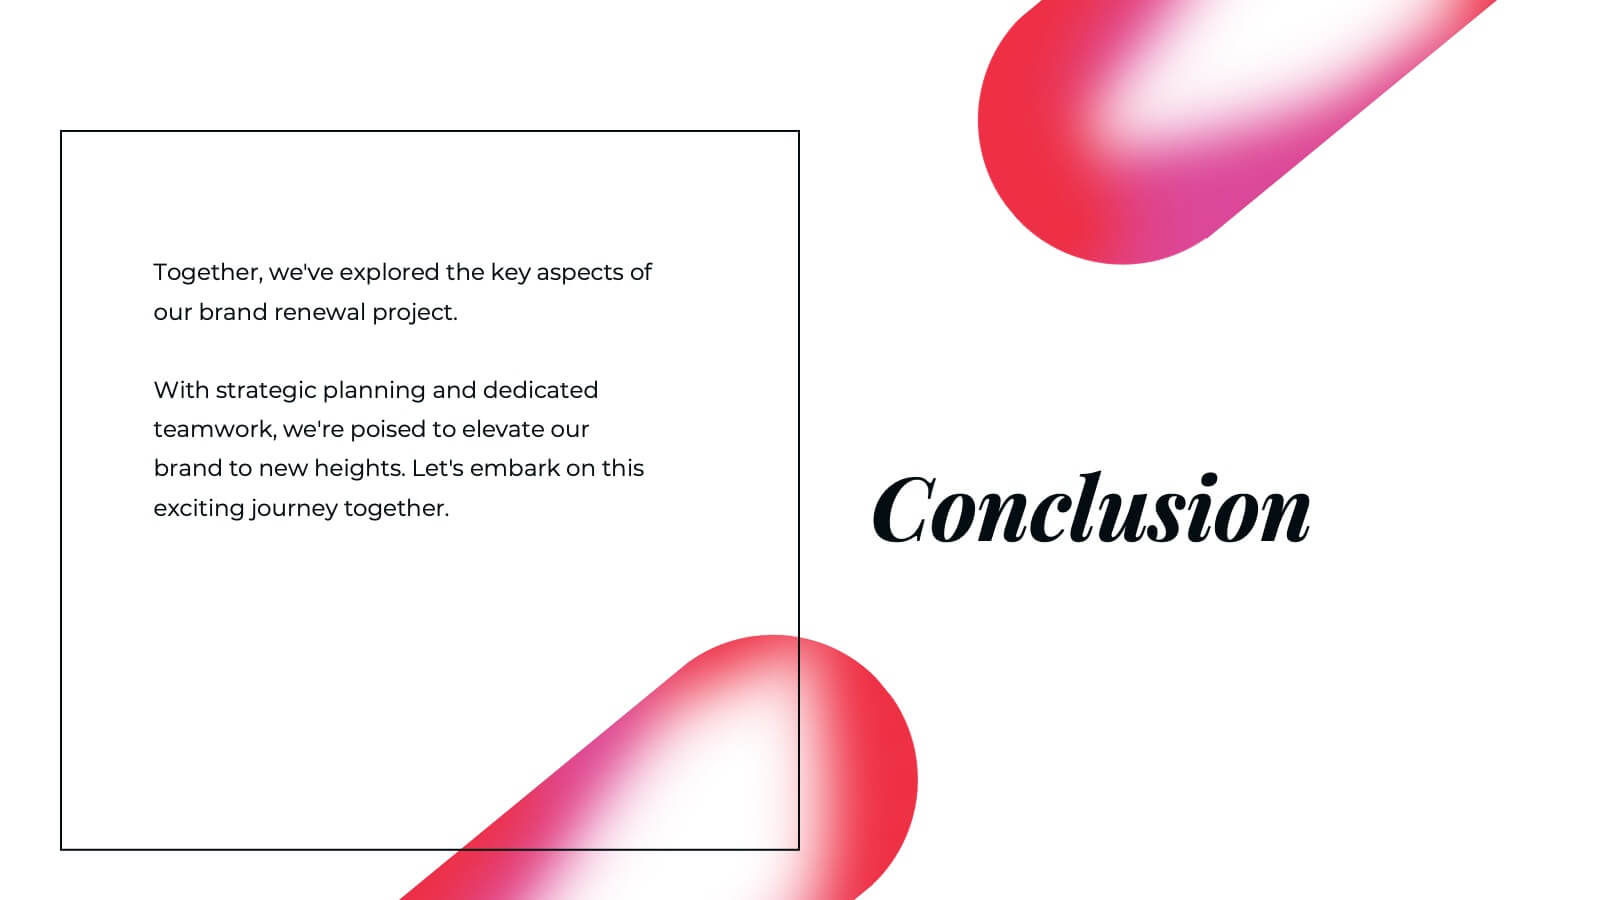
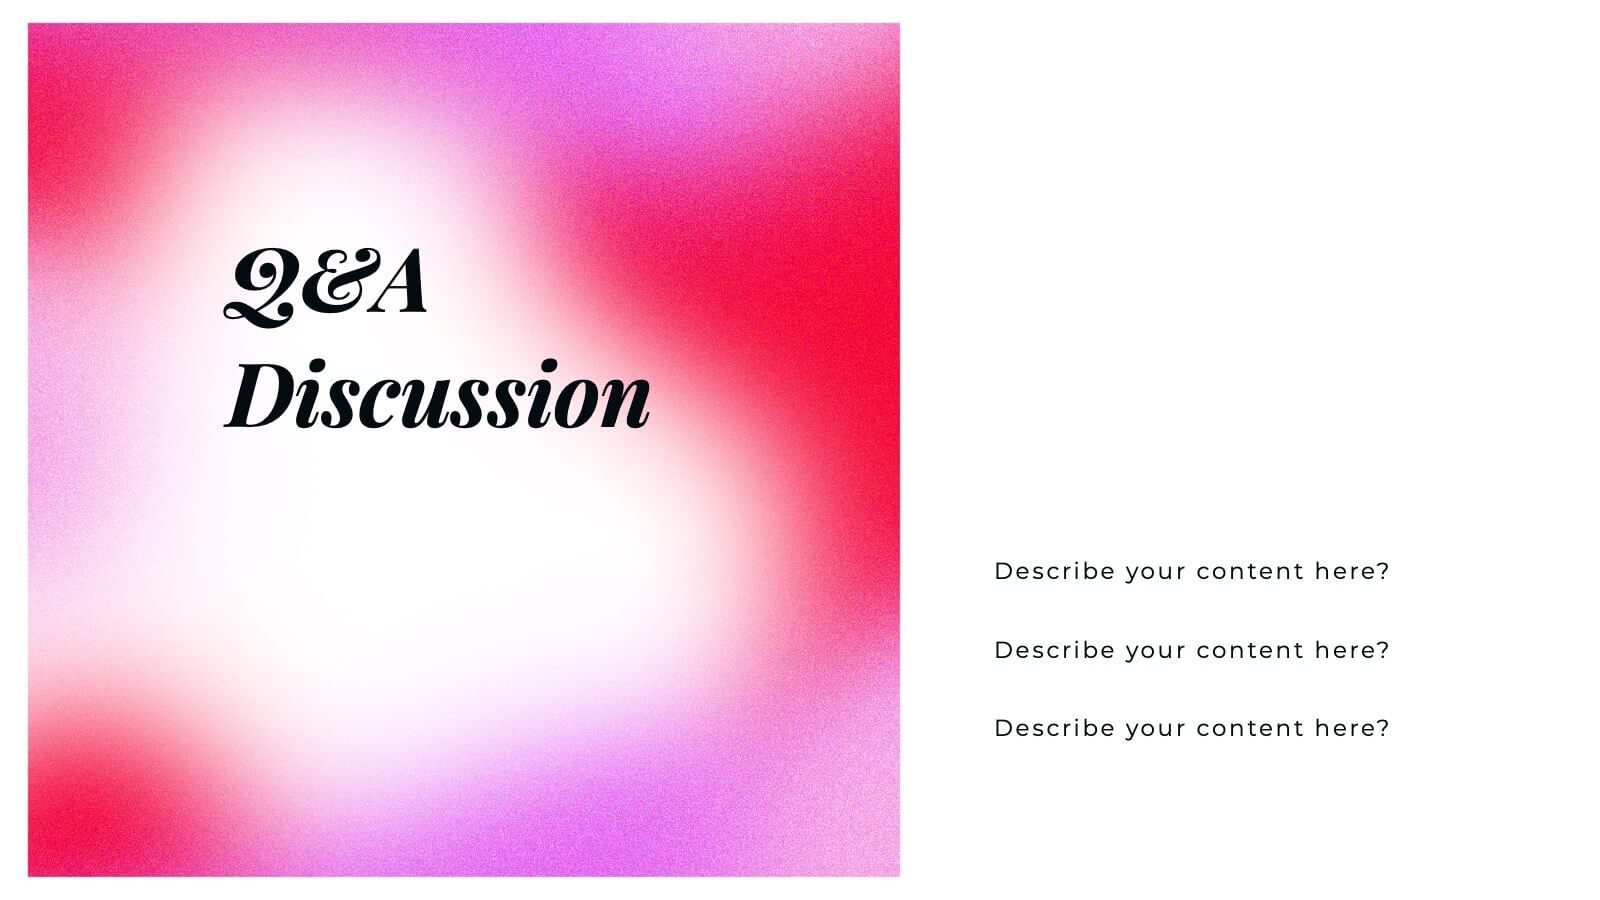
Siren Rebranding Project Plan Presentation
This sleek brand presentation template covers essential elements like market analysis, brand guidelines, positioning, and audience insights. It's designed to showcase your brand identity and development strategies with a modern layout. Compatible with PowerPoint, Keynote, and Google Slides, it’s perfect for delivering professional and engaging brand presentations.


6 diapositivas
Bubble Diagram for Idea Development
Streamline your brainstorming sessions and visualize concept progression with this Bubble Diagram for Idea Development presentation. Featuring a circular, color-coded layout from A to F, it’s ideal for mapping interconnected ideas, workflows, or innovation cycles. Easily editable in PowerPoint, Keynote, and Google Slides.


5 diapositivas
Strategic Business Pillars Model Presentation
Visualize your core strategies with this vertical pillar infographic slide. Each level represents a key focus area or foundational element essential for business success. Ideal for leadership talks, team alignment, or growth strategies. Fully editable in PowerPoint, Keynote, and Google Slides.


8 diapositivas
Business Problem Solution Presentation
Turn complex challenges into clear, visual insights with this sleek diagram designed to outline problems, root causes, and actionable solutions. Ideal for strategy meetings or proposal decks, it helps you communicate ideas with structure and impact. Fully compatible with PowerPoint, Keynote, and Google Slides for easy customization and presentation use.


22 diapositivas
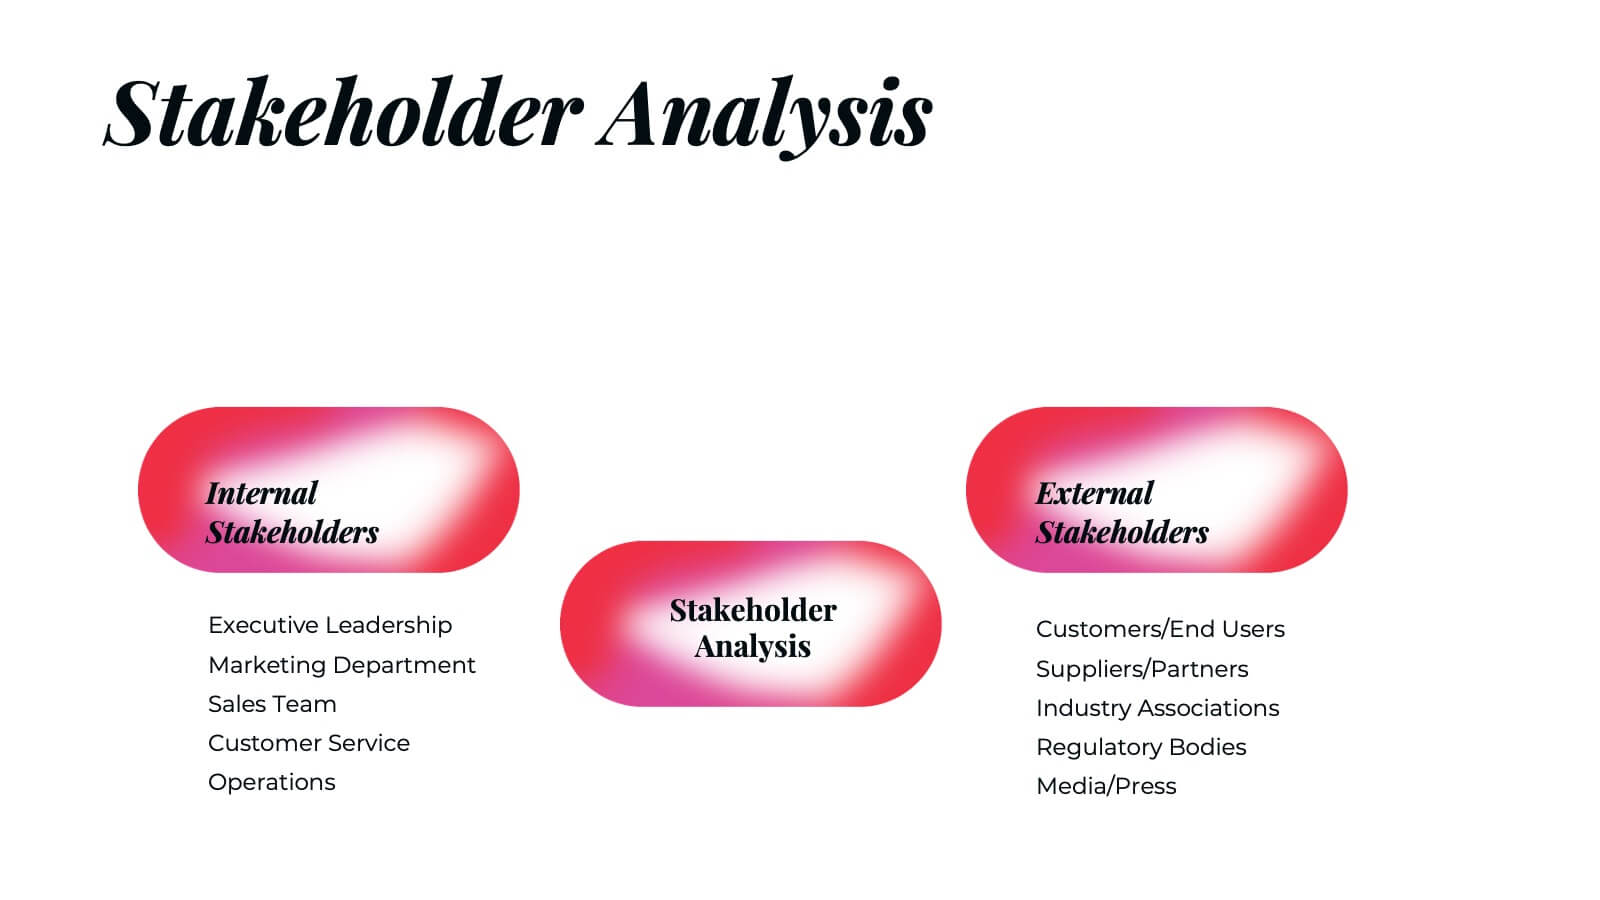
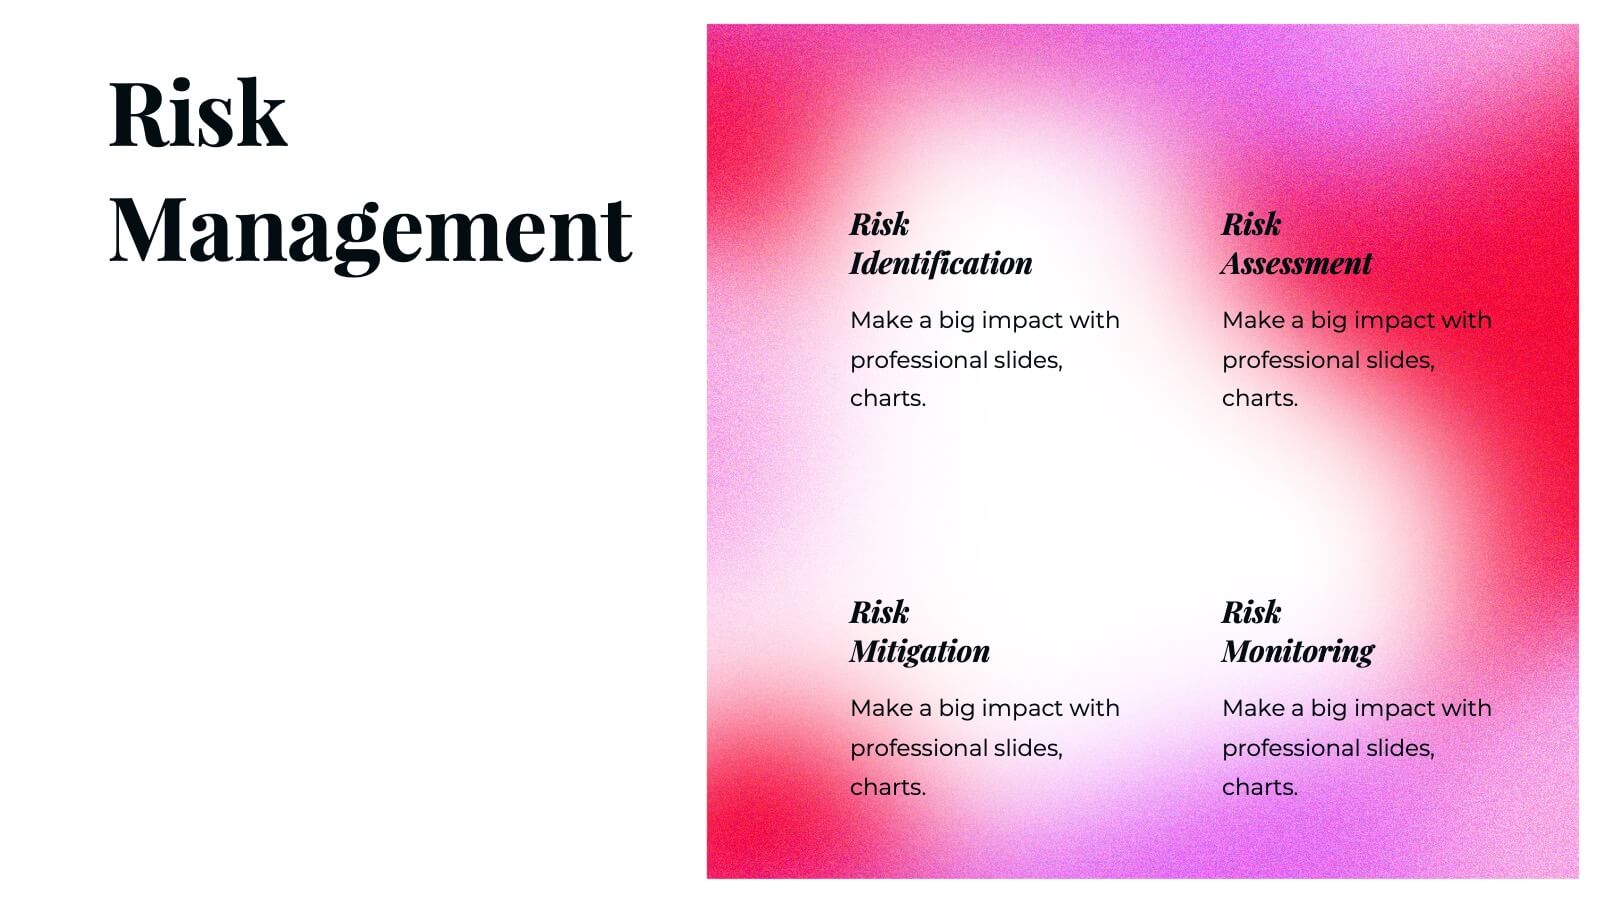
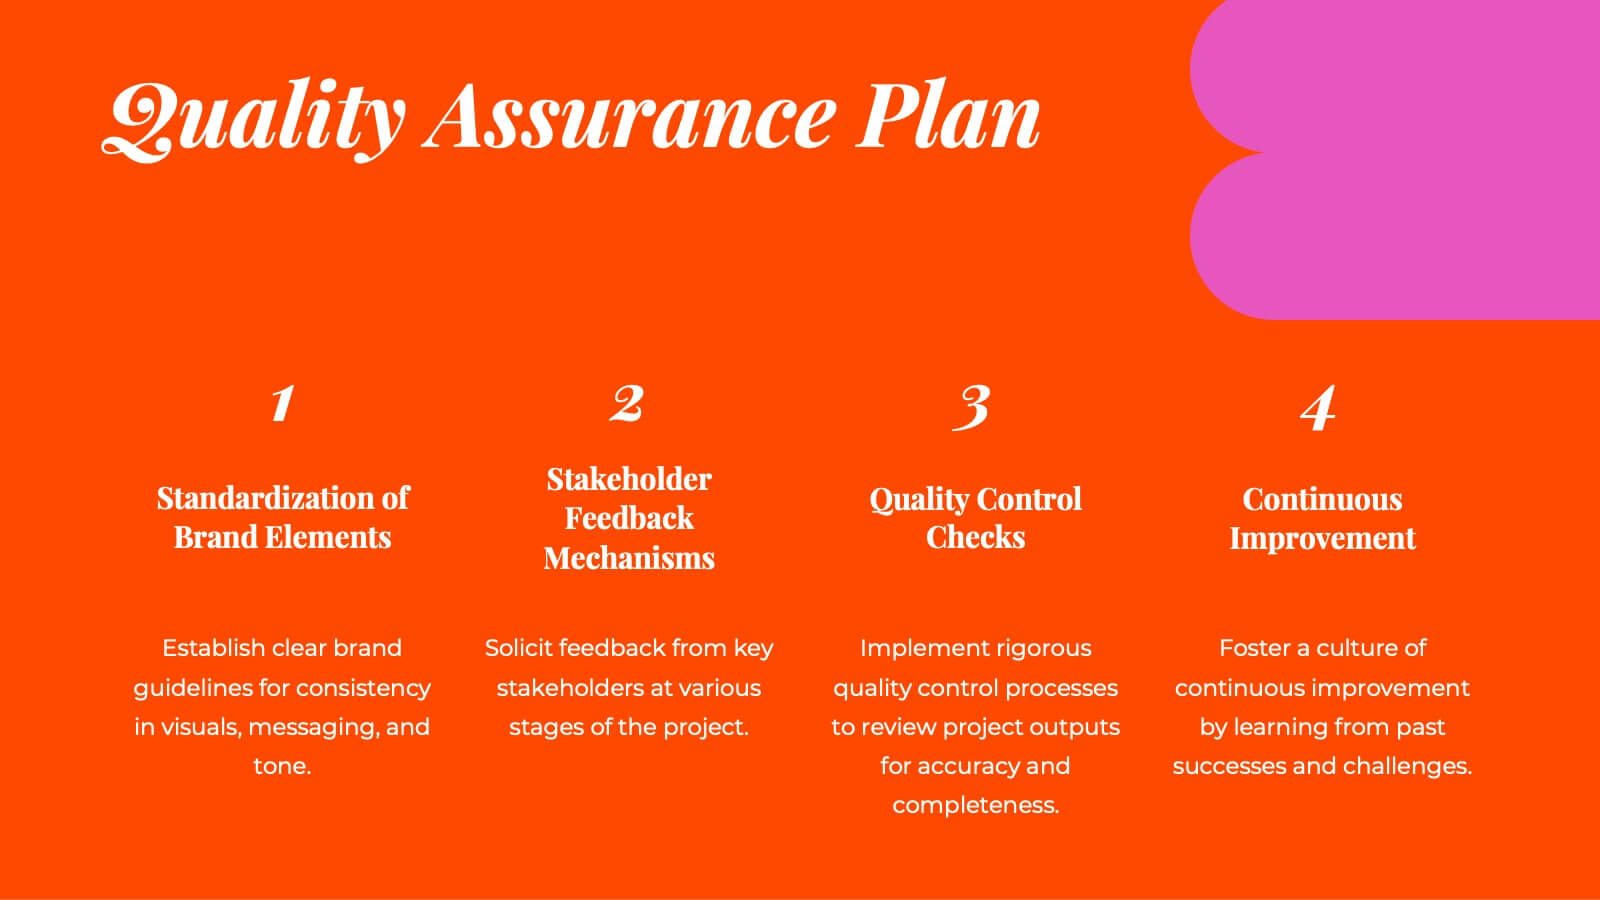
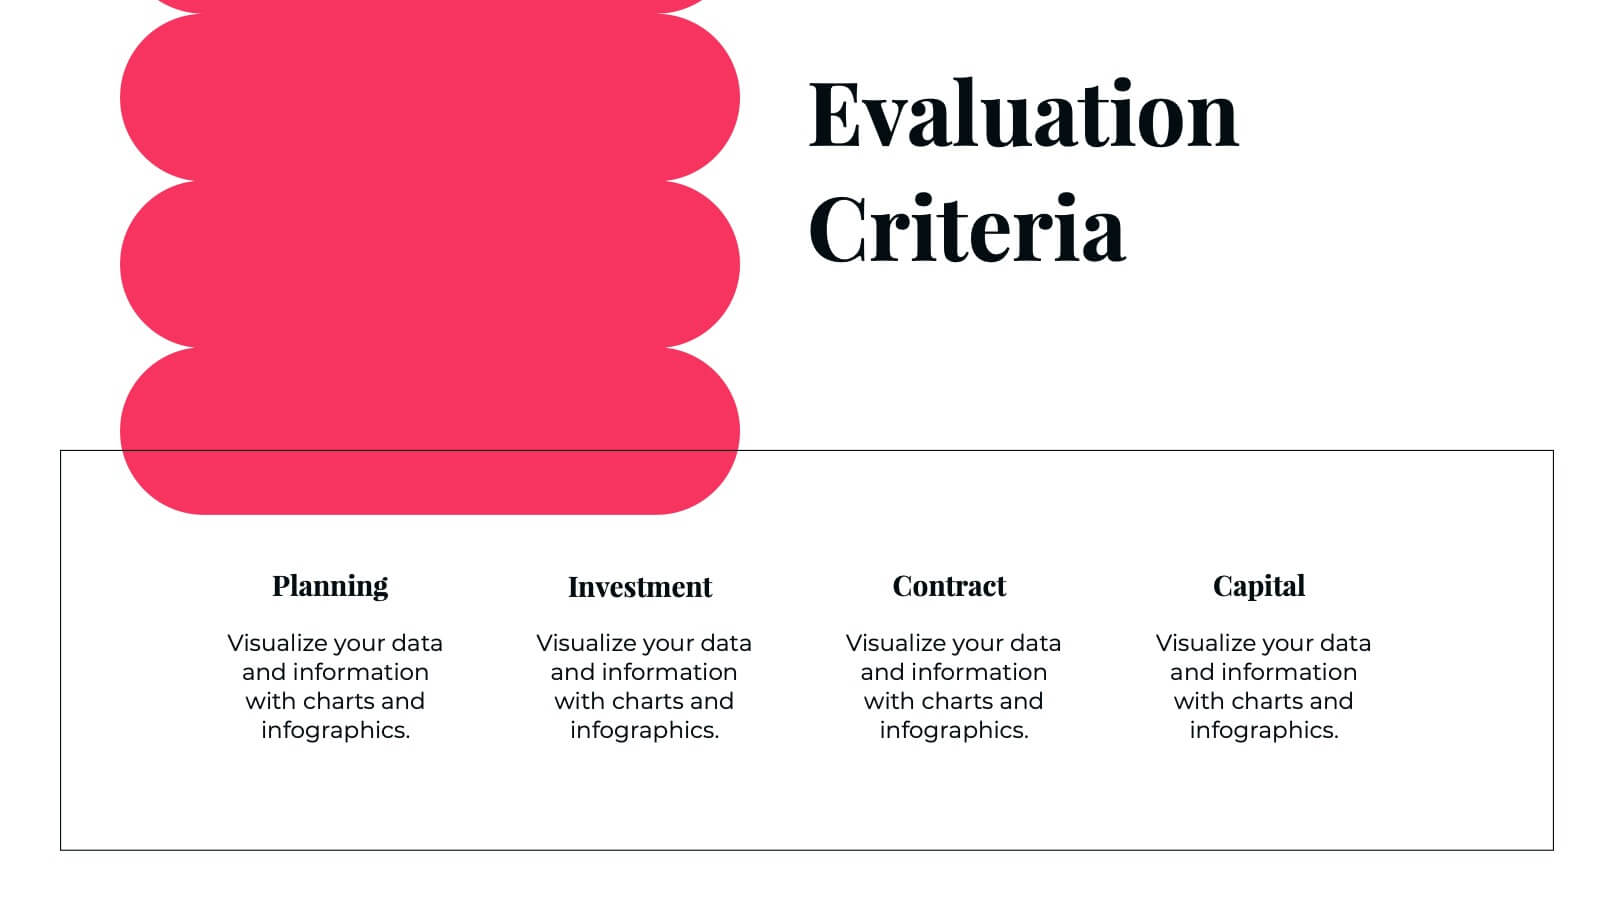
Moonstone Detailed Project Execution Plan Presentation
Create a compelling project execution plan with this vibrant and well-structured presentation template! Covering every key aspect from problem statements and objectives to risk management and quality assurance, this template provides a clear roadmap for your project. It’s perfect for organizing timelines, budget breakdowns, and stakeholder analysis. Compatible with PowerPoint, Keynote, and Google Slides for smooth presentations.


5 diapositivas
Business Executive Summary Report Presentation
Simplify your executive reporting with this 'Business Executive Summary Report' template, designed to present critical insights at a glance. This template streamlines complex data into digestible parts, ensuring clarity and impact in every slide. Perfect for executives and managers using PowerPoint, Keynote, and Google Slides.


7 diapositivas
Job Title Infographic
The slides displayed offer a range of stylish and clear title designs for various business and creative presentations, ideal for introducing key concepts and sections within a professional document or presentation. Each slide is crafted to represent themes such as annual reports, digital strategies, and project retrospectives, as well as specialized areas like web design, strategic planning, and SEO. The designs incorporate modern aesthetics with clean lines, bold color palettes, and minimalist graphic elements, ensuring that the titles are not only eye-catching but also effectively convey the subject matter. This variety allows presenters to choose a slide that best fits the tone and topic of their presentation, making each section distinct and engaging for the audience. These slides are perfect for professionals looking to present complex information in an accessible and visually appealing format.


5 diapositivas
Movie Ages and Eras Infographics
Movies can be categorized into different ages and eras based on various factors such as technological advancements, storytelling techniques, cultural influences, and industry trends. This infographic template explores the different ages and eras in the history of cinema. It provides an overview of significant periods and movements in filmmaking, allowing viewers to understand the evolution and impact of movies over time. This template is perfect for film enthusiasts, students of film studies, or anyone interested in exploring the history and evolution of cinema. Compatible with Powerpoint, Keynote, and Google Slides.


4 diapositivas
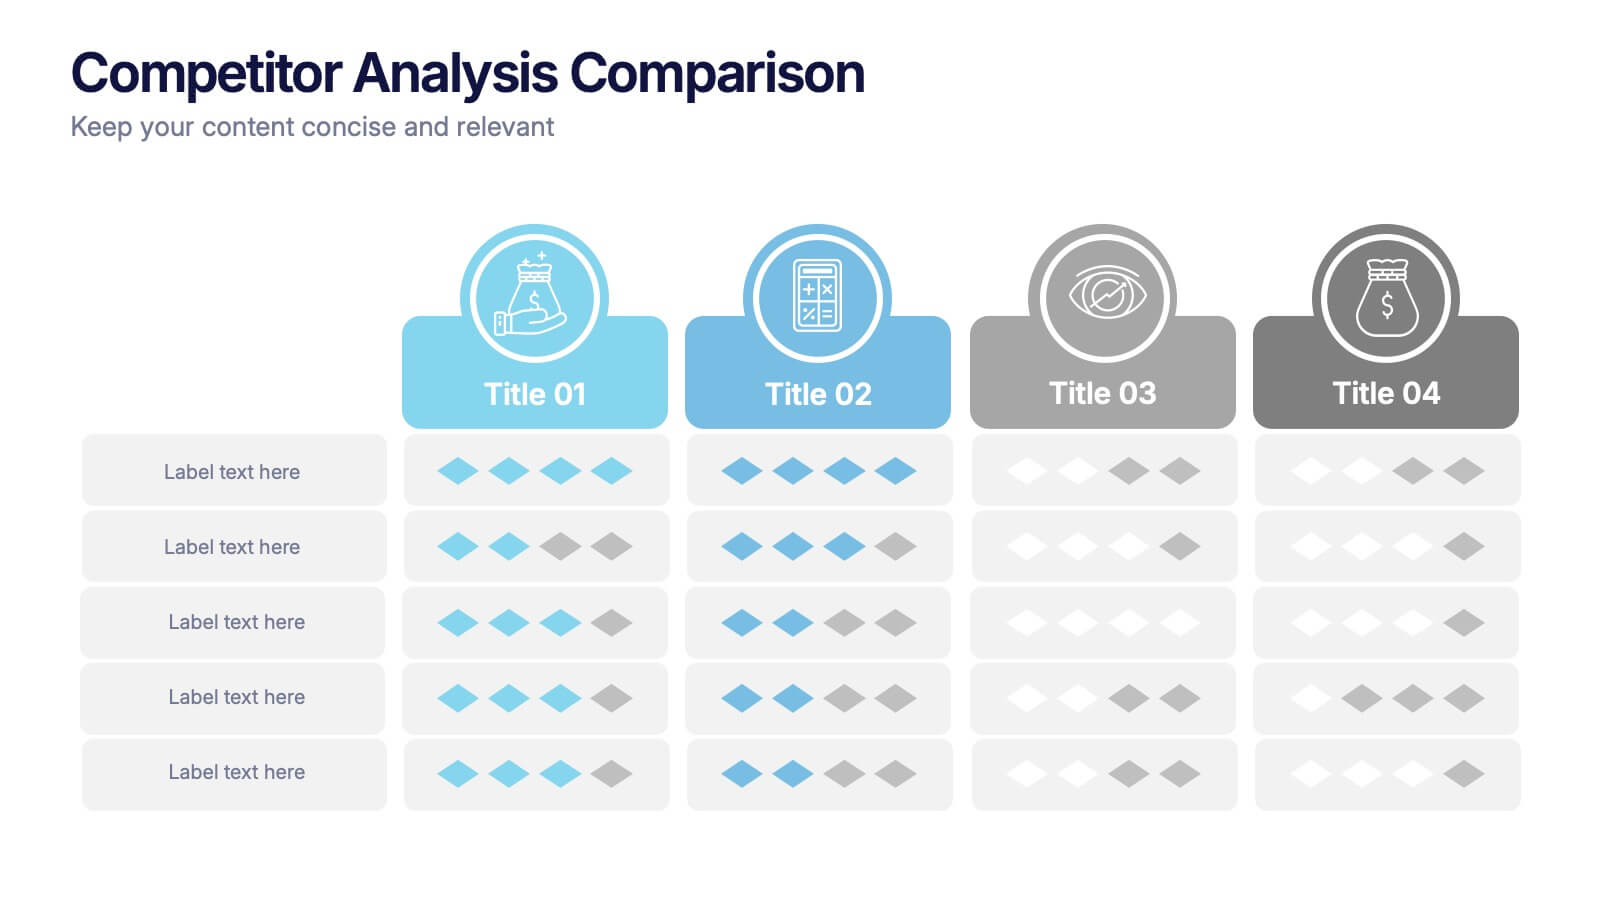
Competitor Analysis Comparison Presentation
Quickly evaluate strengths and weaknesses across your market landscape with this Competitor Analysis Comparison Presentation. Featuring clean tables, icons, and rating visuals, it's ideal for highlighting where your brand stands out. Fully editable in PowerPoint, Keynote, and Google Slides.