


Características


¿Tienes alguna pregunta?
Recomendar


8 diapositivas
Customer Demographics Target Market Presentation
Dive into the depths of your audience with the "Customer Demographics Target Market" presentation template. Ideal for marketers and businesses aiming to understand and segment their customer base effectively, this template offers a vibrant, clear visual breakdown of demographic data. Ensure your strategic communications resonate with the right crowd, with compatibility for PowerPoint, Keynote, and Google Slides.


4 diapositivas
User Experience Flow Presentation
Bring clarity and color to every stage of your user experience process with this clean, structured presentation. It helps you outline steps, explain interactions, and highlight key insights in a visually intuitive flow. Easy to customize and fully compatible with PowerPoint, Keynote, and Google Slides.


6 diapositivas
Office Scenes Season Infographic
"Office Scenes" typically refer to the environments and activities that take place within an office setting. This Infographic template is a visual representation that showcases different scenarios and activities that commonly take place in an office environment. This type of infographic can be used to illustrate various aspects of office life, work culture, and interactions. This template provide insights into the day-to-day activities and culture of your workplace. Fully customizable and compatible with Powerpoint, Keynote, and Google Slides. Include your company logo or branding elements in the infographic.


6 diapositivas
Root Cause Investigation Framework Presentation
Uncover the "why" behind your challenges with the Root Cause Investigation Framework Presentation. Designed around the classic fishbone (Ishikawa) diagram, this slide helps teams visually identify and organize contributing factors across multiple categories. With editable sections and bold color coding, it’s ideal for quality management, Six Sigma, and process improvement. Compatible with PowerPoint, Keynote, and Google Slides.


21 diapositivas
Zephyrkin Product Roadmap Presentation
Outline your product’s journey with this roadmap template, covering essential elements like target market, customer pain points, competitive analysis, and marketing strategy. Showcase your product's features, unique value proposition, and development process. Ideal for PowerPoint, Keynote, and Google Slides, this template supports professional product presentations.


4 diapositivas
Internal Meeting Agenda and Notes Presentation
Stay organized and aligned with the Internal Meeting Agenda and Notes presentation template. Designed for clarity and productivity, this layout includes dedicated sections for meeting topics, notes, action items (to-do list), brainstorming, and extra comments. Ideal for team check-ins, project syncs, and internal reviews. Fully editable and compatible with PowerPoint, Keynote, and Google Slides.


21 diapositivas
Riverlyn Artist Portfolio Template Presentation
Showcase your creative journey with this dynamic portfolio template, crafted for artists and creators seeking to captivate their audience. Highlight your philosophy, style, and key projects with a visually engaging design that reflects your artistic identity. Share your creative process and collaborations to provide deeper insights into your work. This template includes sections for client testimonials, services offered, and pricing details, making it an excellent choice for both professional presentations and personal branding. Fully customizable and compatible with PowerPoint, Google Slides, and Keynote, it offers seamless adaptability to meet your unique needs. Ideal for artists aiming to leave a lasting impression!


6 diapositivas
Social Challenges Infographics
Address social challenges effectively with our Social Challenge infographic template. This template is fully compatible with popular presentation software like PowerPoint, Keynote, and Google Slides, allowing you to easily customize it to illustrate and communicate various social challenges and their solutions. The Social Challenge infographic template offers a visually engaging platform to outline the nature of social issues, their impact on communities, and strategies for addressing them. Whether you're an advocate, nonprofit organization, community leader, or simply interested in making a positive impact, this template provides a user-friendly canvas to create informative presentations and educational materials. Raise awareness and promote solutions with this SEO-optimized Social Challenge infographic template, thoughtfully designed for clarity and ease of use. Customize it to showcase specific social challenges, statistics, success stories, and calls to action, ensuring that your audience gains a comprehensive understanding of the issue at hand. Start crafting your personalized infographic today to contribute to positive change in society.


21 diapositivas
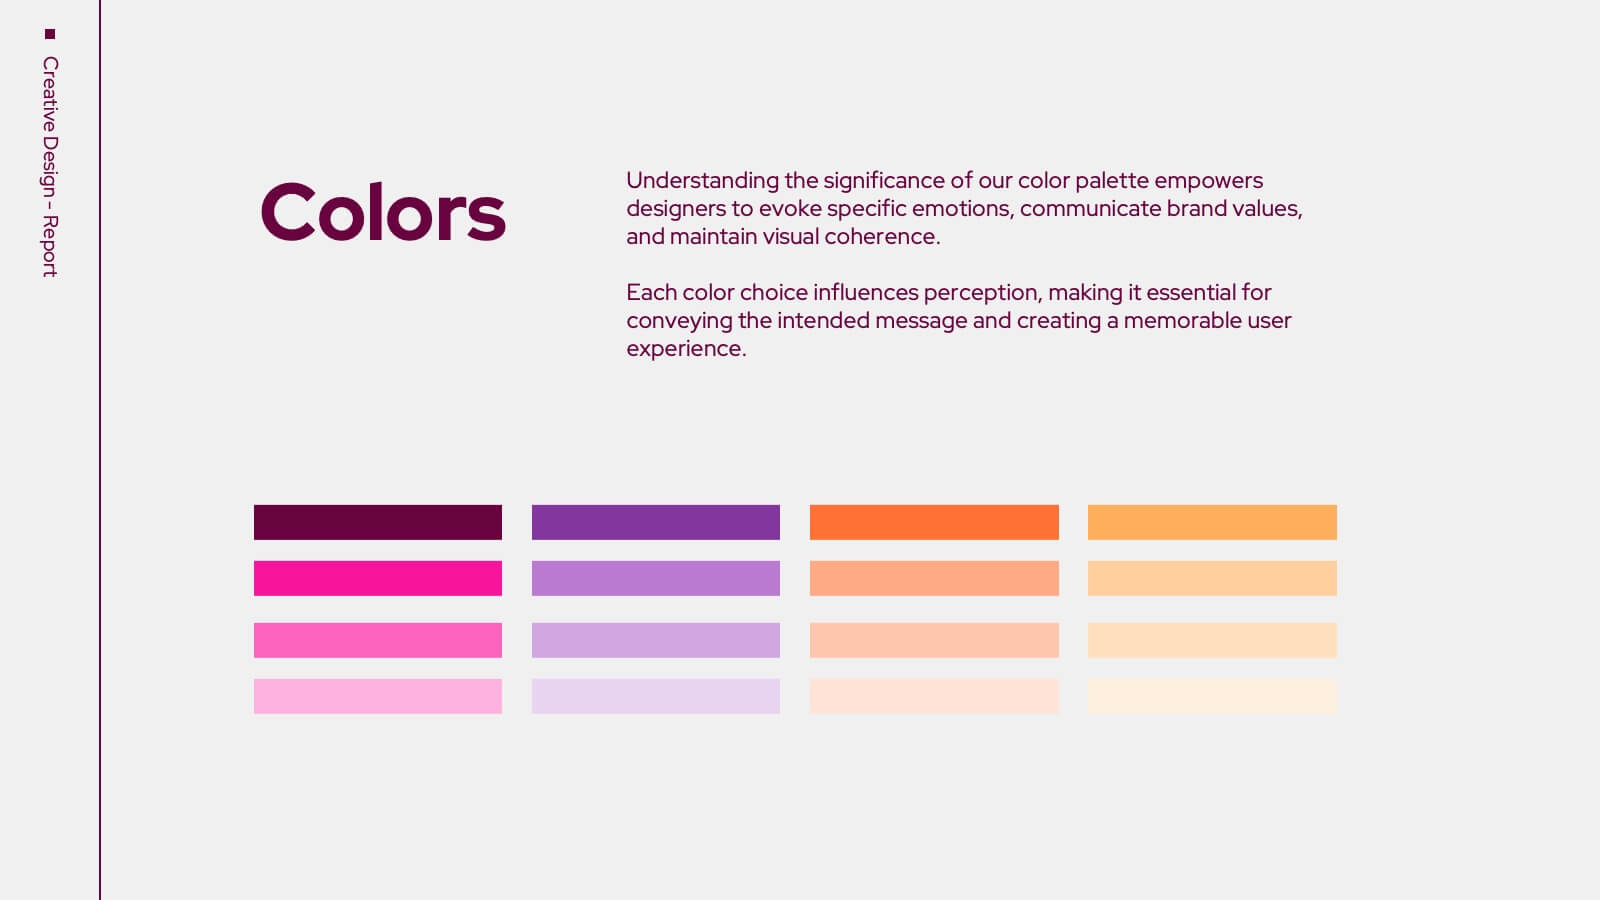
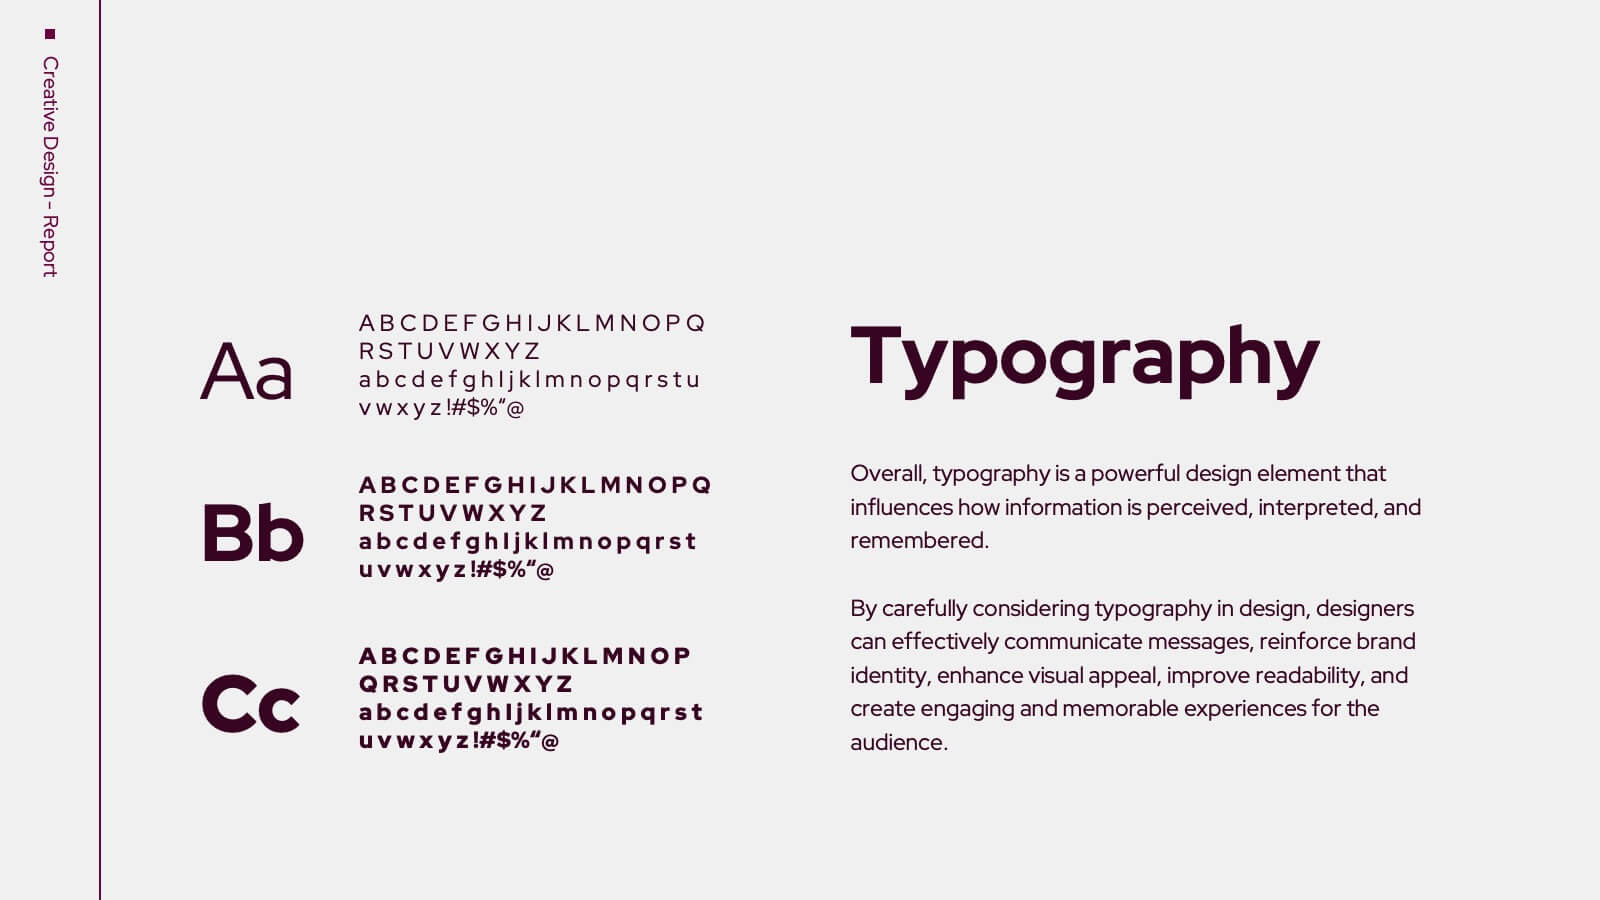
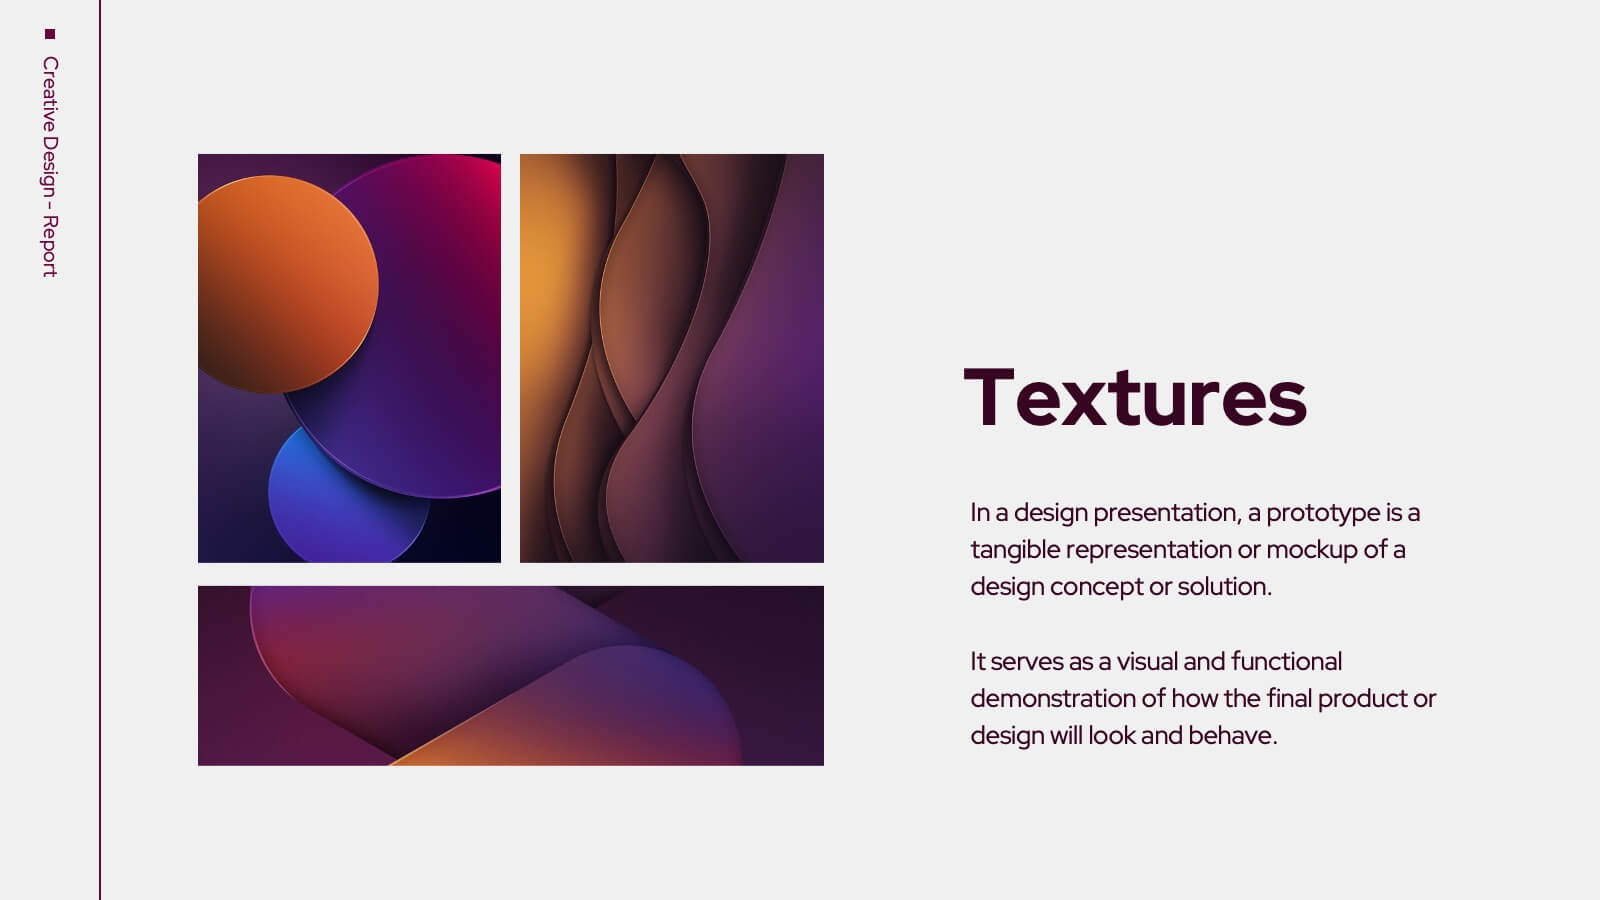
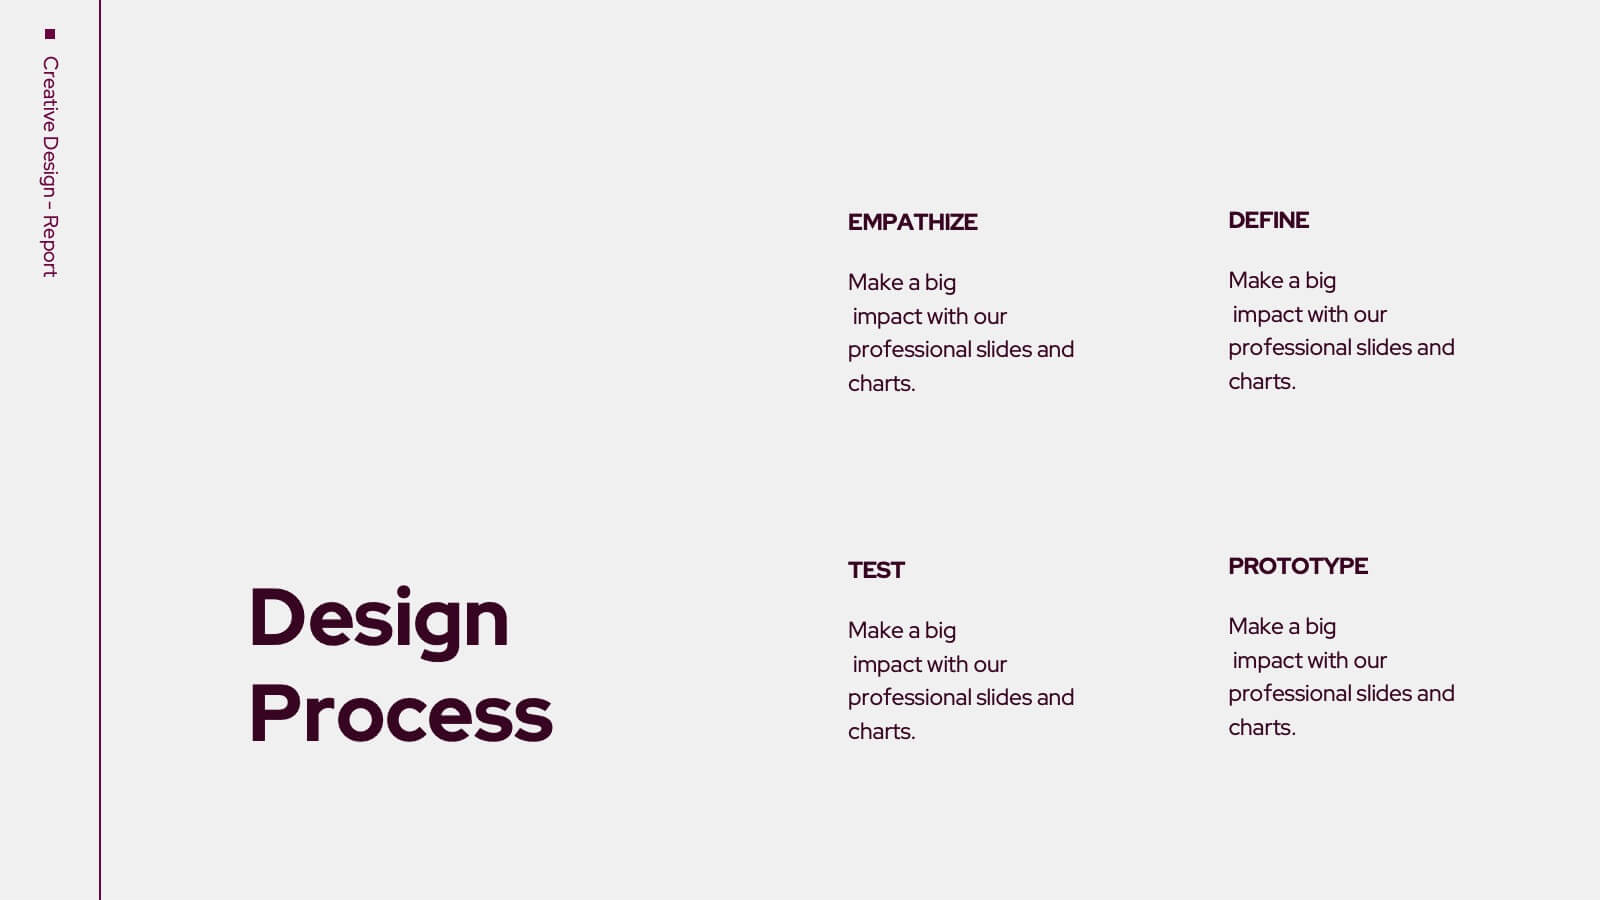
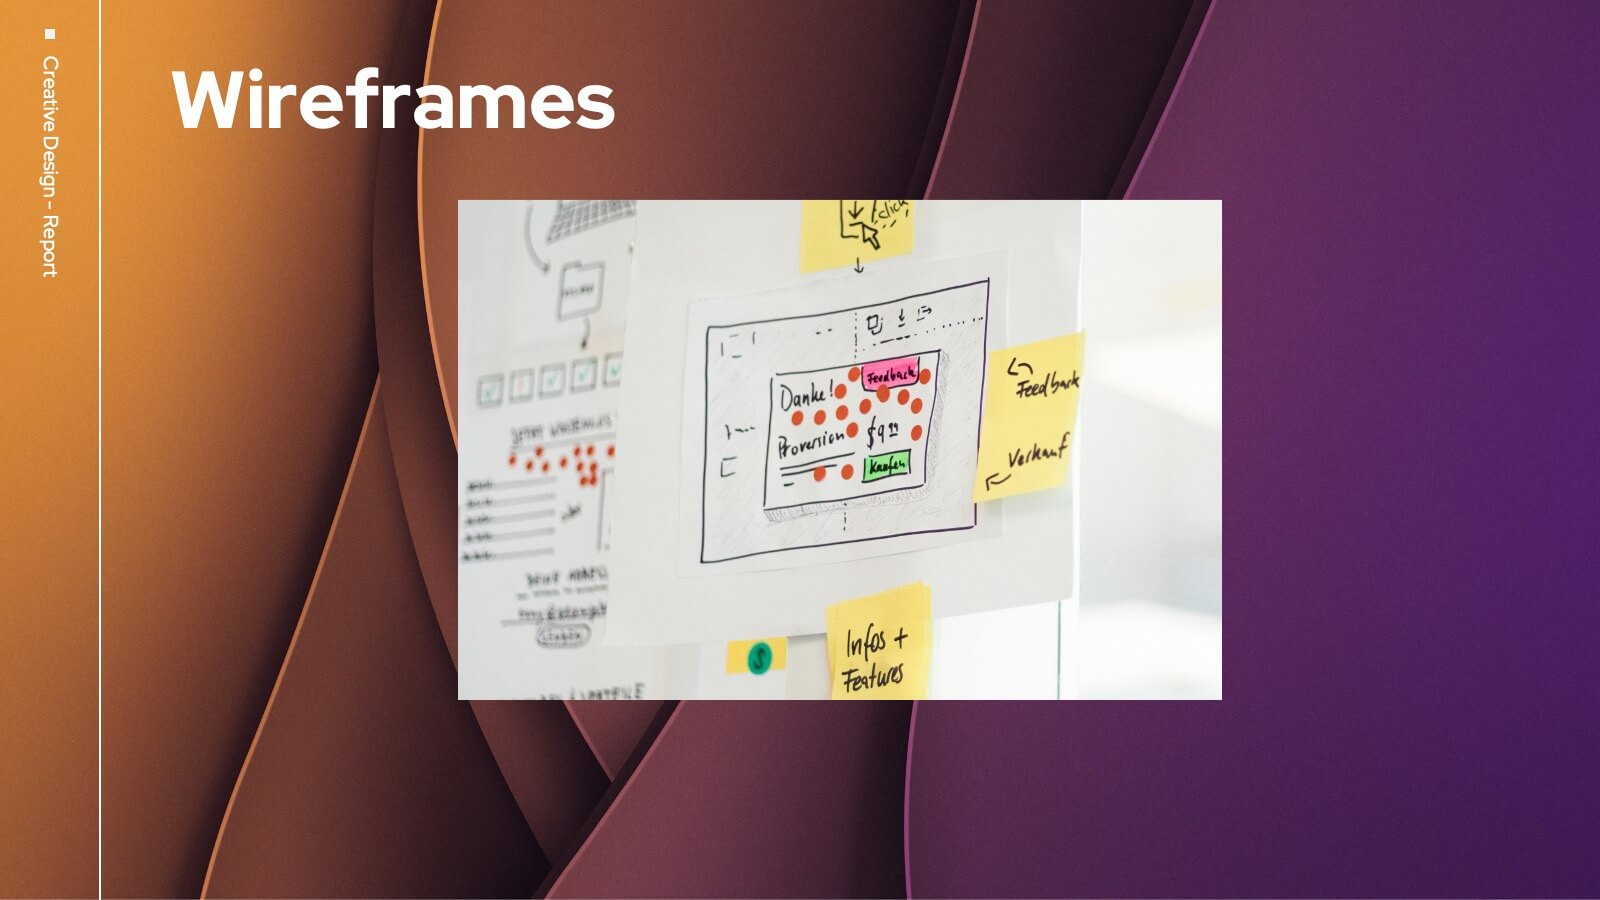
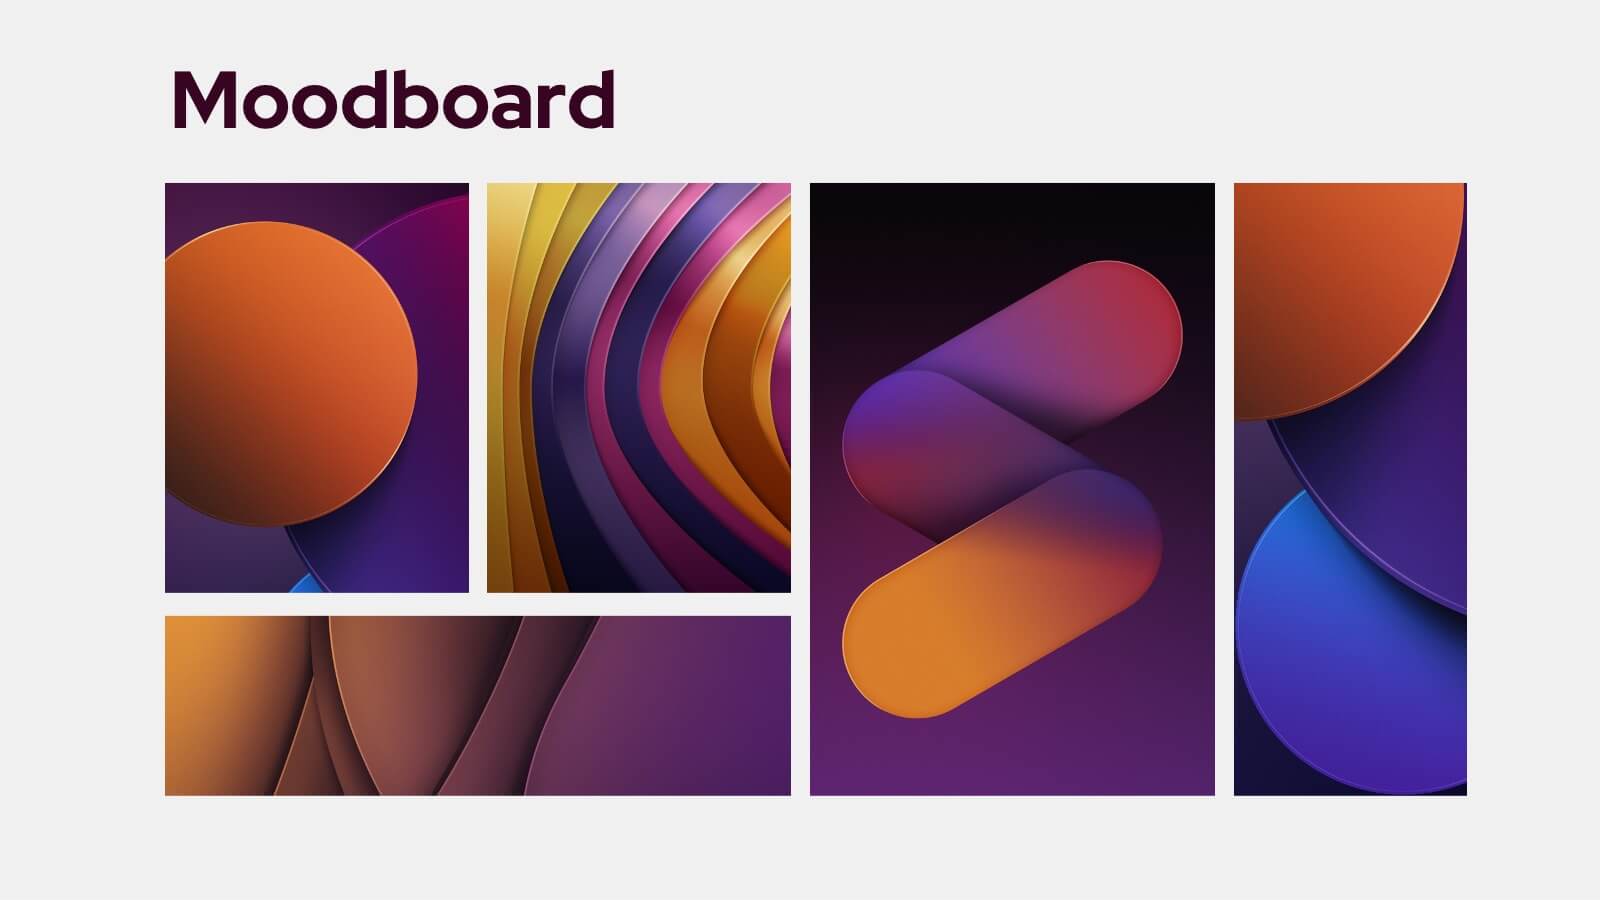
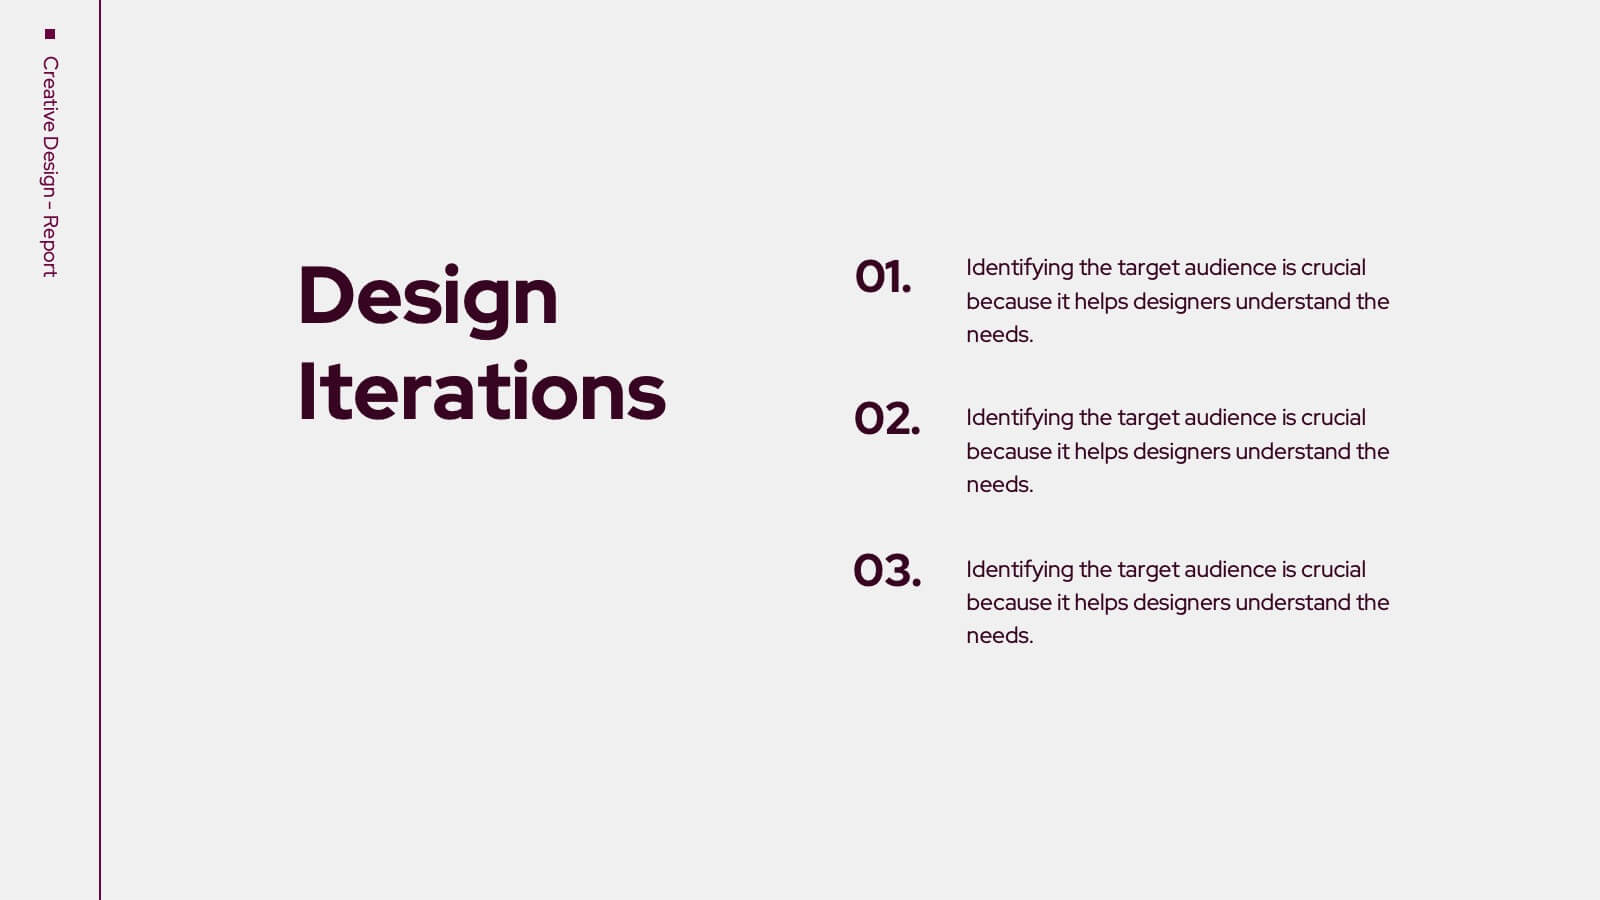
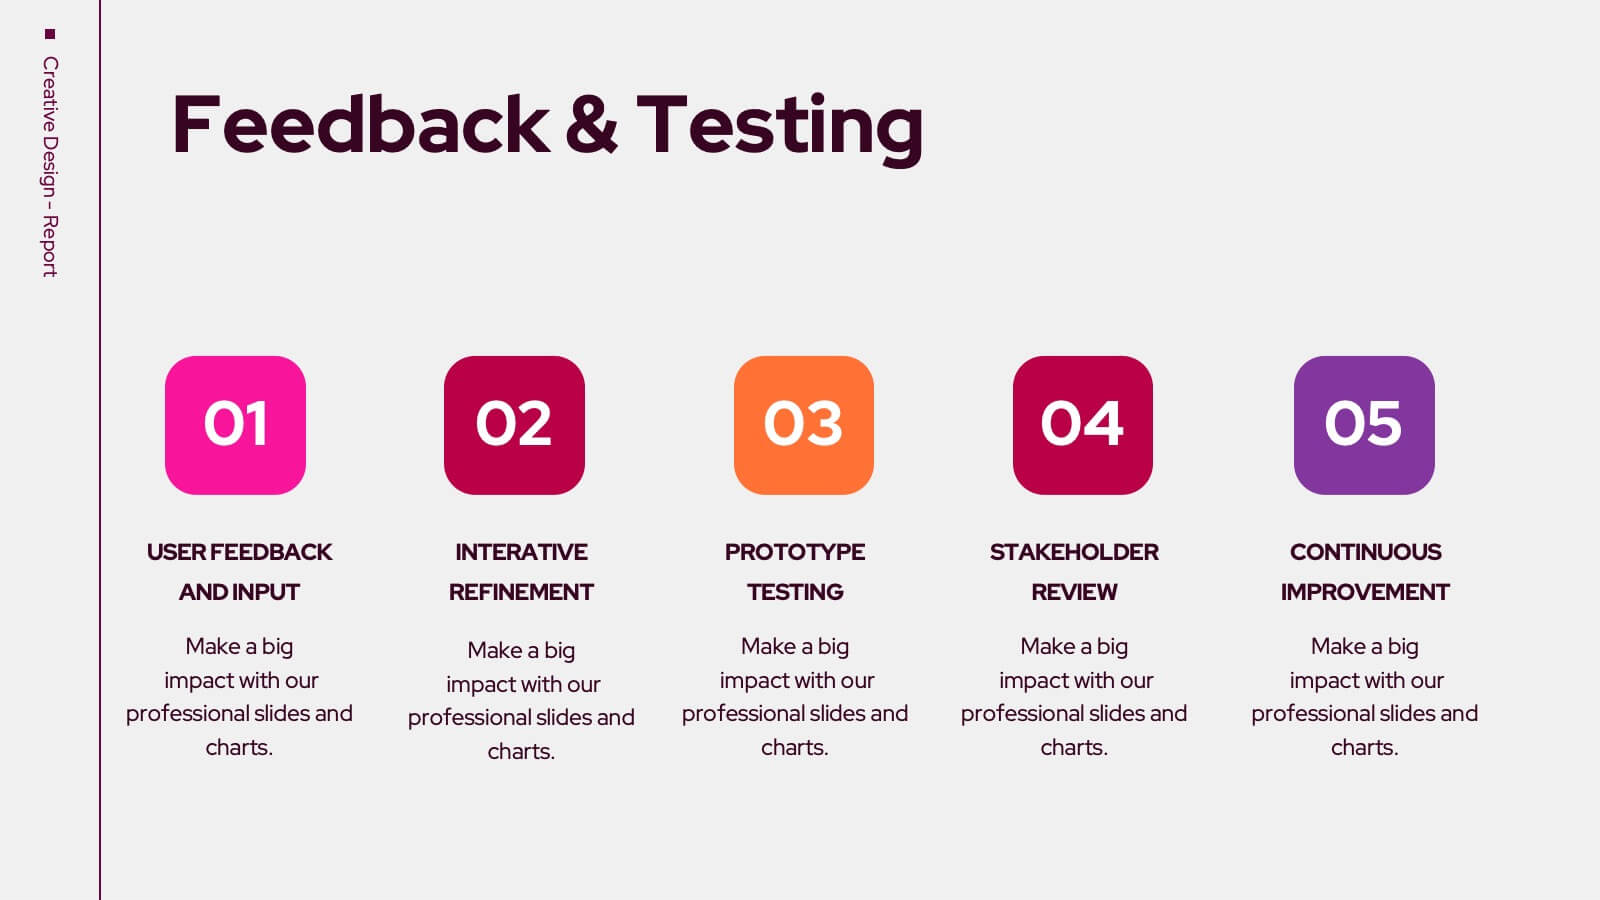
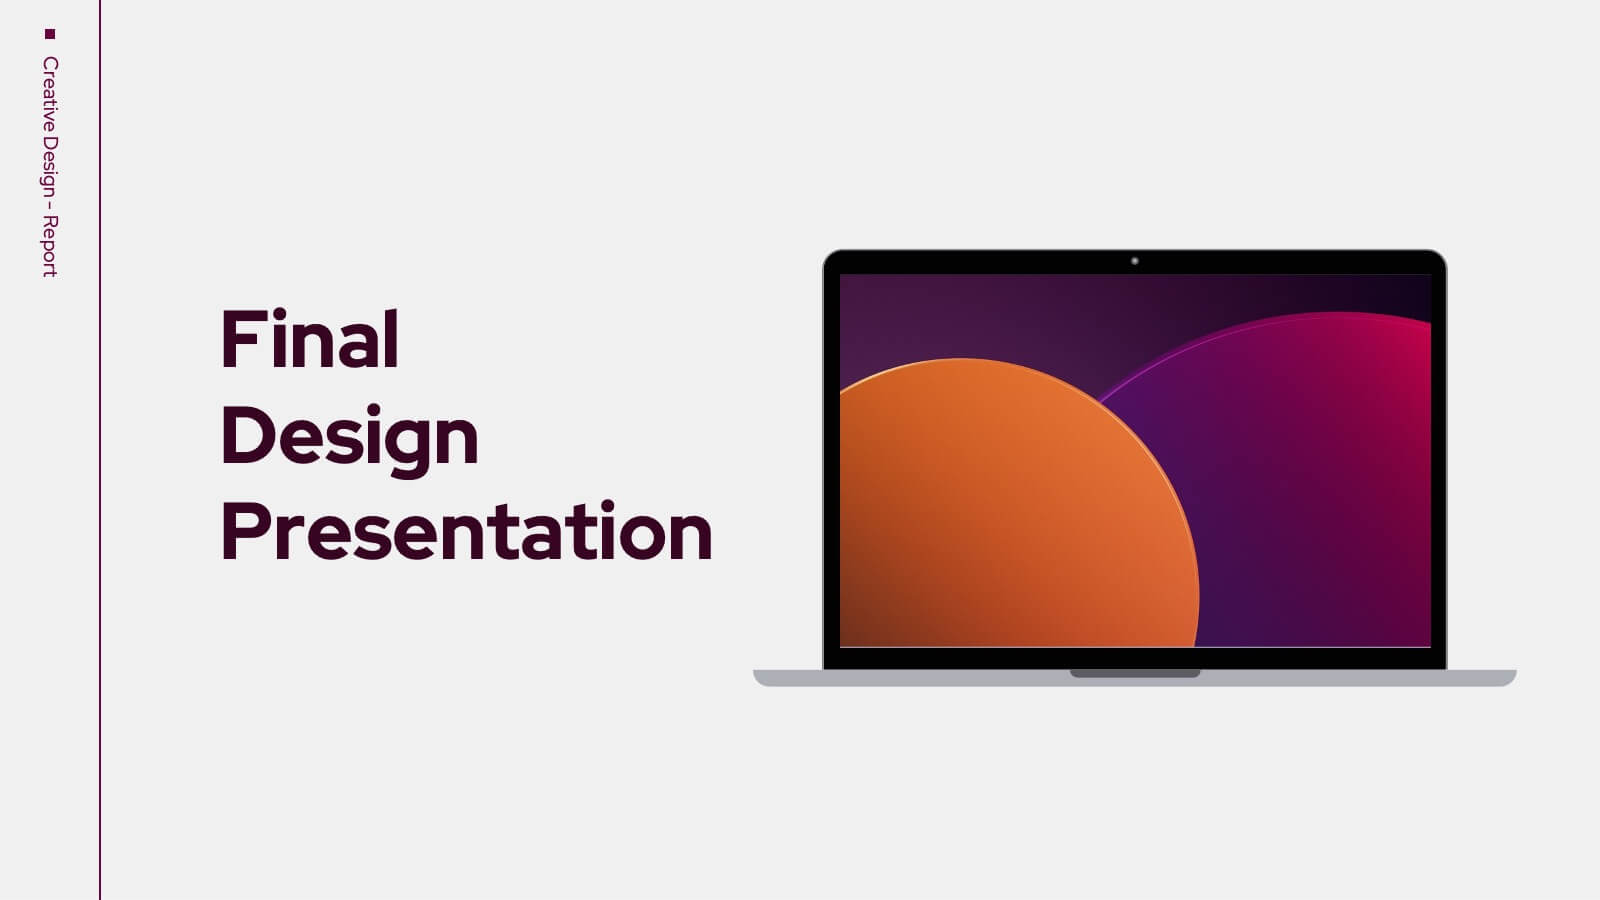
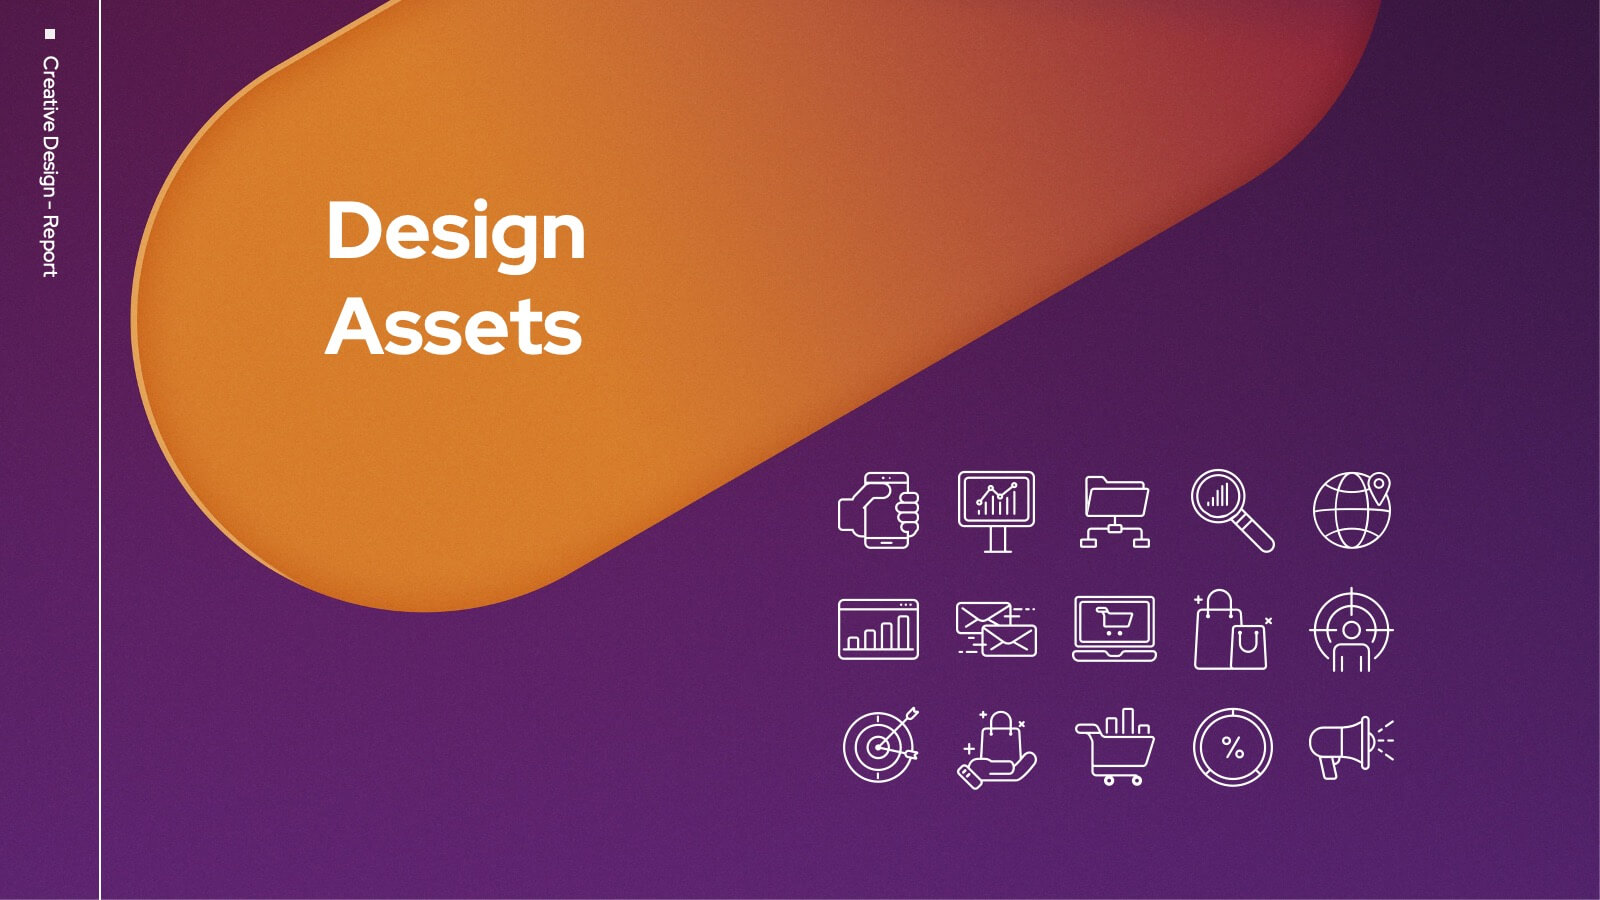
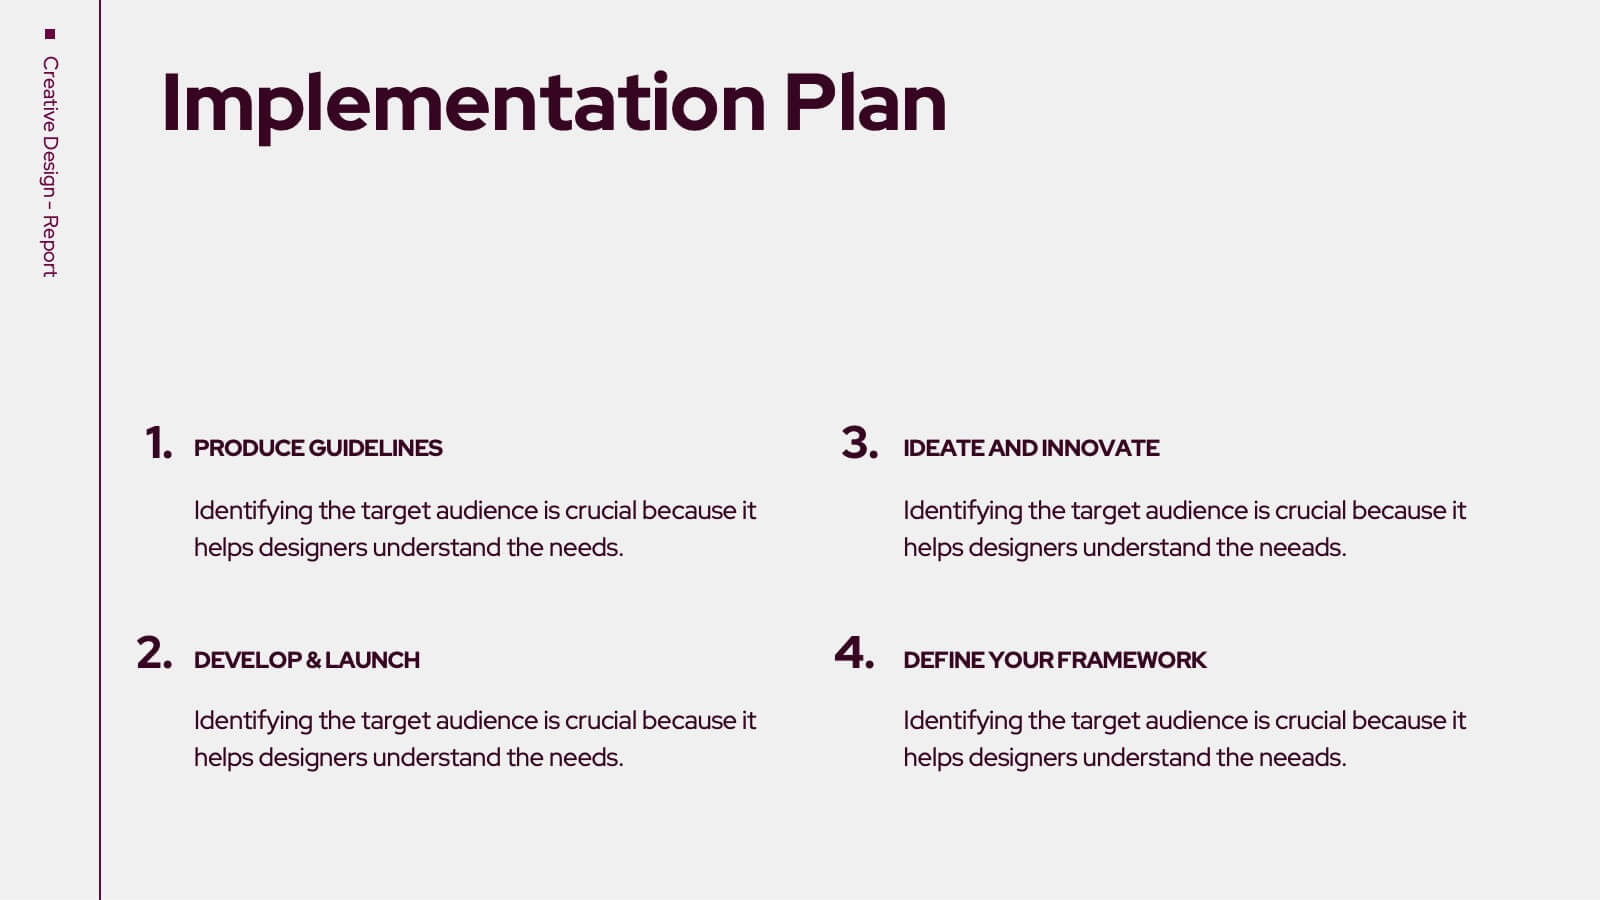
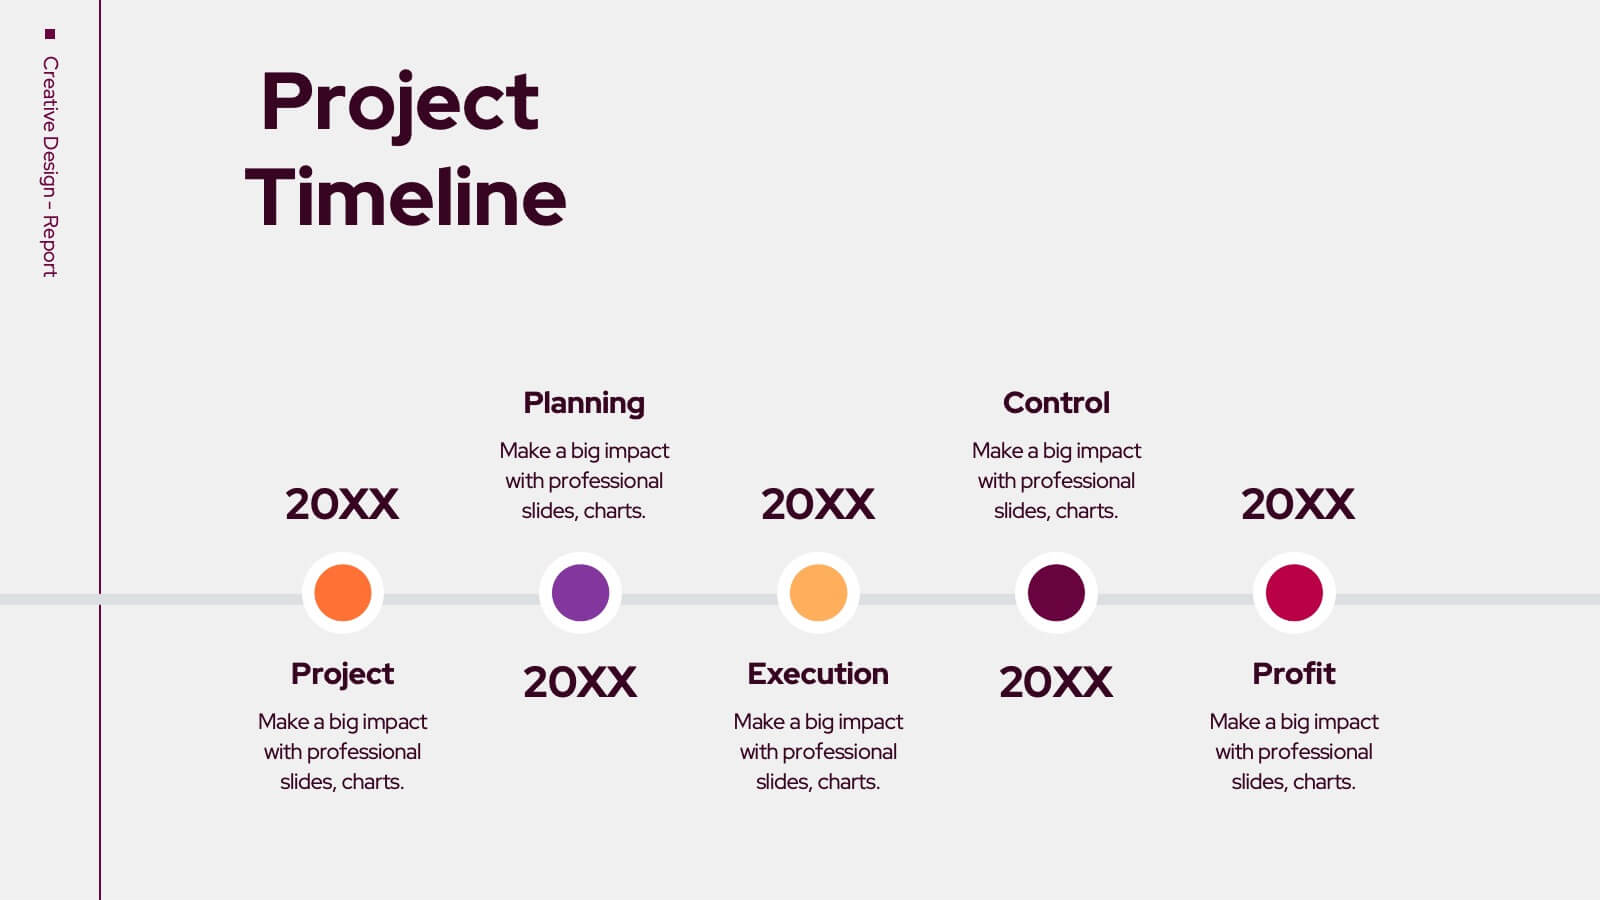
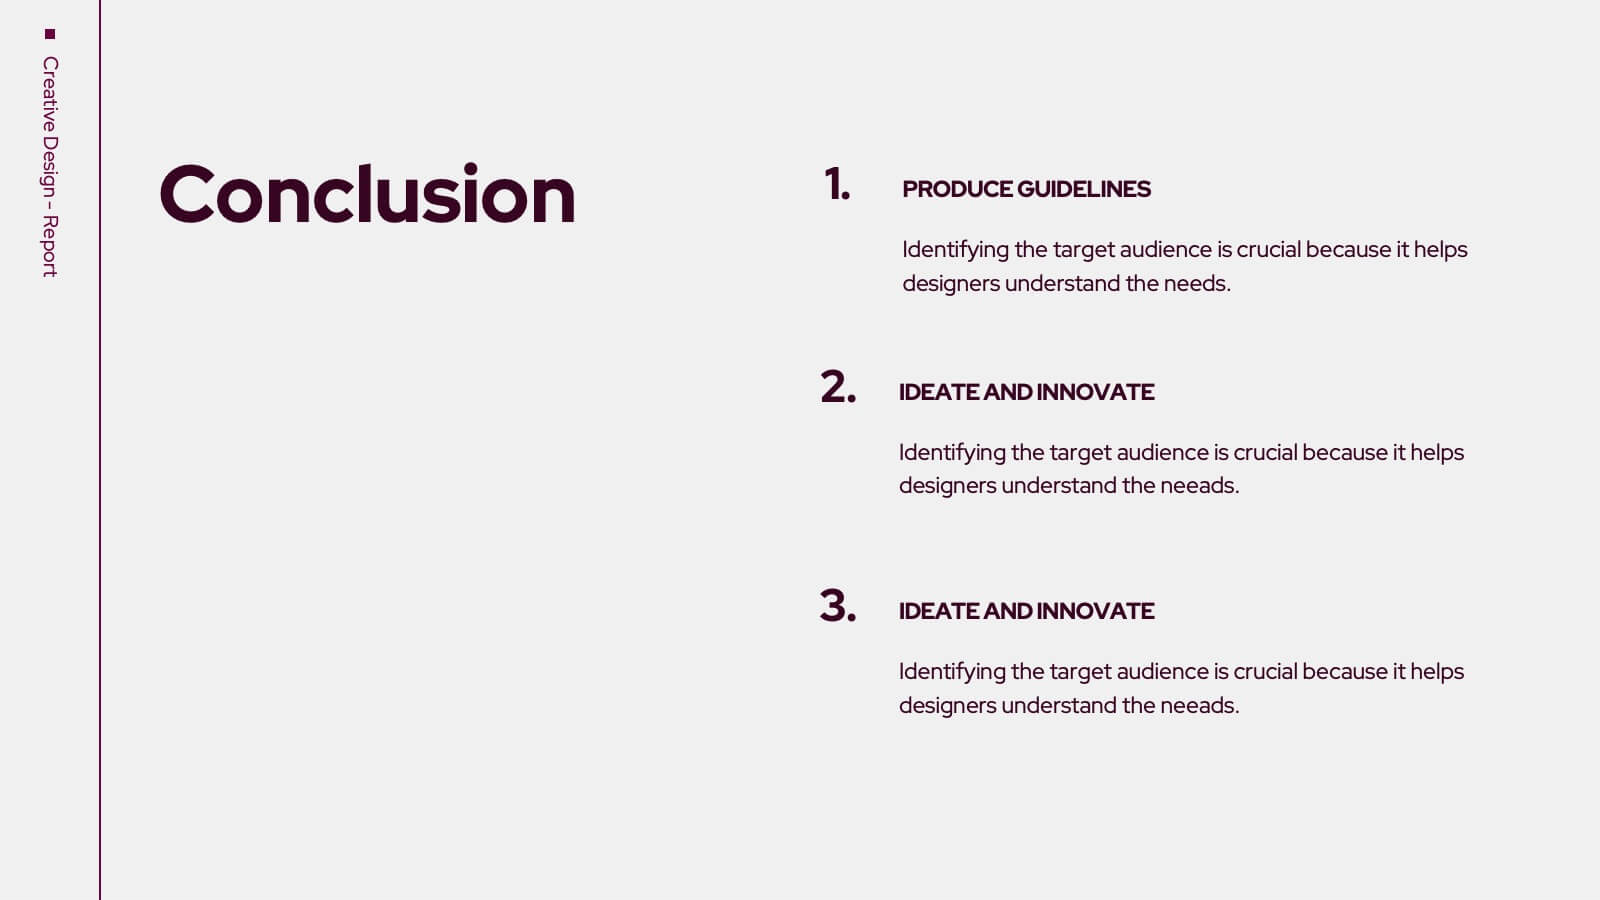
Trojan Creative Design Report Presentation
Unleash your creativity with this striking Trojan-inspired presentation template! Ideal for showcasing your design projects, this presentation enables you to highlight key concepts, inspirations, and visual elements effectively. Its engaging layout ensures your ideas shine through, captivating your audience. Compatible with PowerPoint, Keynote, and Google Slides for seamless presentations.


5 diapositivas
5G Wireless Technology Infographics
5G technology refers to the fifth generation of wireless communication technology. These infographic templates are designed to showcase the key features, benefits, and impact of 5G technology. These are perfect for technology enthusiasts, professionals, educators, or anyone looking to explain the concept and advancements of 5G. Educate and inform your audiences about the concept, benefits, and applications of 5G technology with these infographics. It is fully customizable and has attention-grabbing design elements making it easy to create a compelling presentation about the advancements and potential of 5G technology.


5 diapositivas
Empathy to Ideation Process Framework Presentation
Visualize the journey from understanding user needs to generating innovative ideas with the Empathy to Ideation Process Framework Presentation. This slide features a side-profile silhouette and five clear, horizontal stages, each representing a key step in design thinking. Ideal for innovation workshops, UX strategy sessions, or educational use. Fully editable in Canva, PowerPoint, Google Slides, and Keynote.


7 diapositivas
Tables of Content Infographic Presentation Template
A table of contents infographic can serve as a visual representation of the content outline and help to convey the overall structure and organization of the information. This template displays the headings and subheadings of the document, along with the page numbers or slide numbers, in an easy-to-follow format. The purpose of our table of contents infographic template is to provide an overview of the content and help you navigate the presentation more efficiently. It is often used in academic papers, reports, magazines, and books, and can also be used in digital documents and presentations.


7 diapositivas
North America Population Infographic Presentation
North America is a continent located in the northern hemisphere of the Earth, bordered by the Pacific Ocean to the west. It includes countries such as the United States, Canada, Mexico, and several others in the Caribbean and Central America. This template can be a powerful tool to communicate information about the continent in an informative and engaging way. This can help people understand and appreciate the diversity and complexity of North America, and can be used for a variety of purposes, from education to marketing. This template is compatible with Powerpoint, Keynote and Google Slides.


7 diapositivas
Security Service Infographic Presentation
Security is the practice of protecting people, information, and assets from harm or damage. It is essential for compliance, business continuity, and protecting an organization's reputation. This template is designed to help you showcase or discuss security services, products or any other topic related to this. This template contains security graphics, and you can easily add your logo or icon to make the template more fun and eye catchy. This template allows you to customize the slides with any color scheme that suits your brand and communicate important features of your business.


7 diapositivas
5G Infographic Presentation Template
A 5G infographic is data related to the 5th generation of mobile telecommunications technology. This infographic template is an engaging way to display facts and figures, and attract attention from a wide audience. The main purpose of our 5G infographic template is to help you educate others about the new technology and its capabilities, and to help promote understanding of 5G. The information presented in this infographic can range from details, such as the differences between 5G and previous generations of mobile networks, and the benefits and potential applications of 5G.


3 diapositivas
Organized Bullet Point Summary Presentation
Present key facts clearly with the Organized Bullet Point Summary Presentation. Designed for structured communication, this layout visually breaks down your main points with icons, color blocks, and percentage highlights. Perfect for reporting metrics, comparing ideas, or prioritizing tasks. Fully editable in PowerPoint, Keynote, and Google Slides.


4 diapositivas
Project Development Progress Report Presentation
Track milestones with precision using this clean, data-driven slide designed for showcasing project completion percentages. Circular progress visuals paired with text blocks allow you to highlight achievements, issues, or next steps at a glance. Perfect for project managers, teams, and stakeholders. Fully editable in PowerPoint, Keynote, and Google Slides.