


Características


¿Tienes alguna pregunta?
Recomendar


10 diapositivas
Startup Executive Overview Template Presentation
Bring your startup’s big picture to life in one smart, visual swoop! This infographic presentation template helps you map out key insights and milestones in a clean, modern layout. Ideal for pitching ideas, aligning teams, or showcasing growth strategies. Fully compatible with PowerPoint, Keynote, and Google Slides for easy editing.


26 diapositivas
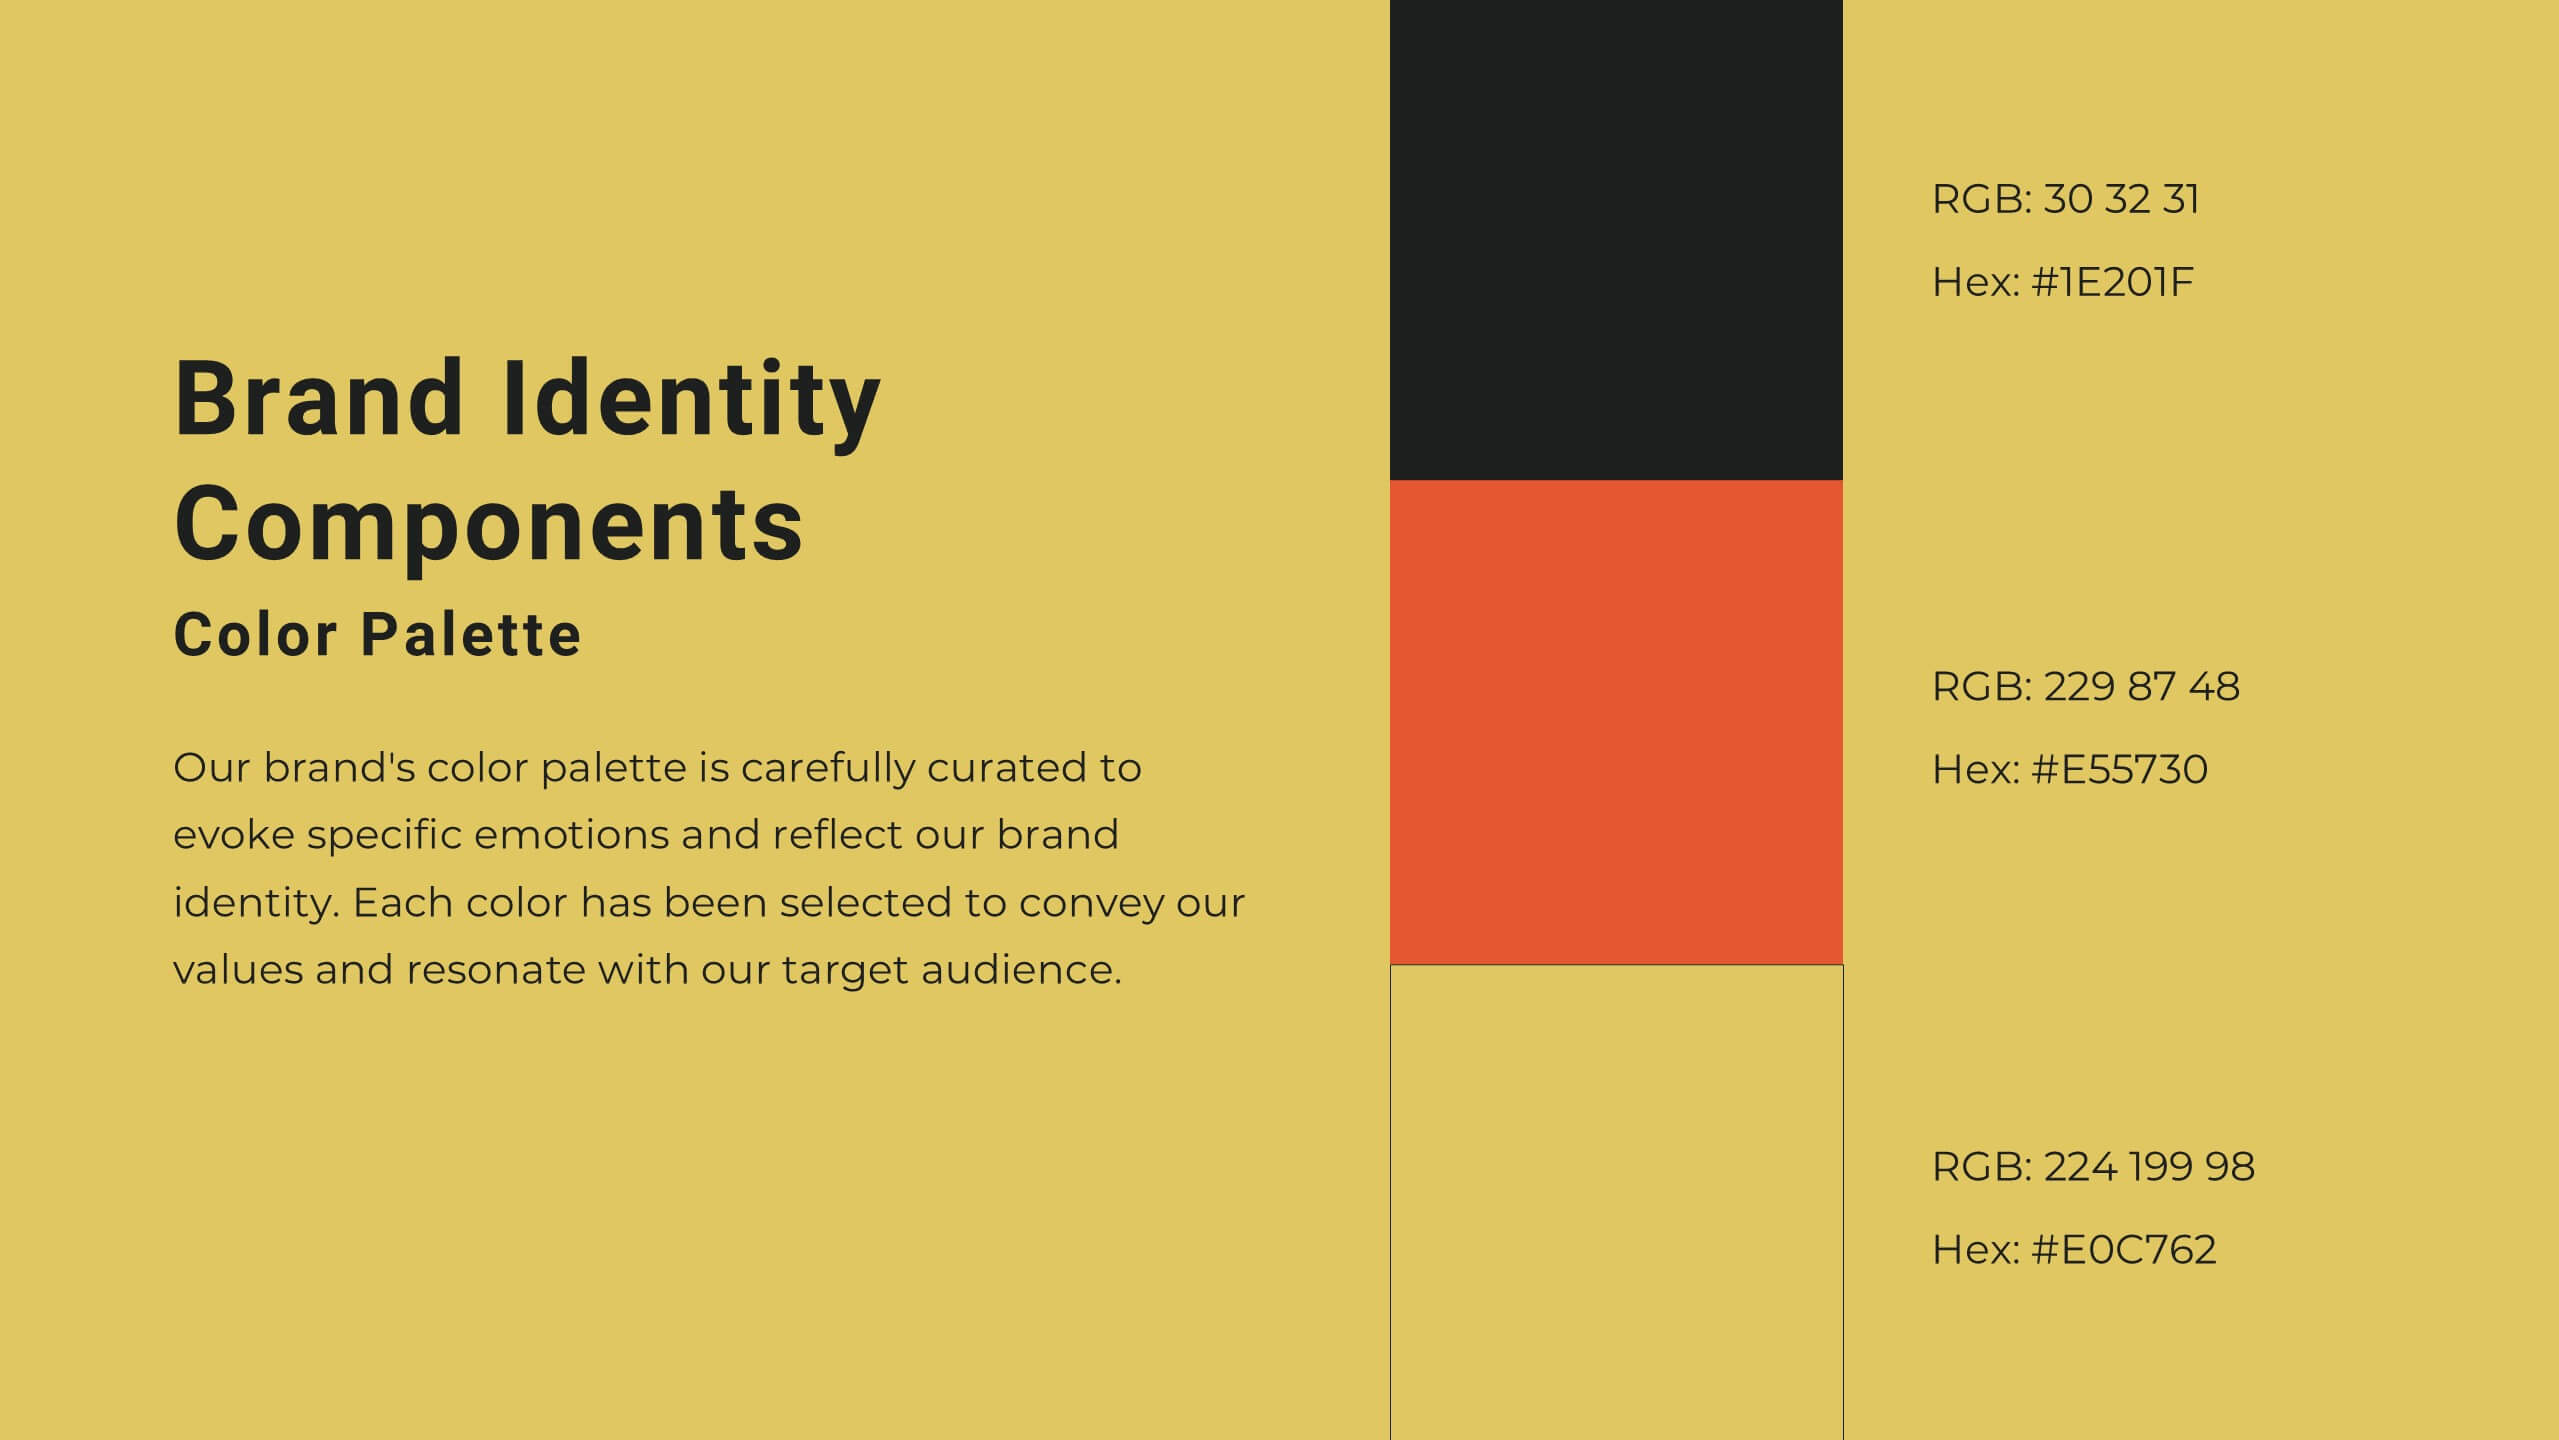
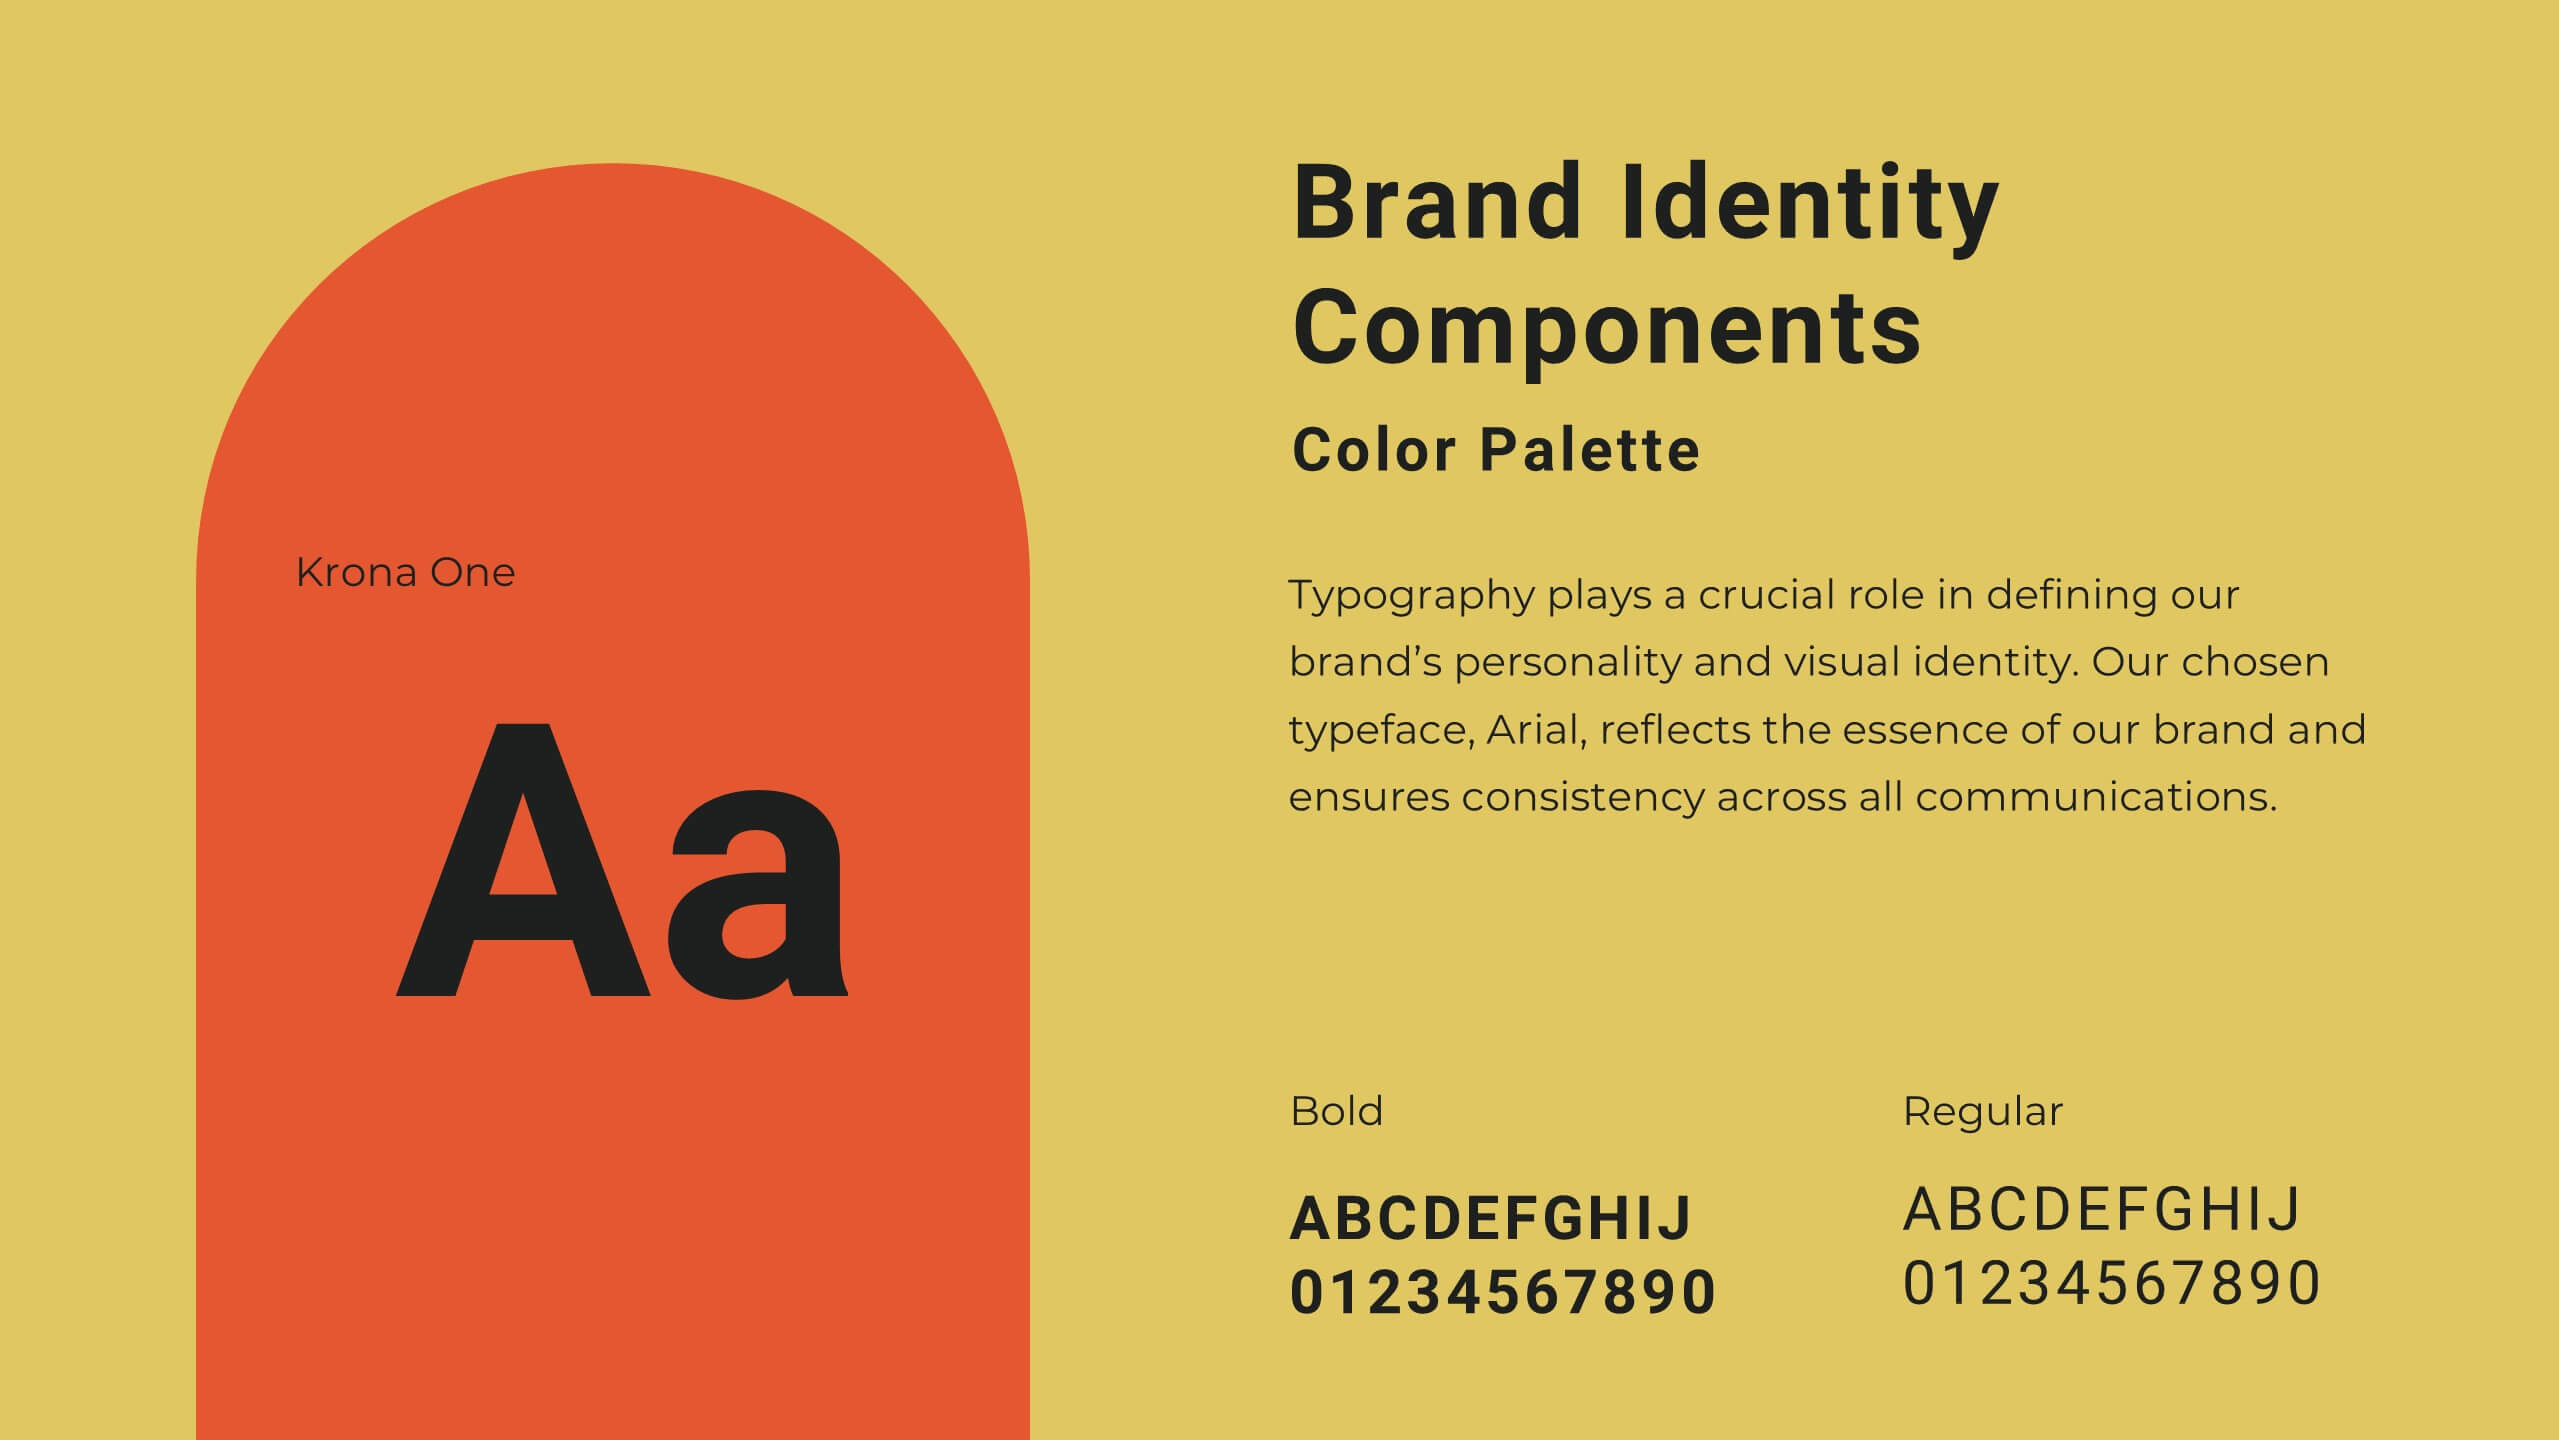
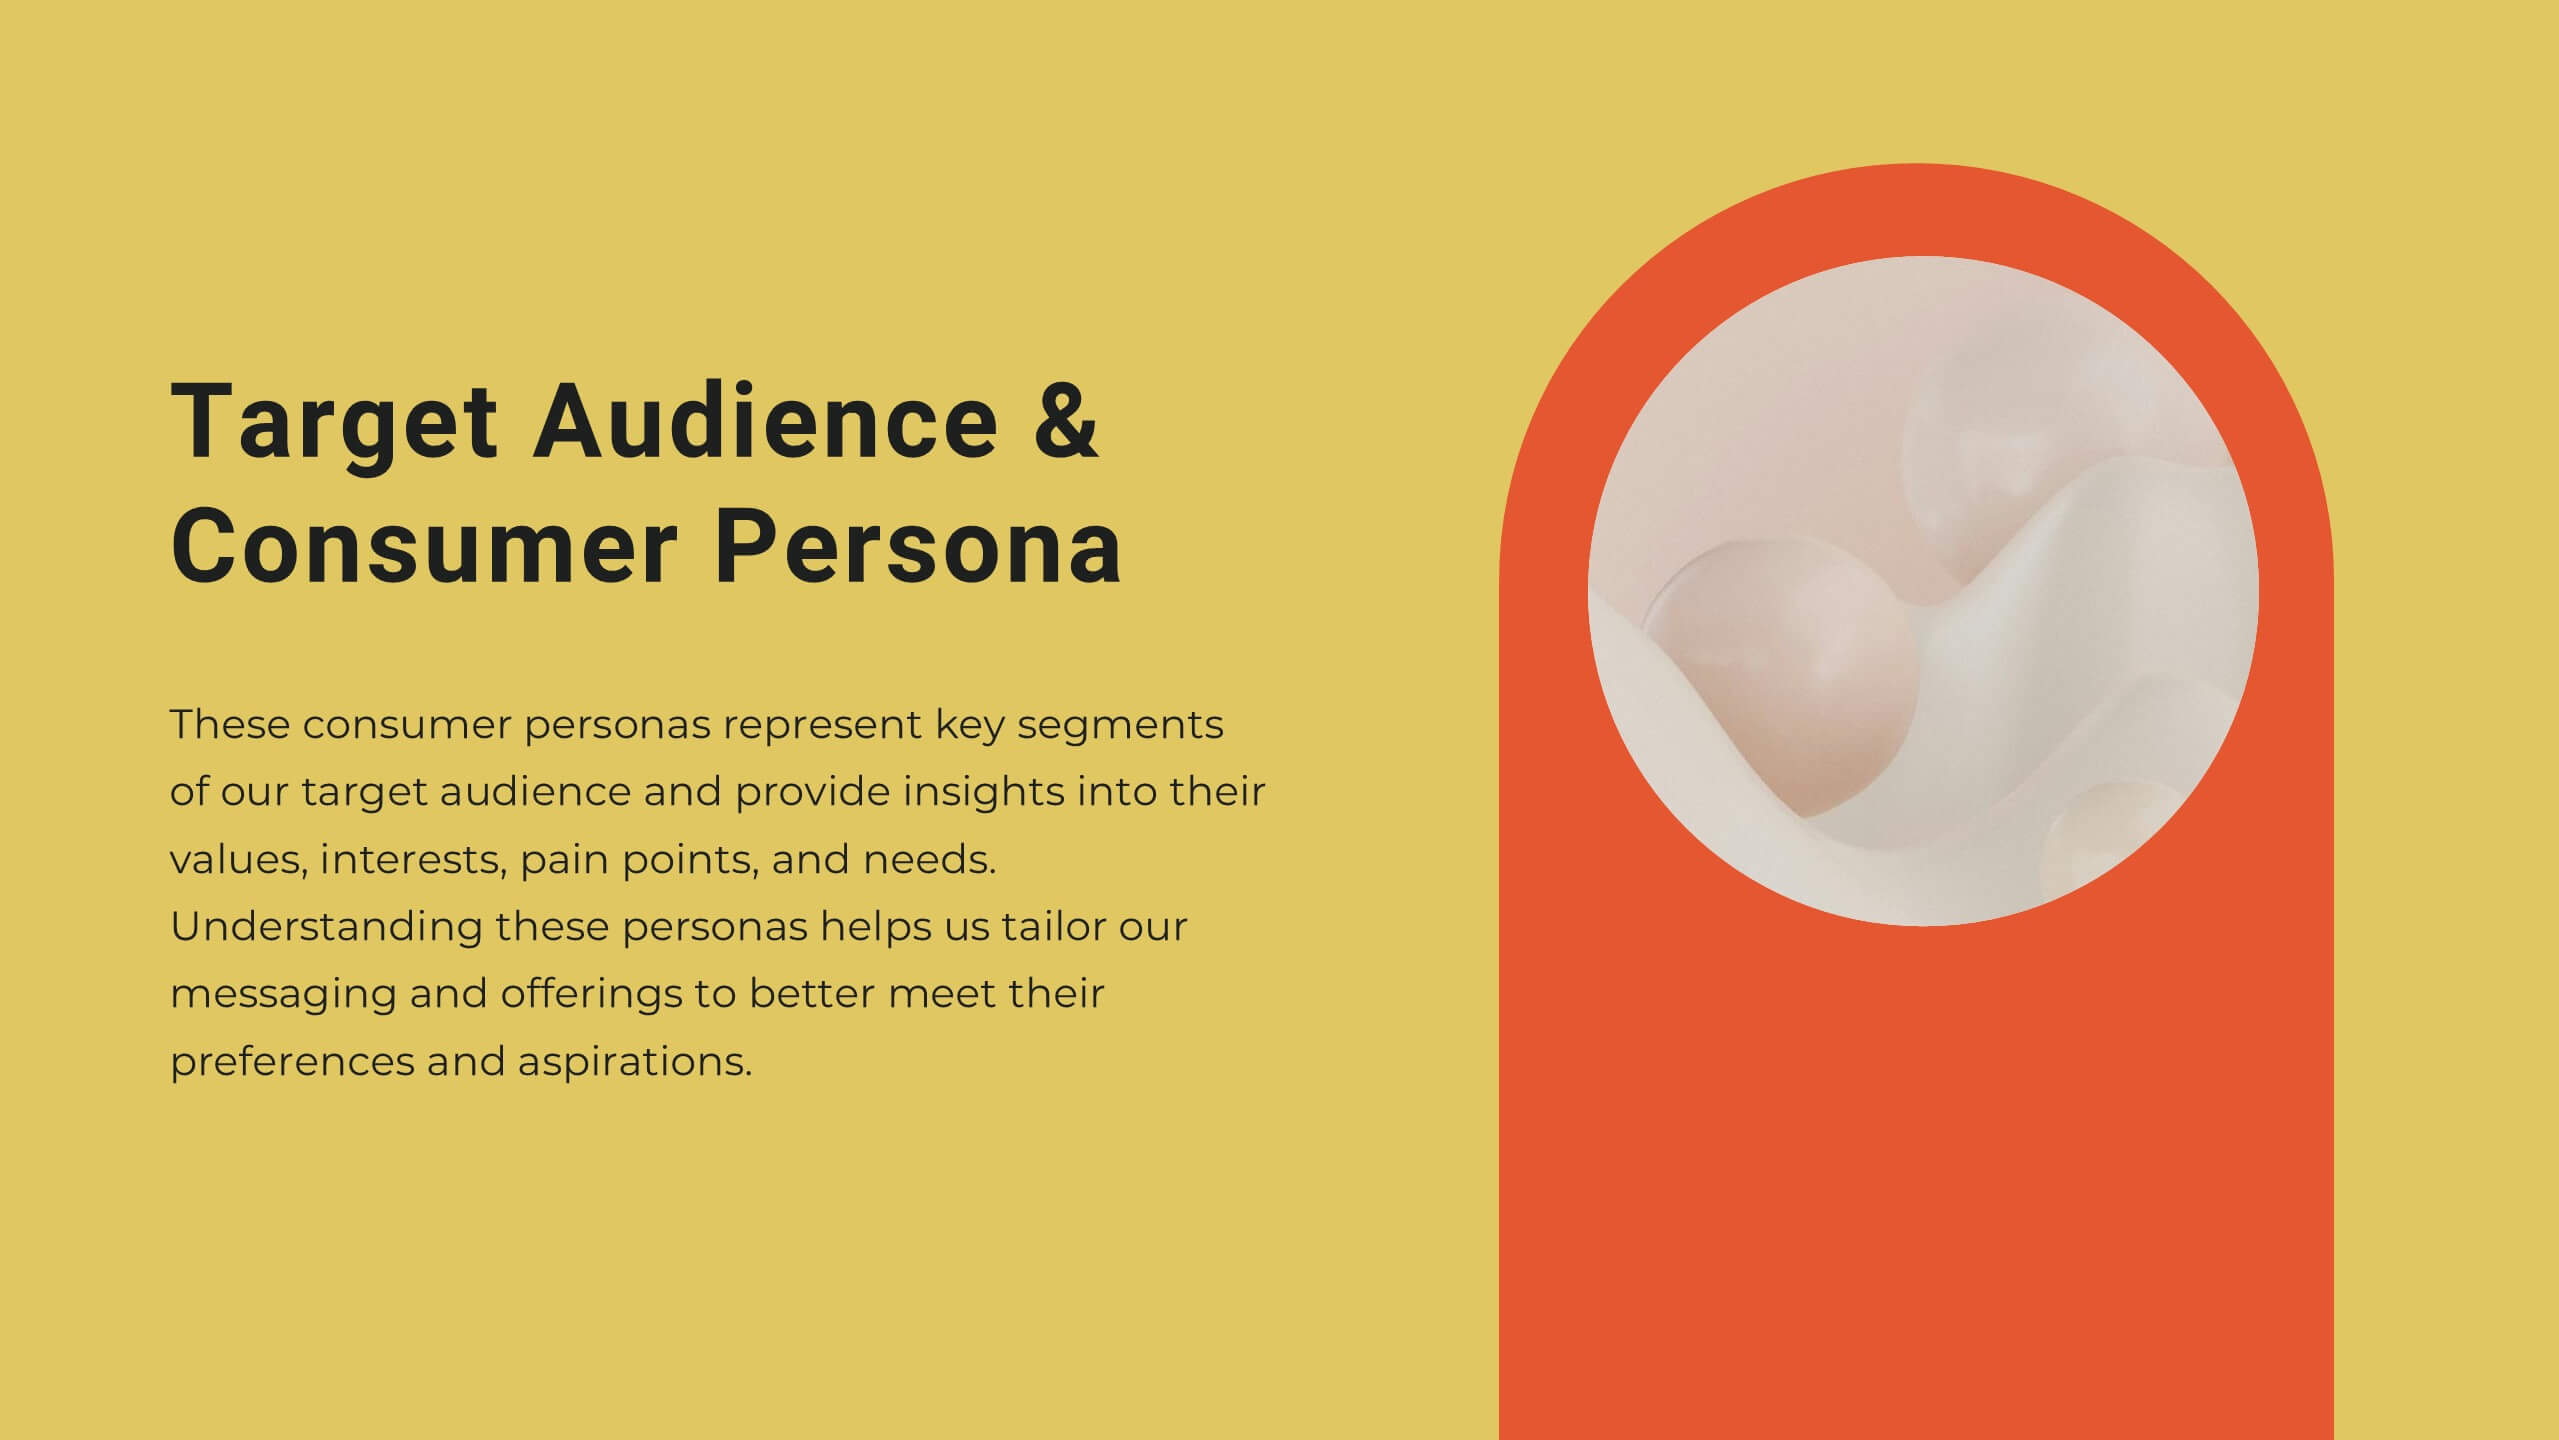
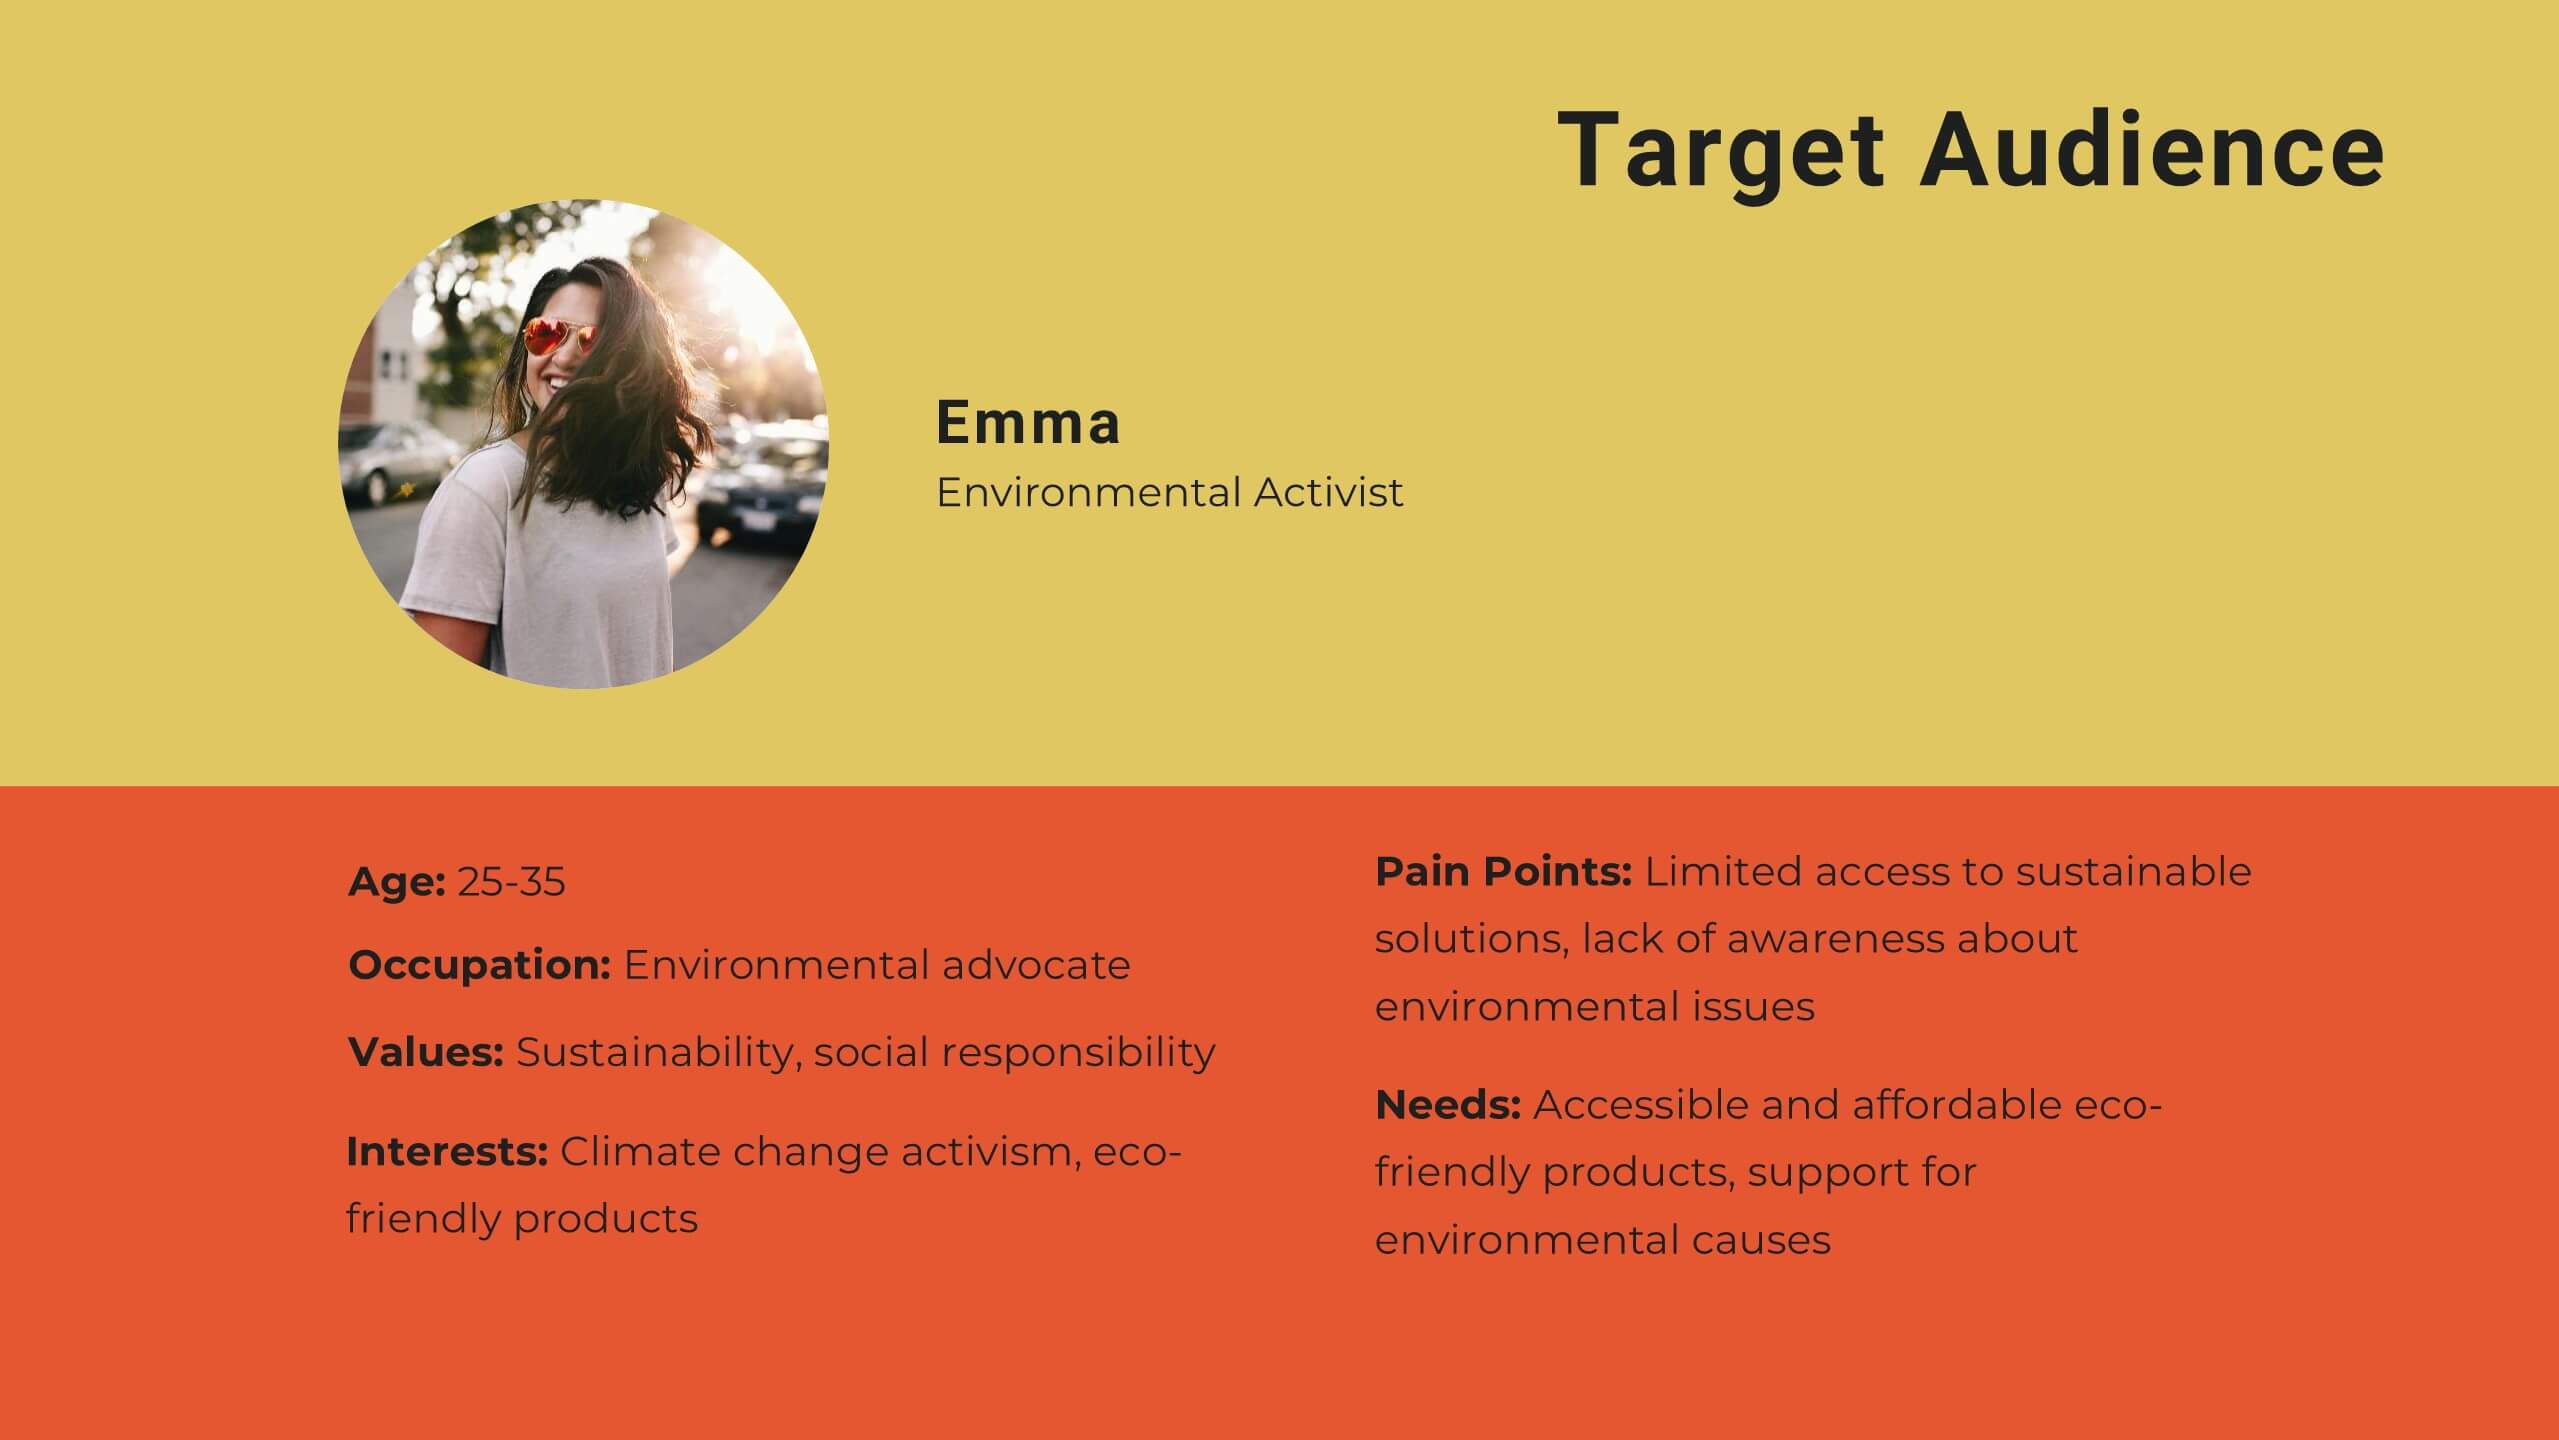
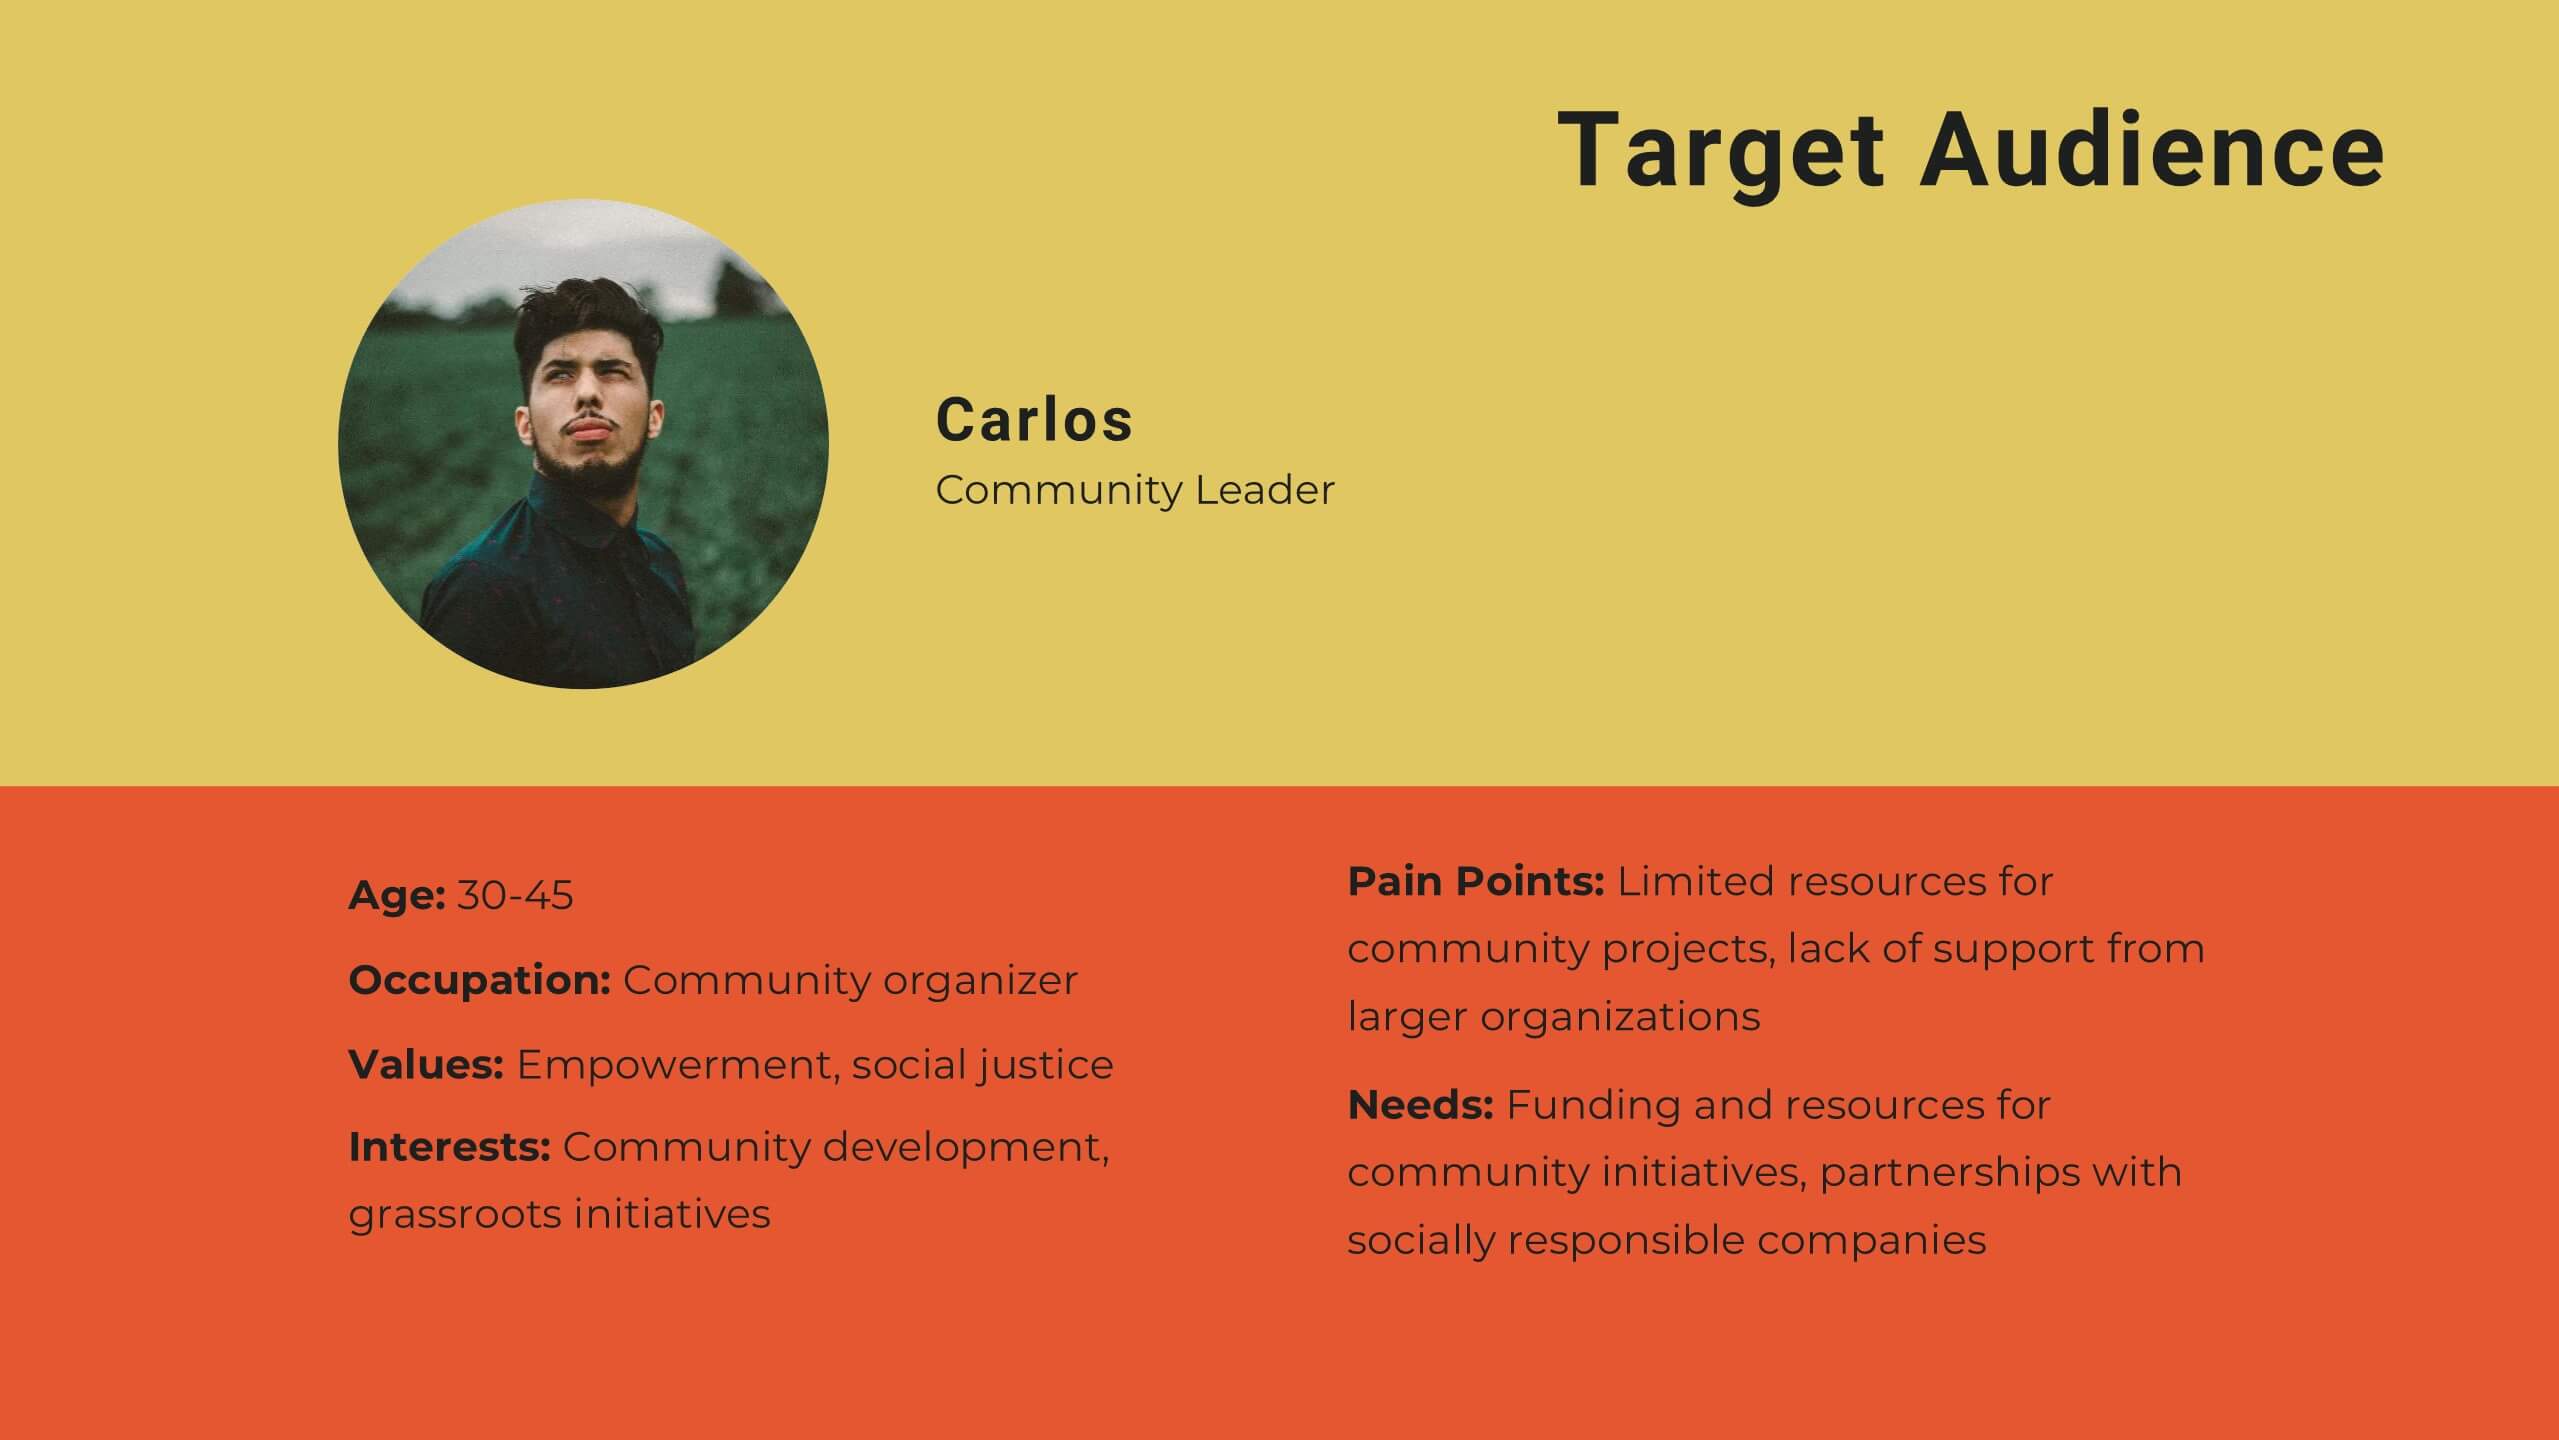
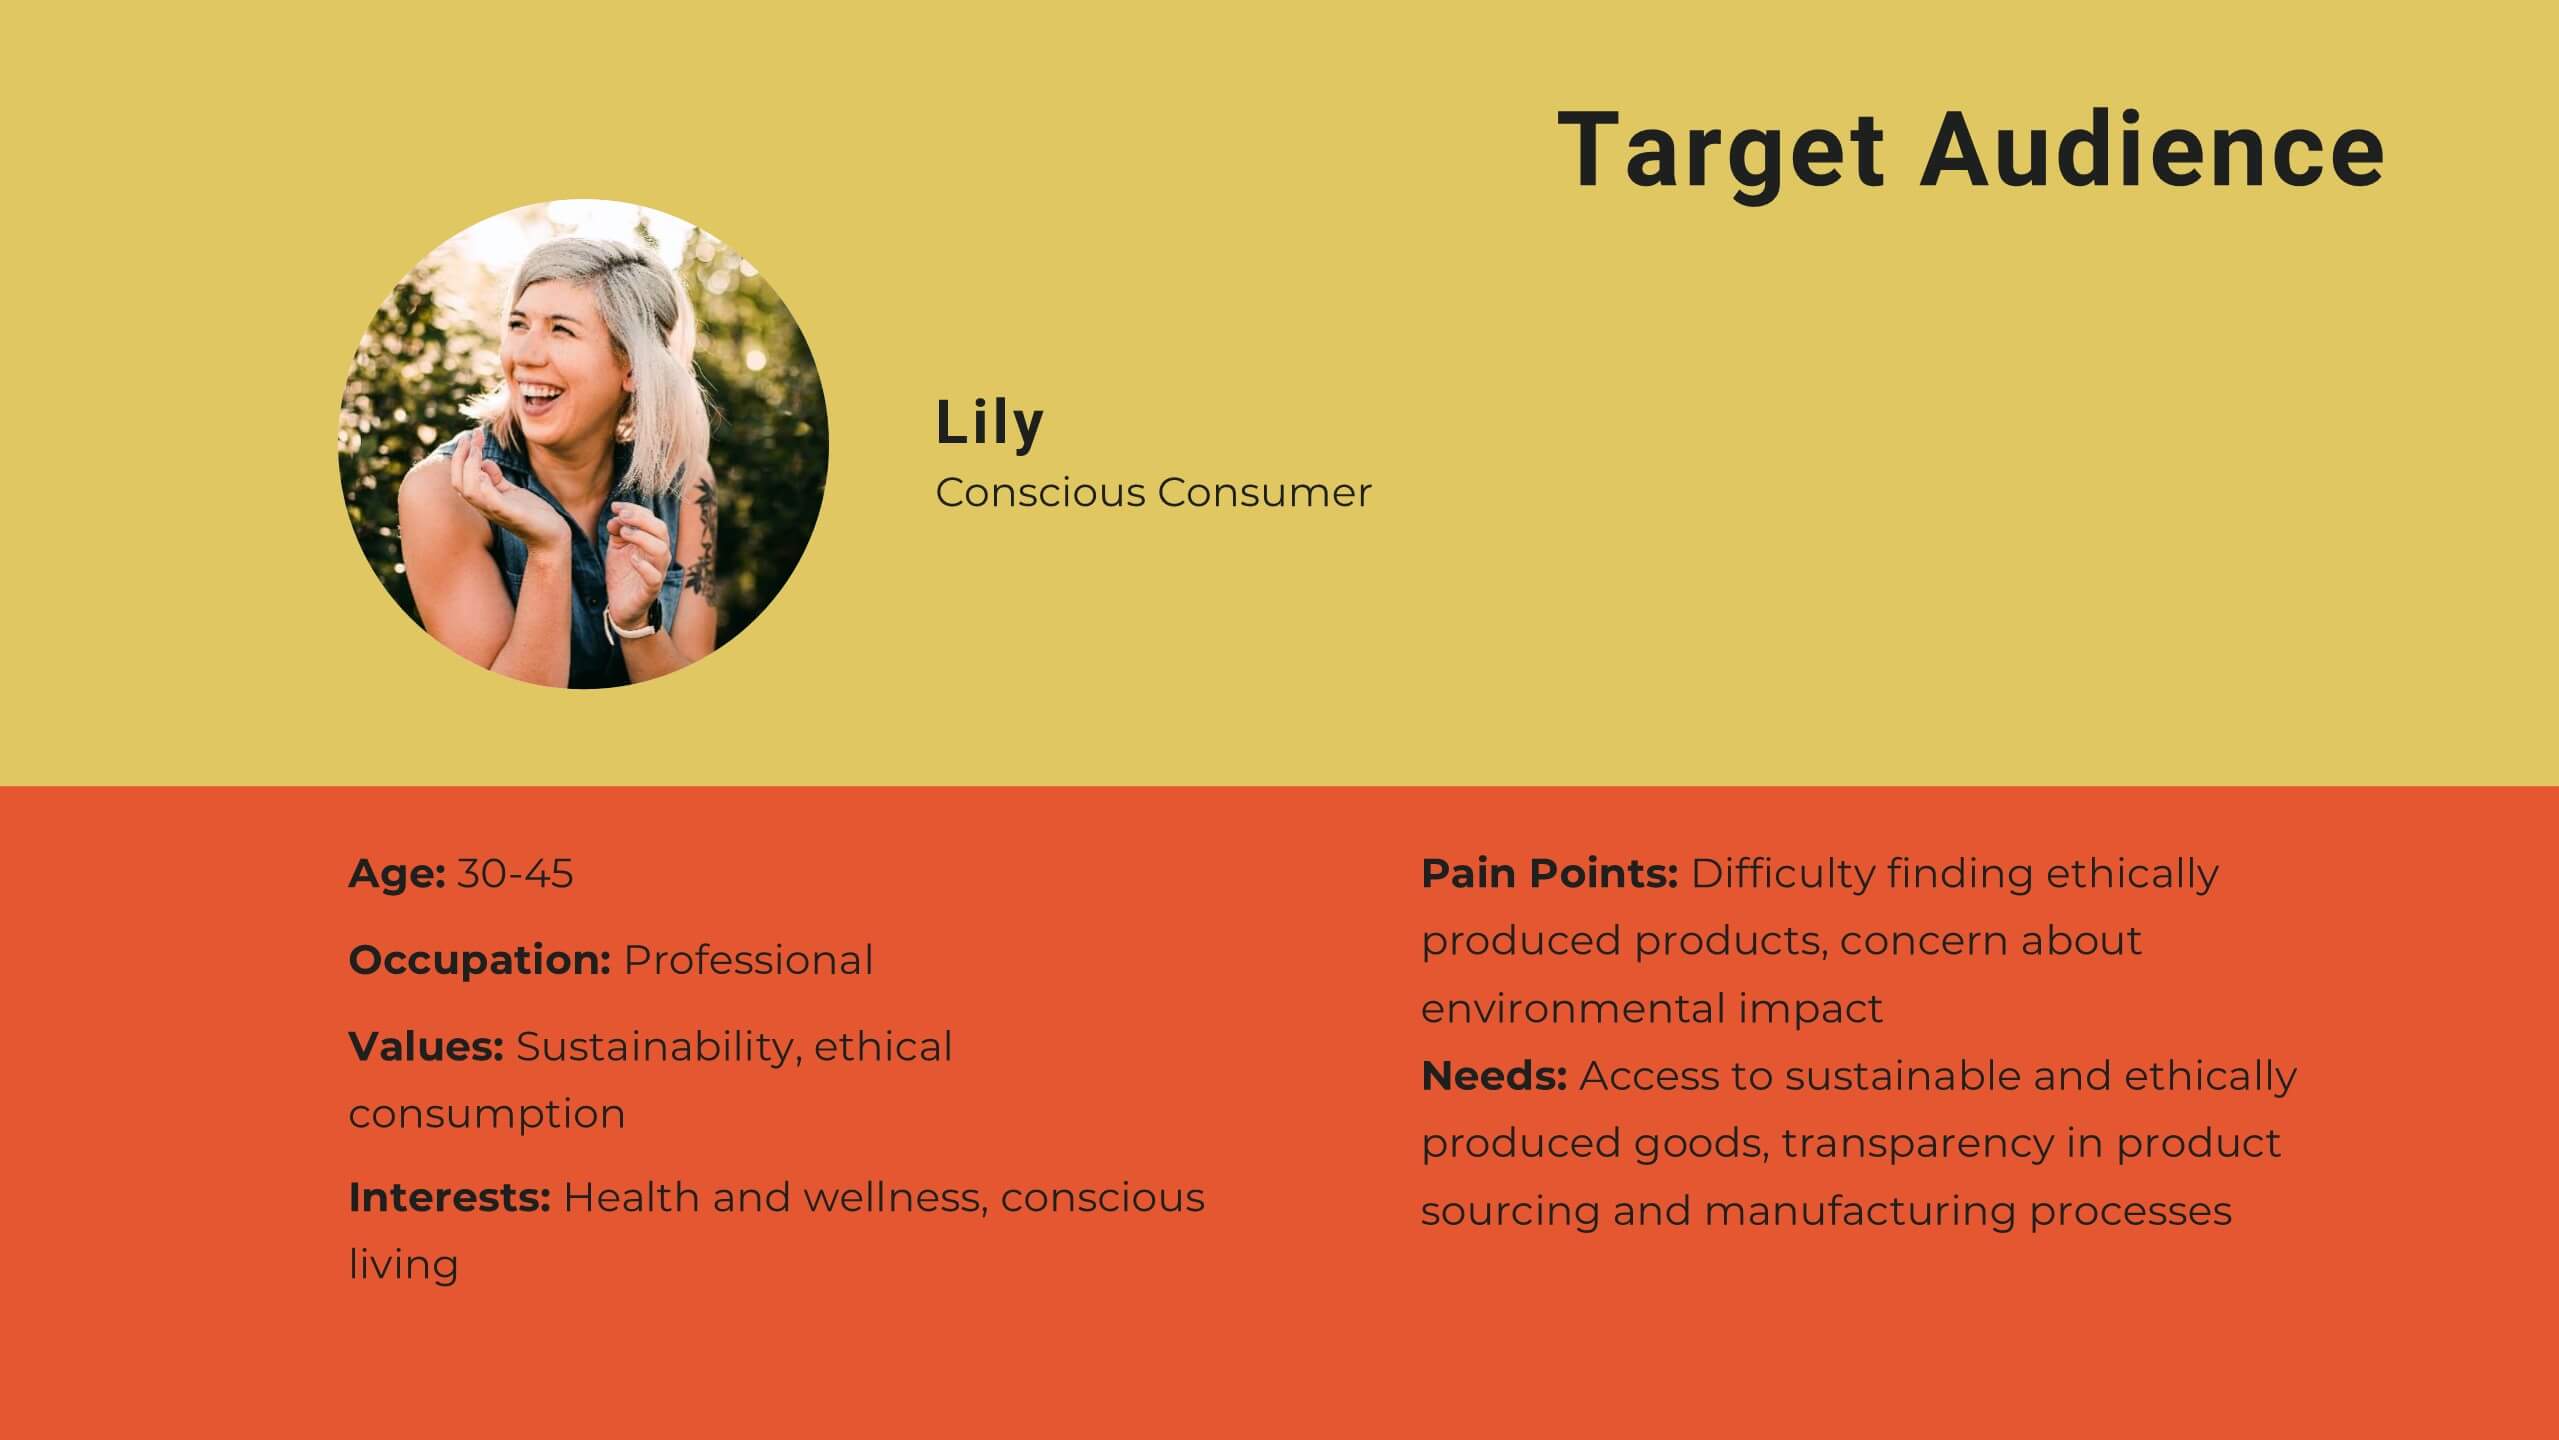
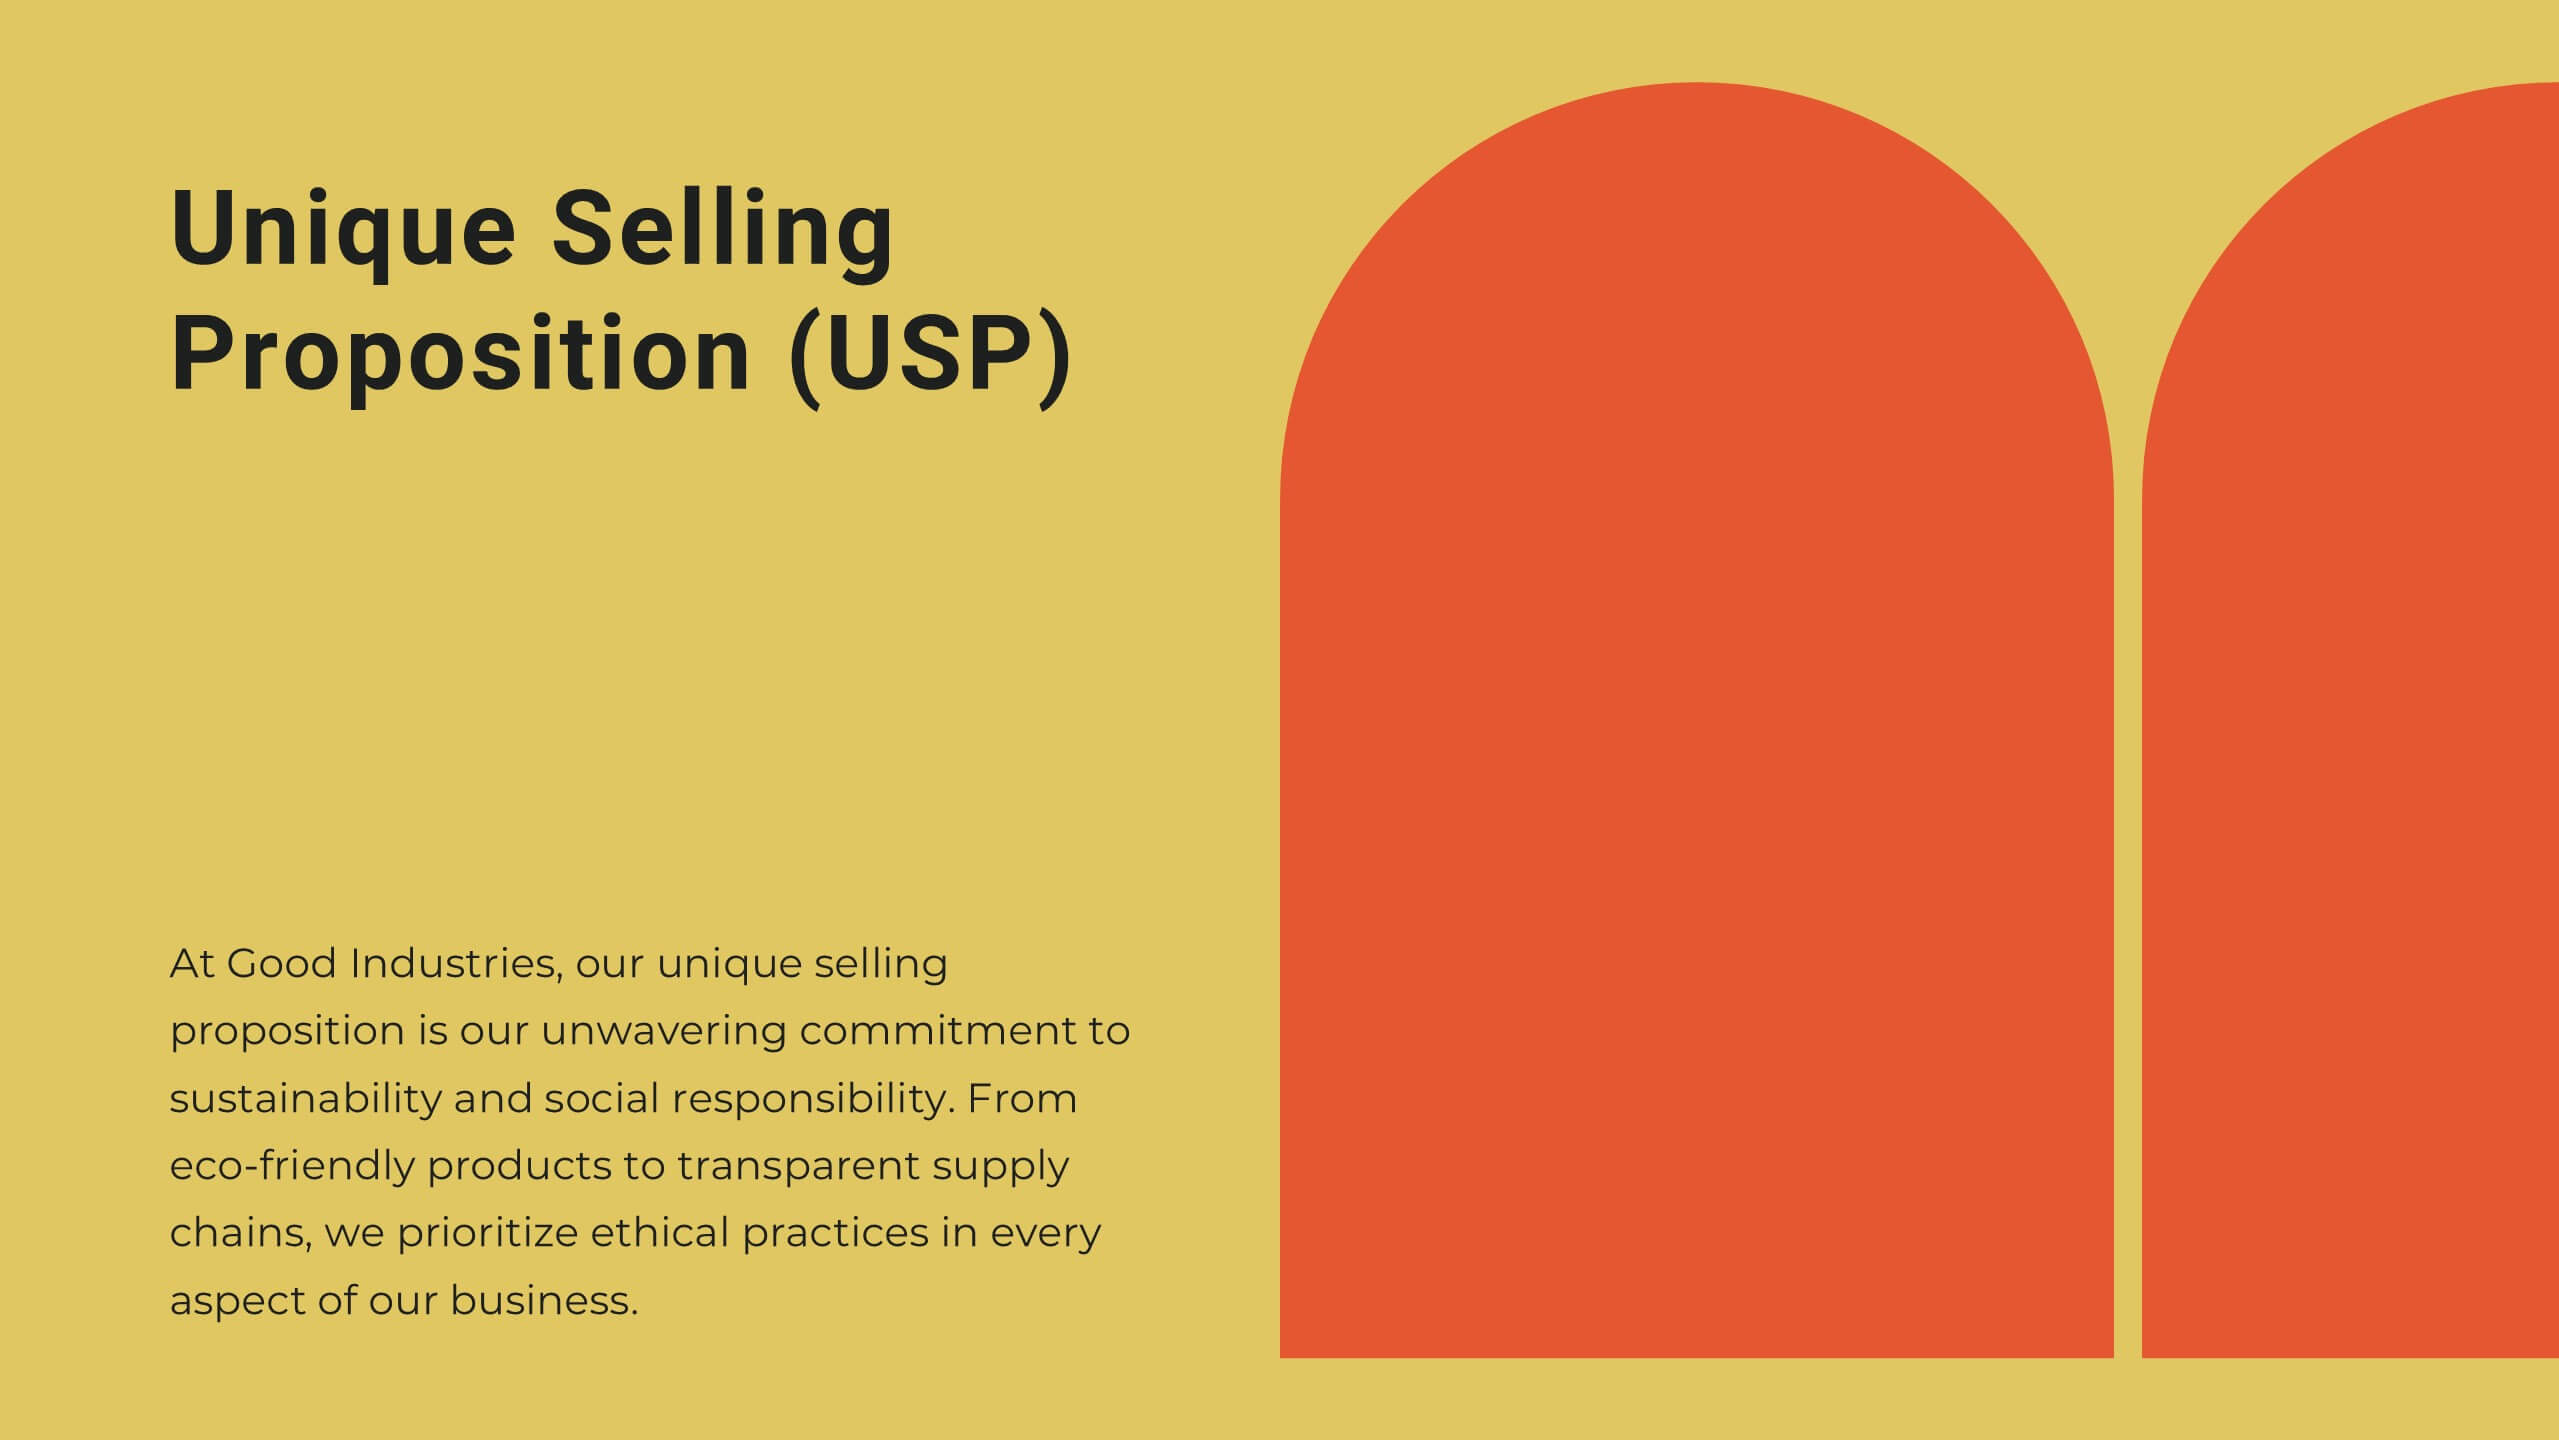
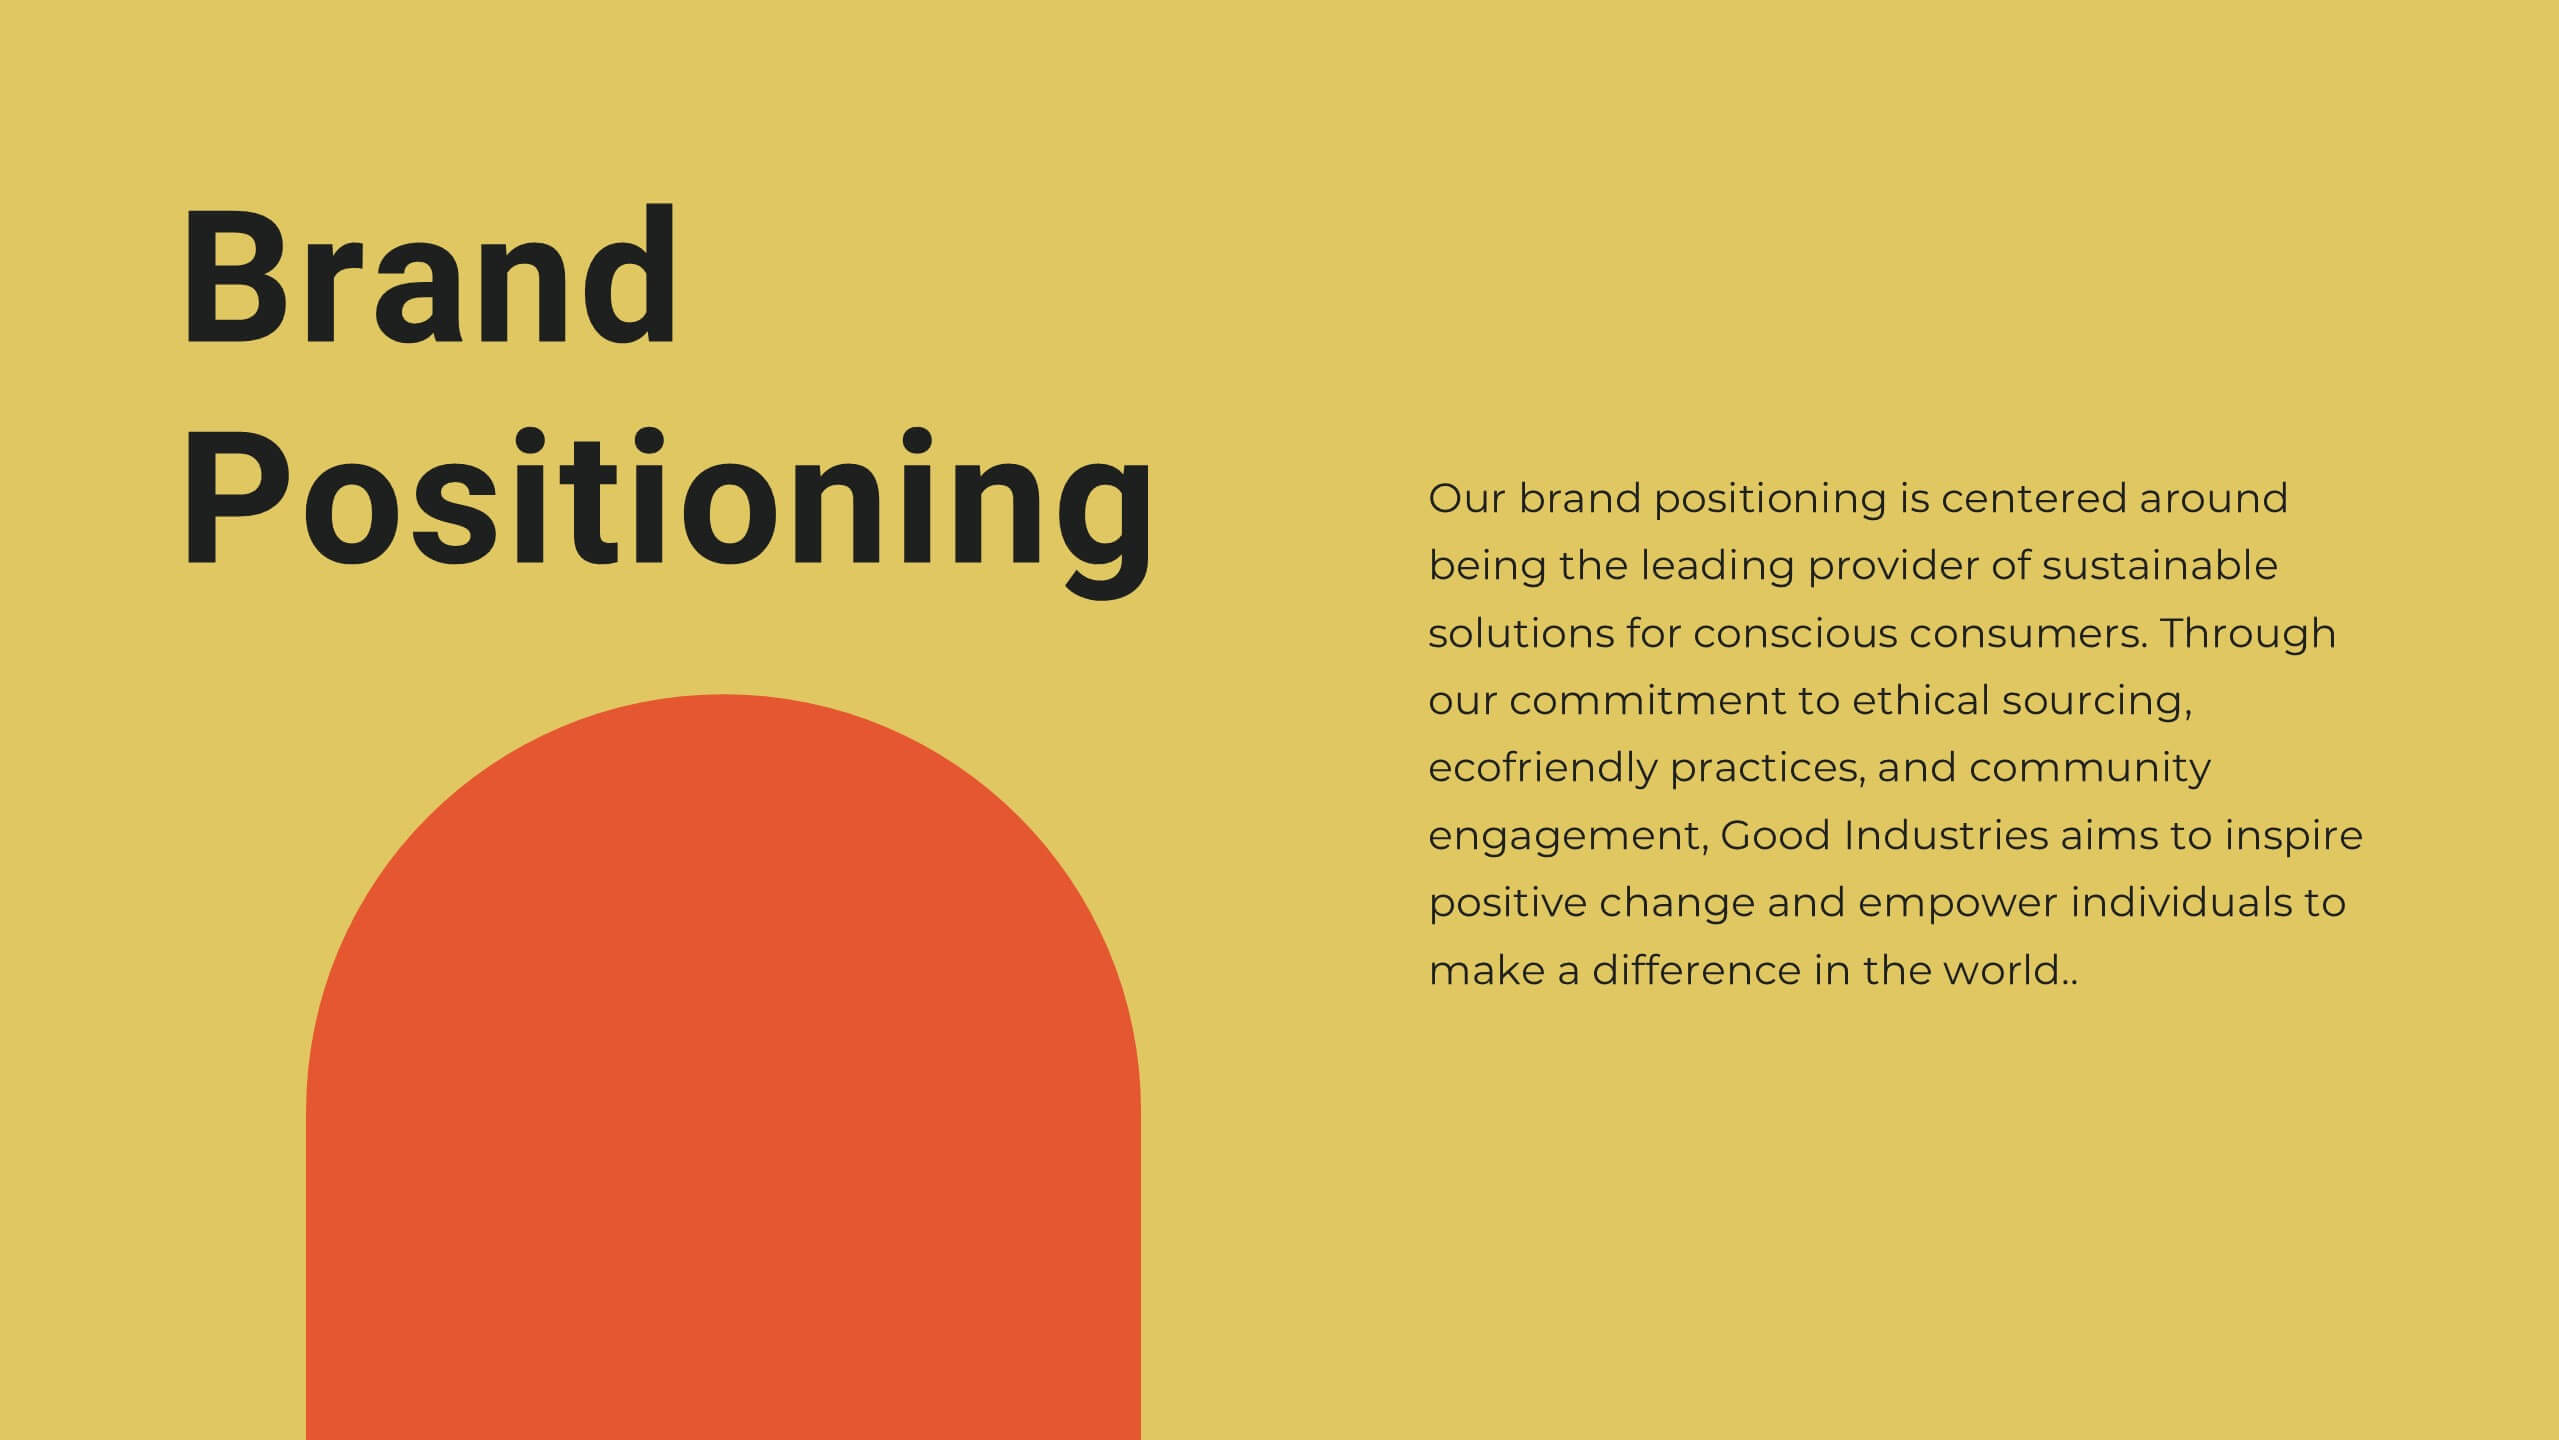
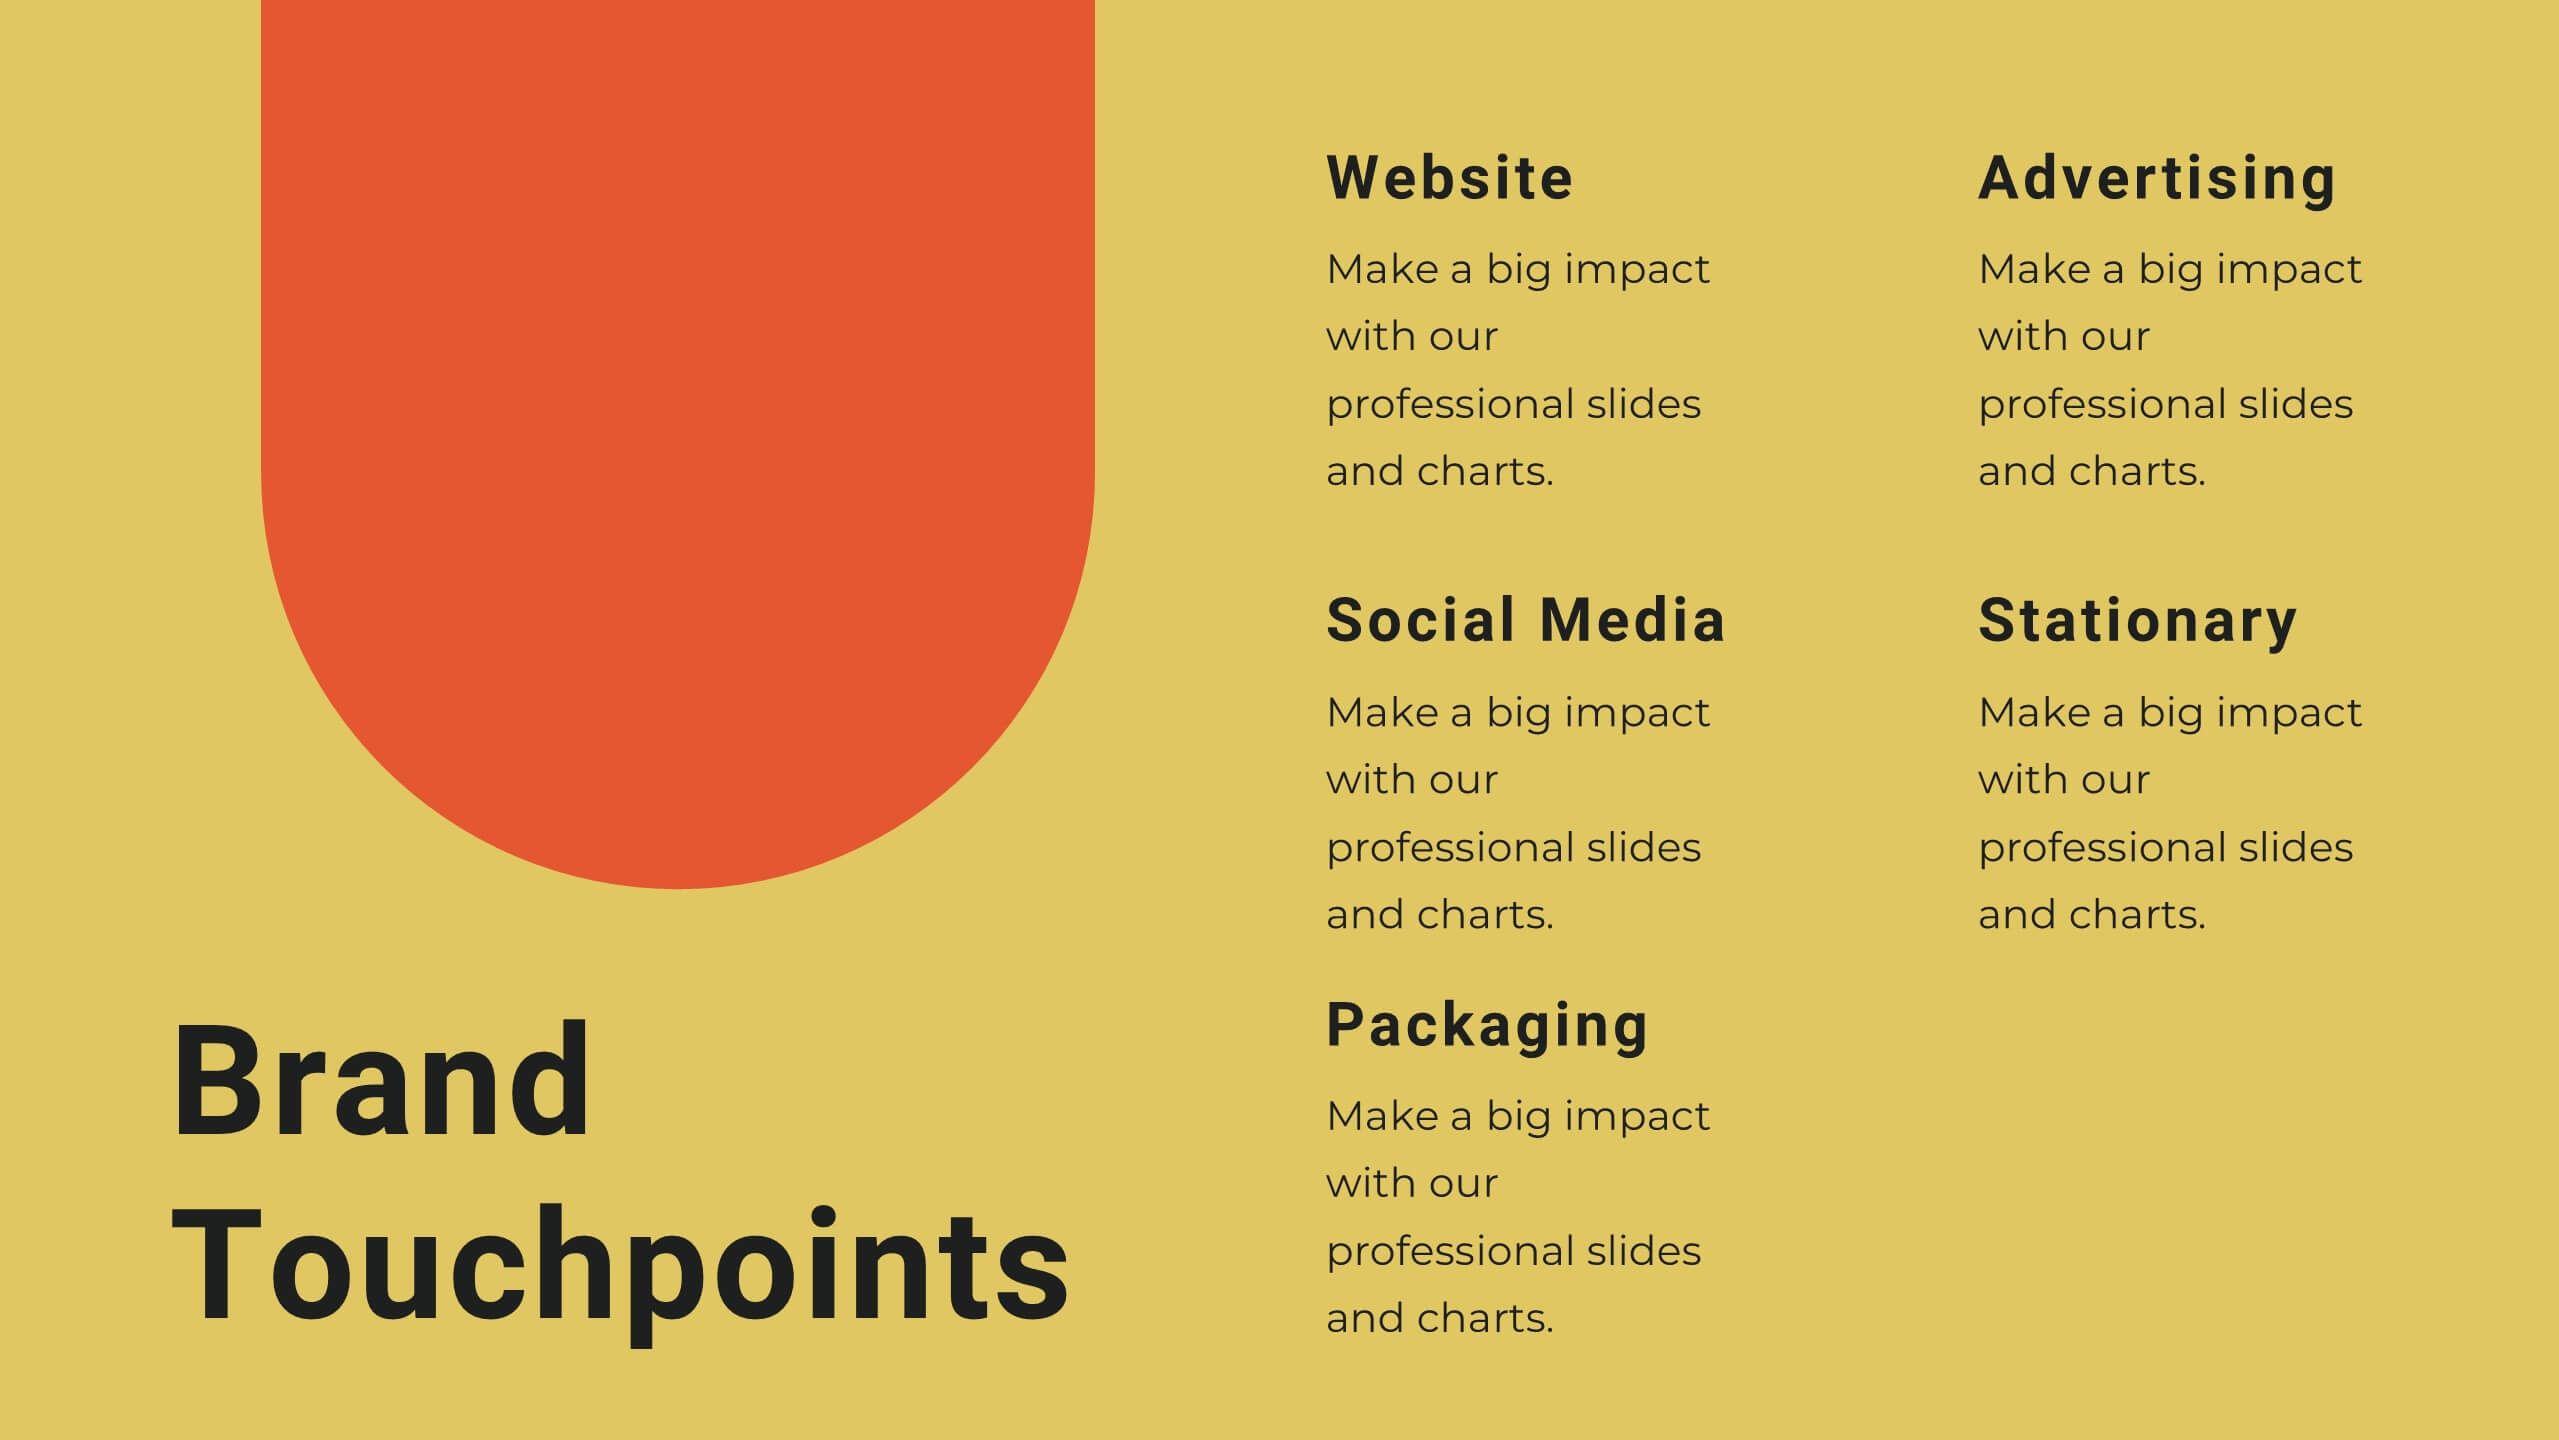
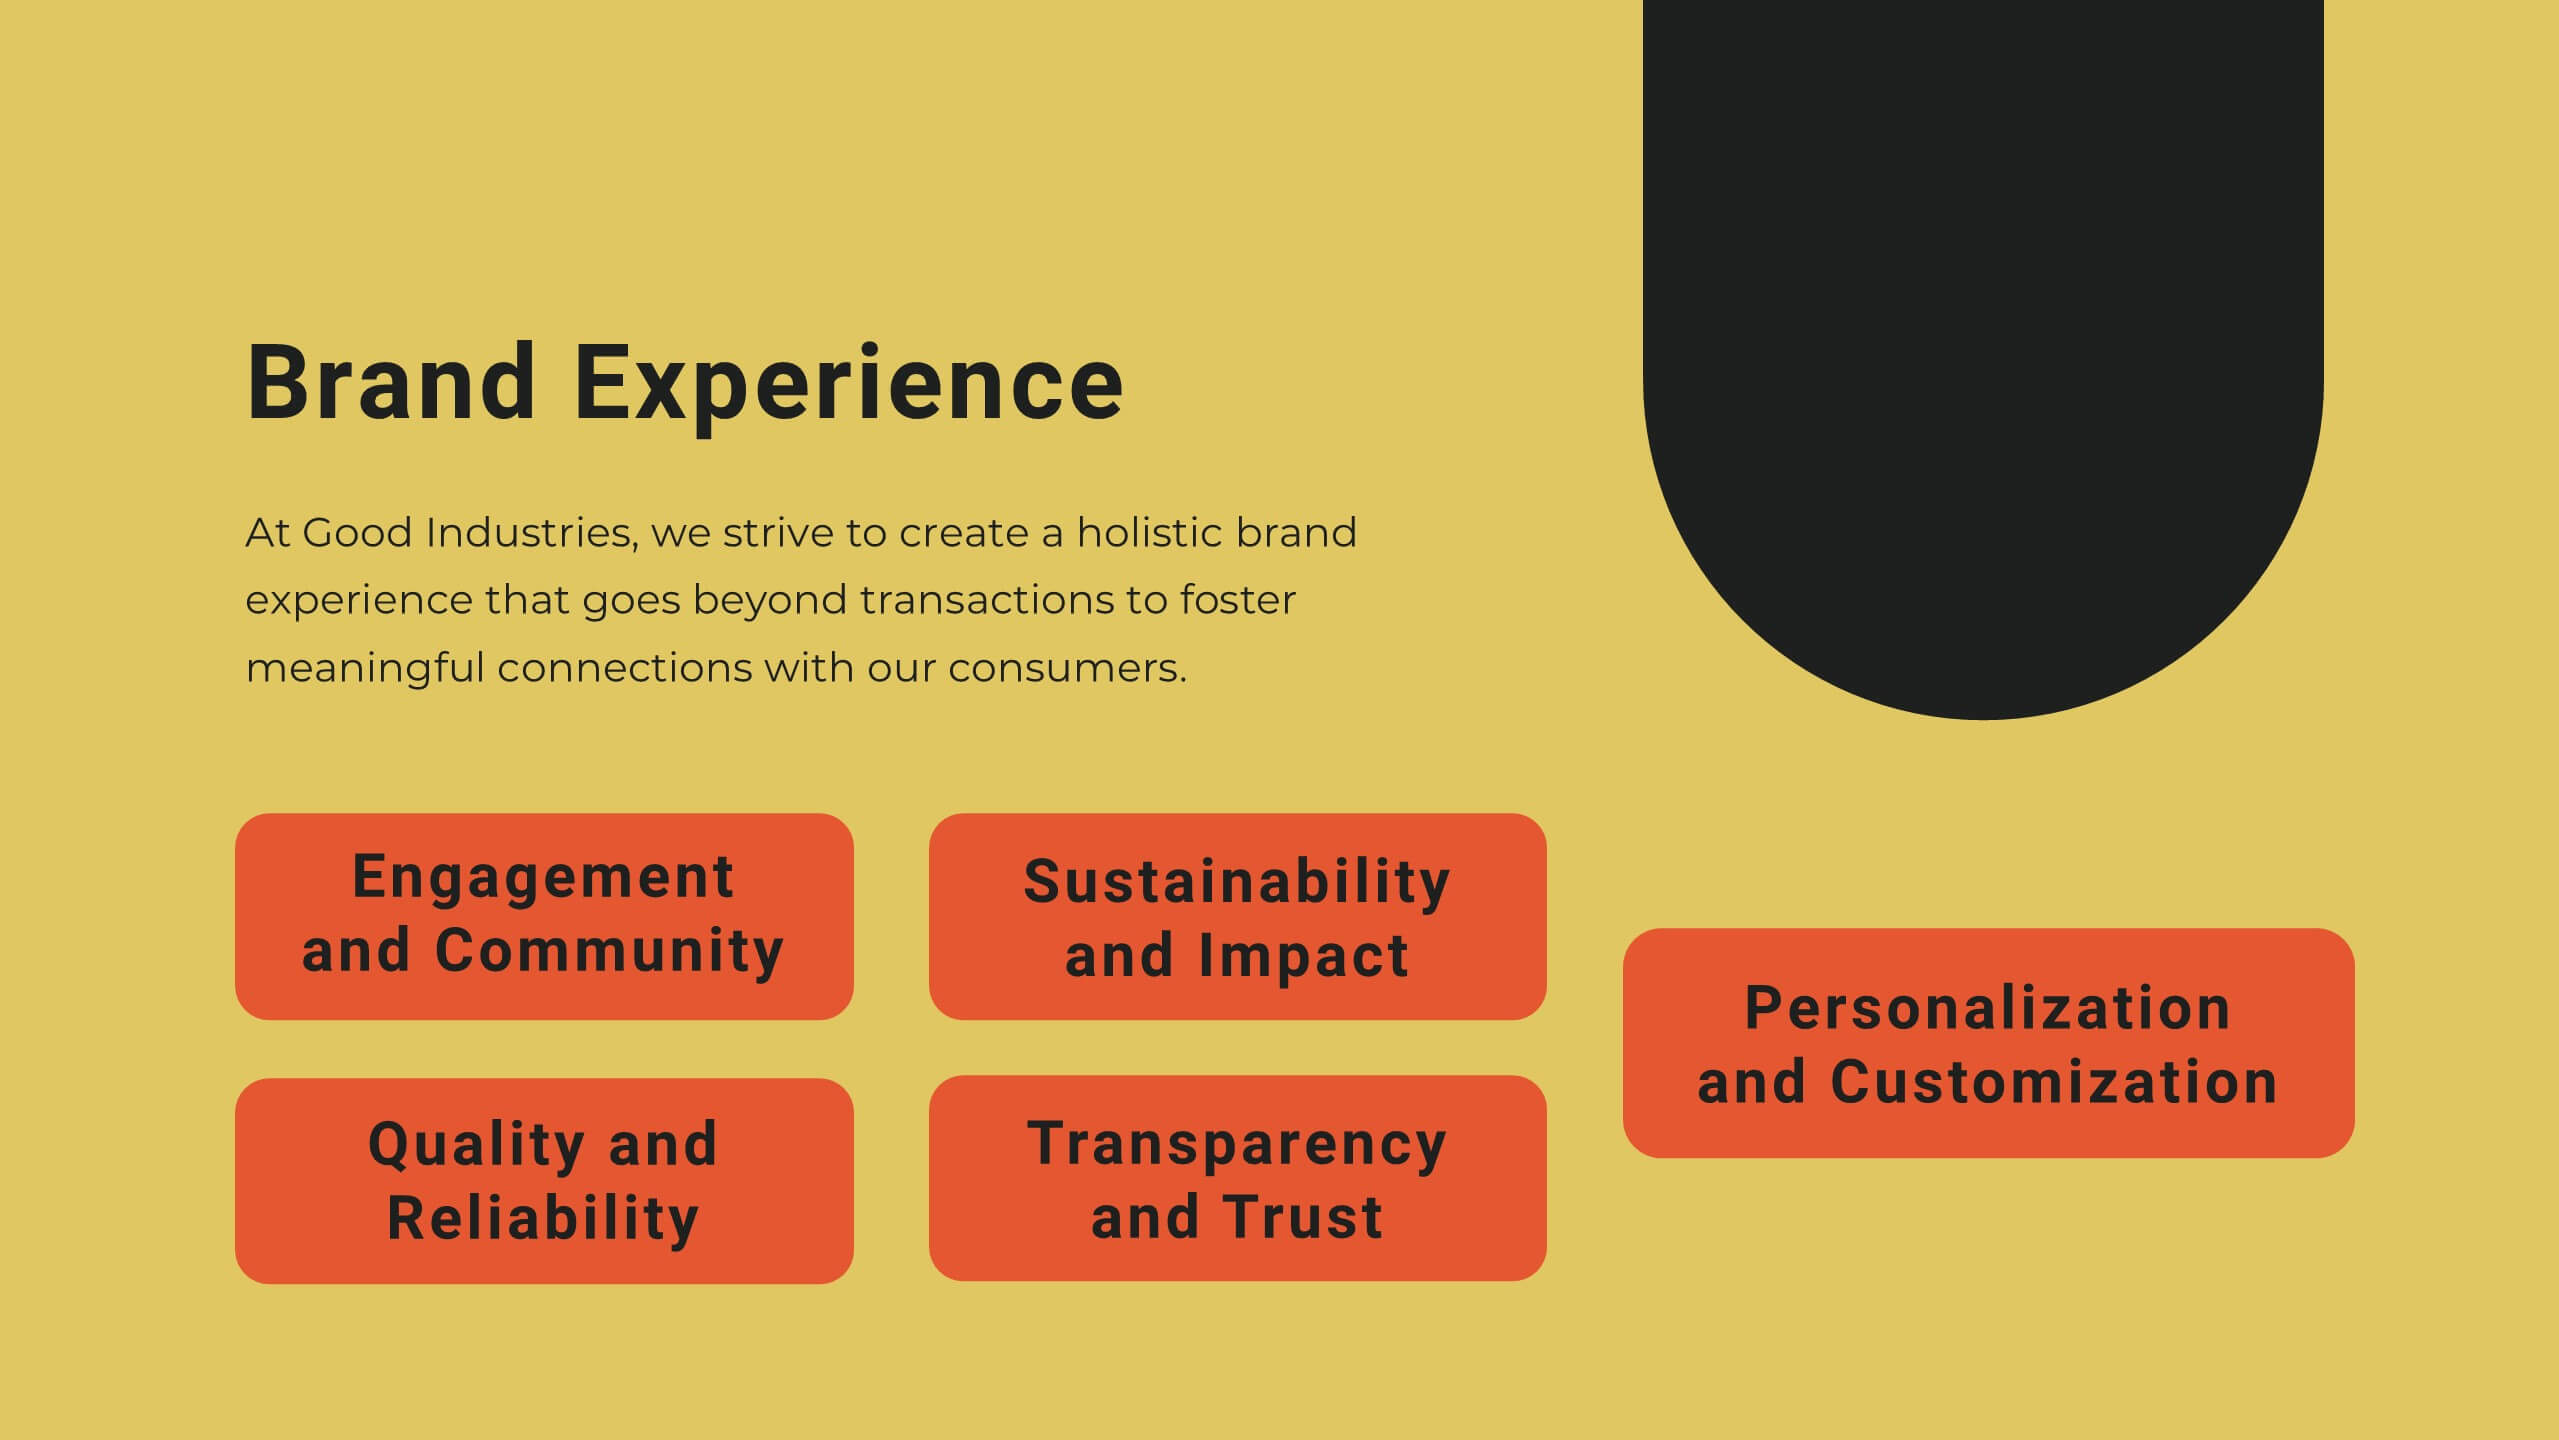
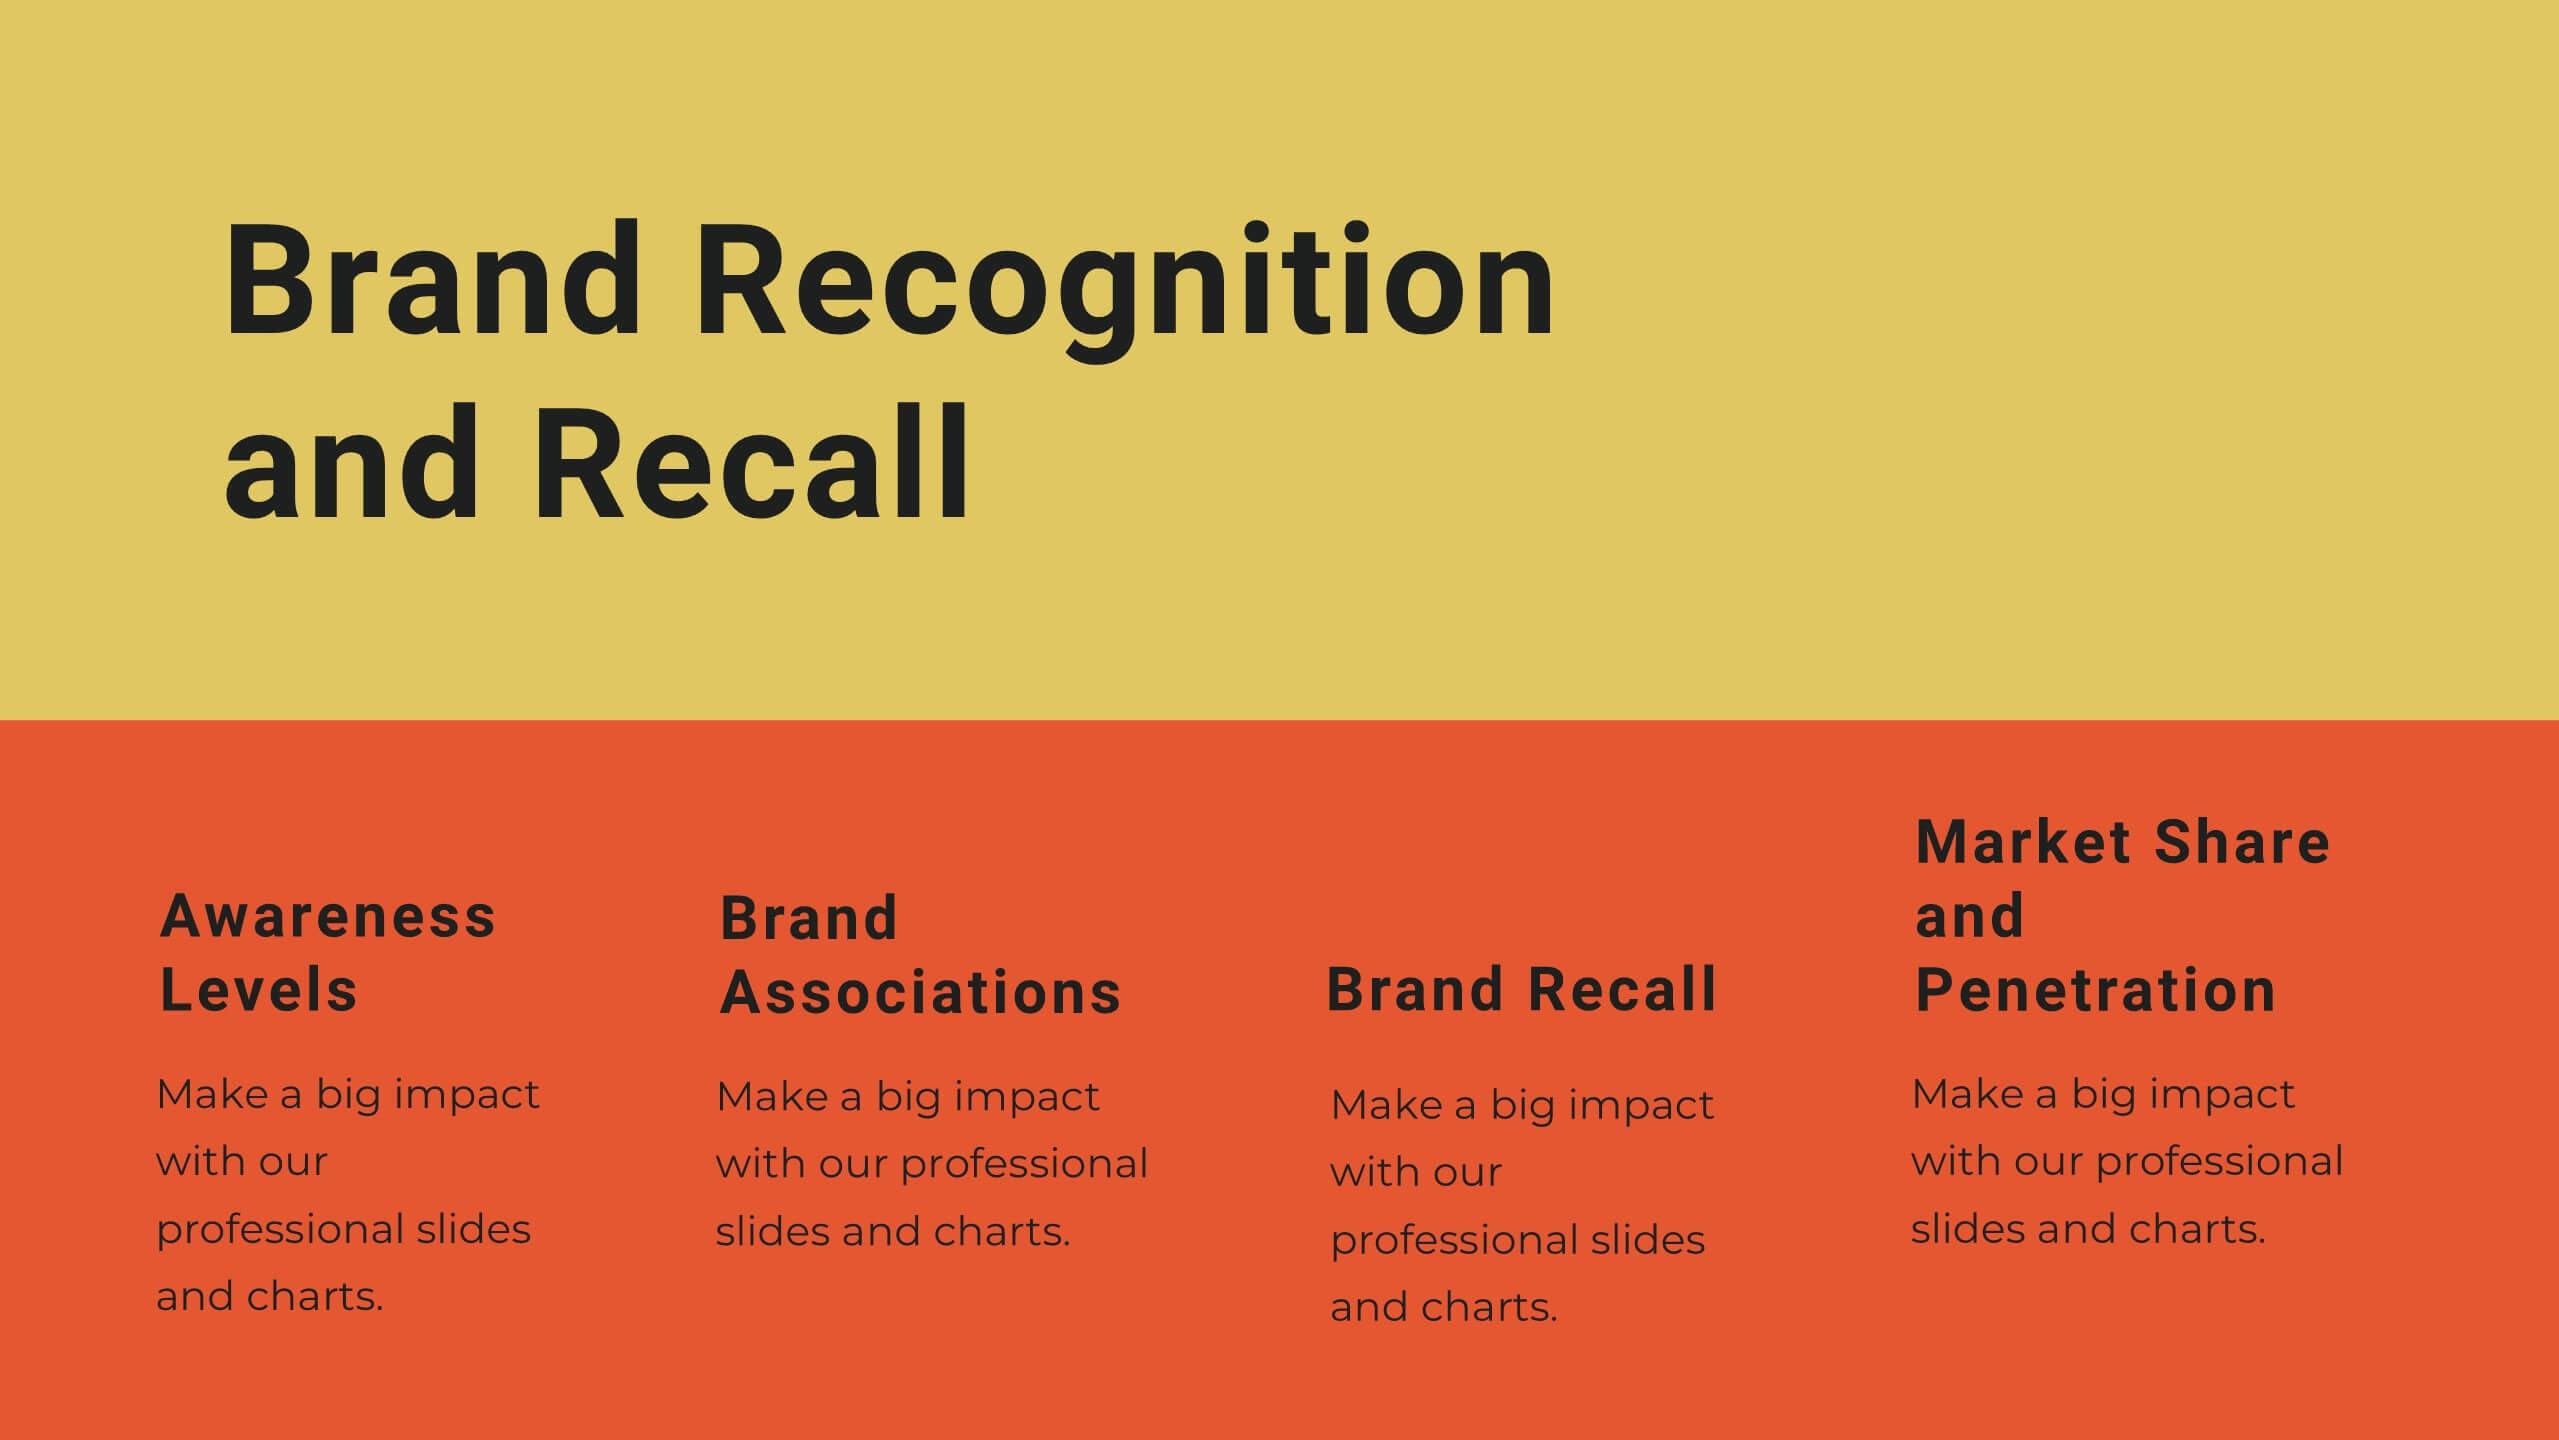
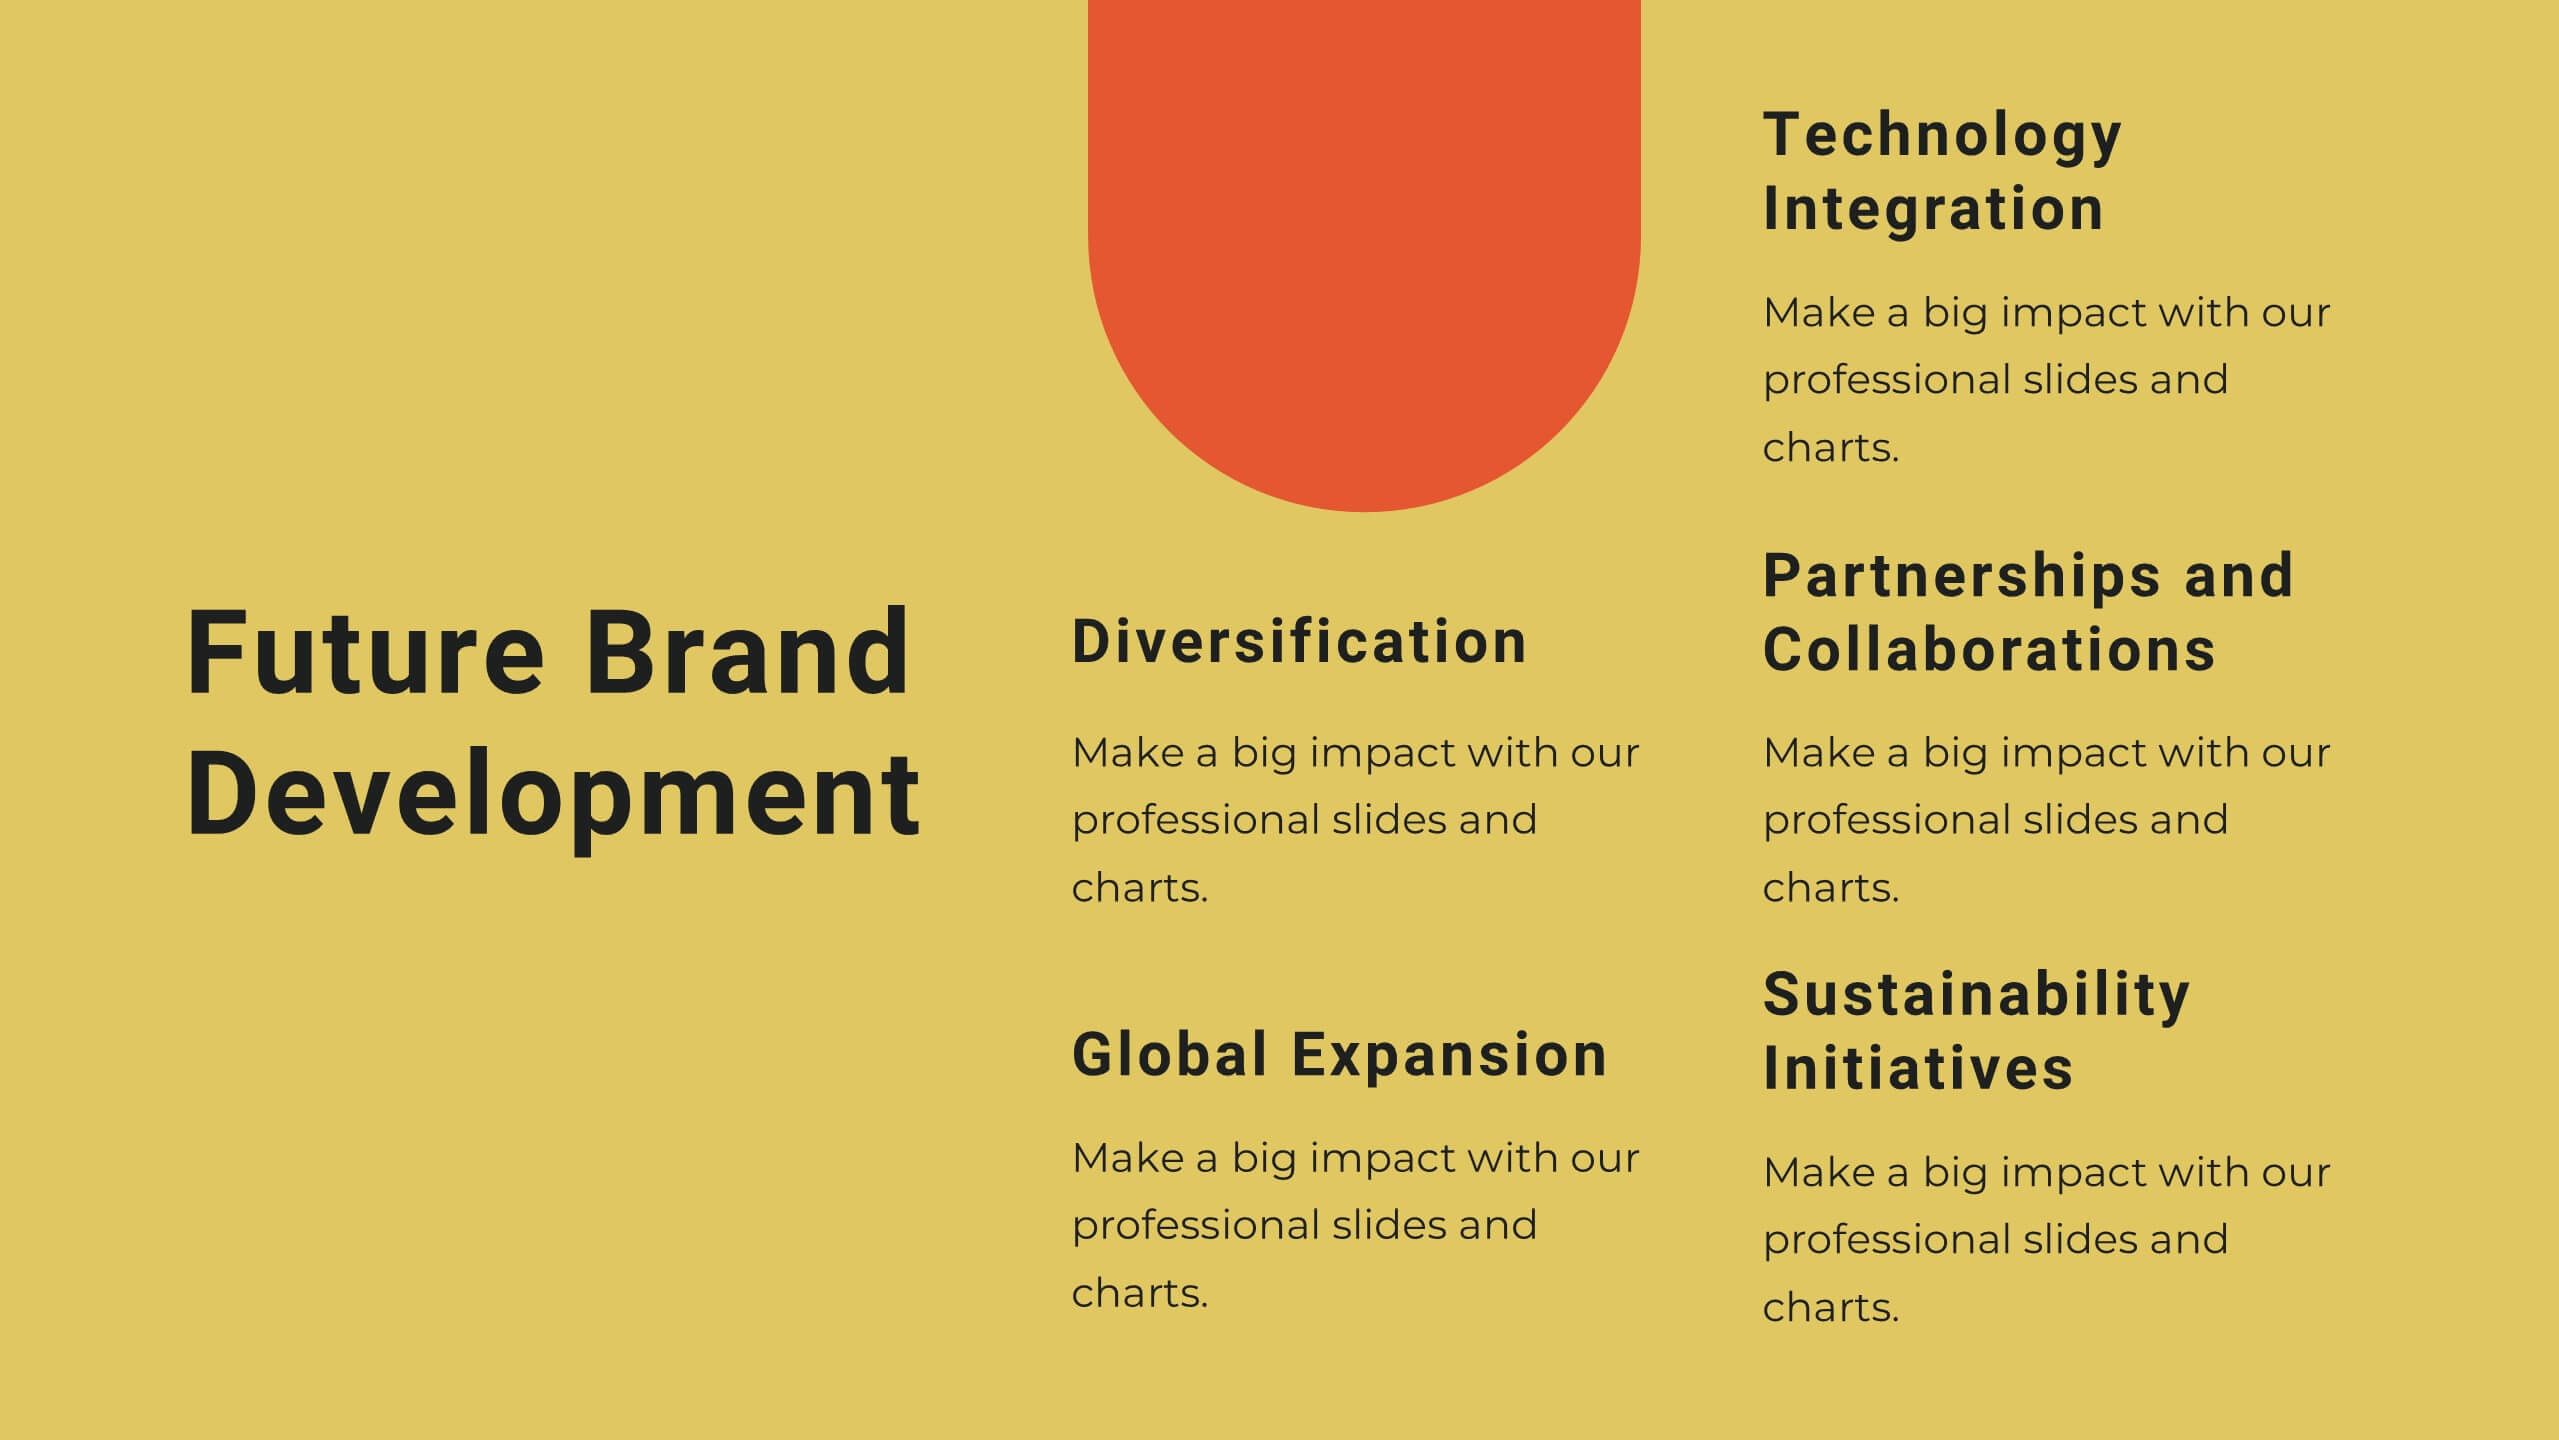
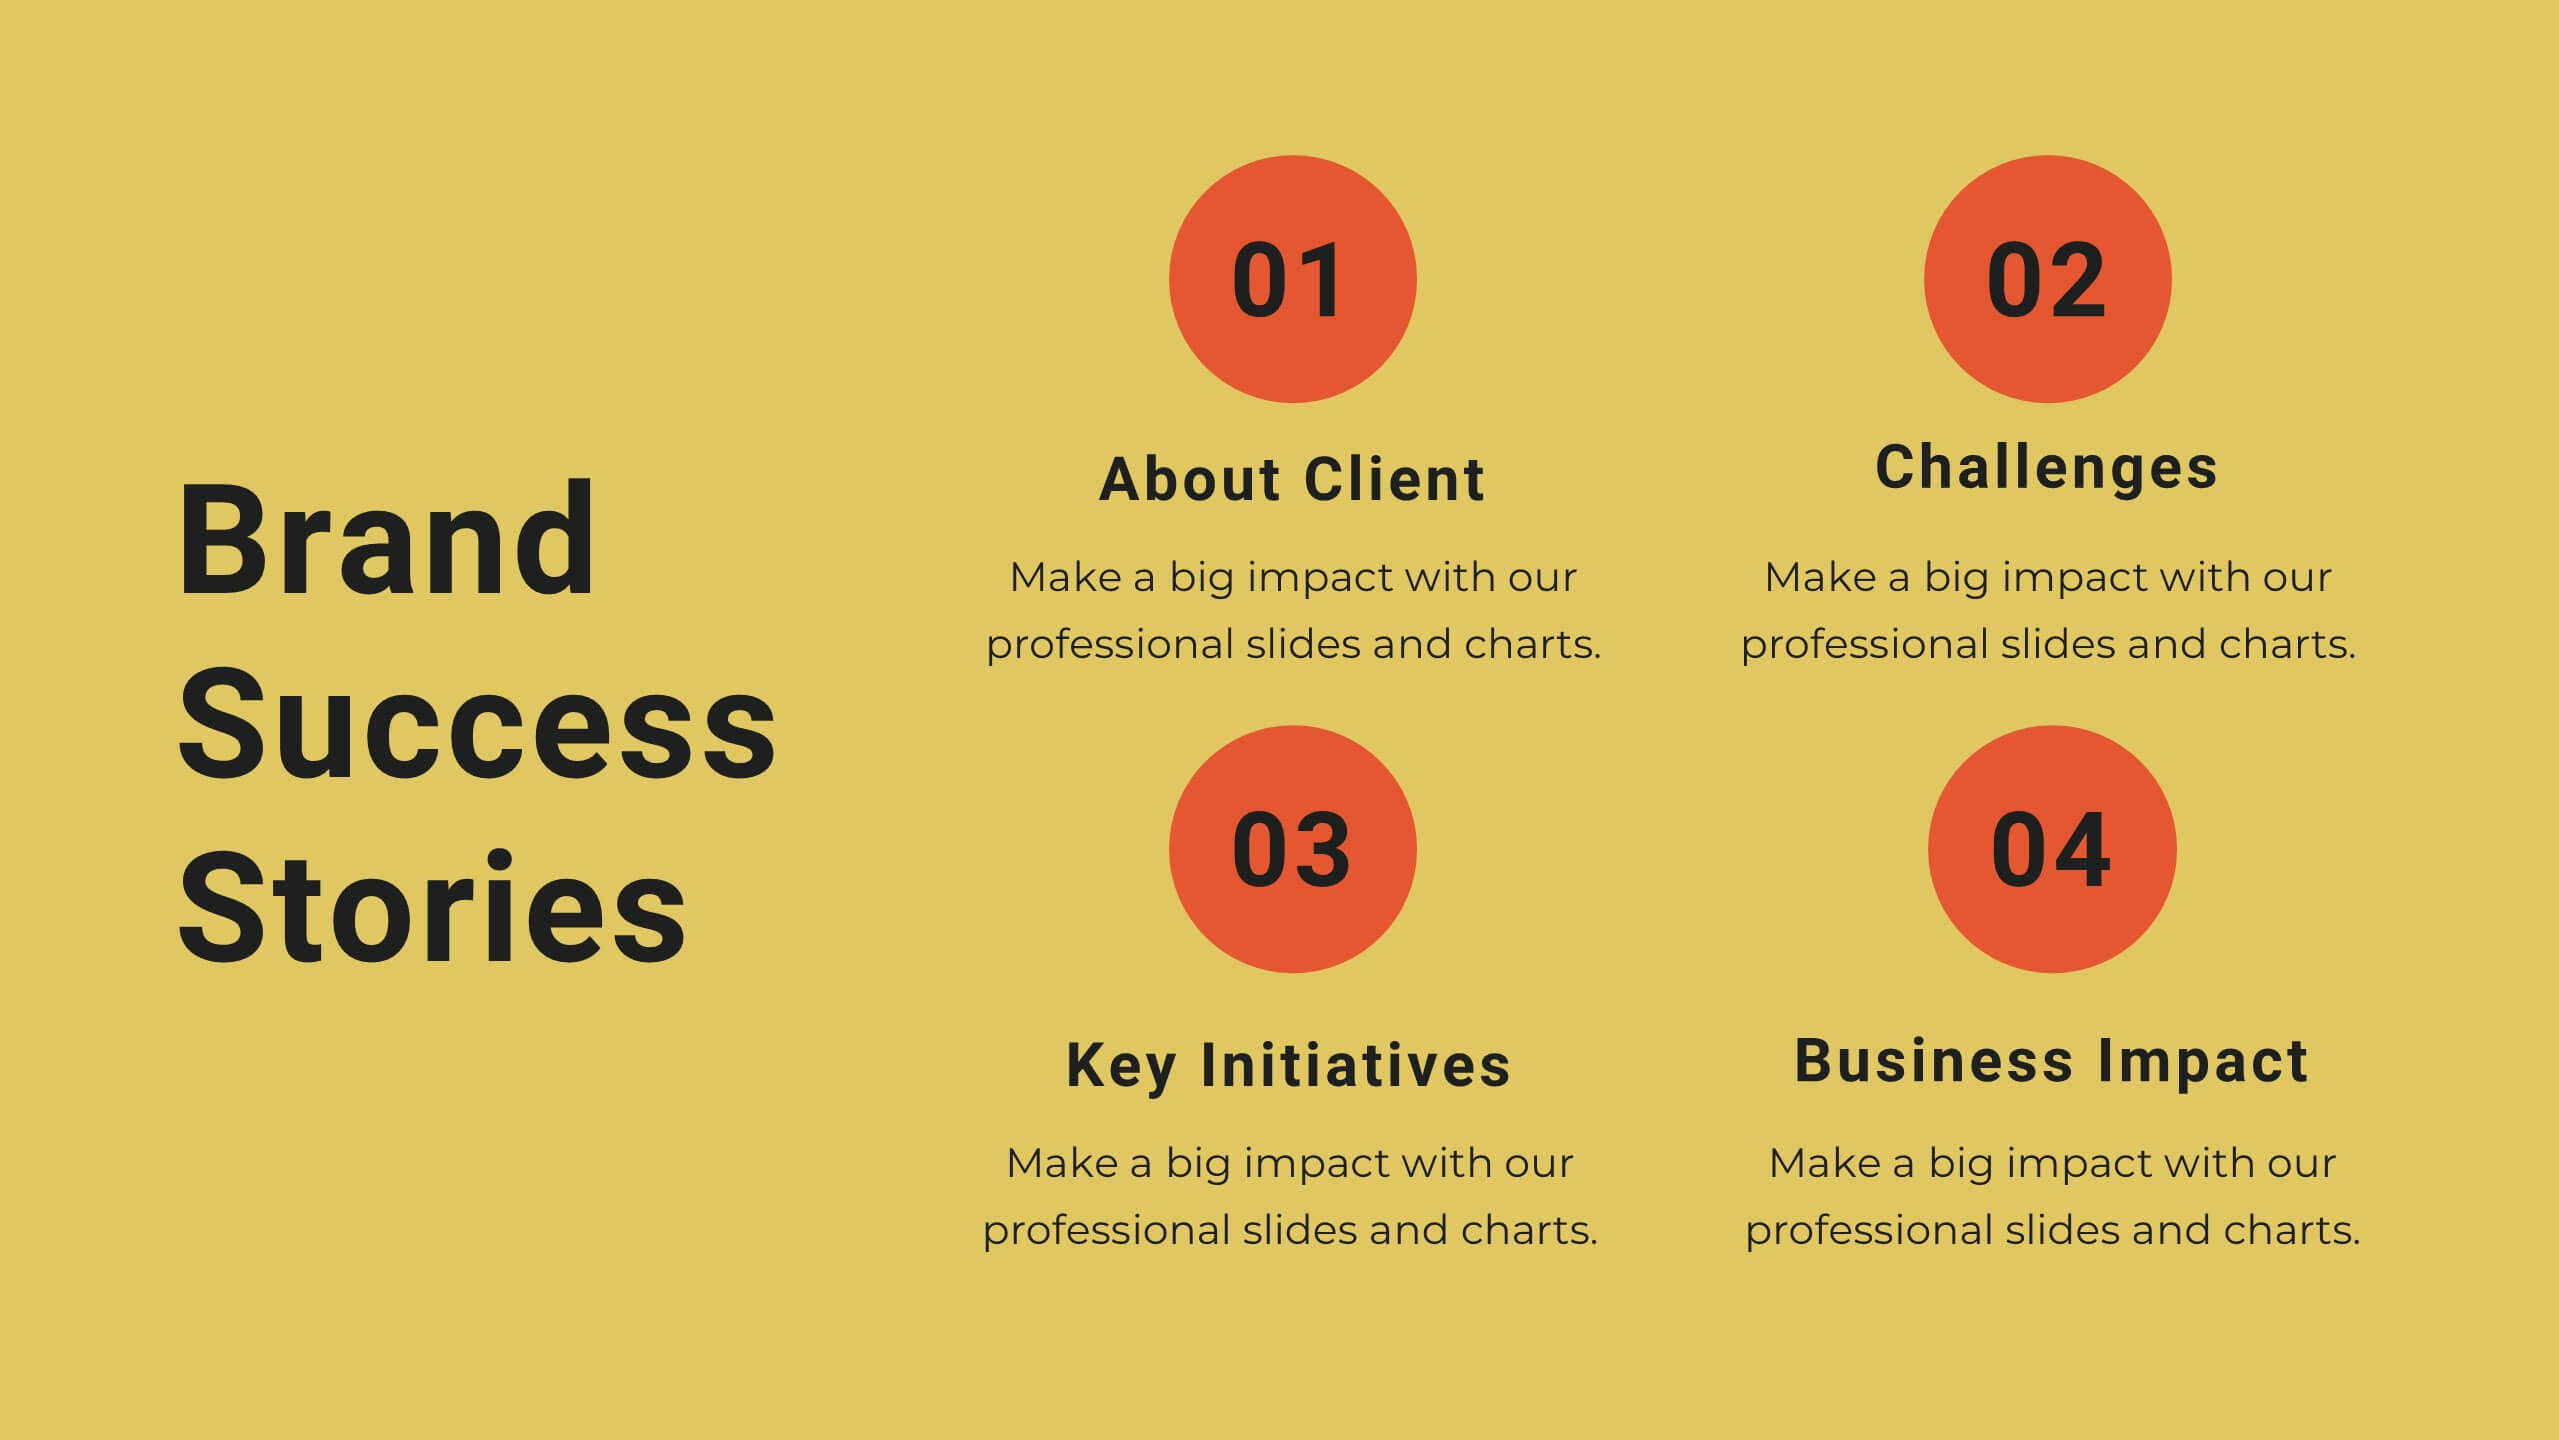
Yttrium Brand Strategy Report Presentation
Present your brand strategy with confidence using this vibrant, structured template! Covering brand identity, values, audience personas, and positioning, this template is perfect for crafting a compelling brand narrative. Fully customizable, it’s designed for seamless use in PowerPoint, Keynote, and Google Slides, making it an ideal tool for branding presentations.


4 diapositivas
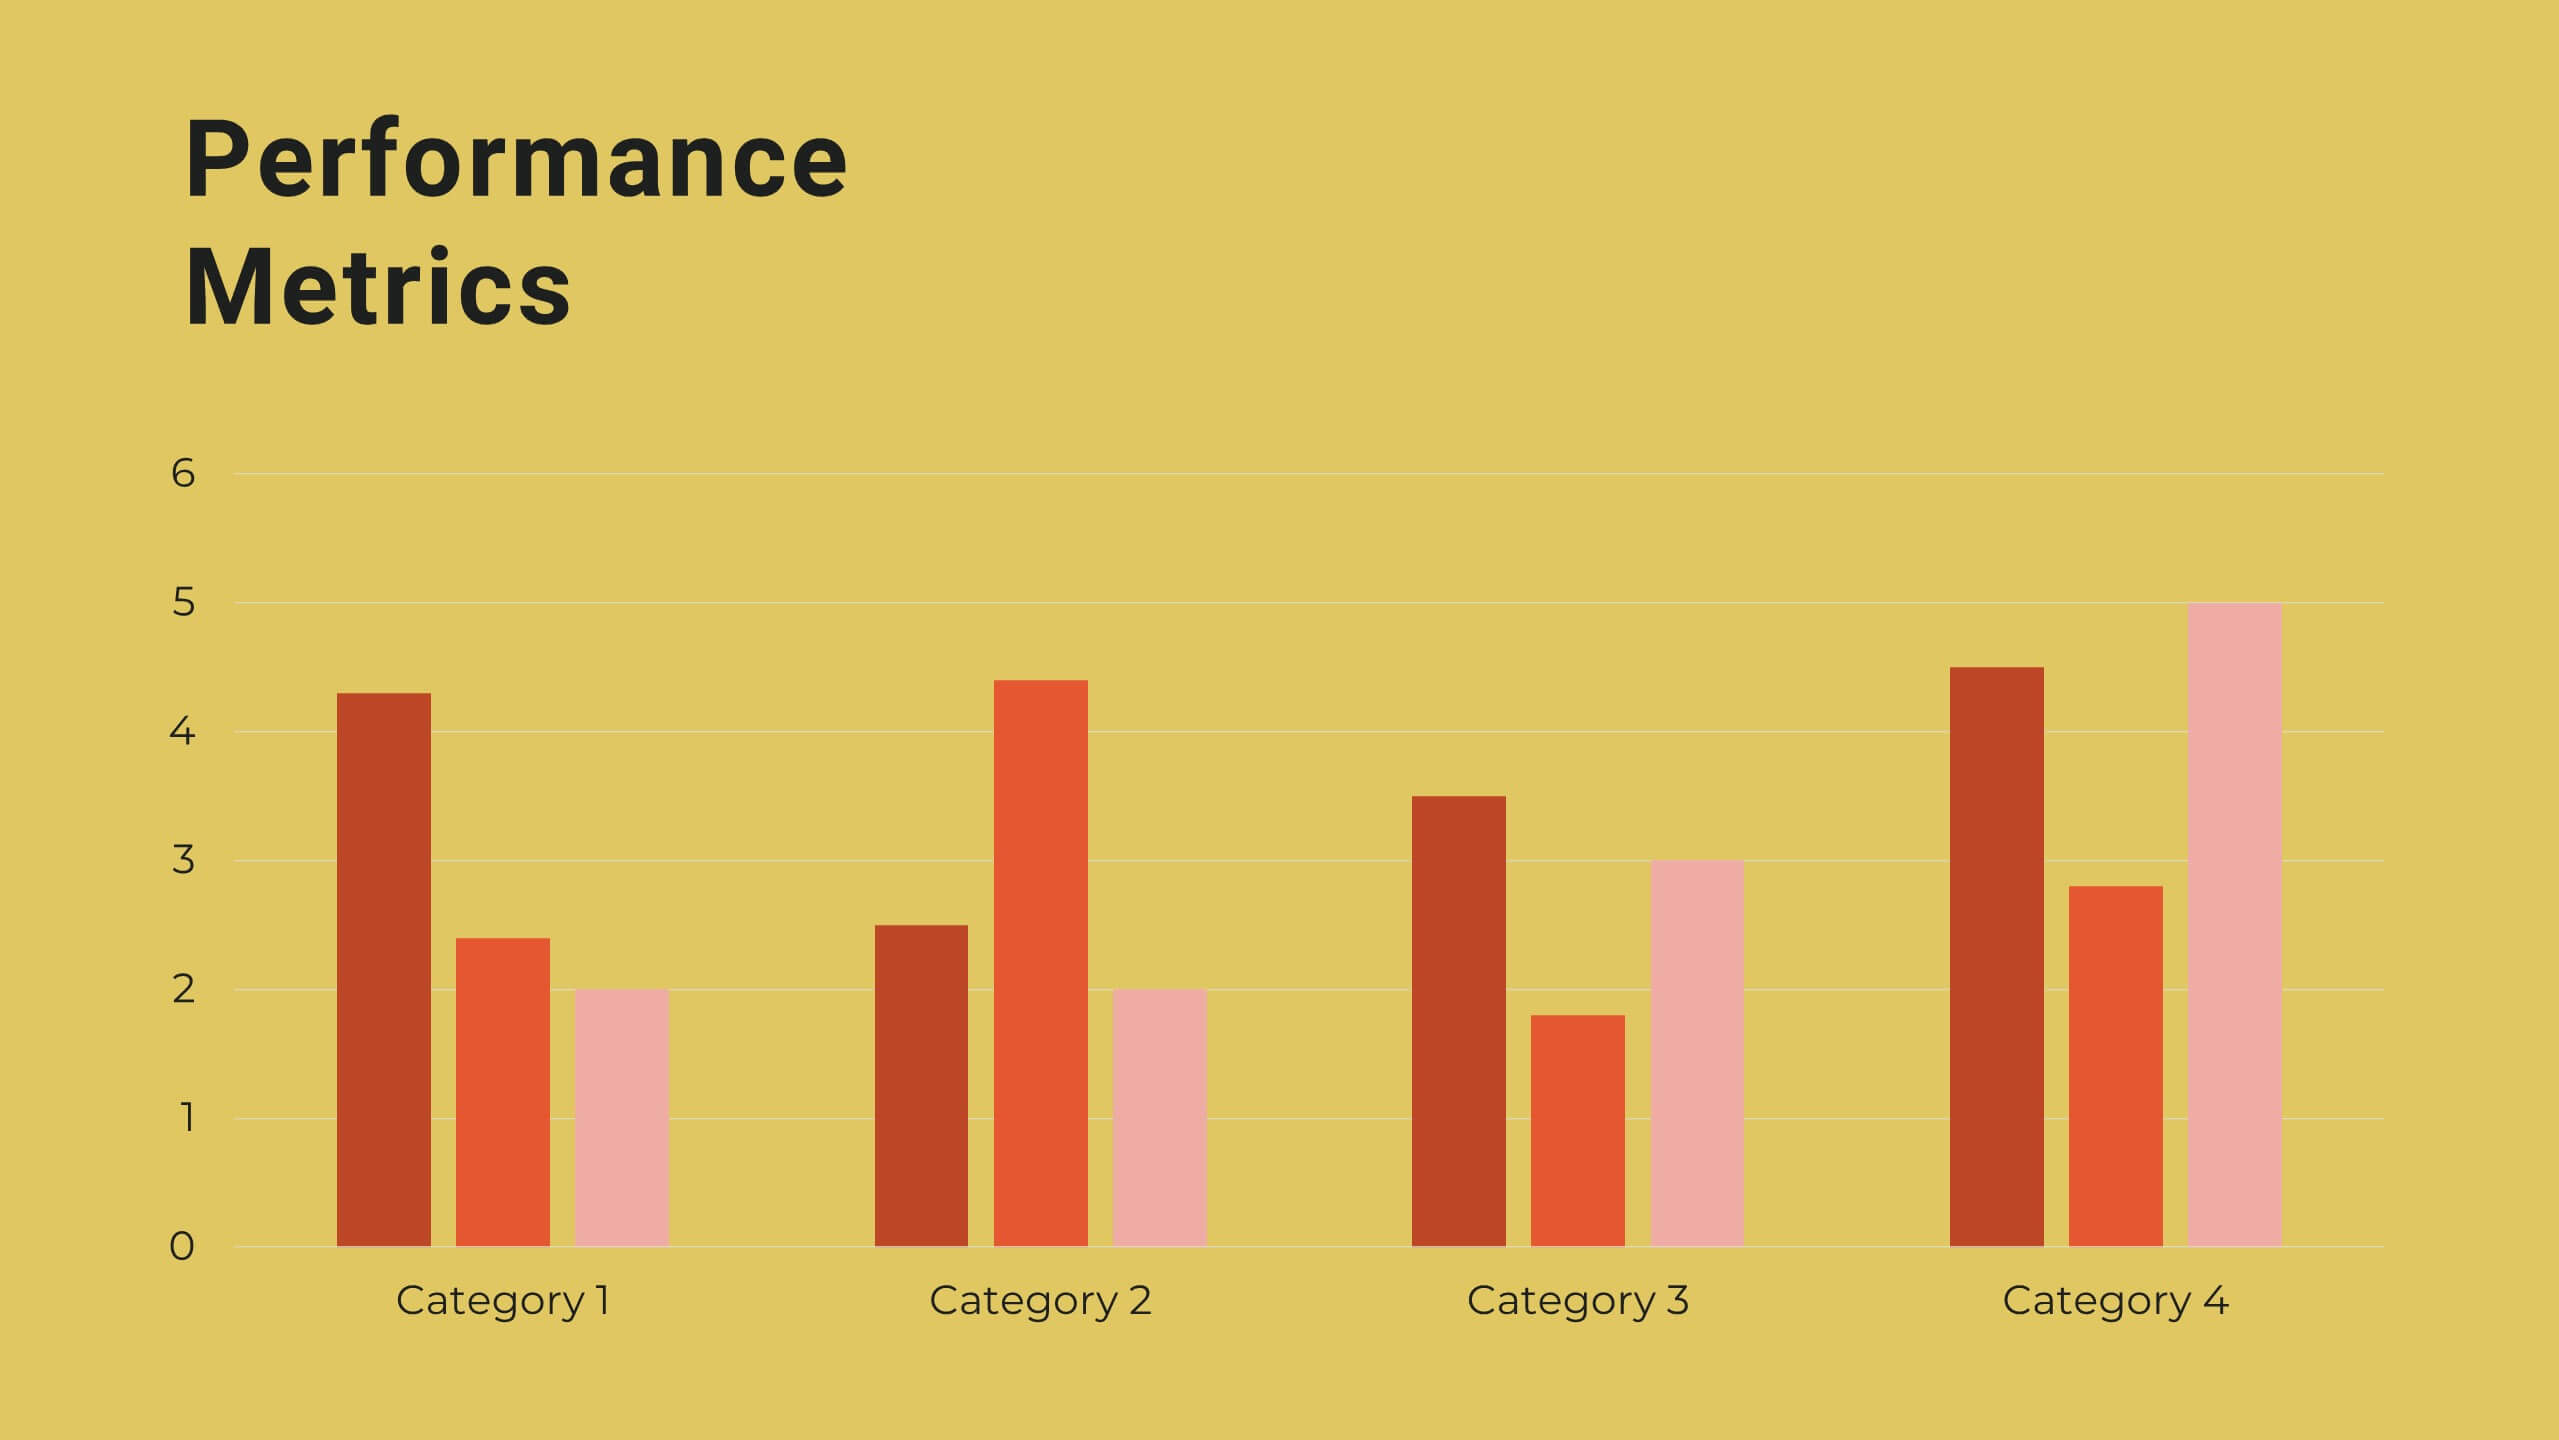
Modern 3D Business Diagram Presentation
Bring your metrics to life with this sleek 3D chart that adds instant dimension to any business presentation. Designed to visualize comparisons or progress across three data sets, this diagram helps you communicate clearly without overloading the slide. Fully compatible with PowerPoint, Keynote, and Google Slides for a seamless workflow.


7 diapositivas
Project Status Infographic Presentation Template
Project status reports are a great way for project managers to track the progress of their projects and identify risks, challenges and opportunities. They can also help stakeholders better understand what’s going on in the project. They are a critical part of the project documentation system. They allow you to monitor the state of your project’s progress, efficiently share information with upper management and help everyone involved understand where things stand. You can use project status reports to guarantee that you have a constant information flow and higher productivity.


5 diapositivas
SWOT Matrix Diagram Presentation
Showcase key business insights with this SWOT Matrix Diagram Presentation. This clear 4-quadrant layout helps visualize your organization's Strengths, Weaknesses, Opportunities, and Threats, making it ideal for strategic planning, competitor analysis, or internal reviews. Each section includes icons and editable text placeholders for easy customization. Fully compatible with PowerPoint, Keynote, and Google Slides.


6 diapositivas
Three-Point Framework Triangle Diagram Presentation
Break down complex strategies with the Three-Point Framework Triangle Diagram template. This visually structured design helps you present key business components in a clear, logical format, making it ideal for decision-making, planning, and analysis. Fully customizable and easy to use, it's compatible with PowerPoint, Keynote, and Google Slides for seamless integration.


6 diapositivas
Money Conversion Infographics
Convert currencies effectively with our Money Conversion infographic template. This template is fully compatible with popular presentation software like PowerPoint, Keynote, and Google Slides, allowing you to easily customize it to illustrate and communicate currency conversion rates and methods. The Money Conversion infographic template offers a visually engaging platform to explain the process of converting one currency to another, including exchange rates, conversion tools, and tips for international travelers or businesses. Whether you're a traveler, finance professional, or anyone dealing with currency exchange, this template provides a user-friendly canvas to create informative presentations and educational materials. Optimize your currency conversion knowledge with this SEO-optimized Money Conversion infographic template, thoughtfully designed for clarity and ease of use. Customize it to showcase currency conversion tools, real-time exchange rate sources, and practical examples, ensuring that your audience gains valuable insights into this important aspect of finance. Start crafting your personalized infographic today to become more proficient in money conversion.


6 diapositivas
Data-Driven Decision Making Presentation
Showcase your data-to-action process with this clean, step-by-step layout. Ideal for illustrating analytics workflows, this template features five connected stages with modern icons and clear labeling. Perfect for business, tech, or strategy presentations. Fully editable in Canva, PowerPoint, and Google Slides to match your branding and communication needs.


21 diapositivas
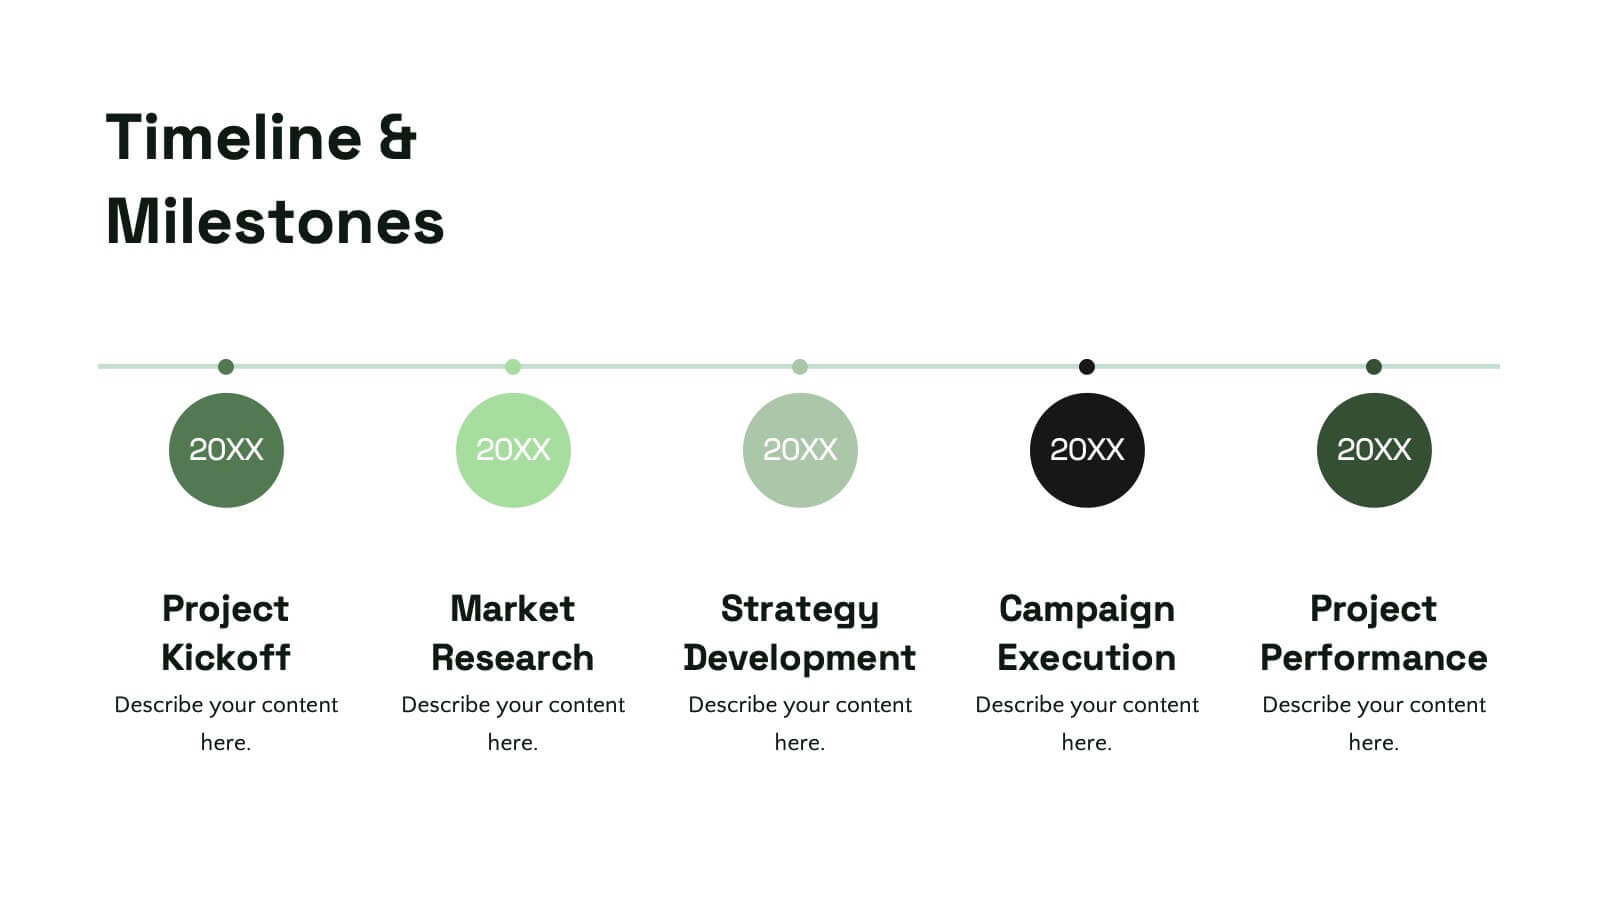
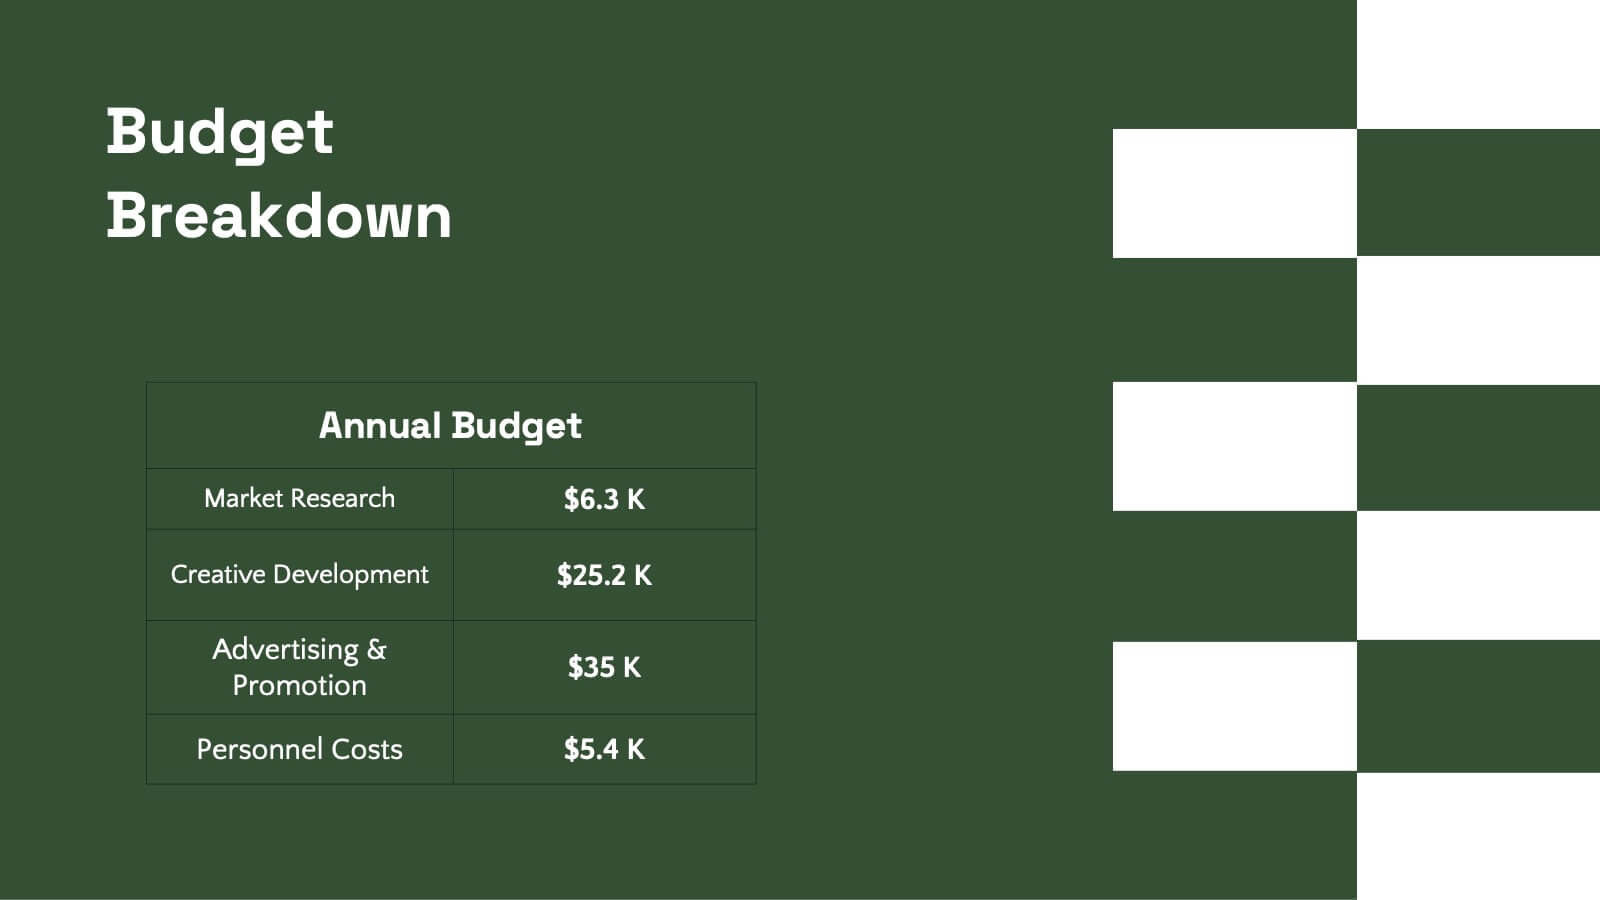
Motionflux Project Milestones Report Presentation
Present project milestones with this structured template, covering objectives, methodology, timeline, budget, resource allocation, and risk management. Ideal for showcasing project progress and planning next steps. Perfect for PowerPoint, Keynote, and Google Slides, this design ensures a professional and clear presentation of key achievements and future plans.


4 diapositivas
Commonly Asked Questions Analysis Presentation
Simplify and clarify key topics using this FAQ-style layout, ideal for addressing top customer or stakeholder questions. With a clean lightbulb design and three-part structure, this template keeps content digestible and professional. Fully editable in Canva, PowerPoint, or Google Slides—perfect for onboarding, reports, or support documentation.


6 diapositivas
Risk Management Jobs Infographics
Our Risk Management Jobs infographic is meticulously crafted for Powerpoint, Keynote, and Google Slides, providing a valuable resource for HR professionals, risk consultants, and corporate trainers. This infographic is designed to delineate various job roles within the risk management field, detailing responsibilities, qualifications, and career paths. The infographic outlines the hierarchy and scope of positions, ranging from entry-level risk analysts to chief risk officers, and includes essential information on the skill sets and expertise required for each role. By presenting this data in a visually engaging format, the infographic simplifies the complexity of risk management career structures. Incorporating this infographic into career development workshops, job fairs, or internal training sessions will enhance understanding of the professional opportunities within risk management. It can also serve as a guide for those looking to advance in the field, providing clarity on the progression and specializations available. Use this infographic to effectively communicate the diverse range of roles and career trajectories in risk management.


6 diapositivas
Business Revenue and Growth Model Presentation
Visualize your business's revenue trajectory and performance gains with this modern Growth Model presentation template. Designed to showcase incremental success, it features clean bar graphics with space for key milestones and KPIs across five growth stages. Perfect for financial reviews, investor updates, or strategy meetings. Compatible with PowerPoint, Keynote, and Google Slides.


6 diapositivas
Business Task and To-Do List Slide
Organize tasks with clarity using this colorful checklist-style layout, perfect for showcasing priorities, timelines, or team responsibilities. With six editable sections and engaging icons, this layout brings structure and visual appeal to business updates or project meetings. Fully customizable in PowerPoint, Keynote, and Google Slides.


6 diapositivas
Problem-Solving with Design Thinking Presentation
Master complex challenges with the Problem-Solving with Design Thinking presentation. This structured layout helps visualize ideas, collaboration, and strategic solutions through an intuitive, professional design. Ideal for workshops, business innovation, and strategic planning. Fully customizable and compatible with PowerPoint, Keynote, and Google Slides for a seamless experience.


12 diapositivas
Effective Decision-Making with RAPID Presentation
Unlock streamlined decision-making with the Effective Decision-Making with RAPID template, a comprehensive guide designed to help organizations enhance and clarify their decision-making processes. Covering the key phases: Recommend, Agree, Perform, Input, and Decide, this template is essential for teams looking to optimize operational efficiency. Ideal for a variety of business environments, it is compatible with PowerPoint, Keynote, and Google Slides, offering versatility and ease of use for professionals.

19 diapositivas
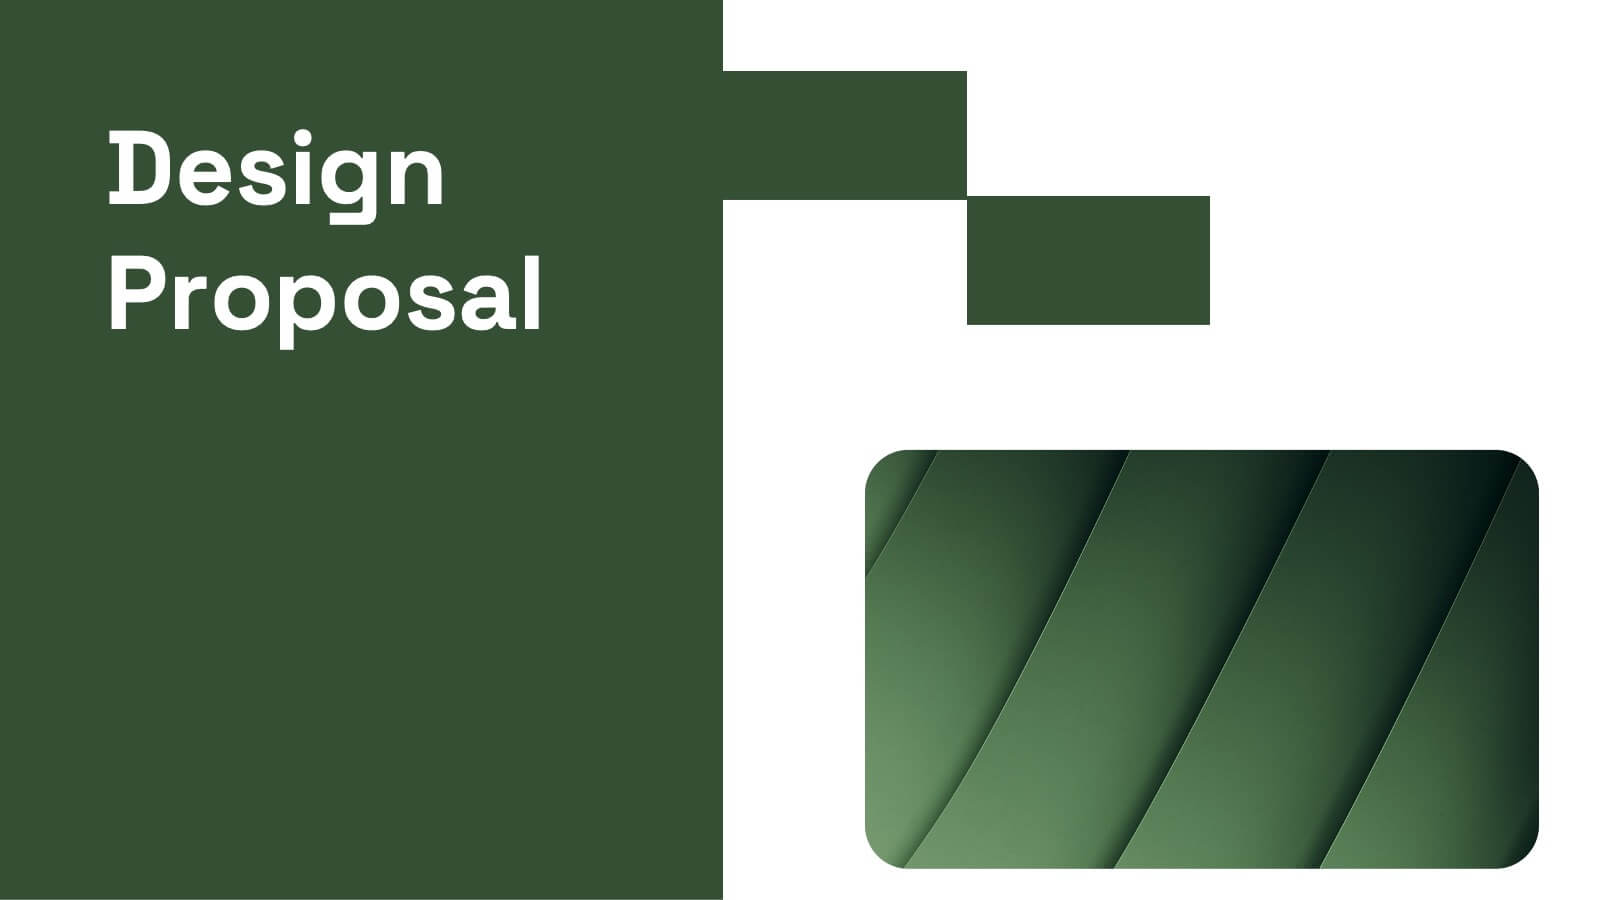
Tidal Design Proposal Presentation
Elevate your pitch with this sleek design proposal template! Perfect for presenting project details, objectives, methodology, and milestones, it ensures your ideas stand out. Impress stakeholders with clear, structured slides and professional aesthetics. Compatible with PowerPoint, Keynote, and Google Slides for a seamless presentation experience across all platforms.


8 diapositivas
Investor Business Plan Presentation
The "Investor Business Plan Presentation" template is innovatively designed to illustrate the balance and interdependence of various business elements critical for attracting investors. Utilizing a seesaw mechanism as a metaphor, this template vividly demonstrates how key aspects like Partners, Resources, Activities, and Channels contribute to maintaining a stable and functional business model. Each section of the seesaw is colored differently to distinguish between the categories, providing a clear visual hierarchy. This presentation format is excellent for startups and existing businesses preparing to pitch to investors, highlighting how each strategic component is vital for overall success and stability in the market.