


Características


¿Tienes alguna pregunta?
Recomendar


30 diapositivas
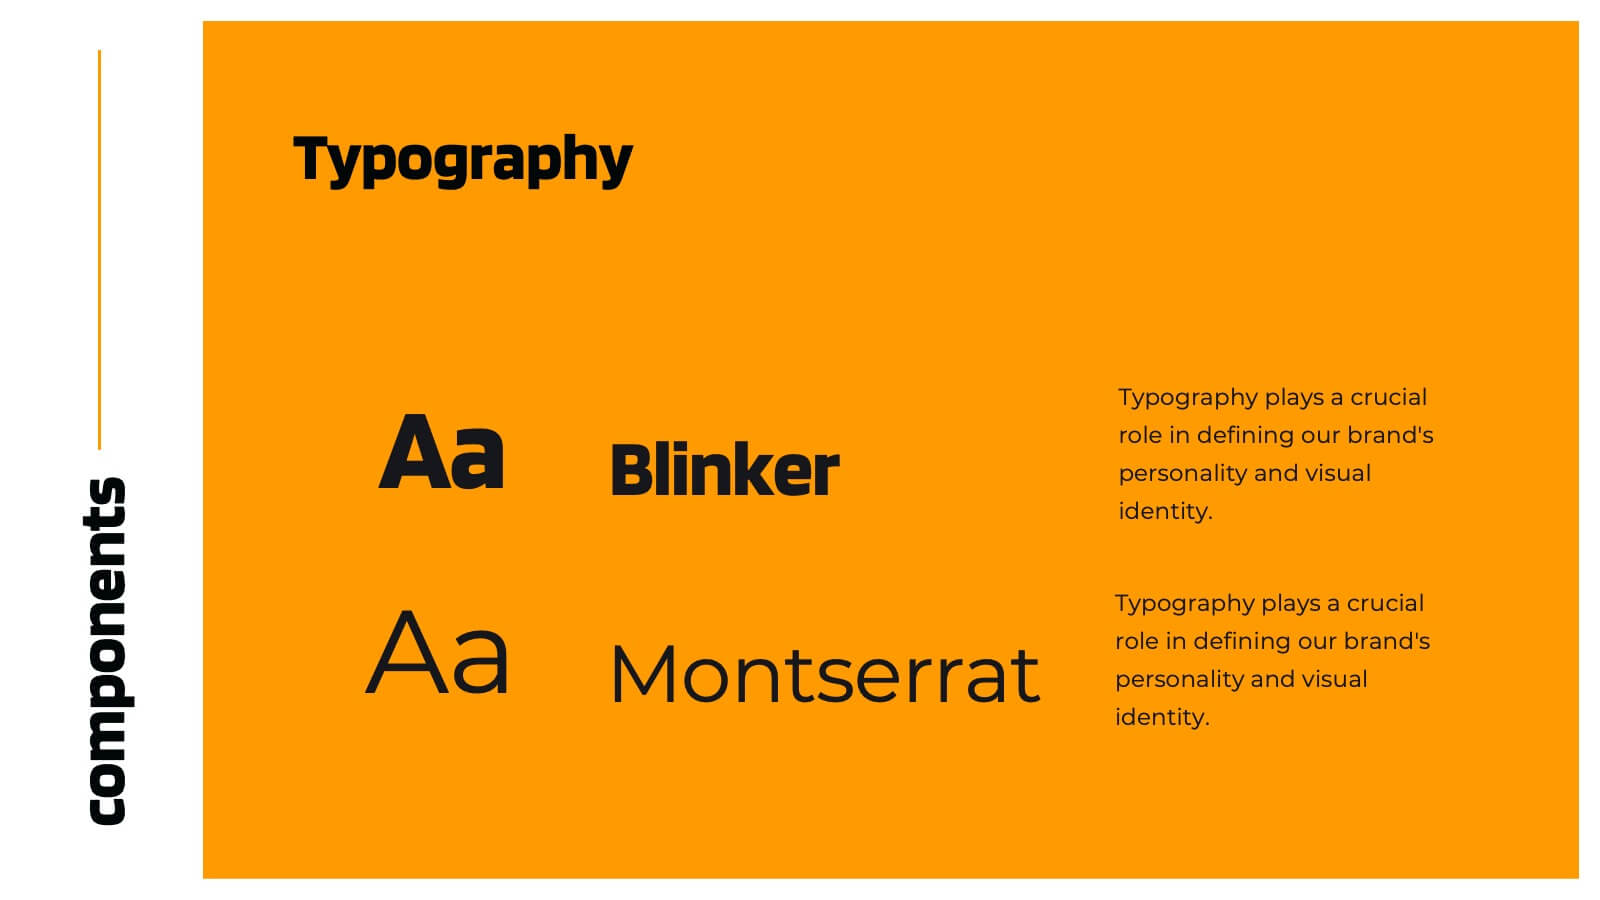
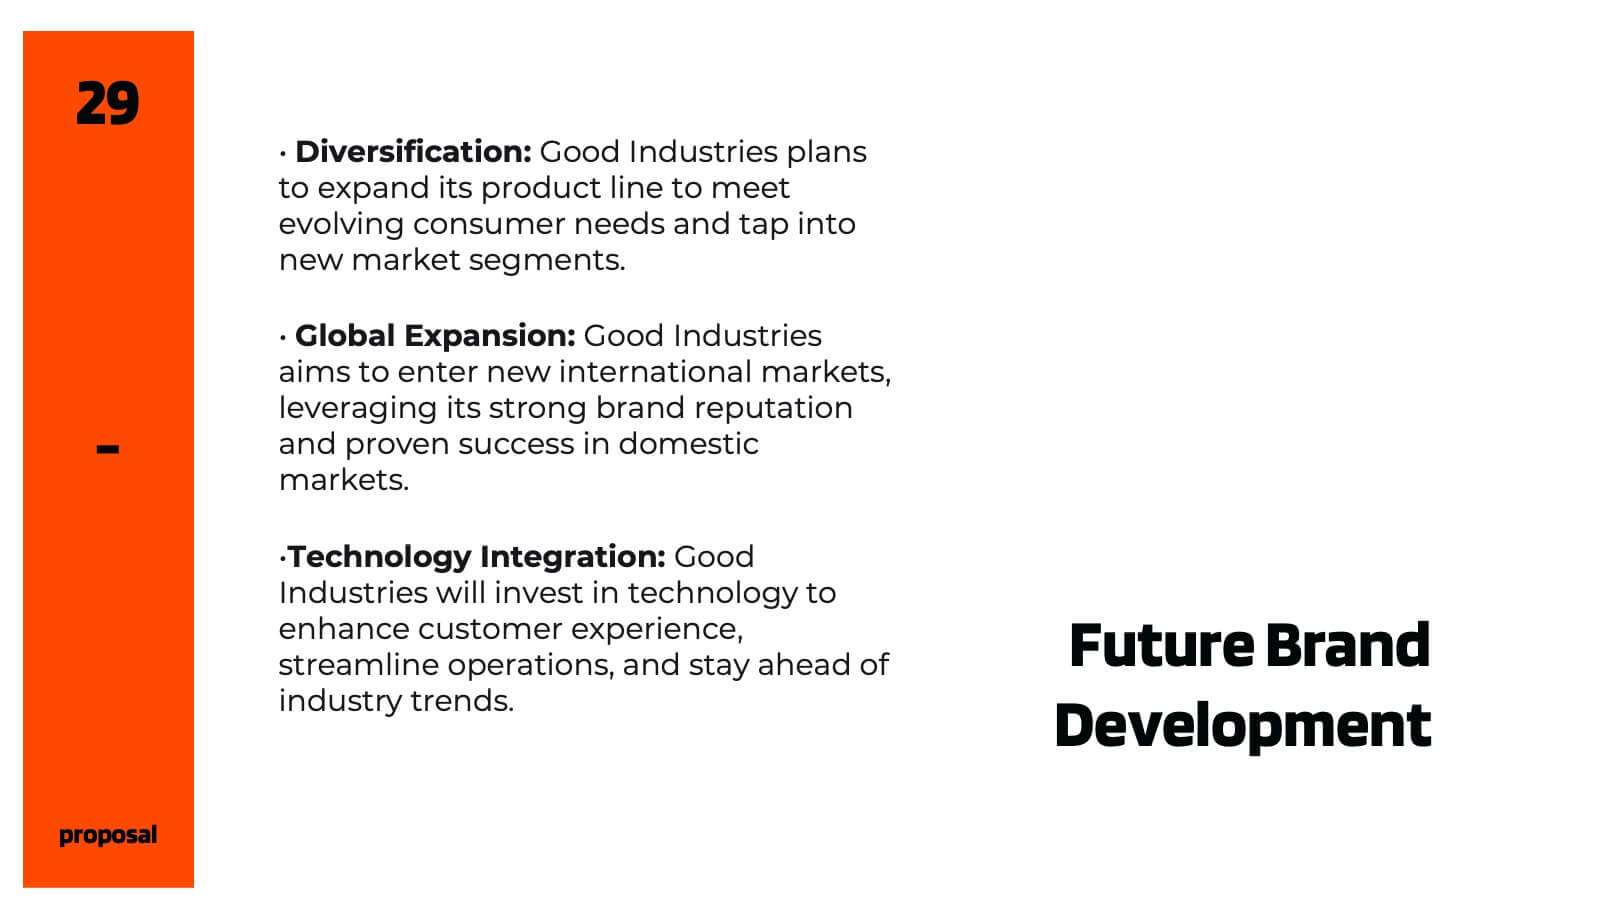
Chromalight Brand Guidelines Proposal Presentation
Elevate your brand's story with this visually engaging presentation template that embodies modern, professional aesthetics. From mission and vision statements to brand identity and market positioning, each slide is crafted to showcase your brand's core essence. Ideal for brand strategists and marketers, this template is compatible with PowerPoint, Keynote, and Google Slides.


6 diapositivas
Social Science Infographics
The "Social Science" infographic template is an intellectually stimulating and visually engaging tool, thoughtfully designed for PowerPoint, Keynote, and Google Slides. This template is a brilliant resource for educators, researchers, and students who seek to present the multifaceted aspects of social sciences in a clear and compelling manner. This template skillfully encompasses various disciplines within social science, such as anthropology, sociology, psychology, and political science. It presents key theories, methodologies, and findings in an organized and digestible format. This makes it an invaluable aid for academic presentations, research proposals, or educational discussions, facilitating a deeper understanding of human society and social relationships. The design is as thought-provoking as the subject it represents, with a color scheme that stimulates intellectual curiosity while maintaining clarity and focus. This not only enhances the visual appeal of the presentation but also complements the analytical and reflective nature of social science. Whether used in a lecture hall, a conference, or a study group, this template ensures that the complex world of "Social Science" is presented in an engaging, informative, and visually captivating manner.


23 diapositivas
Echo Startup Pitch Deck Template Presentation
This sleek pitch deck template is perfect for showcasing your startup’s potential. Highlight your problem, solutions, revenue model, and unique value proposition in a professional format. It's fully customizable, easy to use, and compatible with PowerPoint, Keynote, and Google Slides, making it ideal for impressing investors.


3 diapositivas
Stock Market Performance Overview Presentation
Showcase financial growth like a pro with this clean, data-driven layout designed to visualize performance, market activity, and business progress over time. Ideal for professionals presenting key financial trends, metrics, or strategies. Fully compatible with PowerPoint, Keynote, and Google Slides for easy customization and professional presentation results.


5 diapositivas
Business Growth Cycle Presentation
Illustrate your company’s journey with the Business Growth Cycle slide. This dynamic layout features four sleek arrow segments that represent each phase of growth—from initiation to expansion. Color-coded steps and minimalist icons help guide the audience through your strategy clearly and efficiently. Ideal for outlining roadmaps, business stages, or workflow transitions. Fully editable and compatible with PowerPoint, Keynote, and Google Slides.


5 diapositivas
Easy Homemade Recipes Infographics
Introducing our Easy Homemade Recipes Infographics, these are graphic representations of simple and delicious recipes that can be made at home. These vibrant vertical infographics provide a step-by-step guide to creating tasty meals and snacks using ingredients that are readily available. This template includes detailed instructions for preparing the dishes, as well as the ingredients needed and the cooking time required. They are designed to be visually appealing, with colorful illustrations and fully editable easy-to-read text. These are perfect for anyone looking to learn new recipes or expand their culinary skills!


6 diapositivas
Business Decision Venn Diagram Presentation
Make complex decision-making simple and visually impactful with this Business Decision Venn Diagram Presentation. Featuring a bold triangular layout with six segmented areas, this slide is ideal for presenting overlapping factors, interconnected strategies, or priority zones. Perfect for business planning, competitive analysis, or project evaluation. Fully editable in PowerPoint, Keynote, and Google Slides for seamless integration into your presentations.


4 diapositivas
Veterinary Services and Animal Care Presentation
Deliver professional insights with compassion using the Veterinary Services and Animal Care presentation. This slide features a clean, pet-centered illustration layout ideal for showcasing services such as treatment, grooming, preventive care, and boarding. Each section includes editable icons and placeholder text, making it easy to customize for veterinary clinics, pet hospitals, or animal wellness campaigns. Fully compatible with PowerPoint, Keynote, and Google Slides.
5 diapositivas
Feedback Rating Smile Icons Presentation
Light up your presentation with a playful visual that turns audience feedback into clear, colorful insights. This slide helps you compare ratings, highlight sentiment patterns, and present review data in a friendly, memorable way. Perfect for surveys, reports, and performance reviews. Fully compatible with PowerPoint, Keynote, and Google Slides.


6 diapositivas
Business Milestone Roadmap
Visualize key achievements and future goals with this dynamic Business Milestone Roadmap. Perfect for project planning, annual reviews, or startup timelines, this layout walks through five key years or phases with clear markers and icons. Fully editable in PowerPoint, Keynote, and Google Slides.


8 diapositivas
Business Funding Pitch Deck
Present your growth story with confidence using this bold and engaging Funding Pitch Deck slide. Designed with vibrant visuals, key funding milestones, and clean icons, it's perfect for showcasing your business’s financial traction. Fully editable in PowerPoint, Keynote, and Google Slides for versatile startup presentations.


6 diapositivas
Consumer Psychology in Marketing Presentation
Unlock the secrets of customer behavior with our 'Consumer Psychology in Marketing' presentation template. Tailored for marketing professionals, this template allows you to visually dissect and present consumer insights and behaviors. Engage your audience with compelling content that's perfect for workshops or client presentations, compatible with PowerPoint, Keynote, and Google Slides.


6 diapositivas
Circular Concept Diagram for Strategy Presentation
Visualize interconnected ideas with this circular concept diagram, ideal for showcasing six key strategic pillars or processes. Each segment is clearly labeled and icon-supported, creating an easy-to-follow layout. Perfect for business planning, marketing strategies, or organizational models. Compatible with PowerPoint, Keynote, and Google Slides for full customization.


7 diapositivas
Frequently Asked Question (FAQ) Guide Infographic
Unravel the art of answers with our "FAQ Guide" Infographic Template—your next step in revolutionizing how you communicate with curious customers. With its bold, eye-catching design, this template turns the routine task of answering questions into an engaging experience. Dive into a layout that blends vibrant visuals and crisp, clear typography to ensure your answers not only catch the eye but also stick in the mind. Whether you're in tech, retail, or any service-oriented industry, our template flexes to fit your brand’s unique flair. Customize with your colors, integrate your style, and transform your customer service into an impressive visual journey. Perfect for websites, marketing materials, or quick training sessions, this template makes information fun and accessible. Equip your team with the tools to engage, enlighten, and excite with every FAQ presented. Compatible with all leading graphic design software, it's ready to go whenever you are.


21 diapositivas
Werewolf Scientific Research Presentation
This scientific research presentation template is designed to streamline your research findings with clarity and precision. It features sections for literature review, methodology, data analysis, and key results, ensuring every detail is communicated effectively. Perfect for academic or scientific contexts, it’s fully customizable in PowerPoint, Keynote, and Google Slides.


20 diapositivas
Trend Report Presentation
Navigate the latest market developments with this Trend Report presentation template. Perfect for displaying current marketing trends, consumer behavior, and future predictions, this vibrant template includes slides for social media strategies, influencer marketing, and more. Fully compatible with PowerPoint, Keynote, and Google Slides, it’s ideal for professionals looking to stay ahead in dynamic industries.


4 diapositivas
Personal Finance and Money Management Presentation
Effectively present Personal Finance and Money Management insights with this clean and professional slide template. Designed with a minimalist stopwatch infographic, this template helps visualize key financial principles like budgeting, saving, and investing. Fully customizable with editable text, colors, and icons, it’s perfect for business reports, financial workshops, or personal finance presentations. Compatible with PowerPoint, Keynote, and Google Slides for seamless editing.