


Características


¿Tienes alguna pregunta?
Recomendar


6 diapositivas
5-Step SEO Marketing Funnel Presentation
Ignite your marketing story with a bold, flowing visual that makes every step feel purposeful and easy to follow. This presentation breaks down each stage of the SEO funnel, helping you explain strategy, performance, and conversion paths with clarity. Fully compatible with PowerPoint, Keynote, and Google Slides.


6 diapositivas
IT Architecture Diagram Presentation
Turn complex system structures into clear visual stories with this professional presentation. Perfect for mapping processes, software layers, or organizational workflows, it helps communicate how technology components connect and operate. Fully editable and compatible with PowerPoint, Keynote, and Google Slides for seamless customization and engaging technical presentations.


5 diapositivas
Operational Workflow Process Chart Presentation
Streamline your operations with the Operational Workflow Process Chart Presentation. This template provides a clear visual layout to map out step-by-step processes, helping teams align on roles, timelines, and dependencies. Perfect for training, reporting, or system audits—fully customizable in PowerPoint, Canva, and Google Slides.


6 diapositivas
Workforce Skills Gap Assessment Presentation
Identify, visualize, and address talent gaps with the Workforce Skills Gap Assessment Presentation. This template helps you clearly communicate current capabilities versus future needs across departments or teams. Perfect for HR leaders, L&D strategists, and organizational planners. Fully customizable in PowerPoint, Keynote, Canva, and Google Slides.


22 diapositivas
SEO Report Presentation
Optimize your SEO strategies using our comprehensive SEO Report template. It includes sections for keyword performance, market trends, competitor insights, and client feedback. Tailored for digital marketers and SEO specialists, this template supports presentations in PowerPoint, Keynote, and Google Slides.


26 diapositivas
Protecting Your Digital Assets with Cybersecurity Presentation Template
Safeguard your digital world with this sleek and professional presentation on protecting your digital assets with cybersecurity! This template is designed to simplify complex concepts while showcasing the importance of online safety, data protection, and risk management. Featuring modern layouts, detailed infographics, and customizable charts, it’s ideal for exploring cybersecurity strategies, emerging threats, or best practices for organizations and individuals. The polished design, complete with high-tech visuals and a calming color palette, ensures your audience stays engaged while absorbing critical information. Perfect for IT professionals, educators, or businesses, this template is fully compatible with PowerPoint, Keynote, and Google Slides, making it an essential tool for impactful presentations.


6 diapositivas
System Maintenance and Support Presentation
Streamline your technical processes with the System Maintenance and Support Presentation. This slide features a clean alphabetical list layout (A–E) paired with icons and concise text areas—ideal for illustrating maintenance protocols, support categories, or troubleshooting stages. The right-side wrench graphic adds a visual metaphor for IT upkeep. Fully editable in PowerPoint, Keynote, and Google Slides.


4 diapositivas
Emerging AI Applications in Business
Showcase innovation with clarity using the Emerging AI Applications in Business Presentation. This sleek 4-step layout features modern icons and a profile-style AI illustration, perfect for outlining use cases such as automation, data insights, machine learning, or cloud-based AI solutions. Ideal for tech-driven strategy decks, startup pitches, or digital transformation briefings. Fully editable in PowerPoint, Keynote, and Google Slides.


4 diapositivas
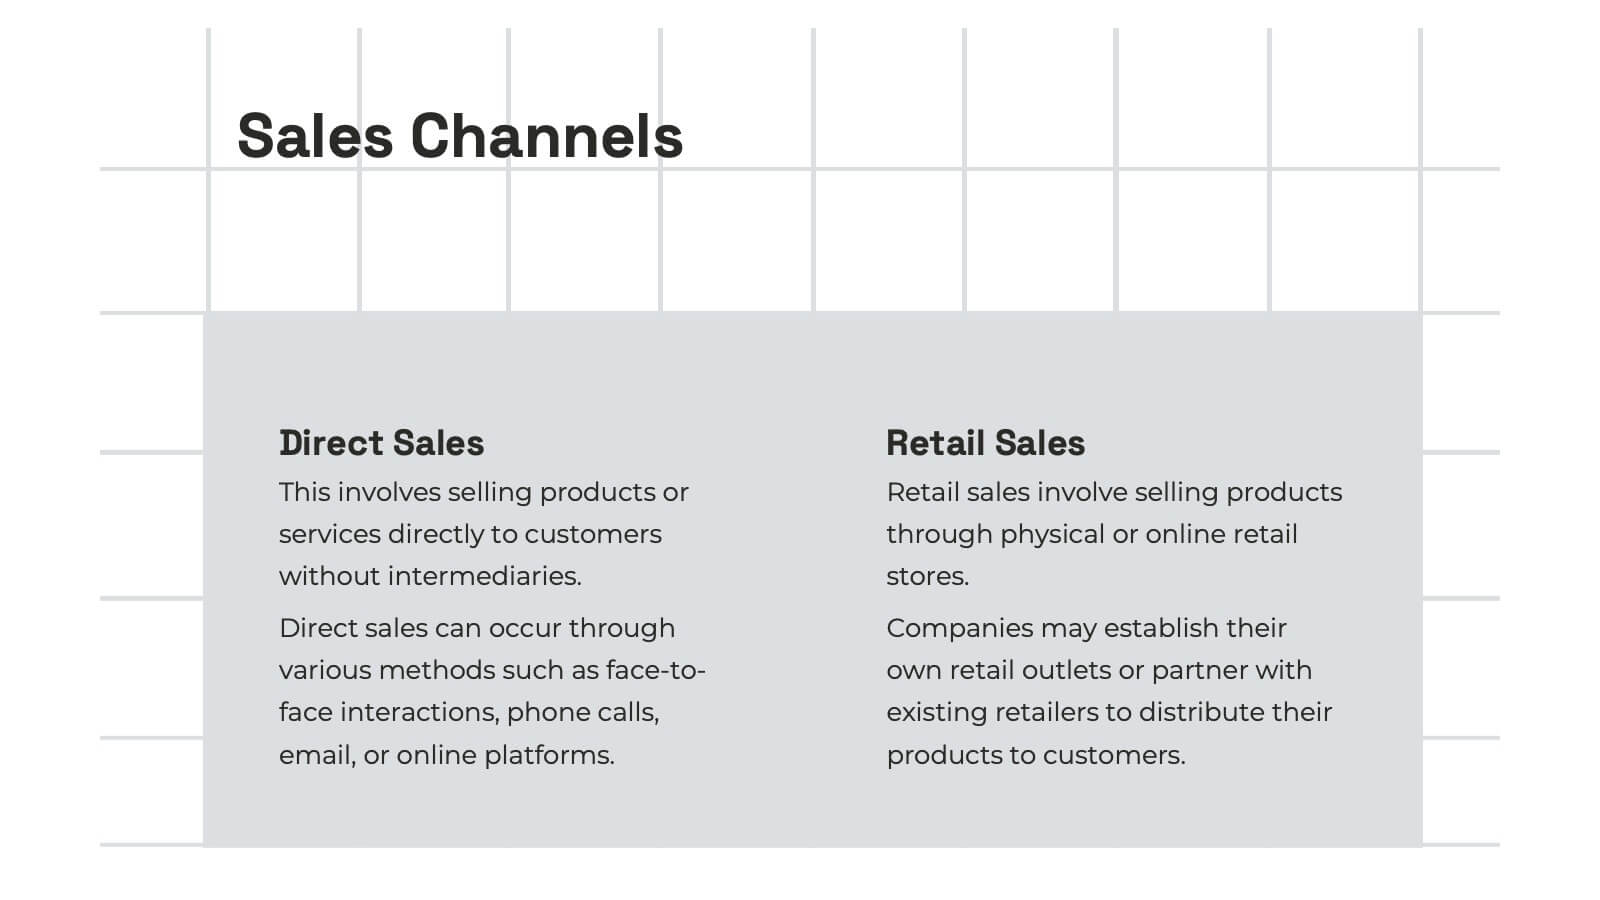
Products Comparison Table Presentation
Make your decision-making story instantly clear with a bold visual that balances options in a clean, modern way. This presentation helps you compare features, weigh benefits, and highlight key differences using simple graphics and intuitive labeling. Fully compatible with PowerPoint, Keynote, and Google Slides.


4 diapositivas
Oceania Business Growth Opportunities Map Presentation
Highlight key business locations across Oceania with this clean and modern map slide. Featuring pinpoint icons and four customizable title areas, it’s ideal for showcasing market entry points, regional offices, or investment zones. Fully editable in PowerPoint, Keynote, and Google Slides for seamless business planning and strategic presentations.


6 diapositivas
Decision Tree Diagrams Presentation
Turn complex choices into clear, visual stories with this clean and modern template. Perfect for illustrating outcomes, decision paths, or process options, it helps you communicate strategy and logic with confidence. Fully customizable and compatible with PowerPoint, Keynote, and Google Slides for seamless professional presentations.


8 diapositivas
Beginner's Guide to Stock Market Presentation
Turn complex financial ideas into simple, engaging visuals with this sleek, data-driven design. Perfect for explaining market basics, investment growth, and trading concepts in a way that’s easy to follow and visually appealing. Fully compatible with PowerPoint, Keynote, and Google Slides for effortless editing and presentation customization.


10 diapositivas
Corporate Growth Strategy Presentation
Elevate your corporate presentations with our "Corporate Growth Strategy Presentation" template. Designed to visually represent key growth strategies, this infographic uses a wrench graphic to symbolize the tools necessary for business expansion. Each segment of the wrench is color-coded, highlighting different strategic elements clearly and effectively. This format aids in discussing business objectives systematically, from foundational practices to advanced goals. Ideal for executives, strategists, and business analysts, this template ensures professional and coherent delivery of complex strategies. Compatible with PowerPoint, Keynote, and Google Slides, it is an indispensable tool for articulating and presenting sophisticated corporate strategies.


7 diapositivas
Business Pricing Table Slides Infographic
Streamline your product offerings with our Business Pricing Infographic, designed to clearly present pricing tiers and package options. This infographic is essential for sales teams, marketing professionals, and business owners to communicate value propositions to potential customers. Our Business Pricing Infographic allows for a clean, comparative view of different pricing plans, showcasing features, benefits, and cost-effectiveness at a glance. It includes customizable sections for various packages, making it easy to distinguish between basic, standard, and premium options. With this tool, you can highlight key differences and unique selling points of each package, aiding customers in making informed purchasing decisions. This SEO-friendly infographic is crafted to attract and educate potential buyers, providing them with transparent pricing information. Adopt this infographic in your marketing materials to facilitate a straightforward shopping experience, helping customers choose the right product that fits their needs and budget.


22 diapositivas
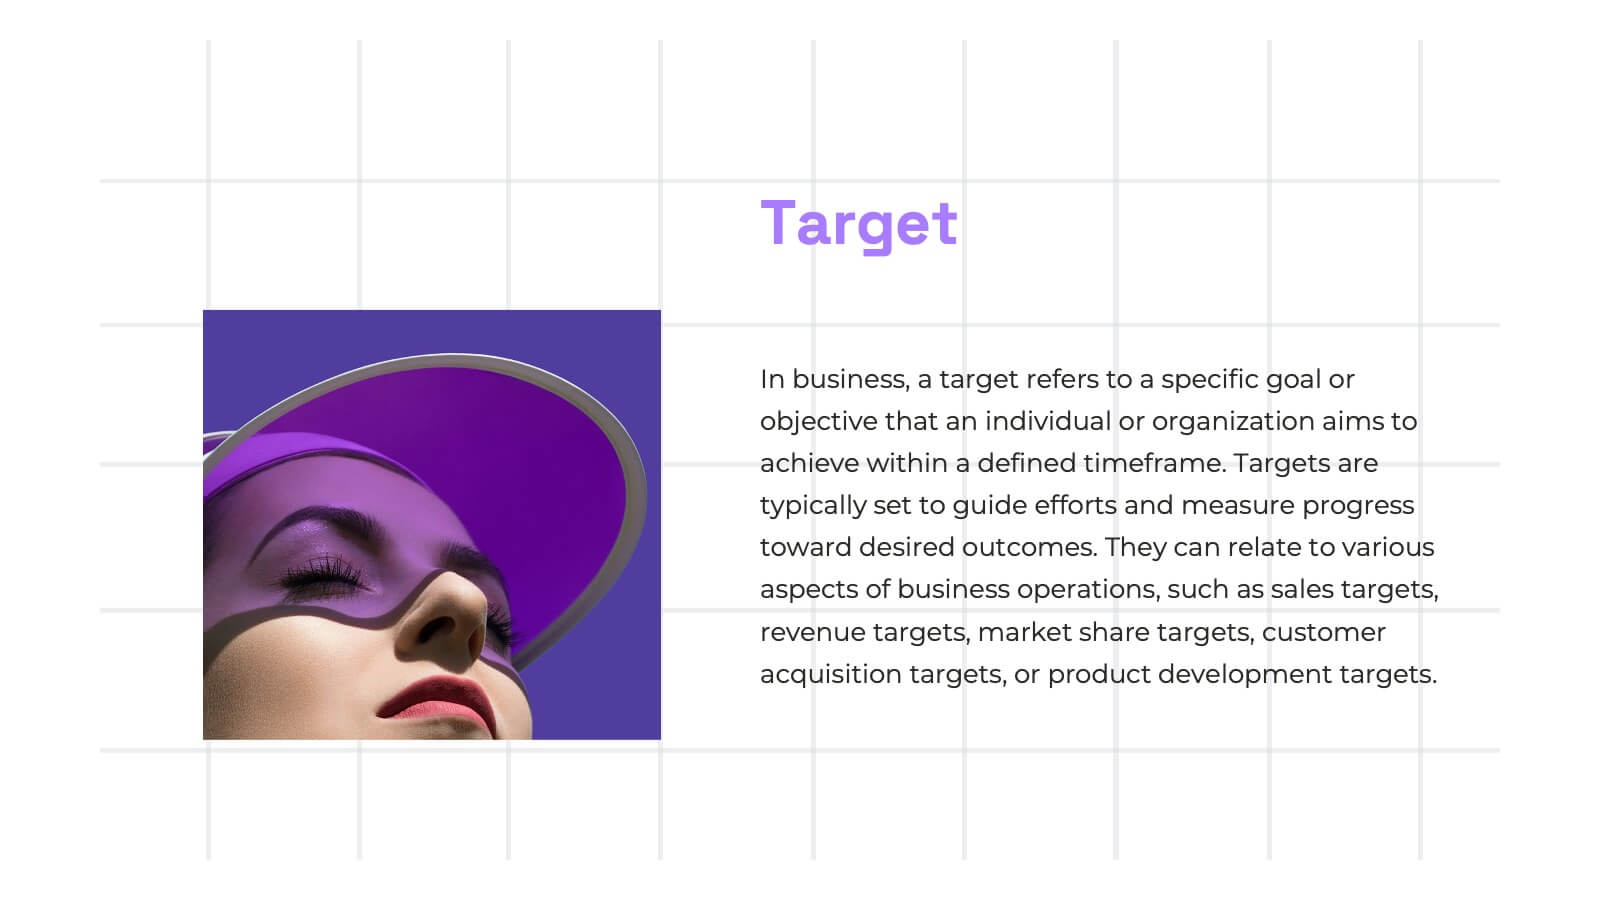
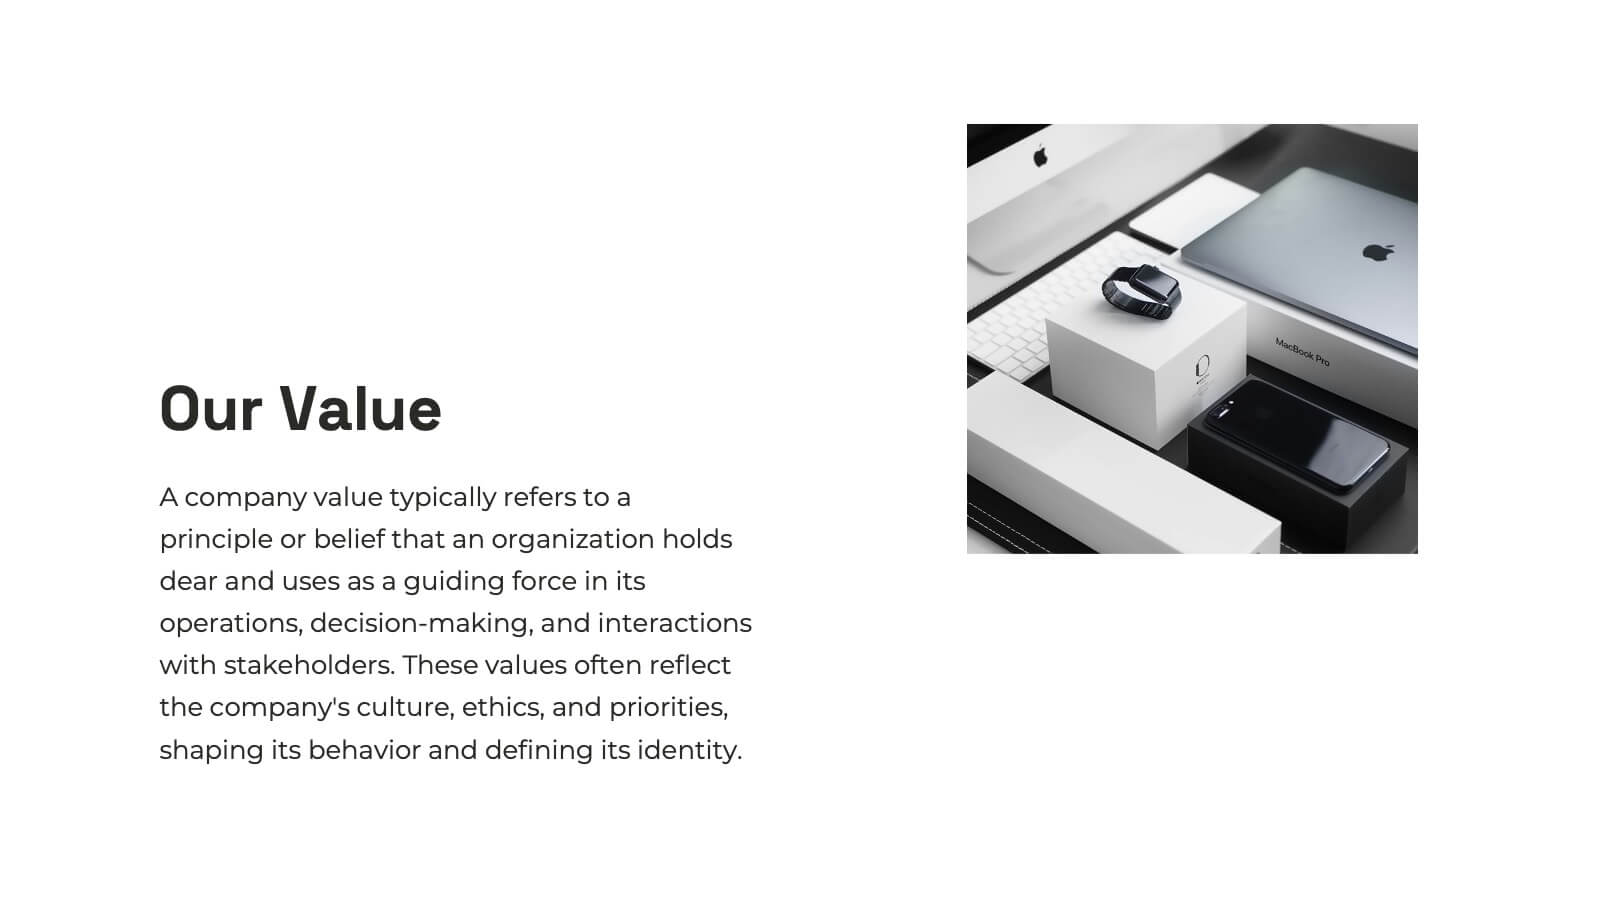
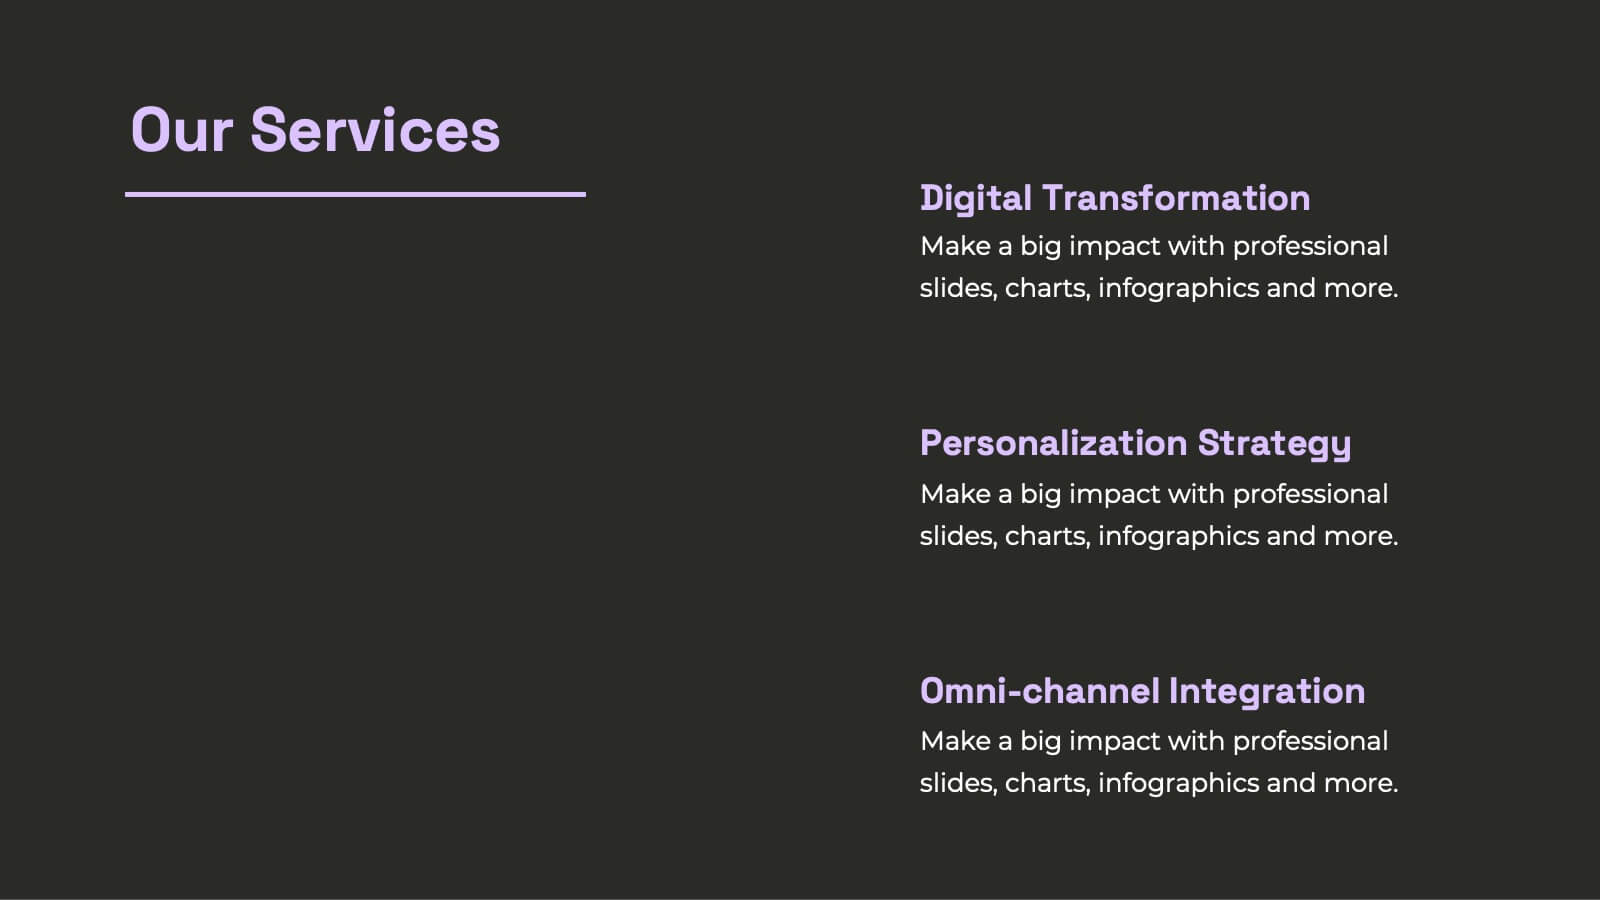
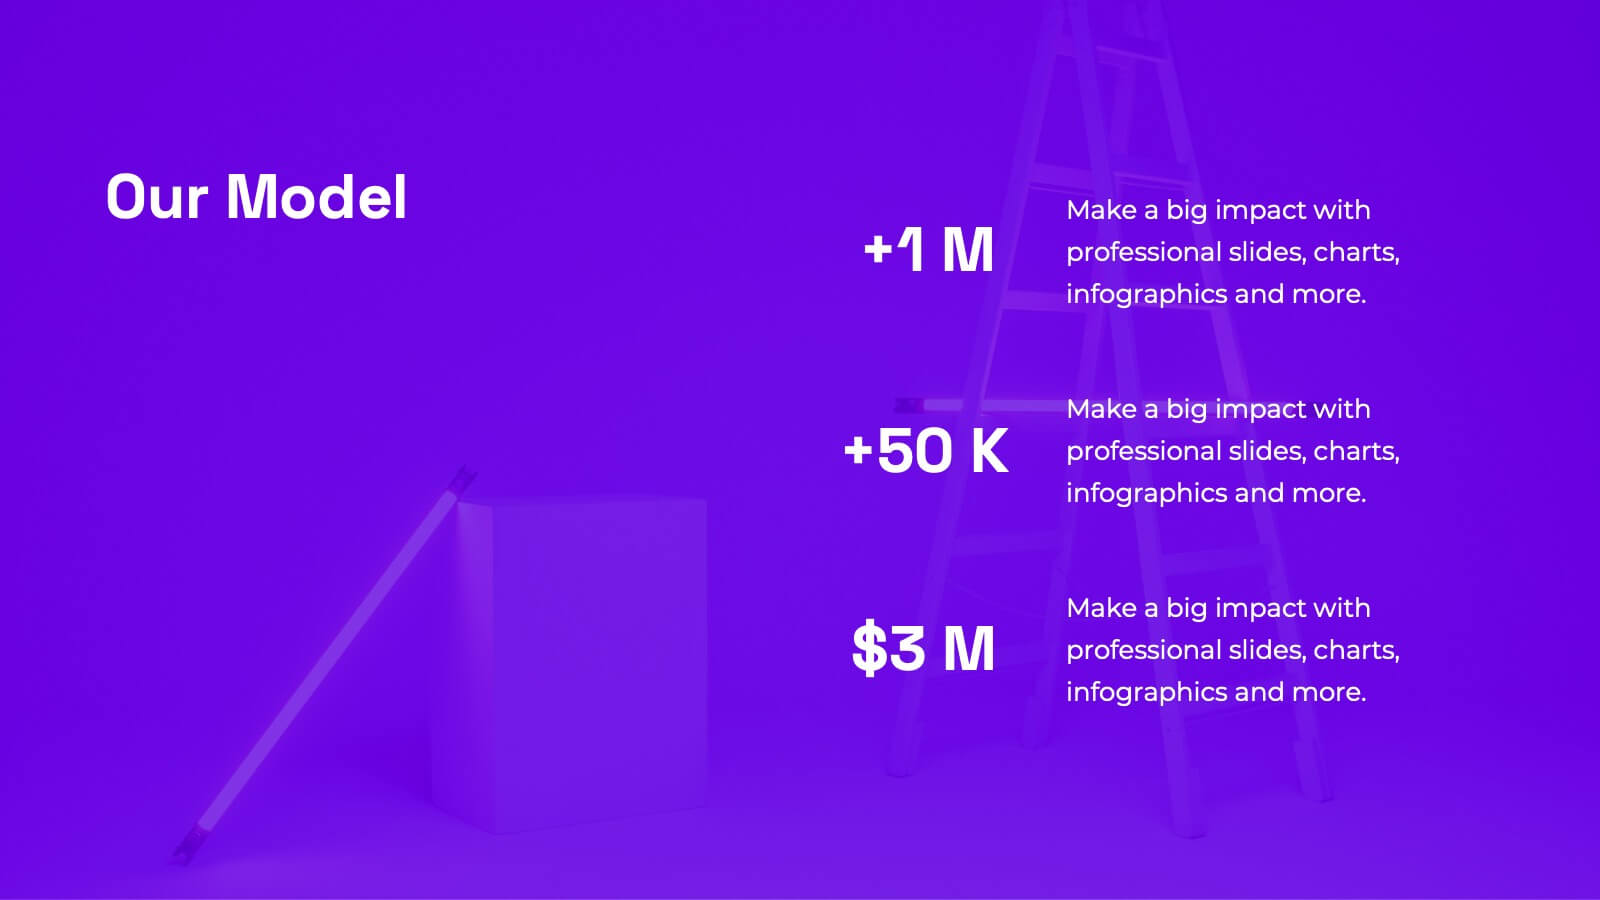
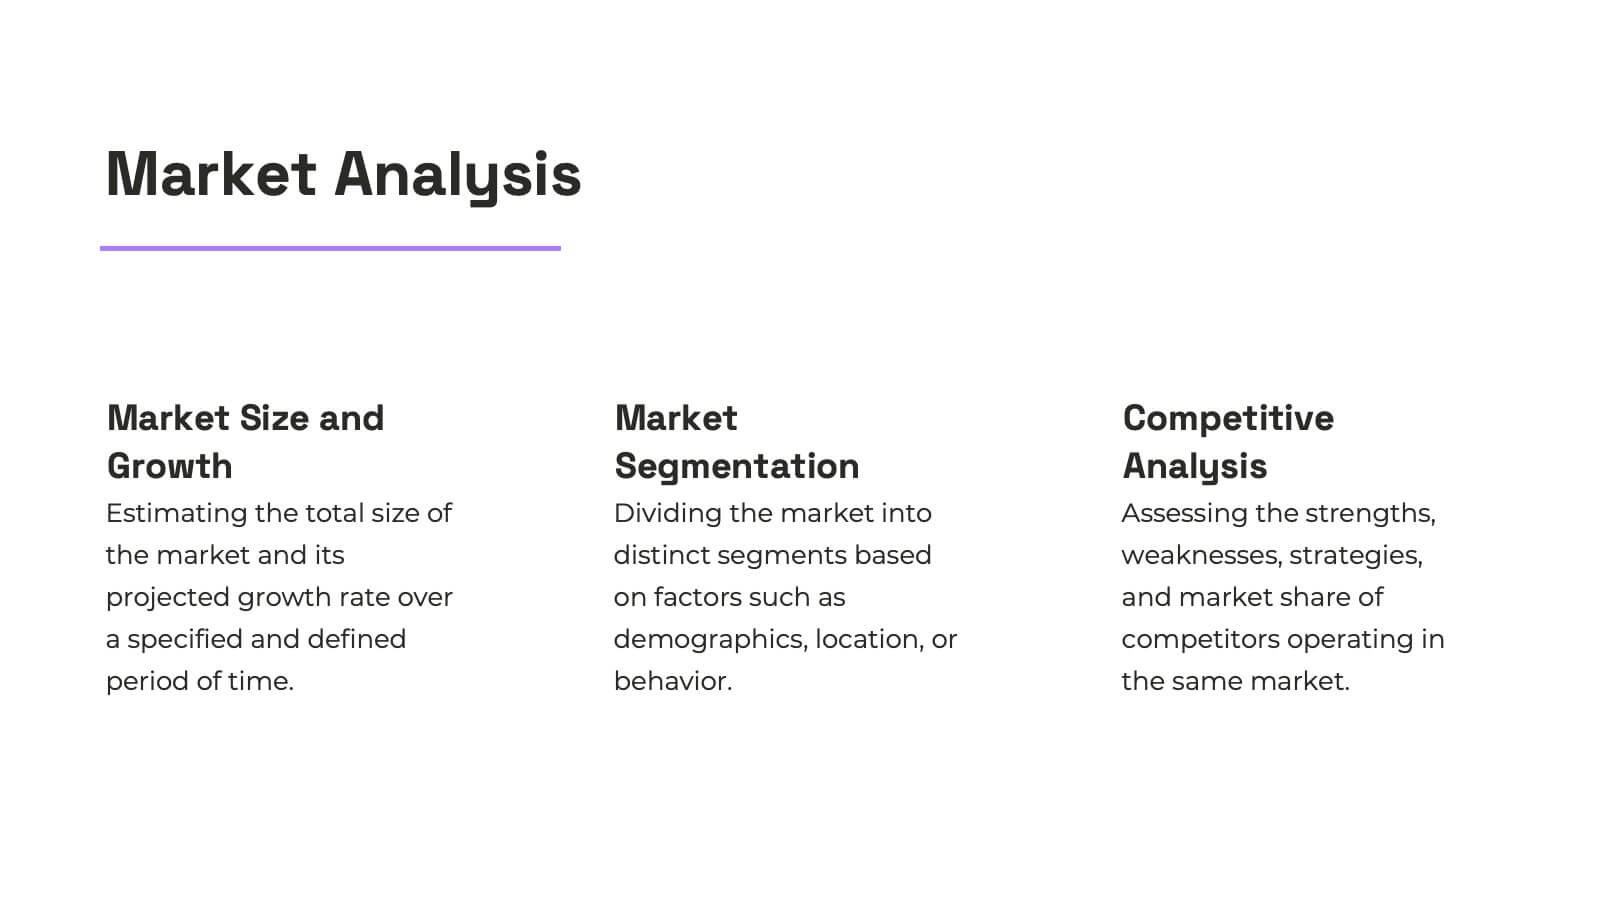
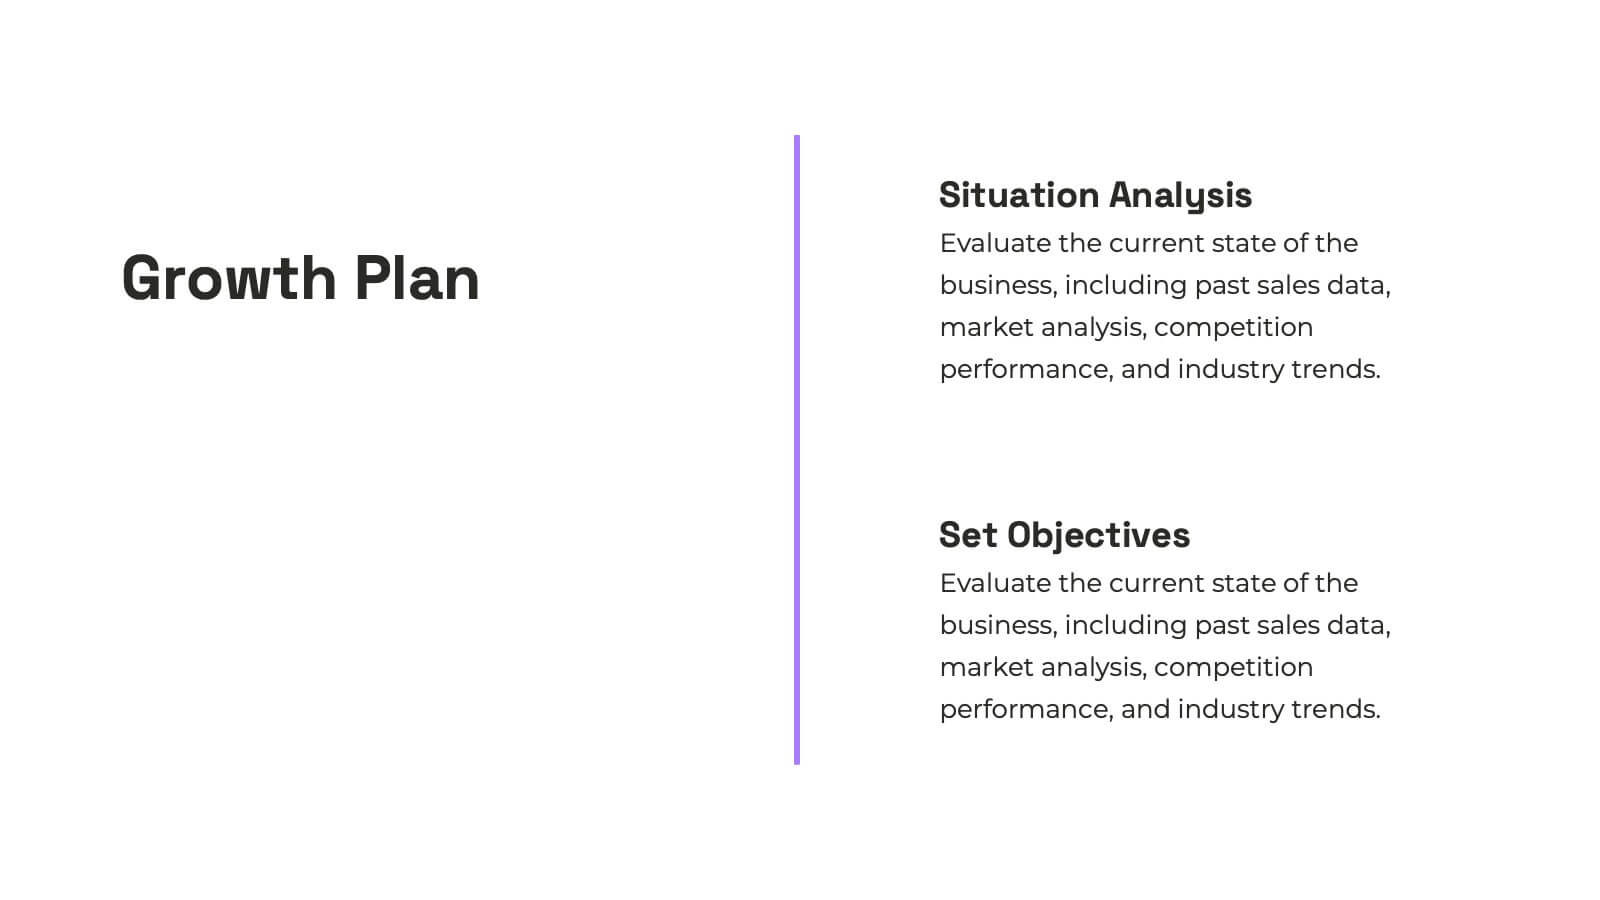
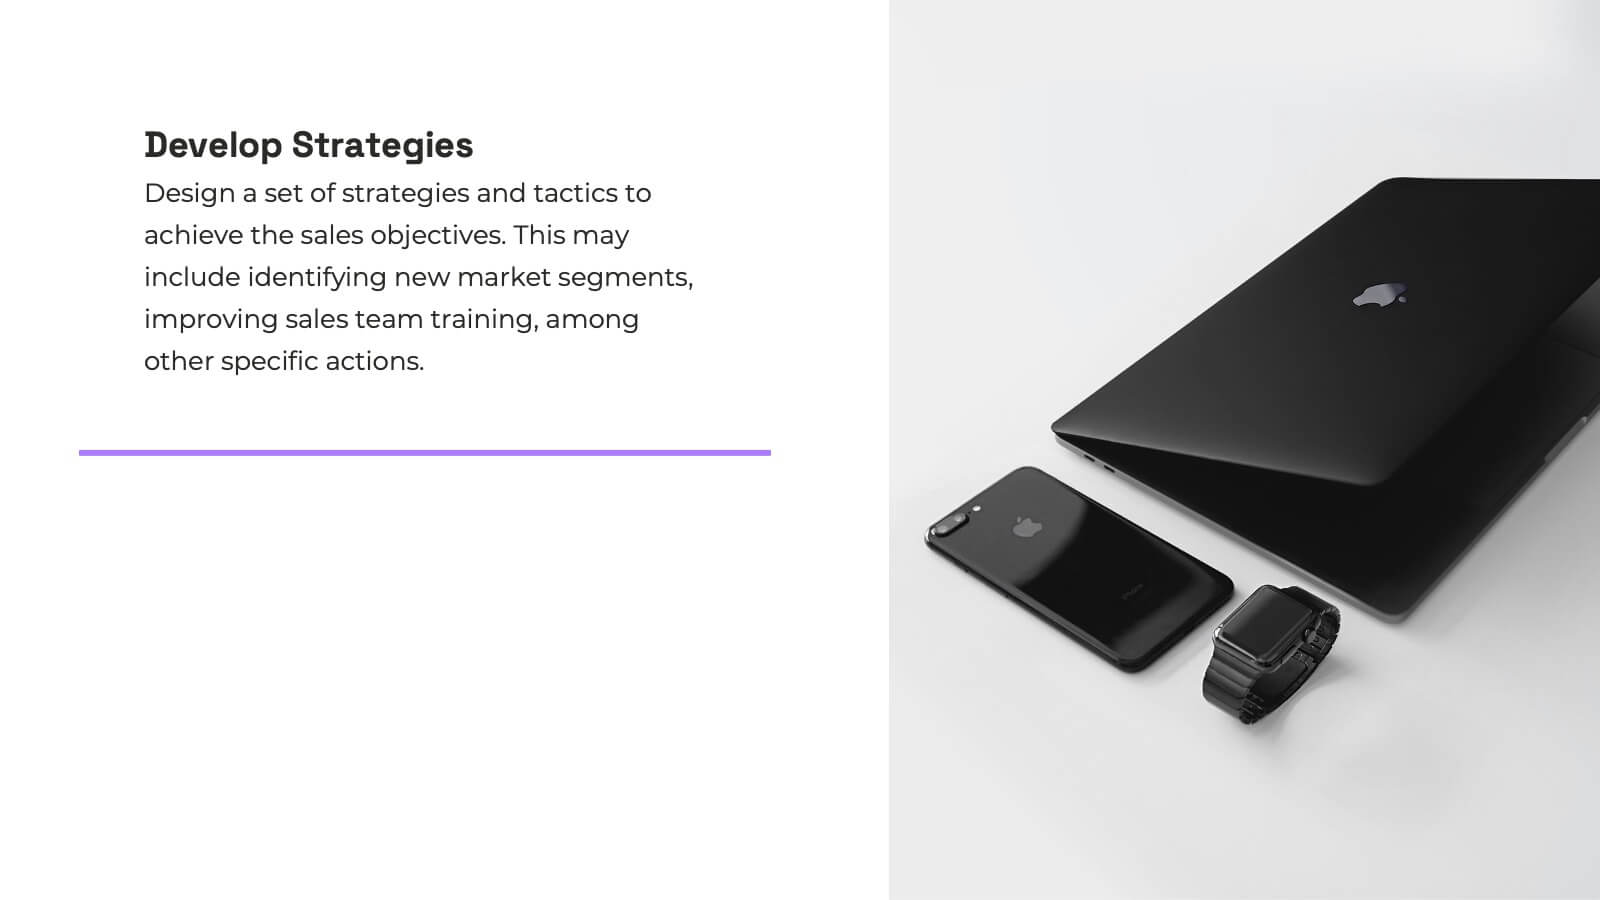
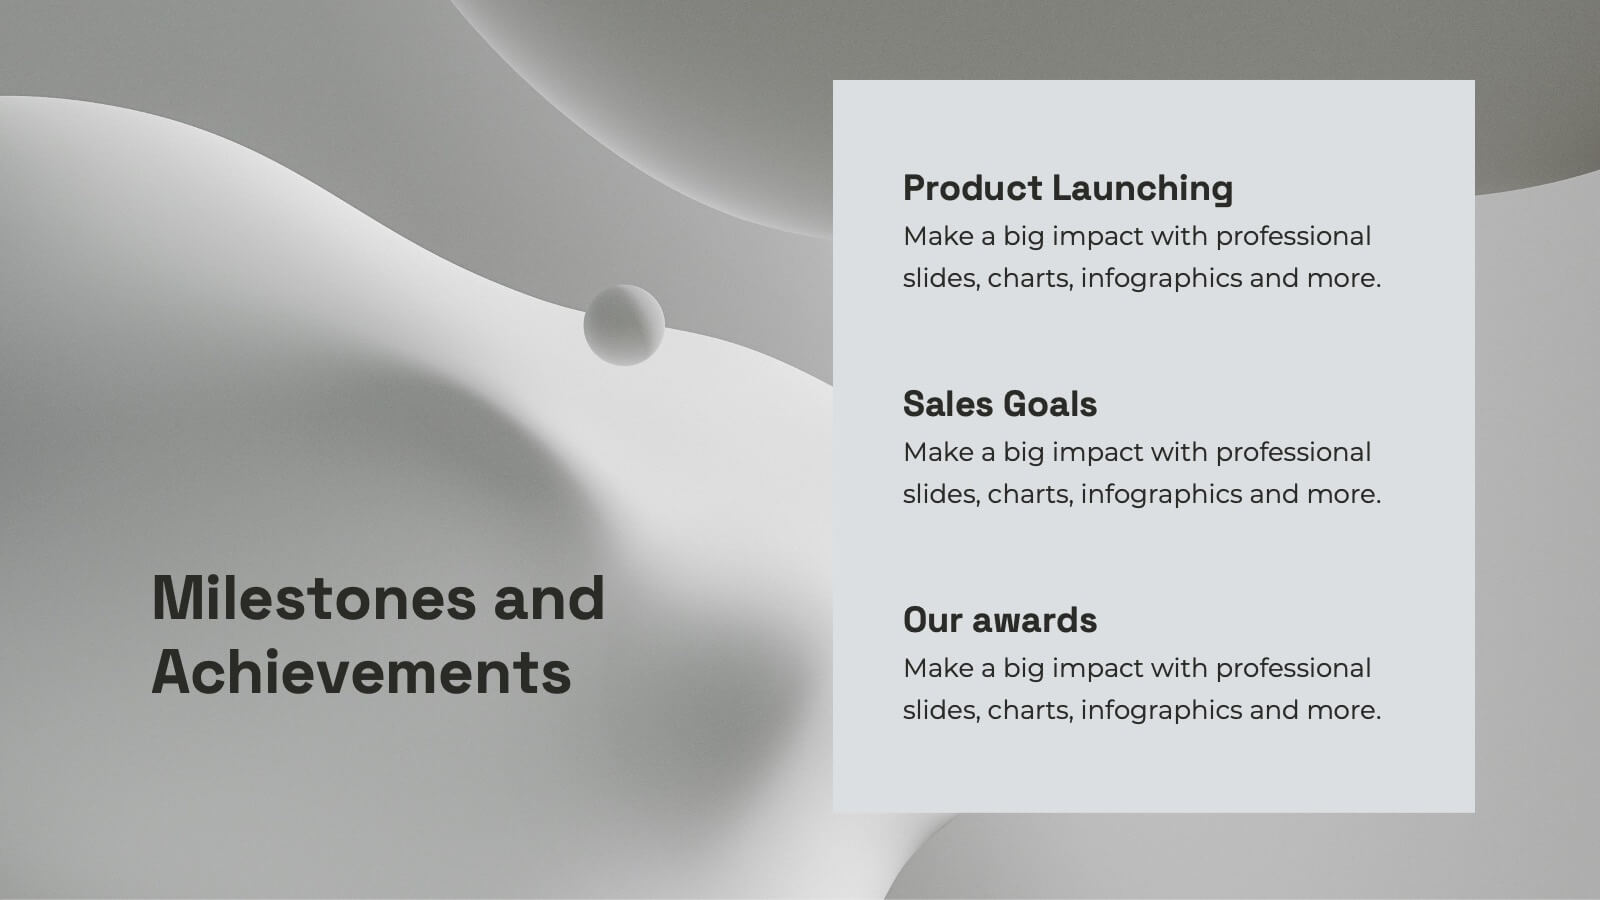
Nexus Startup Growth Plan Presentation
Jumpstart your business journey with this dynamic presentation template! Ideal for outlining your startup growth plan, it covers mission, vision, market analysis, and financial projections with sleek, professional slides. Capture investor interest and articulate your strategy effortlessly. Compatible with PowerPoint, Keynote, and Google Slides, ensuring seamless presentation across all platforms.


7 diapositivas
Professional Project Management Infographic Presentation
Project management is the process of planning, organizing, and overseeing resources and tasks to achieve goals and objectives within a defined timeframe. This template includes a clean, eye-catching design with plenty of space to add your content. This infographic template provides a step by step explanation of project management. It's the perfect way to explain complex projects easily to clients and employees. This template is compatible with Powerpoint, keynote and google slides making it easily customizable and editable. Use this for next project management research paper, presentation, etc.


5 diapositivas
IT Infrastructure and Architecture
Visualize your tech ecosystem with this layered pyramid infographic designed for showcasing IT infrastructure components. Ideal for CIOs, network architects, or IT consultants, this slide highlights five essential levels—from hardware to services. Fully editable in PowerPoint, Keynote, and Google Slides.