


Características


¿Tienes alguna pregunta?
Recomendar


30 diapositivas
Fusoria Brand Guidelines Proposal Presentation
Build a strong and cohesive brand identity with this sleek and professional brand guidelines proposal presentation. Covering essential topics like typography, color palettes, visual direction, and branding principles, this template helps you define and communicate your brand’s essence. Fully customizable and compatible with PowerPoint, Keynote, and Google Slides for a seamless presentation experience.


4 diapositivas
Modern Company Profile Layout Presentation
Bring your brand to life with this clean and modern layout built to highlight your company’s mission, values, and team. Its balanced design and easy-to-read sections make every detail stand out beautifully. Fully editable and compatible with PowerPoint, Keynote, and Google Slides for smooth customization and professional presentations.


26 diapositivas
The Rise of Smart Cities Presentation
This presentation template is dedicated to urban developers, technology enthusiasts, and policy makers interested in the advancement of smart cities. The template serves as a deep dive into the integration of technology within urban settings to boost sustainability, efficiency, and quality of life. It is designed with a sleek, modern aesthetic, using a color palette that reflects innovation and modernity, which makes it visually appealing and easy to navigate. The content is structured to demystify complex concepts about smart cities, featuring sections on IoT implementations, eco-friendly urban development, and smart public services. It includes varied slide types such as diagrams, infographics, and statistical displays to showcase data and case studies from cities that are pioneers in this domain. The template is compatible with multiple presentation platforms like PowerPoint, Google Slides, and Keynote, ensuring it can be utilized across different devices and settings. This makes it a versatile tool for presentations in educational, professional, and conference contexts, aiming to inspire and educate on the transformative power of smart urban planning.


8 diapositivas
Customer Market Segmentation Analysis
Visualize your audience insights with precision using the Customer Market Segmentation Analysis Presentation. This slide features a sleek, layered funnel design with percentage bars and arrow pointers—ideal for illustrating demographic splits, buyer behavior, or psychographic segments. With space for four data-driven categories and custom labels, this template is perfect for marketers, analysts, and product teams looking to present actionable customer data. Fully editable in PowerPoint, Keynote, and Google Slides, and easy to adapt to any color scheme or branding.


5 diapositivas
Business Model Canvas and Strategy Presentation
Visualize your entire business model in one clean, structured slide. This presentation template breaks down key areas—Partners, Activities, Value Propositions, Customers, Channels, Costs, and Revenue—into a color-coded layout for strategic clarity. Perfect for startups, consultants, or internal strategy teams. Fully editable in PowerPoint, Keynote, and Google Slides.


6 diapositivas
Market Challenges and Resilience Strategy Presentation
Tackle volatility with clarity using the Market Challenges and Resilience Strategy presentation. This slide features a modern smartphone graphic surrounded by six key strategy zones, each with its own icon and text area—ideal for outlining market pressures, competitive moves, or adaptive responses. Use it to communicate resilience frameworks, digital transformation steps, or scenario planning. Fully customizable in PowerPoint, Keynote, and Google Slides.


4 diapositivas
Athlete Training and Strategy Presentation
Present training performance and strategy benchmarks with this Athlete Training and Strategy slide. Featuring a sleek runner silhouette and gradient-colored progress bars, this layout lets you showcase four training pillars with accompanying metrics or KPIs. Ideal for coaching sessions, sports science reviews, or athlete development plans. Fully editable in PowerPoint, Keynote, and Google Slides.


6 diapositivas
5-Stage Circular Cycle Presentation
Energize your workflow with a clean, circular layout that turns five interconnected steps into a clear, engaging story. This presentation helps you explain any repeating process or continuous cycle with simplicity and flow, making complex ideas easier to follow. Compatible with PowerPoint, Keynote, and Google Slides.


7 diapositivas
Bubble Map Infographics Presentation Template
Our Bubble Map Infographic is an easy-to-create, visually appealing way to display your data. This template is perfect for educators looking to engage their audience, and for anyone wanting to share information in an interesting way. The graphics are easy to customize by adding your own text or images and there are PowerPoint versions available. This template features a lot of animated bubbles that will help illustrate your points, making them easier to understand than ever before. The color-coded categories make it easy to navigate through the dots and find whatever you need with ease.


7 diapositivas
Empathy Map Infographic Presentation Template
An Empathy Map is a collaborative tool organizations can use to gain a deeper insight into their customers. Similar to a user persona, an empathy map can represent a group of users, such as a customer segment. An empathy map helps to map what a design team knows about the potential audience. Use this template to gain a deeper understanding of your target audience. This template comes with many empathy maps you can use to discover how to empathize with your customers. The empathy maps available in this template are designed to give you an avenue into the mind of your target audience.


26 diapositivas
Digital Art Tools and Techniques Presentation
Unleash your creativity with this vibrant presentation on digital art tools and techniques. Covering essential topics like graphic design software, digital brushes, layering methods, and creative workflows, this template helps artists and designers enhance their skills. Fully customizable and compatible with PowerPoint, Keynote, and Google Slides for a seamless and visually stunning presentation experience.


5 diapositivas
Strategic Growth Next Steps
Highlight your business roadmap with this rocket-themed infographic tailored for strategic growth. Ideal for showcasing step-by-step initiatives or departmental alignment, it features five labeled stages with ample space for insights and icons. Fully editable in PowerPoint, Keynote, and Google Slides—perfect for growth strategy, planning, or vision-setting decks.


26 diapositivas
Sustainable Business Practices Presentation
Present your eco-friendly business approach with this straightforward template that reflects your commitment to sustainability. It's decked with leafy designs and organic textures that naturally convey your green message. From showcasing your leadership to illustrating growth with intuitive graphs, the template makes it simple to share your vision. Perfect for any platform, like PowerPoint or Google Slides, it’s designed to help you communicate big ideas, like reducing carbon footprints or embracing renewable resources, in a way that’s easy for everyone to grasp. Let this template be the backdrop as you chart a course for a sustainable future, making complex concepts like ‘green initiatives’ and ‘sustainable practices’ clear and actionable.


25 diapositivas
Siren Rebranding Project Plan Presentation
This sleek brand presentation template covers essential elements like market analysis, brand guidelines, positioning, and audience insights. It's designed to showcase your brand identity and development strategies with a modern layout. Compatible with PowerPoint, Keynote, and Google Slides, it’s perfect for delivering professional and engaging brand presentations.


6 diapositivas
Business Structure Outline Presentation
Visualize your company’s framework with this modern business structure slide. Perfect for showcasing team roles, departments, or organizational functions, it helps simplify complex relationships into a clear overview. Easily editable in Canva, PowerPoint, and Google Slides—ideal for presentations, planning sessions, or onboarding new employees with a professional, easy-to-follow design.


23 diapositivas
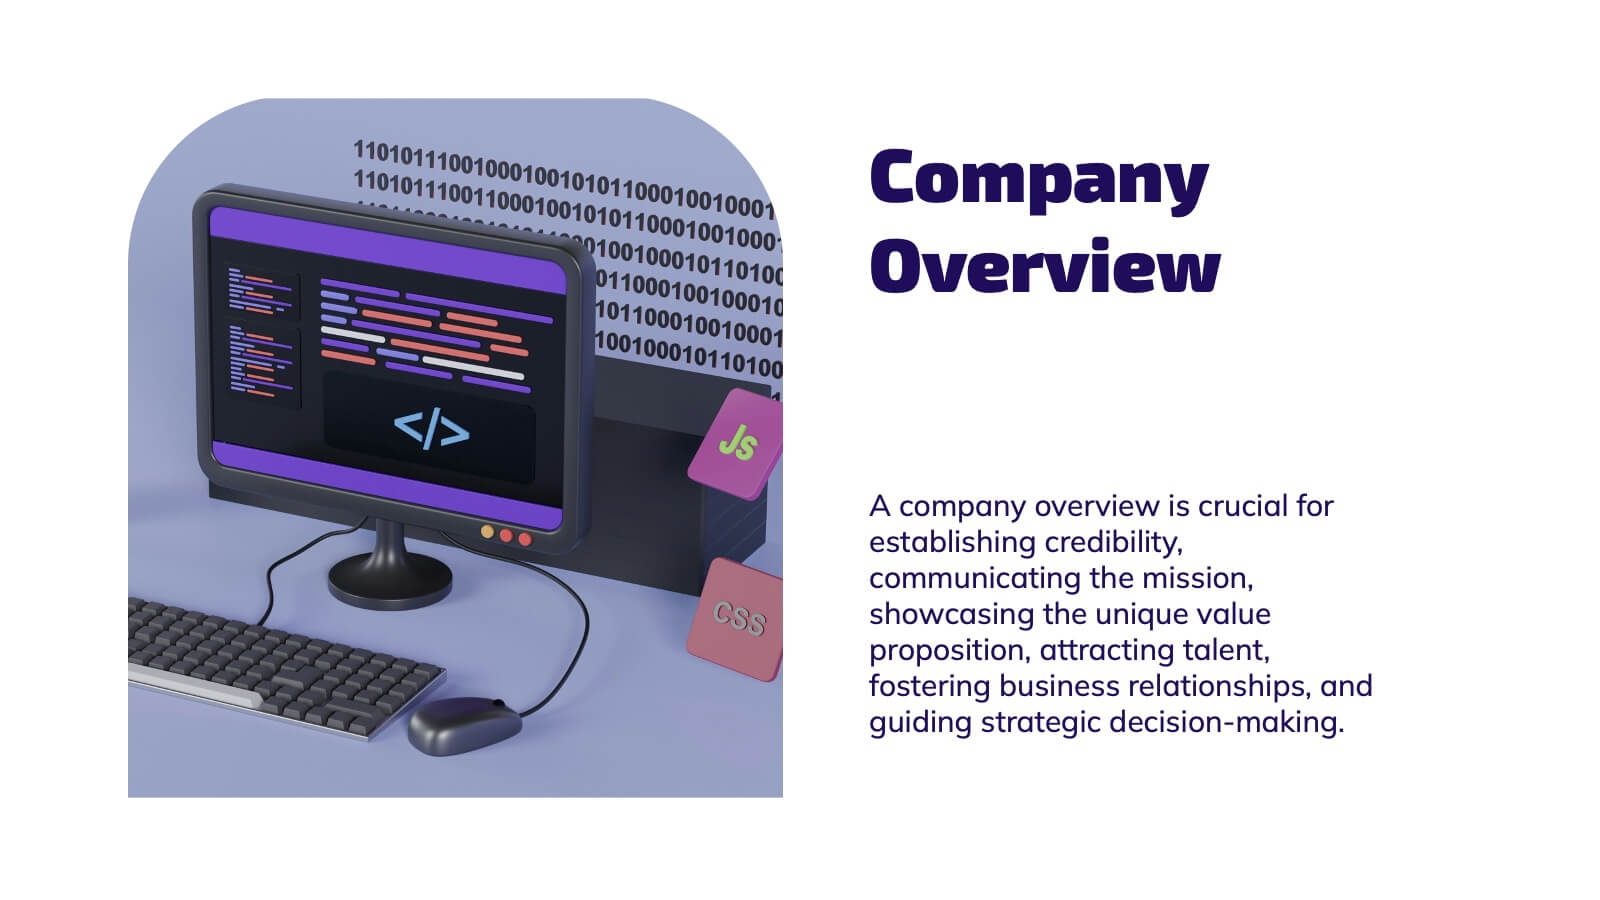
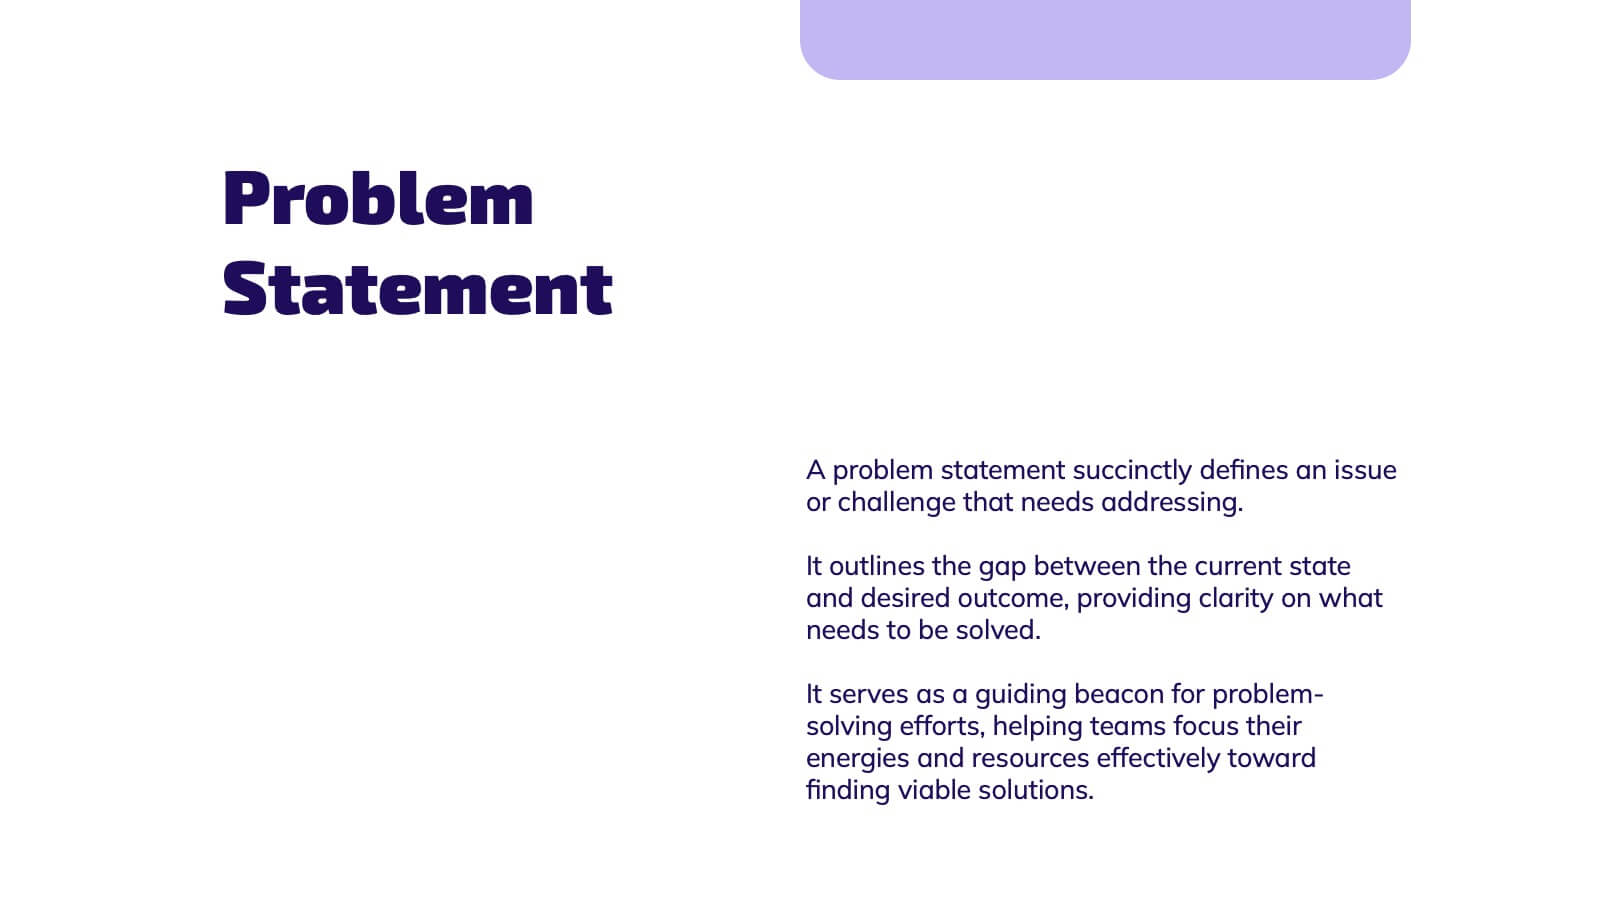
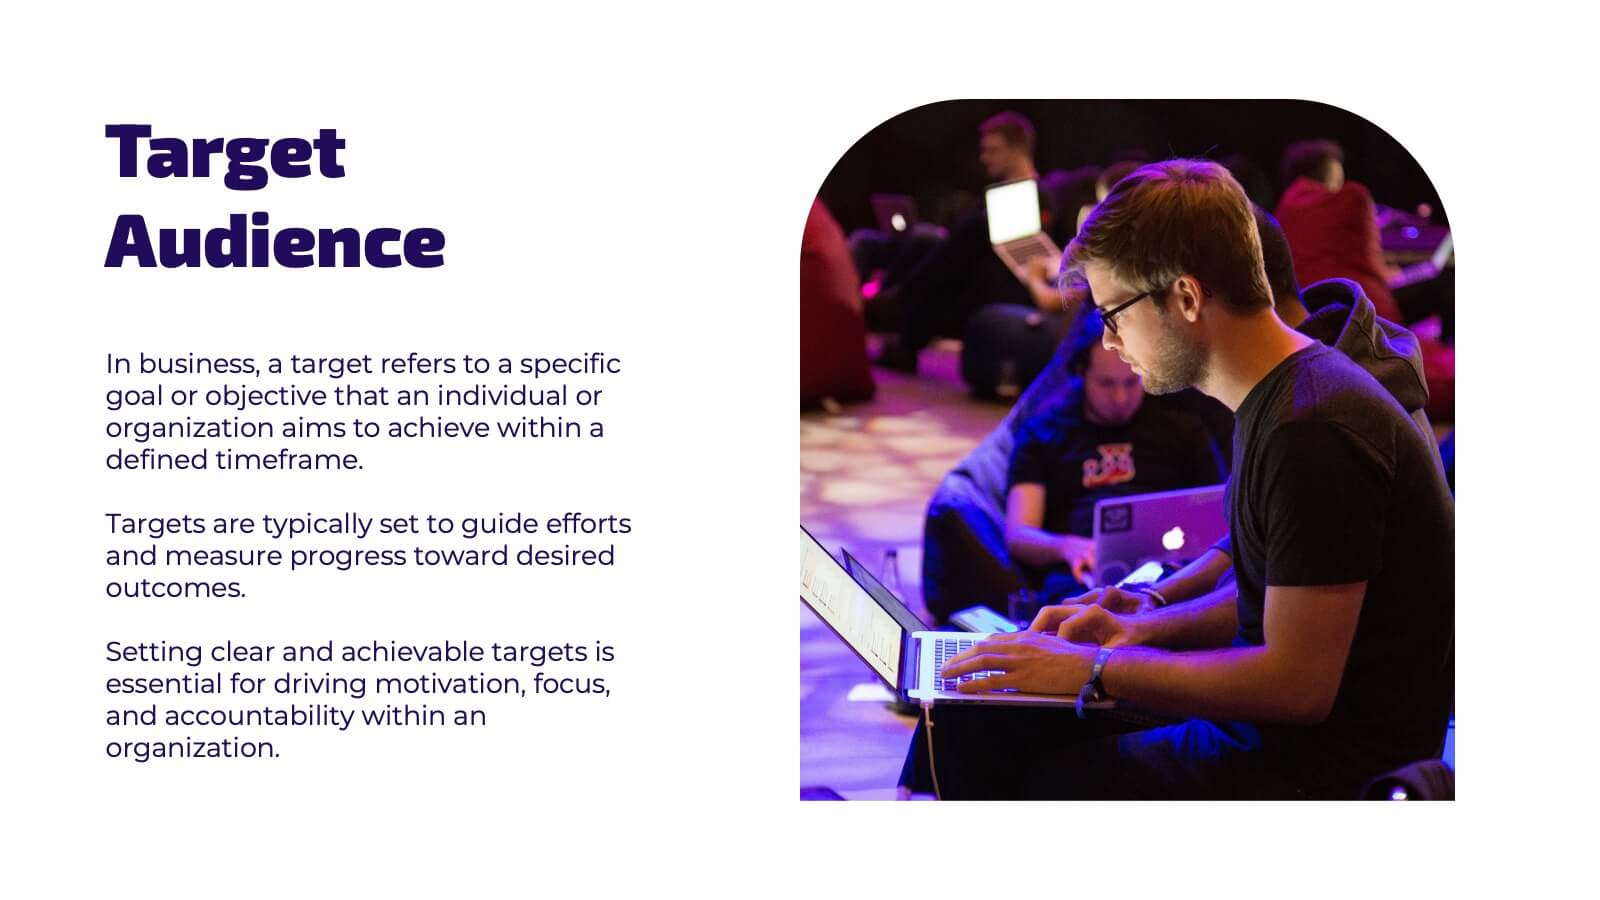
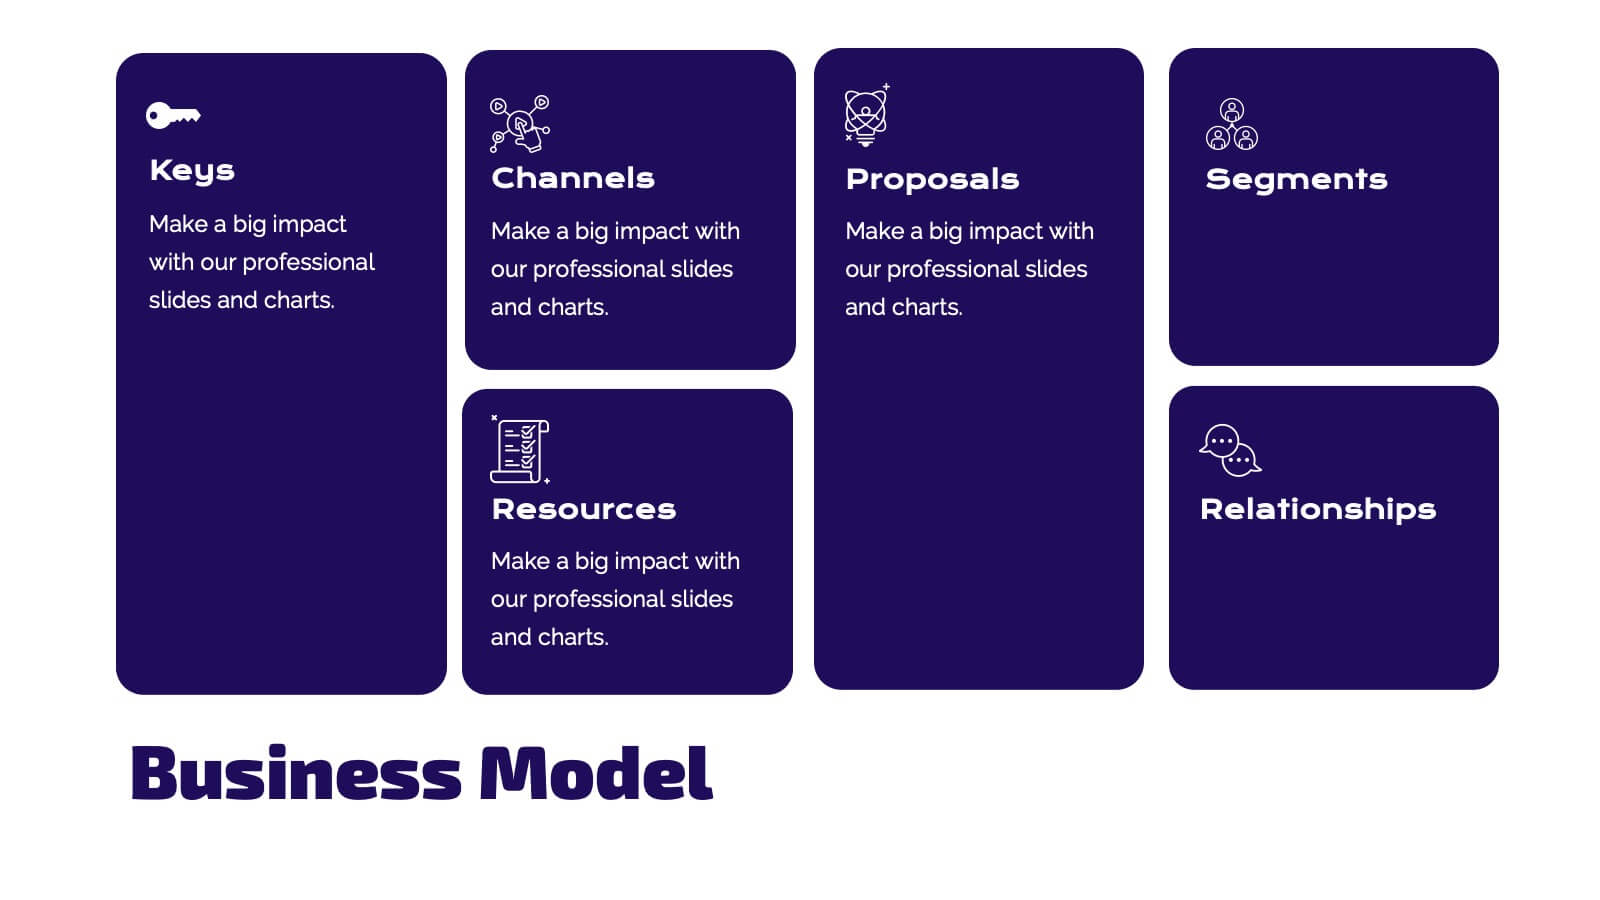
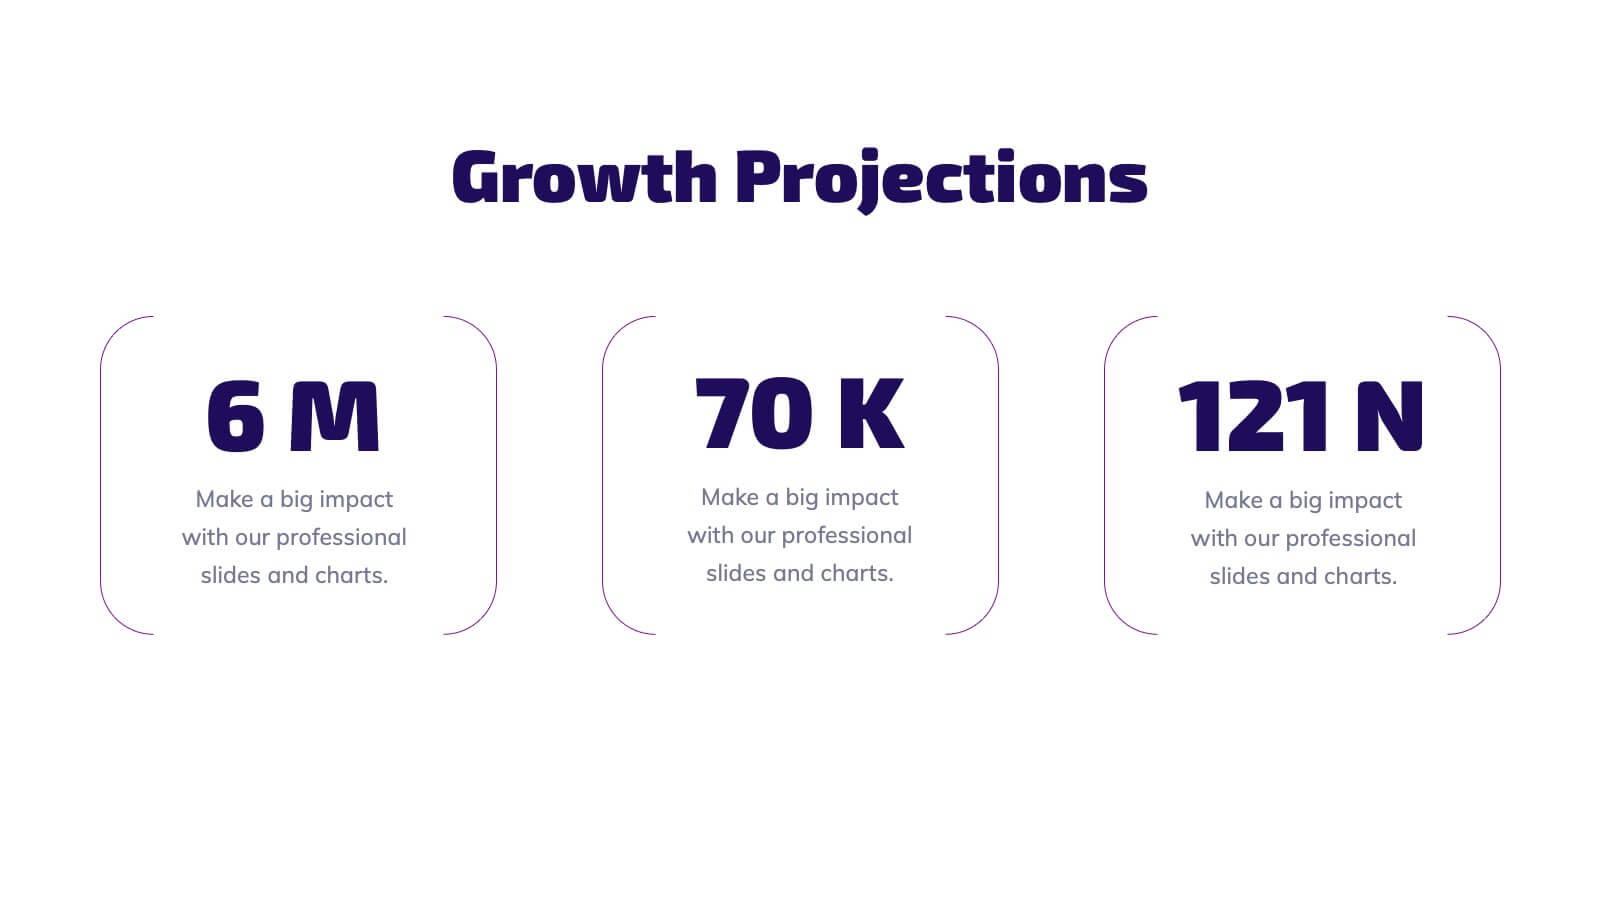
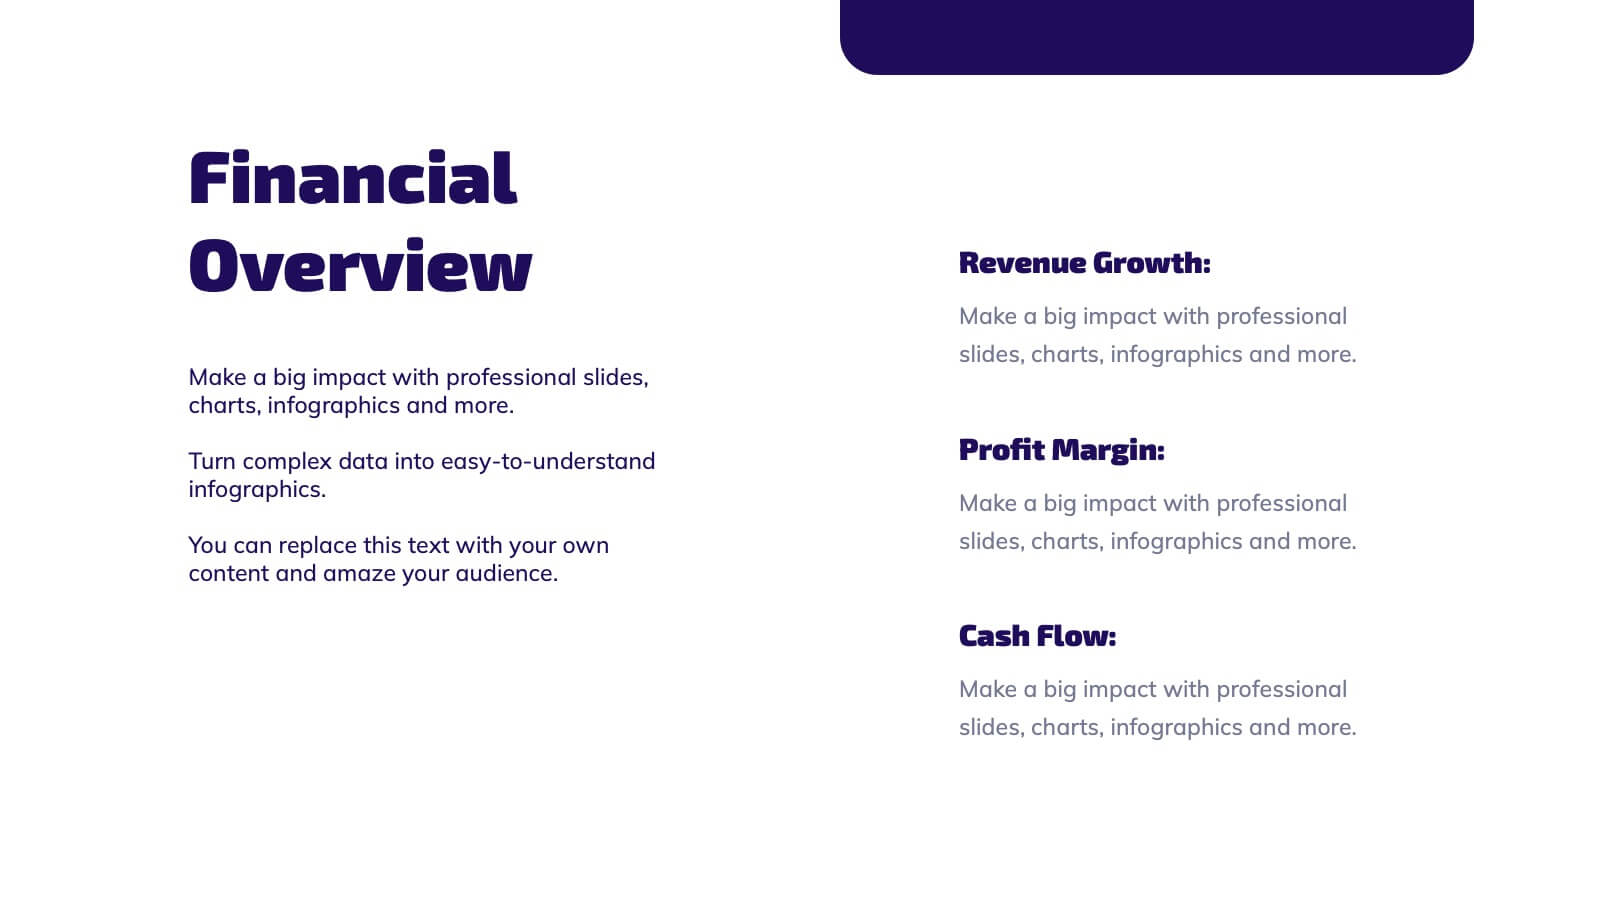
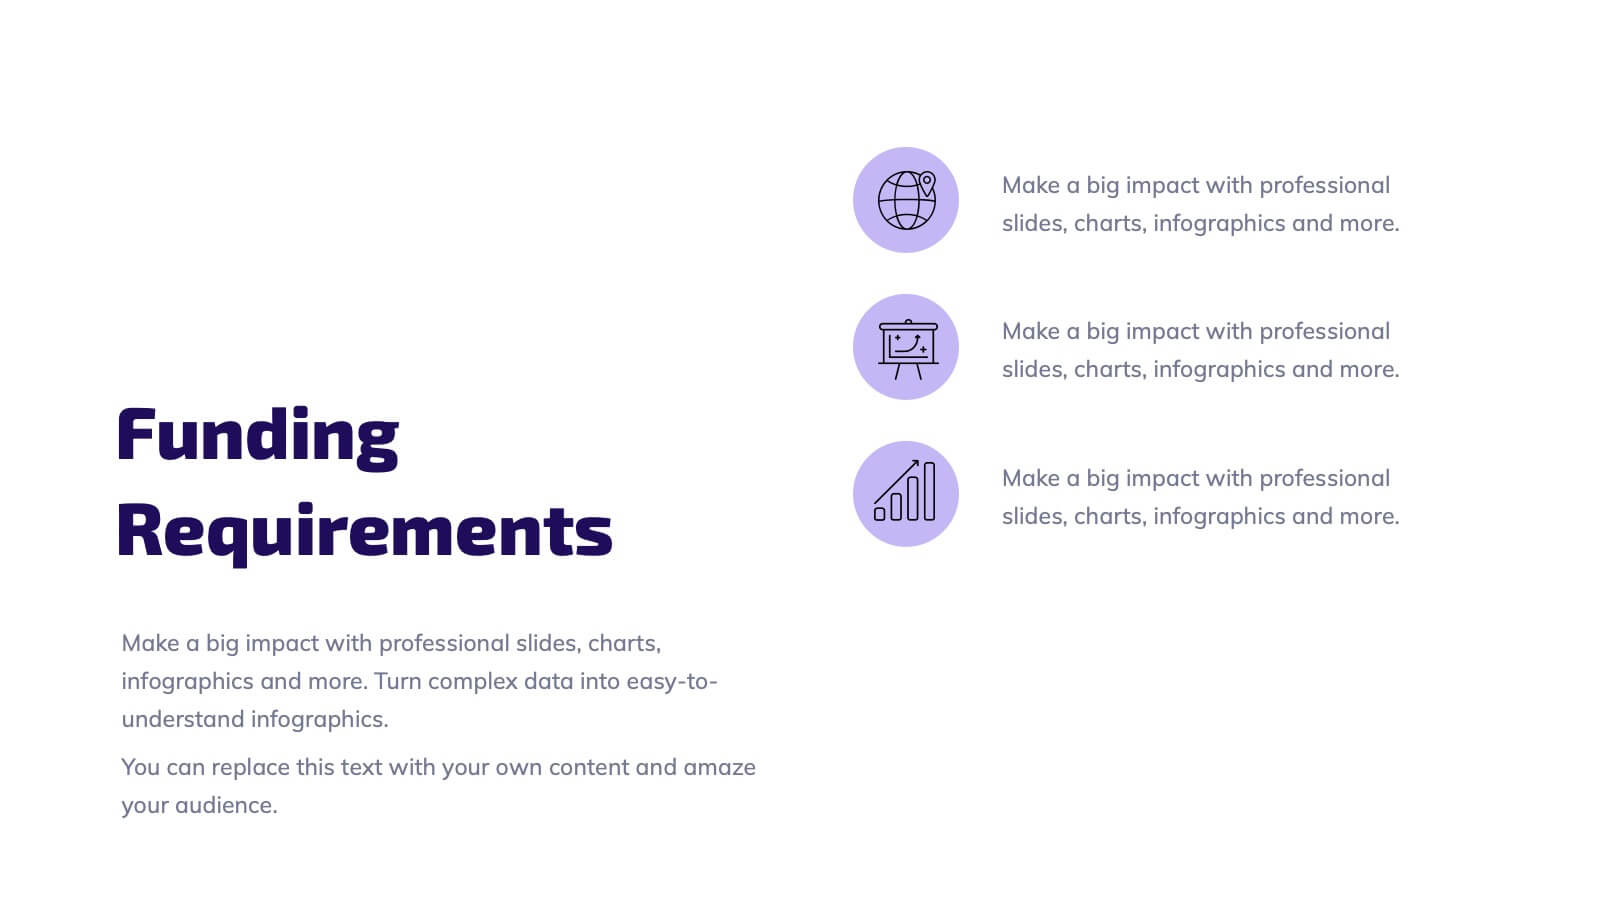
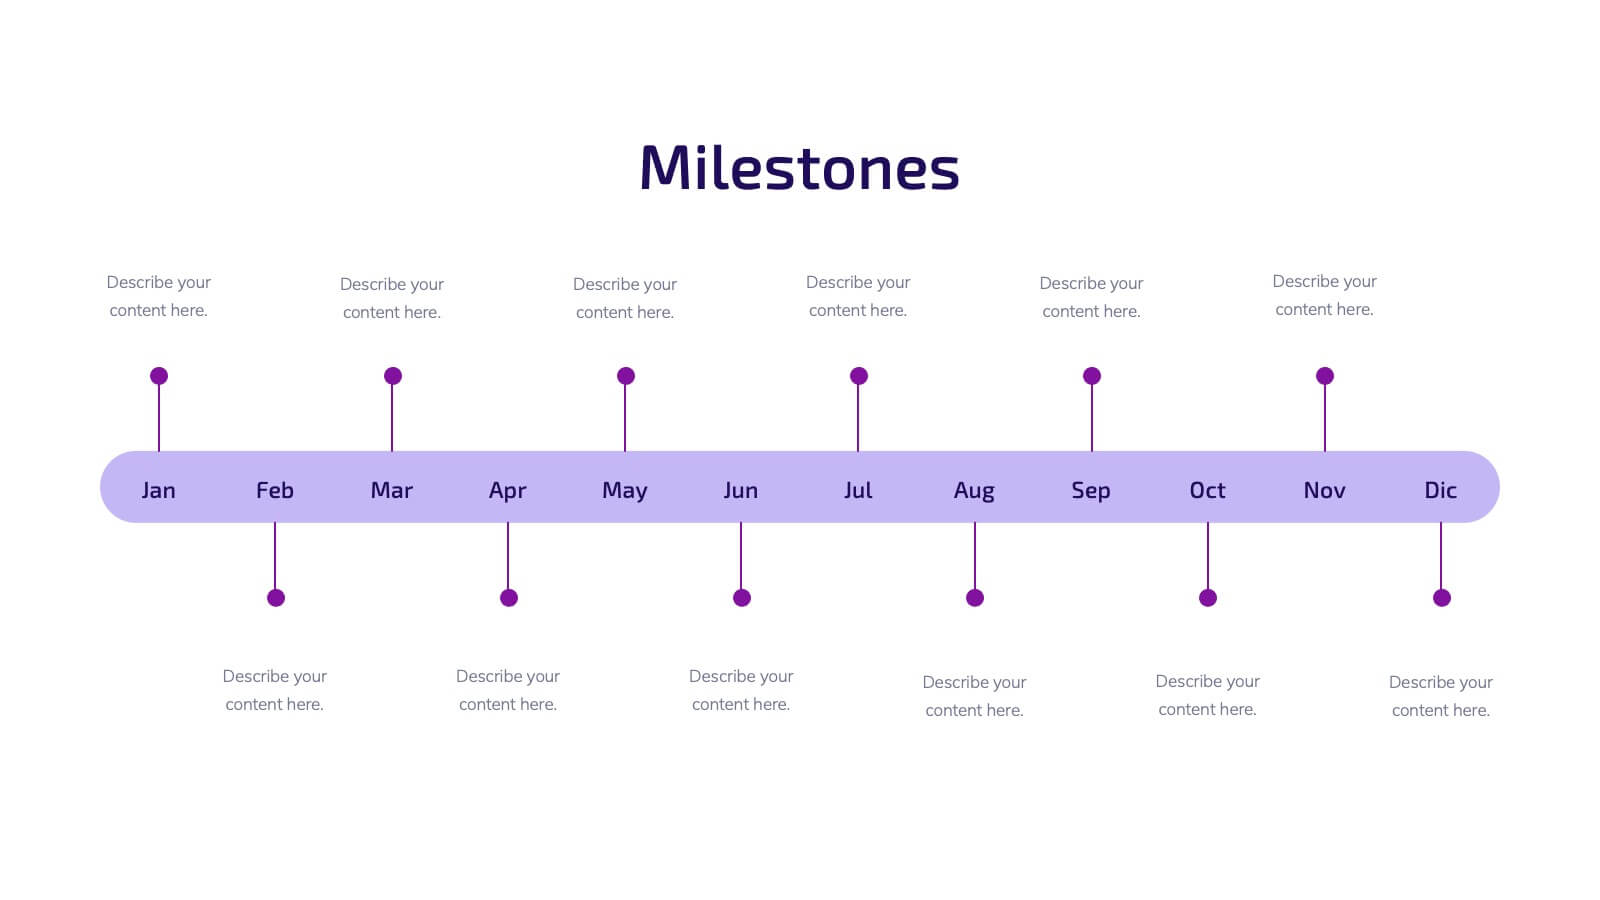
Illume Startup Pitch Deck Presentation
Light up your startup journey with this captivating presentation template! Perfect for pitching your business idea, it guides you through key elements like market analysis, financial projections, and growth strategies. With a modern design that grabs attention, this template will help you shine in front of investors. Compatible with PowerPoint, Keynote, and Google Slides.


6 diapositivas
Business Performance Metric Presentation
Give your metrics a breath of fresh air with this modern, nature-inspired design. Perfect for presenting business KPIs, performance tracking, or growth data, this infographic layout uses vibrant pinwheel visuals to guide the viewer through key stats and insights. Fully compatible with PowerPoint, Keynote, and Google Slides for easy editing.