


Features
- 6 Unique slides
- Fully editable and easy to edit in Microsoft Powerpoint, Keynote and Google Slides
- 16:9 widescreen layout
- Clean and professional designs
- Export to JPG, PDF or send by email


Do you have any questions?
Recommend


10 slides
SWOT-Based Competitive Analysis Presentation
Identify your competitive edge with a clear, structured approach! This SWOT-based analysis template helps businesses assess strengths, weaknesses, opportunities, and threats in a visually engaging format. Perfect for strategic planning, it ensures clarity and impact in every presentation. Fully customizable and compatible with PowerPoint, Keynote, and Google Slides.


7 slides
Structure Infographic Presentation Template
A structure infographic is a visual aid that is designed to help present information about the structural components of a particular topic. This template can be used to create presentations on a variety of subjects, such as education, business, buildings, machines, or organisms, and can help to break down complex information. Use this PowerPoint template to structure your most important ideas and impress your audience with more than just a bullet point list. Take a look at our infographic presentation templates if you want to add a bit of personality to your next presentation design!


6 slides
Vision-to-Execution Roadmap
Turn bold ideas into actionable plans with the Vision-to-Execution Roadmap Presentation. This circular, multi-phase layout helps you illustrate how strategic goals evolve into tangible results across five connected stages. Ideal for pitching initiatives, mapping transformation phases, or guiding teams from concept to completion. Fully customizable in PowerPoint, Keynote, and Google Slides.


7 slides
Veterinary Infographic Presentation Template
Veterinarians are the doctors of the animal world. Veterinary medicine is the branch of science and profession concerned with the prevention, diagnosis and treatment of disease, disorder, dysfunction and injury in animals. This template includes a comprehensive list of veterinary medicine infographics. They have appealing illustrations completely customizable for you. Use this template to create your veterinary medicine study notes for each chapter. It is a great way to remember what you learned. You can use this template to organize your notes, review labs and as a study guide for tests.


8 slides
Total Addressable Market Strategy
Turn your market strategy into a visual story that’s easy to follow. This sleek infographic breaks down TAM, SAM, and SOM into concentric layers—perfect for highlighting growth potential and market focus. Fully customizable in PowerPoint, Keynote, and Google Slides to help you present complex data with clarity and confidence.


5 slides
Nutrition & Health Infographics
Nutrition & Health are essential aspects of a person's well-being. Good nutrition habits provide the nutrients that the body needs to function optimally. These infographics are visual representations of information related to the relationship between diet, exercise, and overall health. They are designed to provide concise, easily digestible information that can help people make informed decisions about their diet and lifestyle choices. Nutrition and health infographics can serve as a valuable tool for individuals looking to improve their overall health and well-being through informed dietary choices.


5 slides
Construction Budgeting and Resource Allocation Presentation
Visualize your construction budget layer by layer with the Construction Budgeting and Resource Allocation Presentation. This pyramid-style infographic breaks down costs and resources—from materials and labor to safety infrastructure—making it easy to communicate project allocations. Fully editable in PowerPoint, Keynote, and Google Slides.


4 slides
Business Cycle Diagram Overview Presentation
Illustrate your business processes with this modern cycle diagram template. Designed to showcase four interconnected stages, it’s ideal for visualizing workflows, project phases, or continuous improvement models. Fully editable in Canva, PowerPoint, and Google Slides, this template helps you present complex cycles with clarity and visual impact.


4 slides
Social Media Calendar Overview
Stay organized and consistent with your posting schedule using the Social Media Calendar Overview Presentation. This clean, visual weekly planner helps you map out daily content across multiple categories with color-coded bullets and structured columns from Monday to Sunday. Perfect for content teams, marketers, and freelancers managing multi-platform campaigns. Fully customizable in PowerPoint, Keynote, and Google Slides.


5 slides
Operational Workflow Process Chart Presentation
Streamline your operations with the Operational Workflow Process Chart Presentation. This template provides a clear visual layout to map out step-by-step processes, helping teams align on roles, timelines, and dependencies. Perfect for training, reporting, or system audits—fully customizable in PowerPoint, Canva, and Google Slides.


19 slides
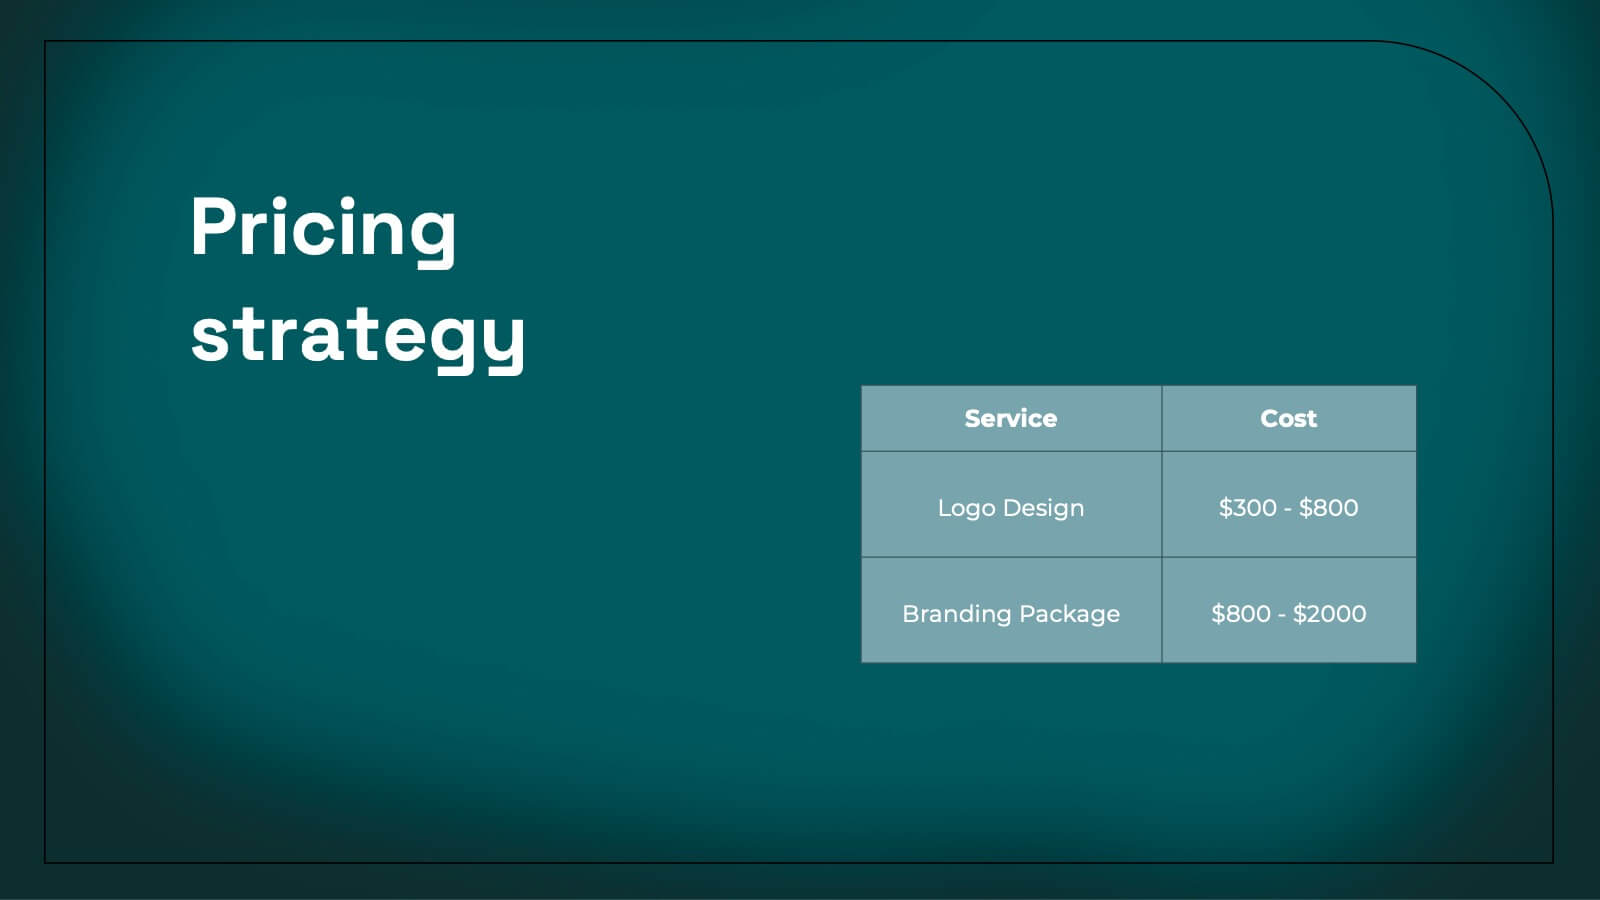
Kale Product Strategy Report Presentation
Unleash the power of your product with this bold and dynamic product strategy report template! Elevate your presentation with eye-catching designs that showcase product features, competitive analysis, and pricing strategies like never before. Captivate your audience from start to finish and leave a lasting impression. Fully compatible with PowerPoint, Keynote, and Google Slides!


20 slides
Lumen Marketing Proposal Presentation
Pitch your marketing strategy effectively with this sleek and professional proposal presentation! Covering sections like project summary, proposed solutions, deliverables, and budget breakdowns, it ensures all your ideas are communicated clearly. Perfect for client pitches or internal strategy sessions, this template is fully compatible with PowerPoint, Keynote, and Google Slides.


8 slides
Chain of Command Mapping Presentation
Clarify your organizational flow with the Chain of Command Mapping Presentation. This template is ideal for visualizing reporting lines, departmental authority, and team structures in a clean, easy-to-follow format. Featuring modern icons, varied layouts, and editable labels, it helps simplify decision-making and responsibility tracking. Fully customizable in PowerPoint, Keynote, Canva, and Google Slides.


6 slides
North America Sales Distribution Presentation
Showcase regional performance clearly with the North America Sales Distribution Presentation. This slide combines a clean bar chart and a regional map to help visualize sales data across key areas. Ideal for performance reviews, strategy meetings, or investor updates. Fully editable in Canva, PowerPoint, and Google Slides.


4 slides
Lead Nurturing Funnel Breakdown Presentation
Guide leads through every stage with the Lead Nurturing Funnel Breakdown Presentation. This slide visualizes the customer journey from awareness to conversion, helping you present marketing automation, CRM strategies, or content funnels. Fully customizable in PowerPoint, Google Slides, and Canva for seamless integration.


4 slides
Machine Learning Overviews Presentation
Bring your audience into the world of intelligent automation with a bold, visual layout that makes complex concepts feel simple and engaging. This presentation breaks down key processes, workflows, and insights using clear graphics that support your message. Fully customizable and compatible with PowerPoint, Keynote, and Google Slides.


4 slides
3-Circle Overlap Venn Layout
Visually break down relationships and intersections with the 3-Circle Overlap Venn Layout Presentation. This sleek, minimalist diagram is ideal for illustrating shared values, cross-functional strategies, or concept intersections. Each circle is color-coded with space for clear titles and concise explanations. Great for strategy discussions, branding, or stakeholder presentations. Fully editable in PowerPoint, Keynote, and Google Slides.