


Features
- 8 Unique slides
- Fully editable and easy to edit in Microsoft Powerpoint, Keynote and Google Slides
- 16:9 widescreen layout
- Clean and professional designs
- Export to JPG, PDF or send by email


Do you have any questions?
Recommend


4 slides
Team Collaboration Puzzle Slide Presentation
Showcase team synergy with the Team Collaboration Puzzle Slide Presentation. This engaging design uses interlocking human figures to symbolize unity and contribution, making it perfect for presenting roles, responsibilities, or collaborative workflows. Fully editable in Canva, PowerPoint, or Google Slides—ideal for team introductions, project planning, or partnership overviews.


4 slides
Green Business Sustainability Report Presentation
Communicate your sustainability efforts effectively with the Green Business Sustainability Report Presentation template. This visually engaging slide deck is designed to showcase eco-friendly business initiatives, corporate responsibility strategies, and environmental impact assessments. With an organic, nature-inspired design and a clear, structured layout, this template is perfect for sustainability consultants, corporate leaders, and environmental advocates. Fully editable and compatible with PowerPoint, Keynote, and Google Slides for seamless customization and presentation.


4 slides
Operating Expenses and Cost Allocation Presentation
Clearly outline key financial movements with the Operating Expenses and Cost Allocation Presentation. This slide uses a step-arrow layout to show the relationship between spending and allocation, making it ideal for budgeting updates, operational analysis, or finance planning. Fully editable in PowerPoint, Keynote, Google Slides, and Canva for seamless customization.


6 slides
Responsive Design Display with Devices Presentation
Highlight your multi-device experience with the Responsive Design Display with Devices Presentation. This clean and modern layout features a central monitor and mobile phone illustration, surrounded by five customizable text points—ideal for showing key features or compatibility. Fully editable in Canva, PowerPoint, Keynote, and Google Slides.


7 slides
Communication Infographic Presentation Template
Communication Infographics are a more professional way of presenting facts and a great way to share your marketing strategy and goals with your team. Our template includes a variety of infographic elements, including bullet points, call to actions and persuasive slogans. This template design is ideal for presentations on subjects such as content marketing, sales, social media strategy, and many more. Our Communication Template includes graphic illustrations, slides and text boxes for your topics. In this template you can easily add your own text and images to create a meaningful presentation.


7 slides
Lifecycle Stages in Customer Experience Presentation
Showcase the full customer journey with this Lifecycle Stages in Customer Experience presentation. Featuring a sleek infinity loop layout, this slide is ideal for visualizing cyclical engagement stages—like acquisition, onboarding, retention, and advocacy. Clean design and labeled touchpoints help convey insights clearly. Fully compatible with PowerPoint, Canva, and Google Slides.


6 slides
Engagement Survey Results Infographics
Effectively communicate your engagement survey results with our Engagement Survey Results infographic template. This template is fully compatible with popular presentation software like PowerPoint, Keynote, and Google Slides, allowing you to easily customize it to illustrate and convey your survey findings. The Engagement Survey Results infographic template offers a visually engaging platform to present survey data, key findings, and insights related to employee or customer engagement. Whether you're an HR professional, manager, or business leader, this template provides a user-friendly canvas to create informative presentations and reports on engagement survey outcomes. Optimize your communication of survey results with this SEO-optimized Engagement Survey Results infographic template, thoughtfully designed for clarity and ease of use. Customize it to showcase survey methodology, response rates, visualizations of data, and action plans based on the findings, ensuring that your audience gains a comprehensive understanding of the survey results and their implications. Start crafting your personalized infographic today to effectively communicate engagement survey outcomes.


5 slides
Energy and Natural Resources Infographics
Energy and natural resources are essential components of modern societies and economies. These vertical infographics are designed to showcase key information about energy sources, natural resources, and their impact on the environment. This template is ideal for educational purposes, awareness campaigns, environmental organizations, and companies in the energy sector. The visuals display the different types of renewable energy, such as solar, wind, hydro, geothermal, and biomass, along with their benefits and growth potential. This is fully customizable and compatible with Powerpoint, Keynote, and Google Slides.


7 slides
SCRUM Infographic Presentation Template
A SCRUM infographic is an Agile methodology for software development. The goal of this infographic template is to provide a clear and easy-to-understand overview of the key principles and practices of scrum, such as the roles, events, and artifacts used in the process. This template can be used as a reference for team members, as a teaching tool for new scrum practitioners, or as a way to communicate scrum to stakeholders. Our well-designed scrum infographic can help you and your audience quickly understand the basics of the framework, as well as its benefits, applications, and best practices.


7 slides
Process Explorer Infographic
Delve deep into workflow intricacies with our process explorer infographic. Set on a spotless white backdrop, amplified by the energy of orange, the clarity of yellow, the evolution of green, the depth of blue, and the foundation of grey, this template meticulously illustrates the multifaceted dimensions of processes. Garnished with sharp infographics, symbolic icons, and fitting image placeholders, it navigates through the pathways of methodological implementations. Perfectly crafted for Powerpoint, Keynote, or Google Slides. A treasure for operations managers, workflow analysts, project supervisors, or any entity intent on process optimization.


7 slides
Decision Infographic Presentation Template
Our decision Infographic template is a fast and easy way to create an informative decision making presentation. Use it to present your ideas and get feedback from your team in an effective way. This template is designed to present results and make them easy to read. It is suitable for any presentation about decisions or influence. A great choice for educators, business collaboration or advertising. Use this to make a decision and support your investments in a new direction. This presentation template allows you to outline key points and conclusions, as well as include charts and tables.


6 slides
Innovation Ideas Infographics
Energize your presentations with our Innovation Ideas infographic, designed for full compatibility with Powerpoint, Keynote, and Google Slides. This vibrant and insightful infographic is the perfect addition for innovators, entrepreneurs, and educators looking to foster a culture of creativity and ideation. The infographic provides a visual exploration of the innovation process, from ideation to execution. It highlights key concepts and strategies that stimulate creative thinking and drive innovation within teams and organizations. With a focus on collaborative brainstorming and the incubation of ideas, it serves as a guide to developing groundbreaking concepts. Incorporating this infographic into your slides will help you effectively communicate the dynamics of successful innovation strategies. It’s ideal for workshops, team meetings, and academic courses that cover topics such as design thinking, innovation management, and product development. Use it to inspire your audience and to illustrate a roadmap for transforming ideas into tangible innovations.


4 slides
Current vs Future State Gap Presentation
Take your audience on a journey of progress with this dynamic slide, designed to clearly compare where things stand today and where they’re headed next. It helps highlight key gaps, improvement areas, and strategic opportunities with a simple, visual flow. Fully compatible with PowerPoint, Keynote, and Google Slides.

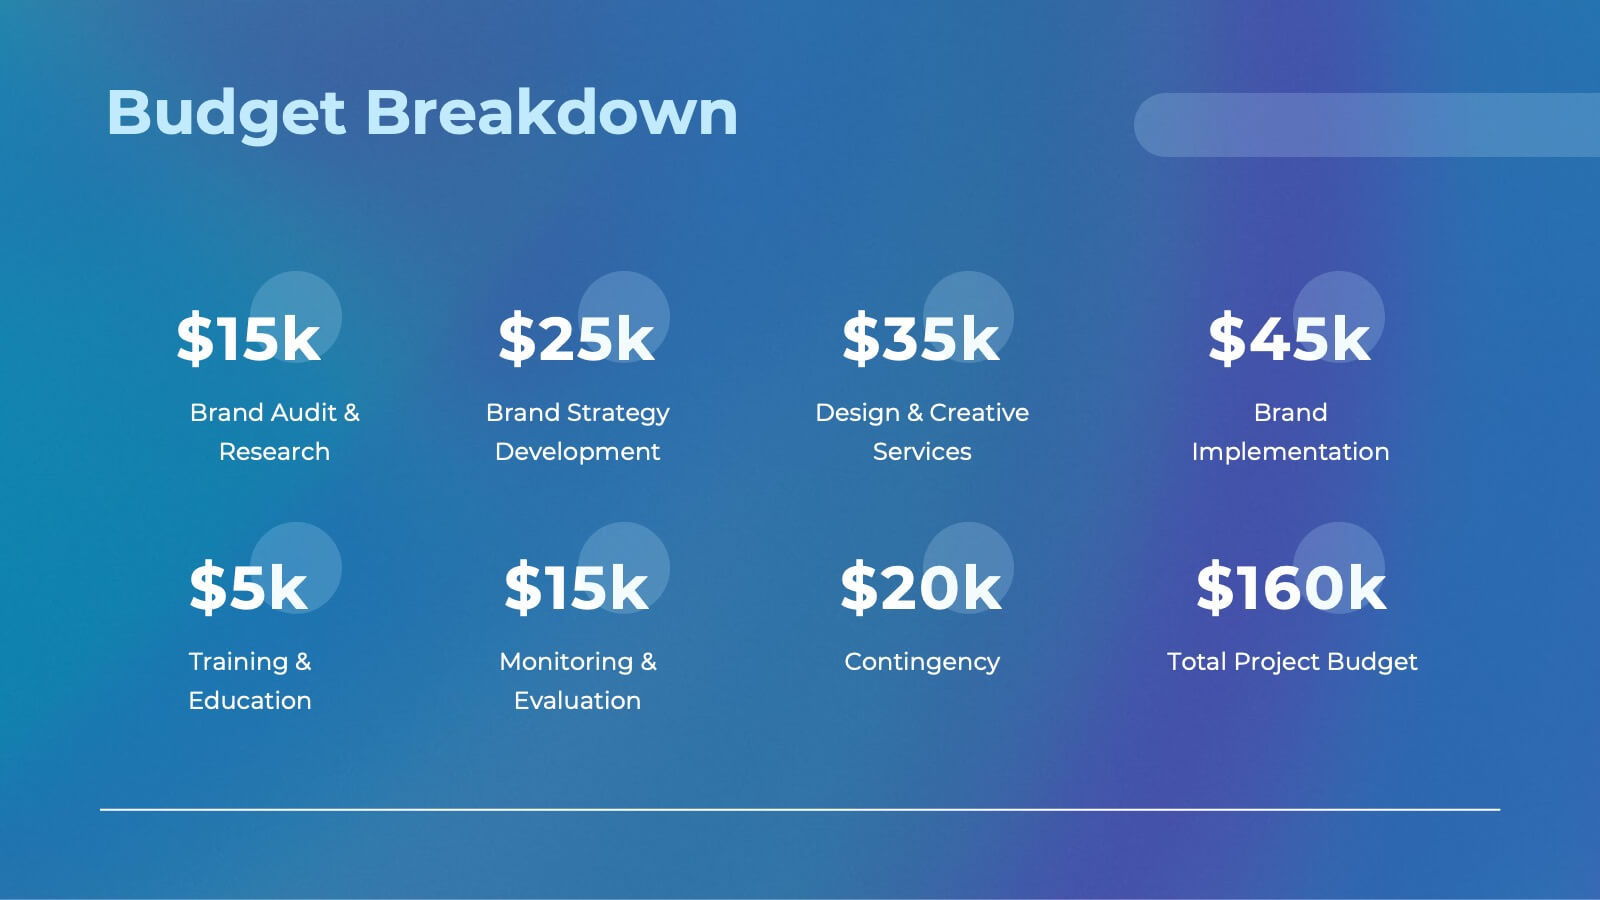
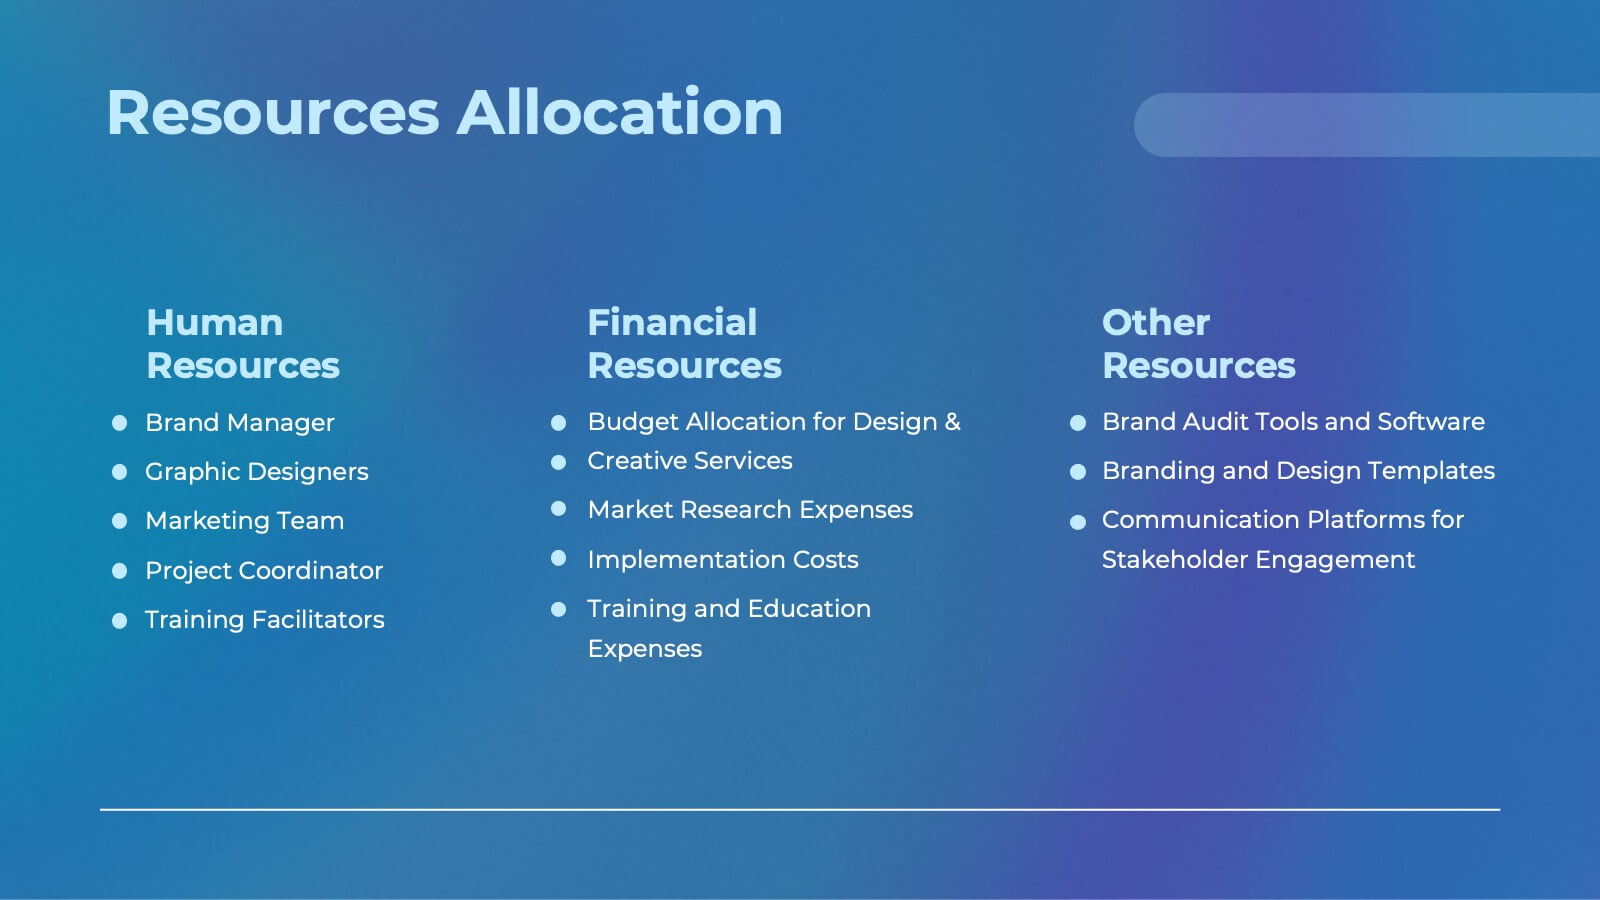

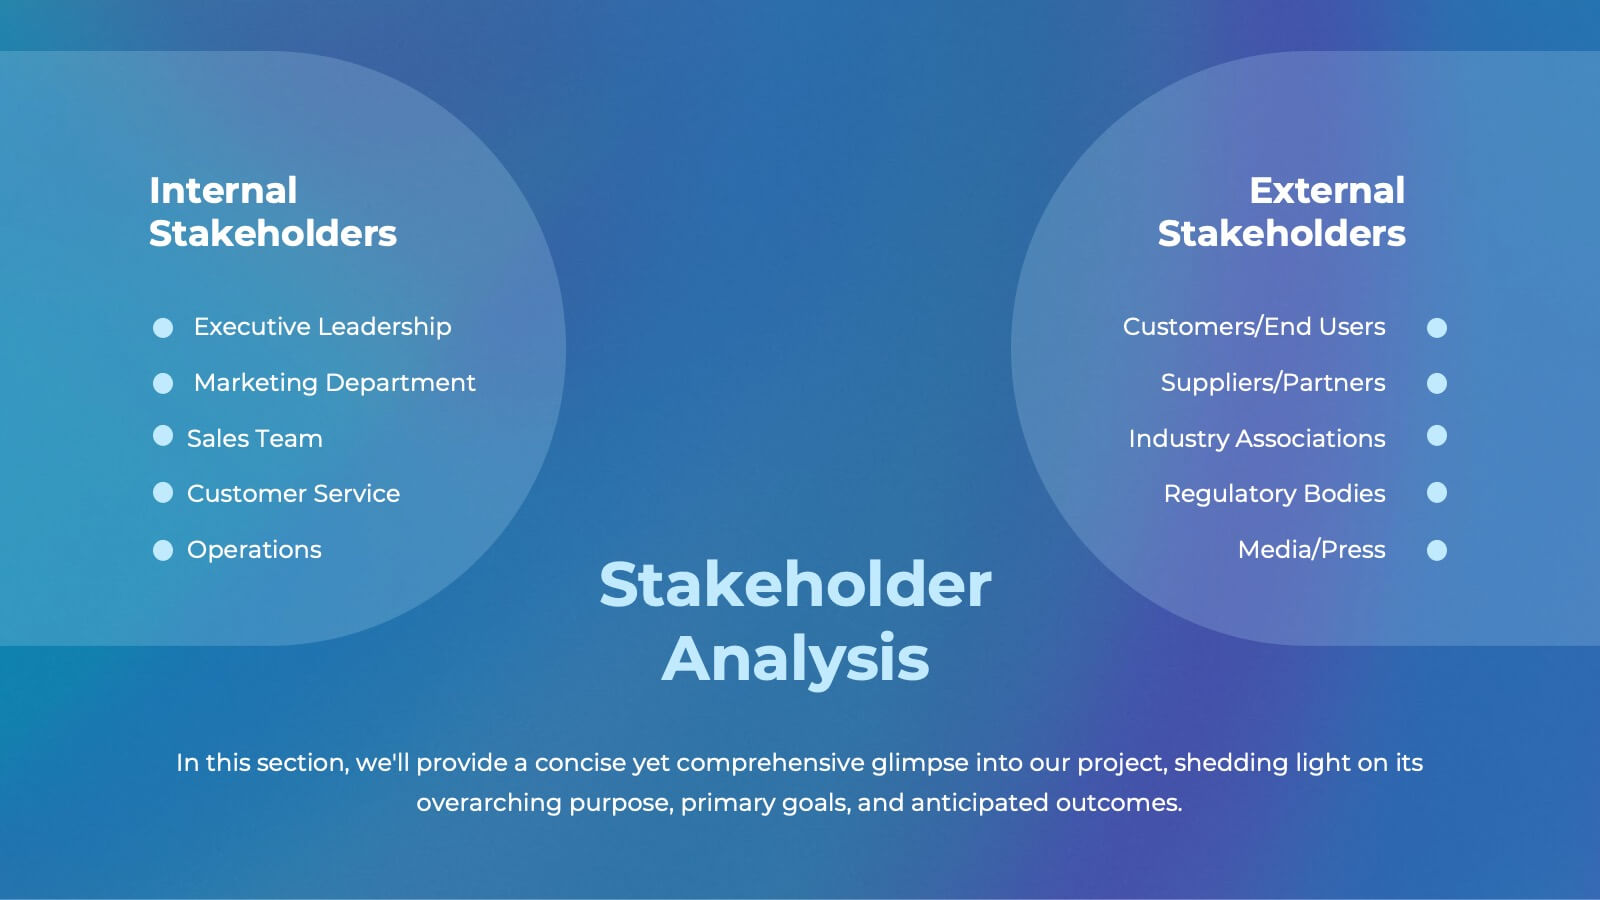
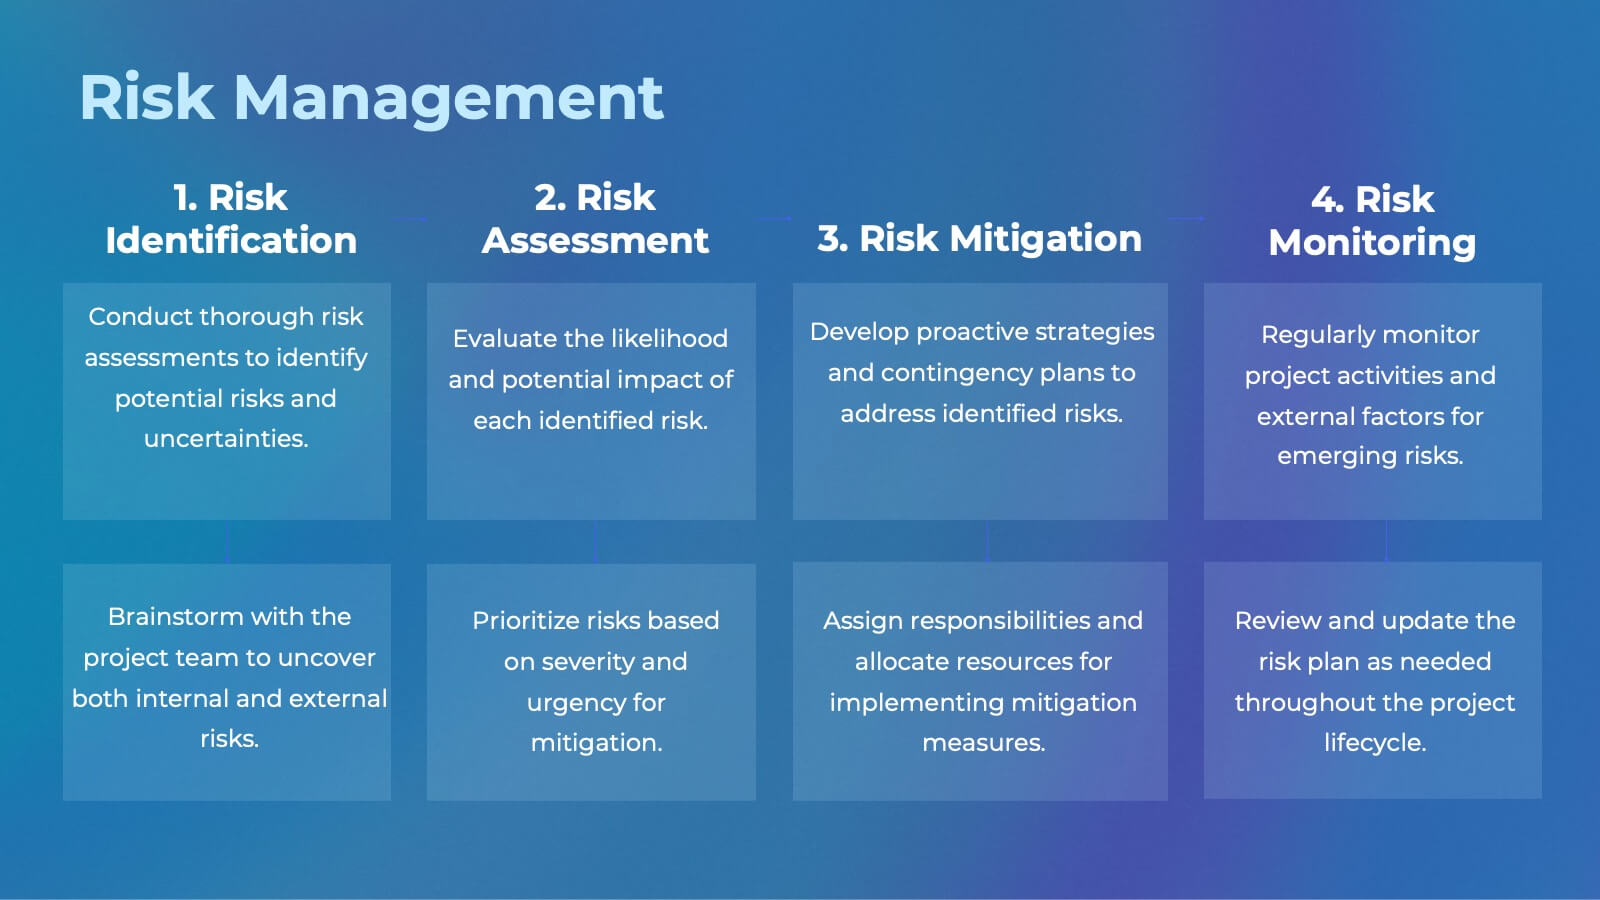


21 slides
Ember Agile Project Plan Presentation
Ready to ace your next project proposal? This sleek presentation template is perfect for outlining objectives, timelines, and budgets. Designed for professionals aiming to impress stakeholders and secure approvals. Compatible with PowerPoint, Keynote, and Google Slides, it ensures a smooth and professional presentation every time. Ideal for project managers and business leaders.


4 slides
Economic Trends and Analysis of North America Map Presentation
Present key regional insights with this North America economic analysis map. Compare up to four locations using percentage stats and customizable titles. Ideal for showcasing market trends, financial metrics, or growth data. Fully editable in PowerPoint, Keynote, and Google Slides—perfect for economic forecasts, business reports, or strategy meetings.


6 slides
Presentation Roadmap Agenda Outline
Plan your sessions with clarity using the Presentation Roadmap Agenda Outline Presentation. This sleek visual tracks five key points along a timeline, using numbered markers and matching text areas—perfect for agendas, project stages, or presentation flows. Fully customizable in PowerPoint, Keynote, and Google Slides.


10 slides
Corporate Governance and Law Presentation
Master the essentials of organizational oversight with the "Corporate Governance and Law" template, which offers a structured approach to business management, effectively illustrating key elements such as performance, strategy, governance, talent, and integrity. This layout ensures easy comprehension and is ideal for illustrating the hierarchical relationships and regulatory frameworks in corporate environments. Compatible with PowerPoint, Keynote, and Google Slides.