


Features
- 6 Unique slides
- Fully editable and easy to edit in Microsoft Powerpoint, Keynote and Google Slides
- 16:9 widescreen layout
- Clean and professional designs
- Export to JPG, PDF or send by email


Do you have any questions?
Recommend


7 slides
Big Data Infographic Presentation Template
This Big Data Infographic template is the perfect tool for any business presentation. This template has been designed to help you create truly engaging data-driven visuals, with powerful typography and interesting details that help draw in your audience. Introduce your business to the world with this big data infographic template. It's just what you need to describe the role of big data in the evolution of modern businesses. Our Big Data Infographic Presentation features all the tools for you to create wonderful charts, graphs, transitions and striking shapes both for your text and images.


7 slides
SEO Specialist Infographic
A Search Engine Optimization (SEO) Specialist is a professional responsible for improving the visibility and ranking of a website in search engine results pages. The goal of this infographic template is to drive organic, unpaid traffic to a website by optimizing its content, structure, and technical aspects to align with search engine algorithms. Embark on a visually stimulating exploration of the dynamic world of SEO. This captivating infographic is carefully crafted to offer a comprehensive understanding of Search Engine Optimization, empowering both beginners and experts to enhance their online presence and rankings.


20 slides
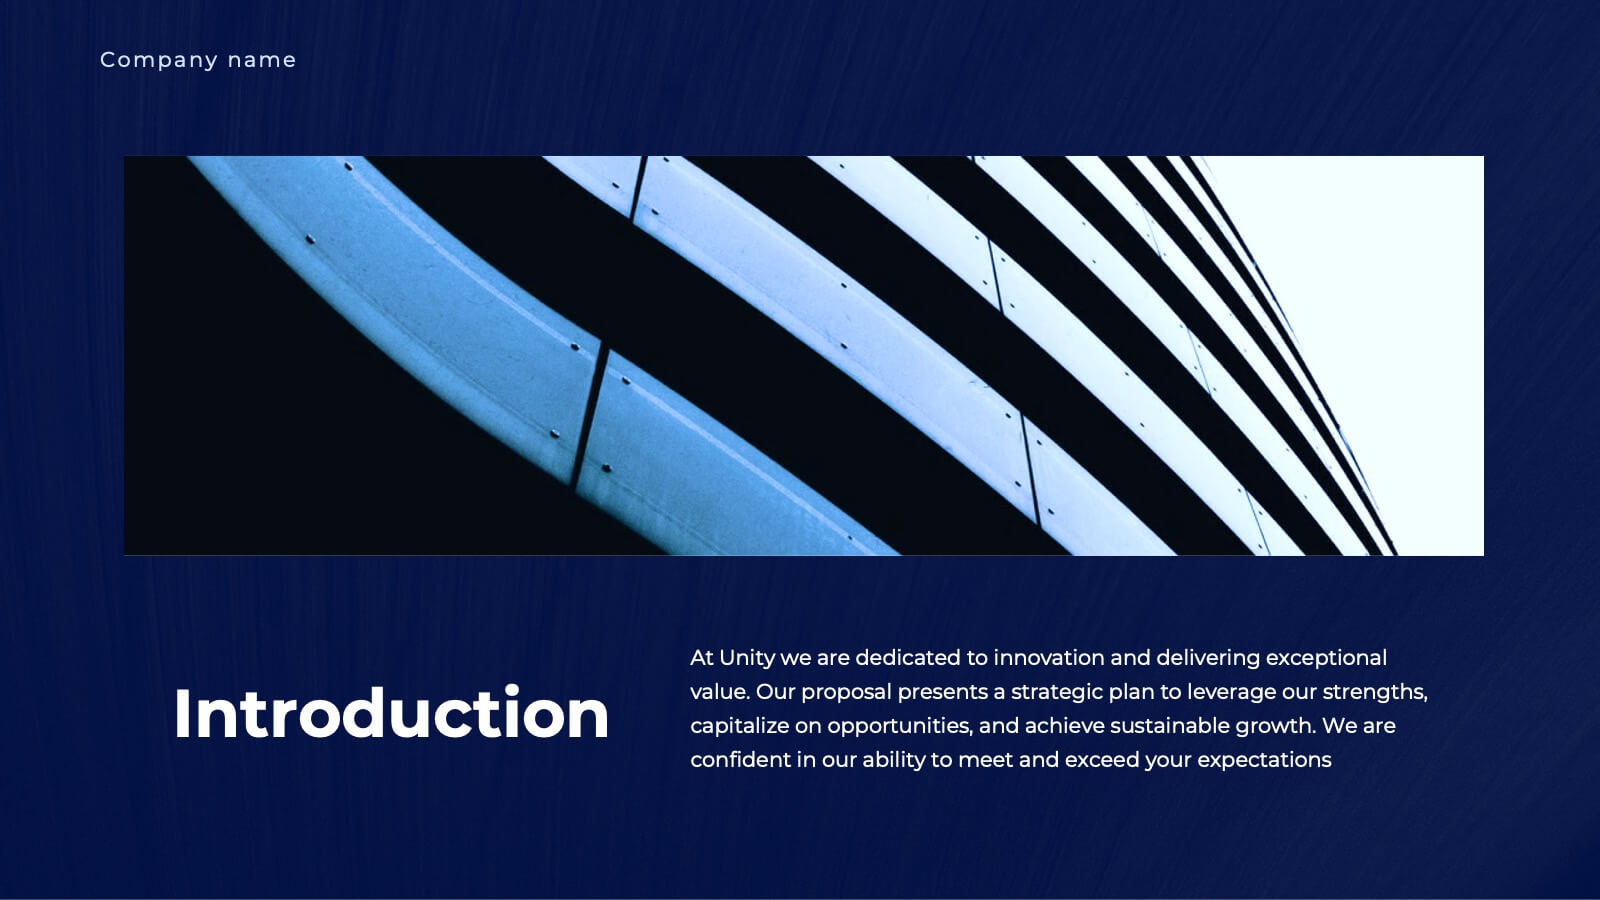
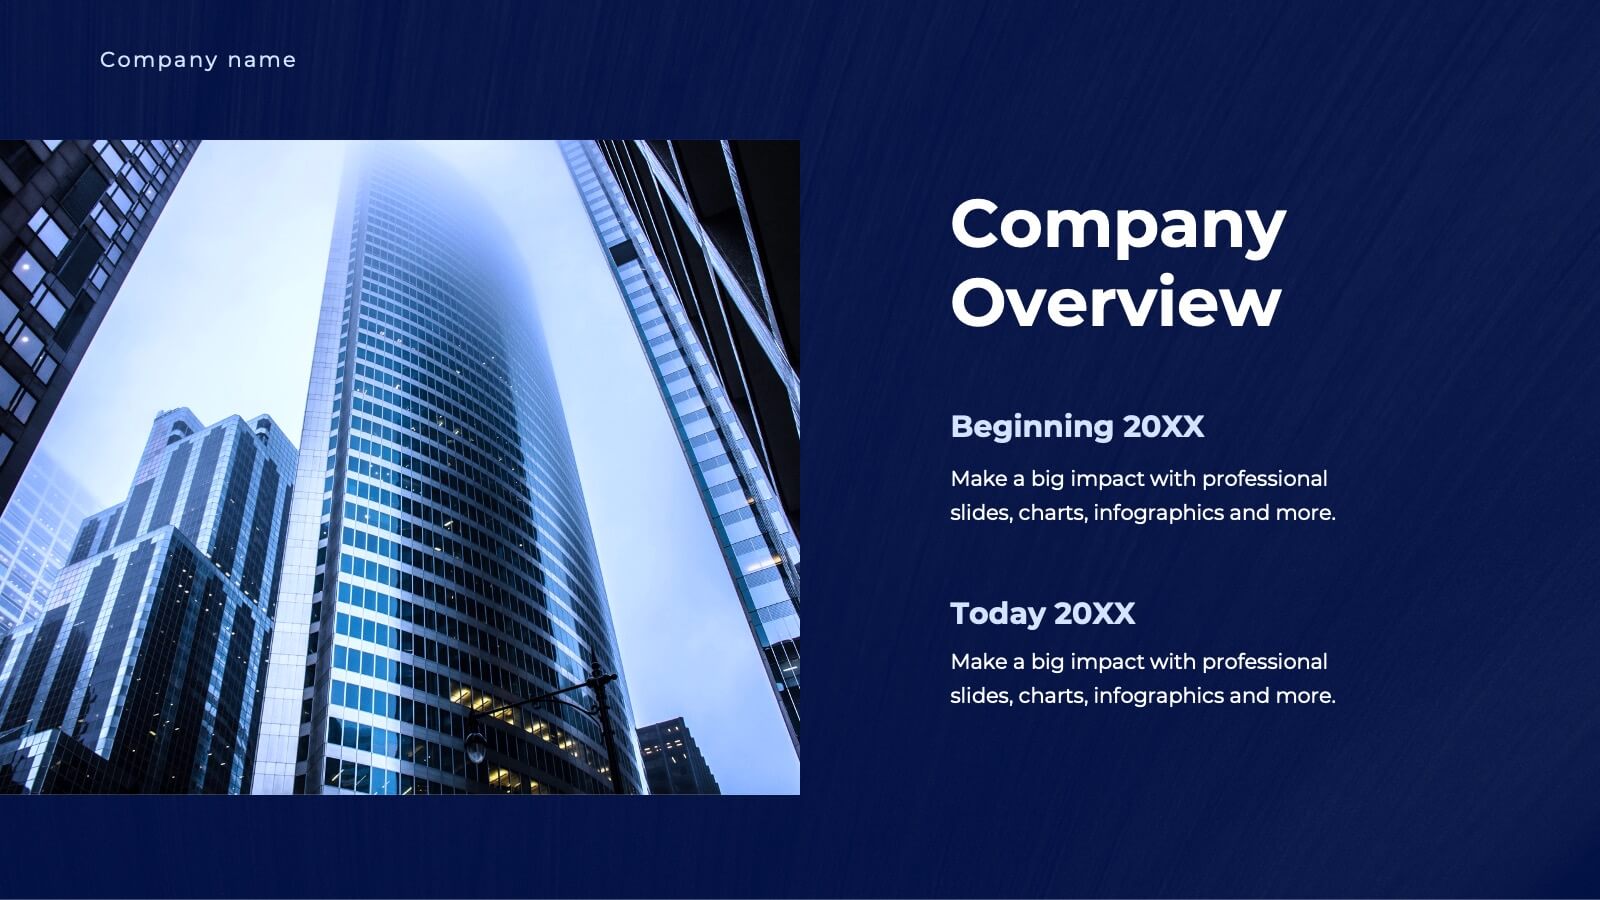
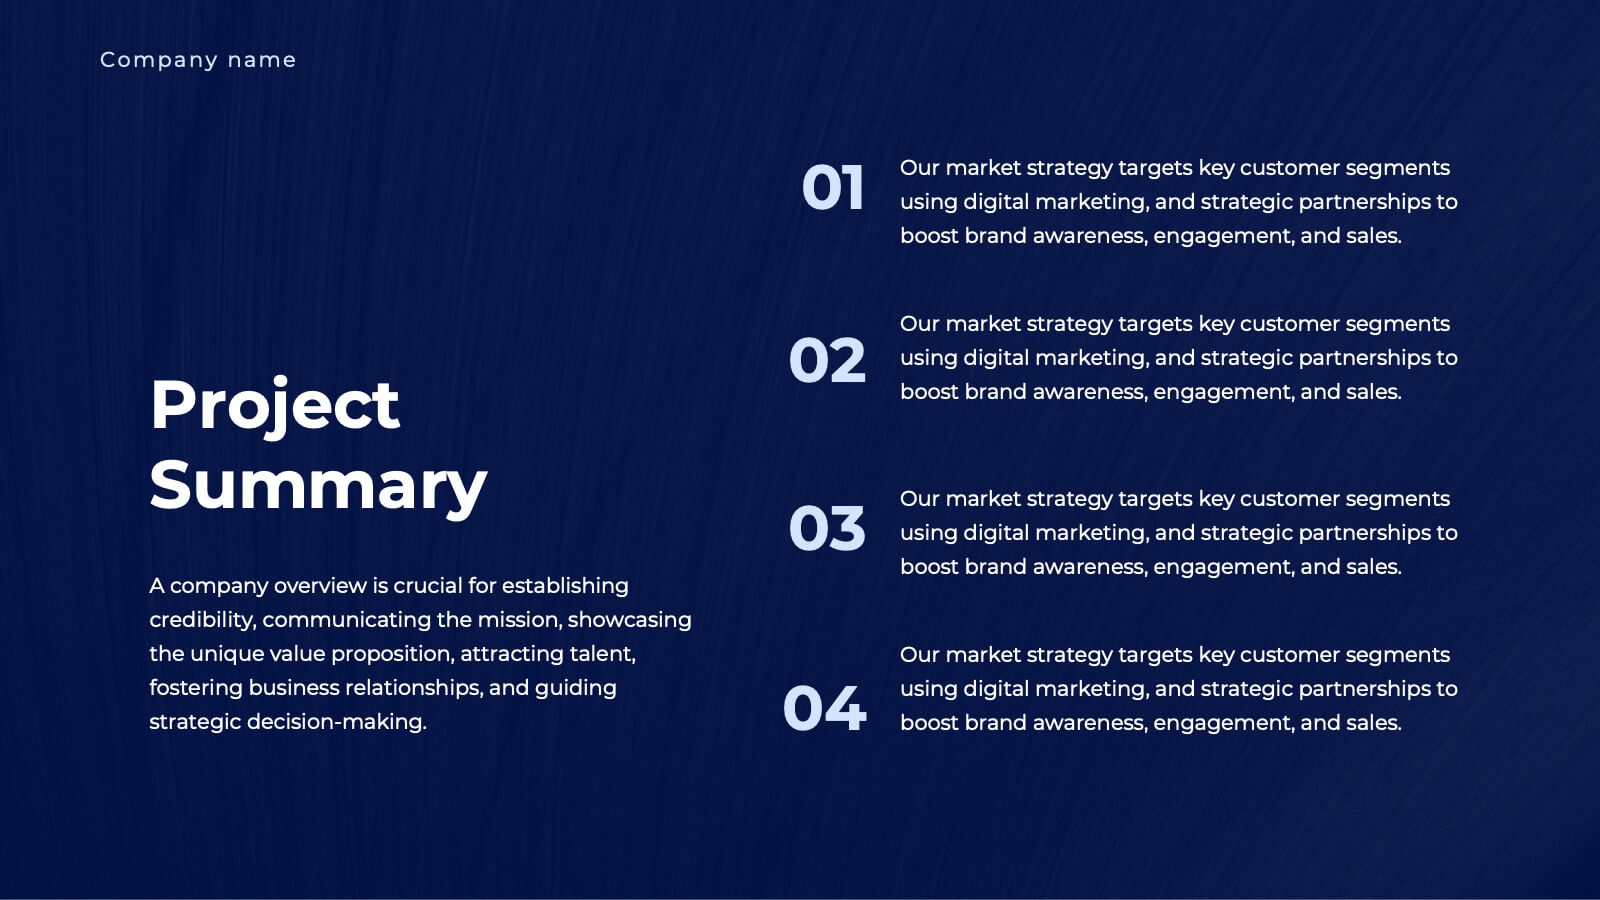
Unity Business Proposal Presentation
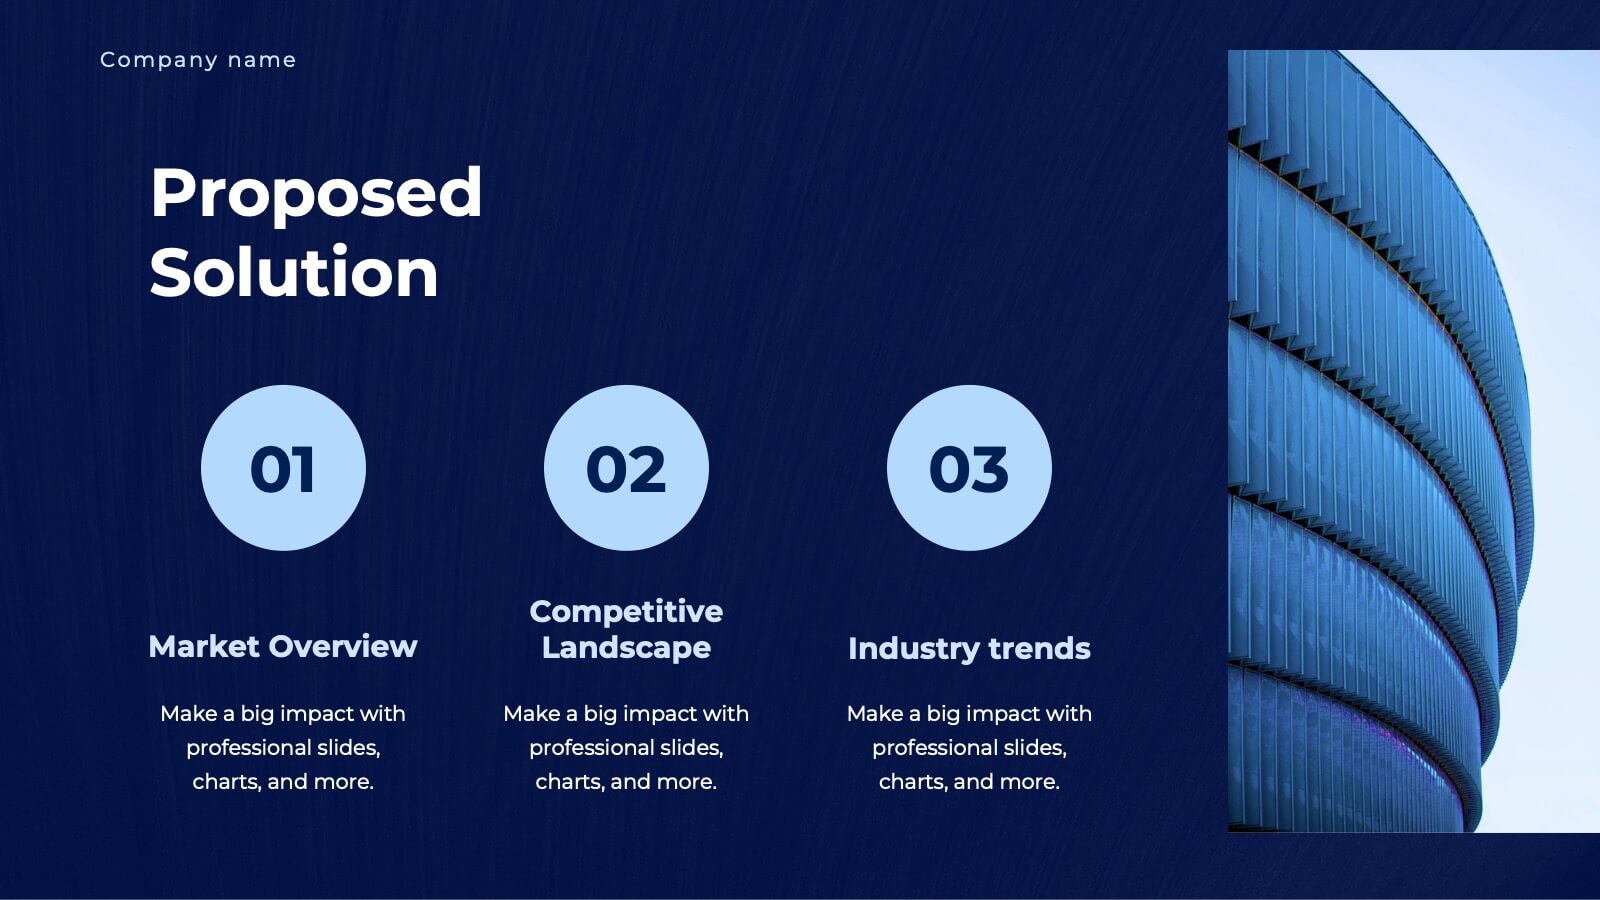
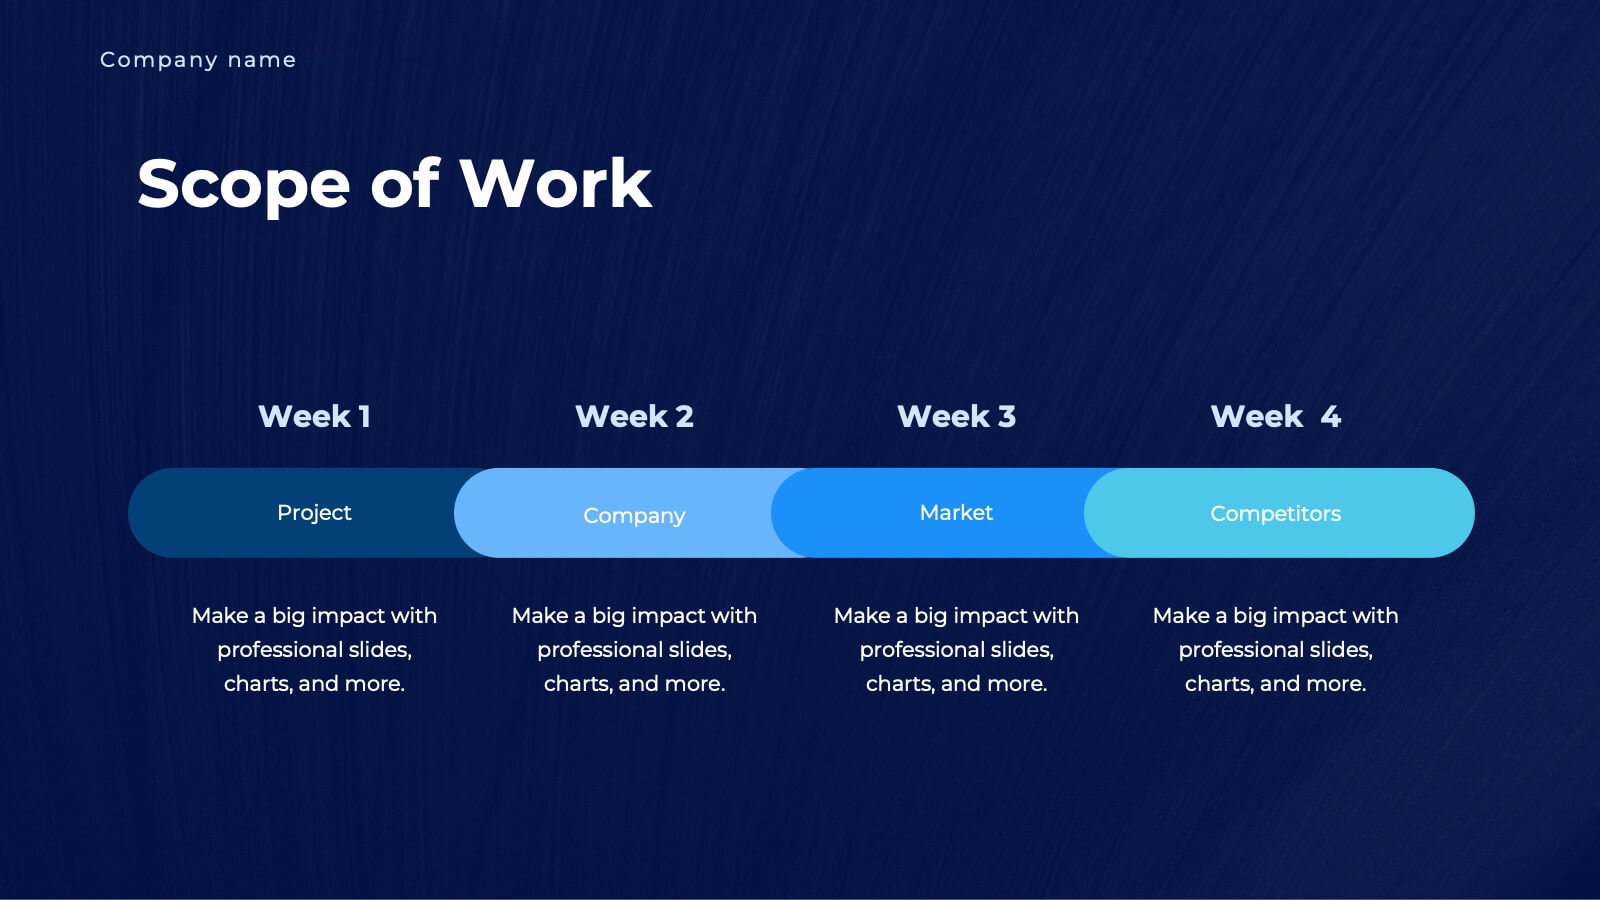
Take your business proposals to the next level with this elegant and comprehensive template! Perfect for presenting company overviews, project summaries, and detailed solutions. Ideal for business professionals looking to impress clients and stakeholders. Compatible with PowerPoint, Keynote, and Google Slides, this template ensures your proposals are impactful and professional.


6 slides
Body Anatomy Infographic
Anatomy refers to the biological structures and systems that make up the body reproductive and organs, as well as other physiological unique features. This infographic template is a visual representation that provides information about the various structures and systems within the anatomy. This can be a valuable educational tool for understanding the anatomy and functions of reproductive and other related systems. This informative Anatomy Infographic can serve as a valuable resource for educational settings, healthcare professionals, and anyone interested in understanding the complexities of the body.


6 slides
Company Expansion Timeline Presentation
Show your company’s growth story in a way that’s both professional and visually captivating. This presentation template helps you outline milestones, future goals, and expansion phases with clarity and style. Fully customizable and compatible with PowerPoint, Keynote, and Google Slides for effortless editing and polished results.


6 slides
Supply Chain Risk Infographic
Supply chain risk refers to the potential disruptions, vulnerabilities, and uncertainties that can negatively impact the flow of goods, services, and information within a supply chain network. This infographic aims to provide a clear overview of the different types of risks that can disrupt the supply chain and the strategies to mitigate those risks effectively. This infographic is designed to help businesses and supply chain managers understand and manage potential vulnerabilities in their supply chains. This template is fully customizable and compatible with Powerpoint, Keynote, and Google Slides.


5 slides
Traveling Options Infographics
There are various traveling options available, depending on the destination, budget, and personal preferences. These infographic templates are a comprehensive tool for presenting different modes of transportation and travel options. This is the perfect option if you're delivering a presentation on travel planning, transportation choices, or sustainable travel, this template will help you present information in a visually appealing and informative way, assisting your audience in making well-informed decisions for their travel needs. This template is designed to be compatible with PowerPoint, Keynote, and Google Slides.


4 slides
Professional Business Company Profile Presentation
Present your business with confidence using the Professional Business Company Profile Presentation. Featuring clean design, geometric elements, and photo placeholders, this template is ideal for showcasing your company’s identity, values, and services. Fully customizable in PowerPoint, Google Slides, and Canva for seamless branding and presentation updates.


4 slides
Income and Expense Highlights Presentation
Enhance learning with the Interactive Digital Learning Experience Presentation. This template mimics a multiple-choice format, making it perfect for quizzes, training modules, or eLearning content. Each slide includes labeled options (A–D) alongside a modern vertical interface, ideal for engaging assessments or lesson recaps. Fully editable in Canva, PowerPoint, Keynote, and Google Slides.


7 slides
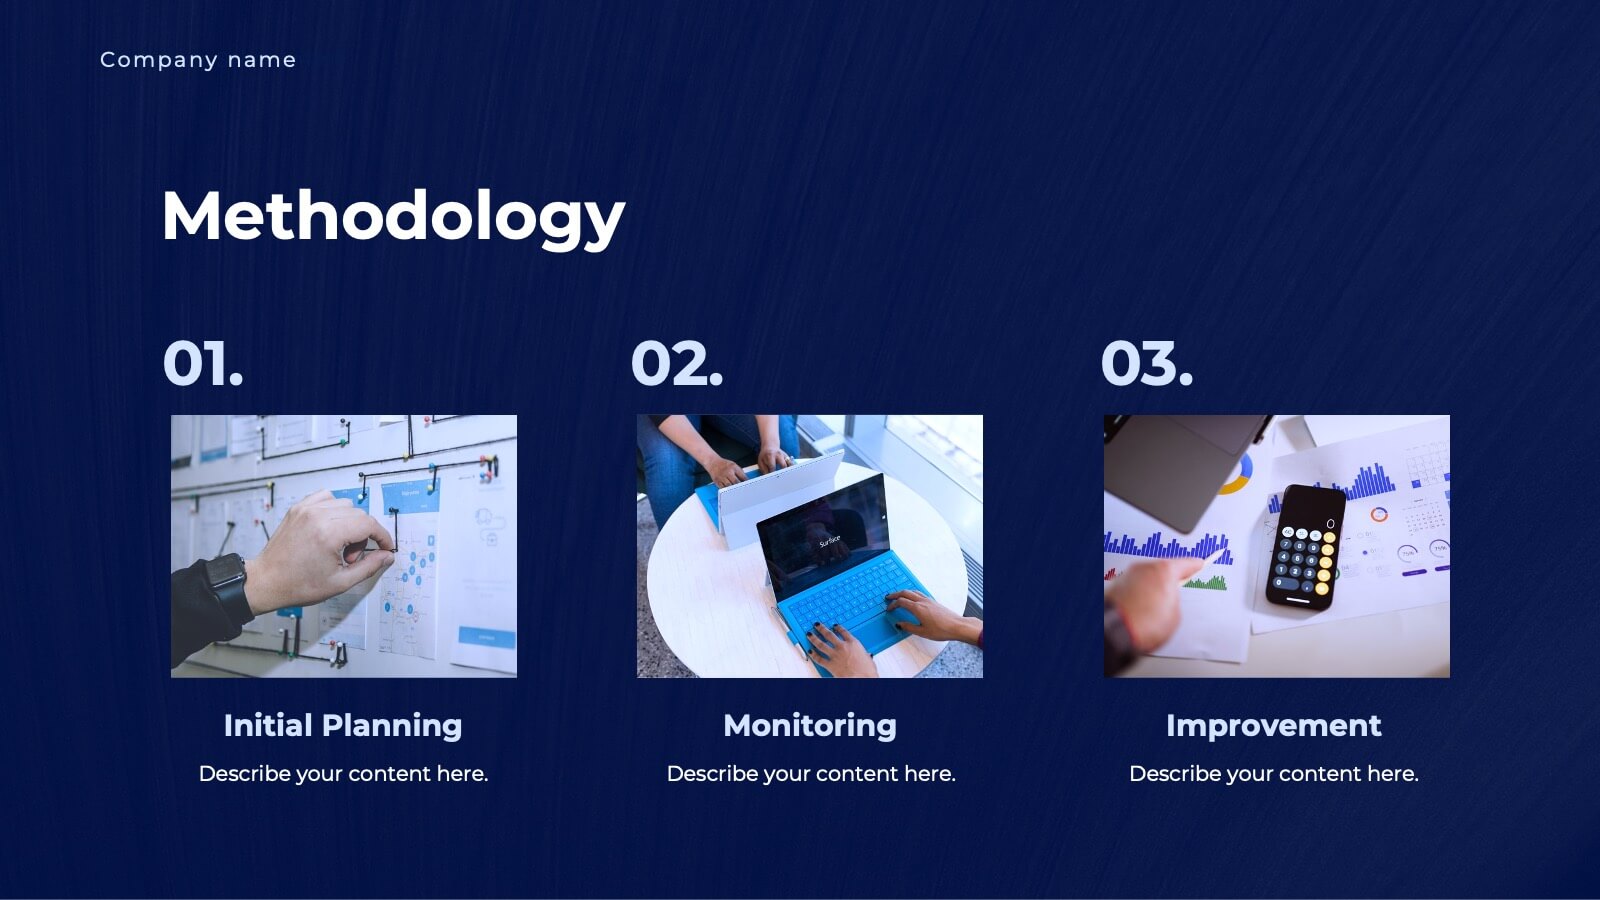
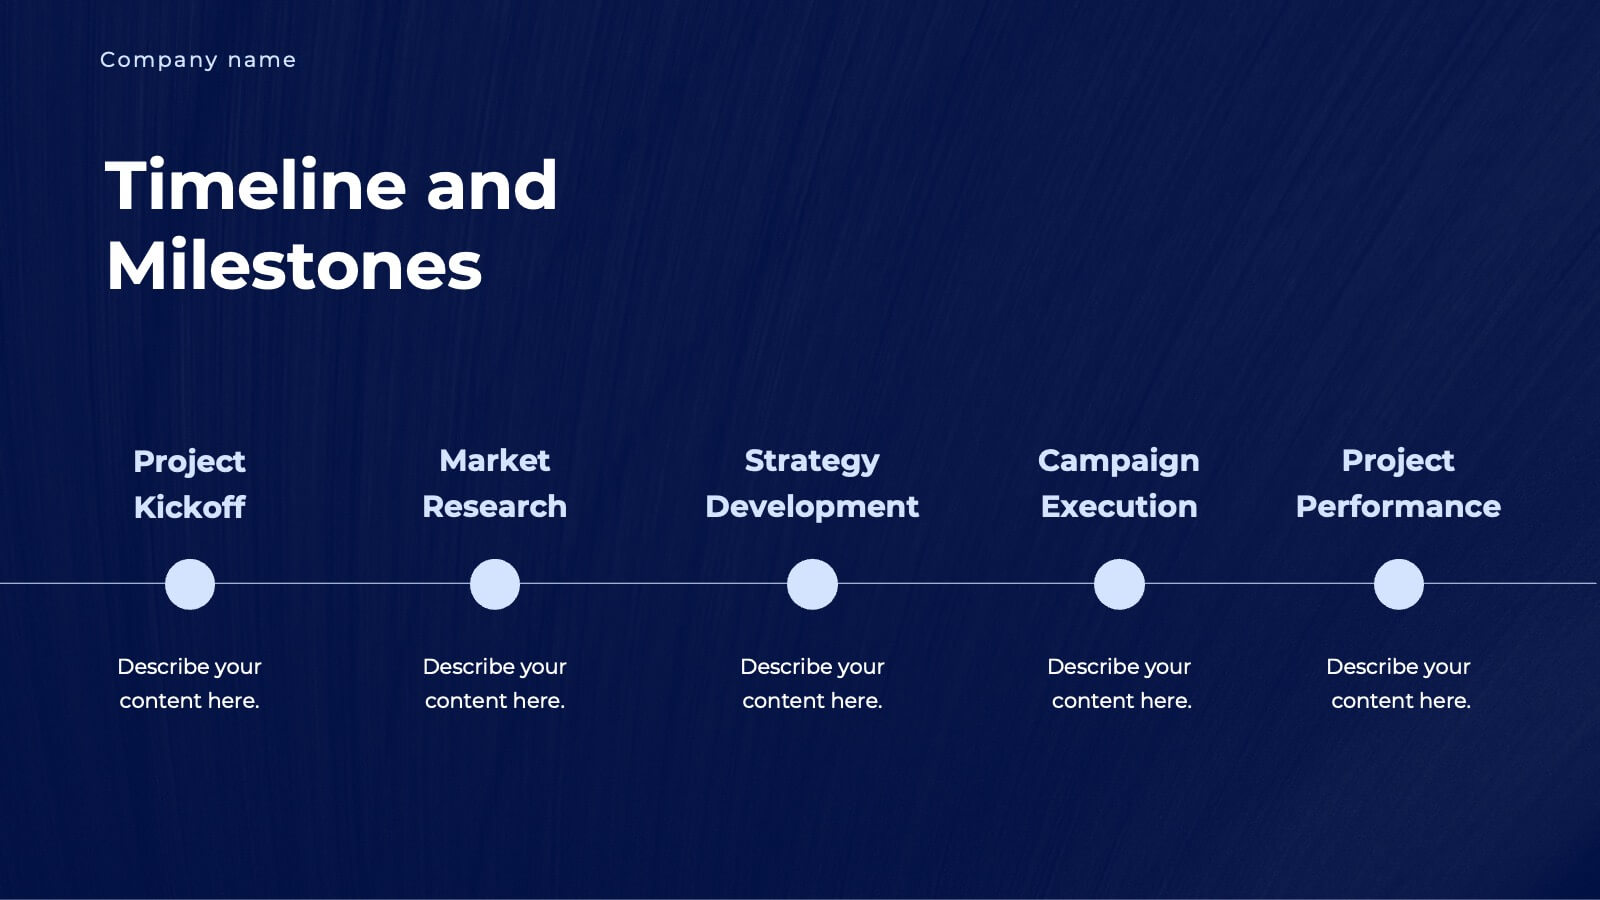
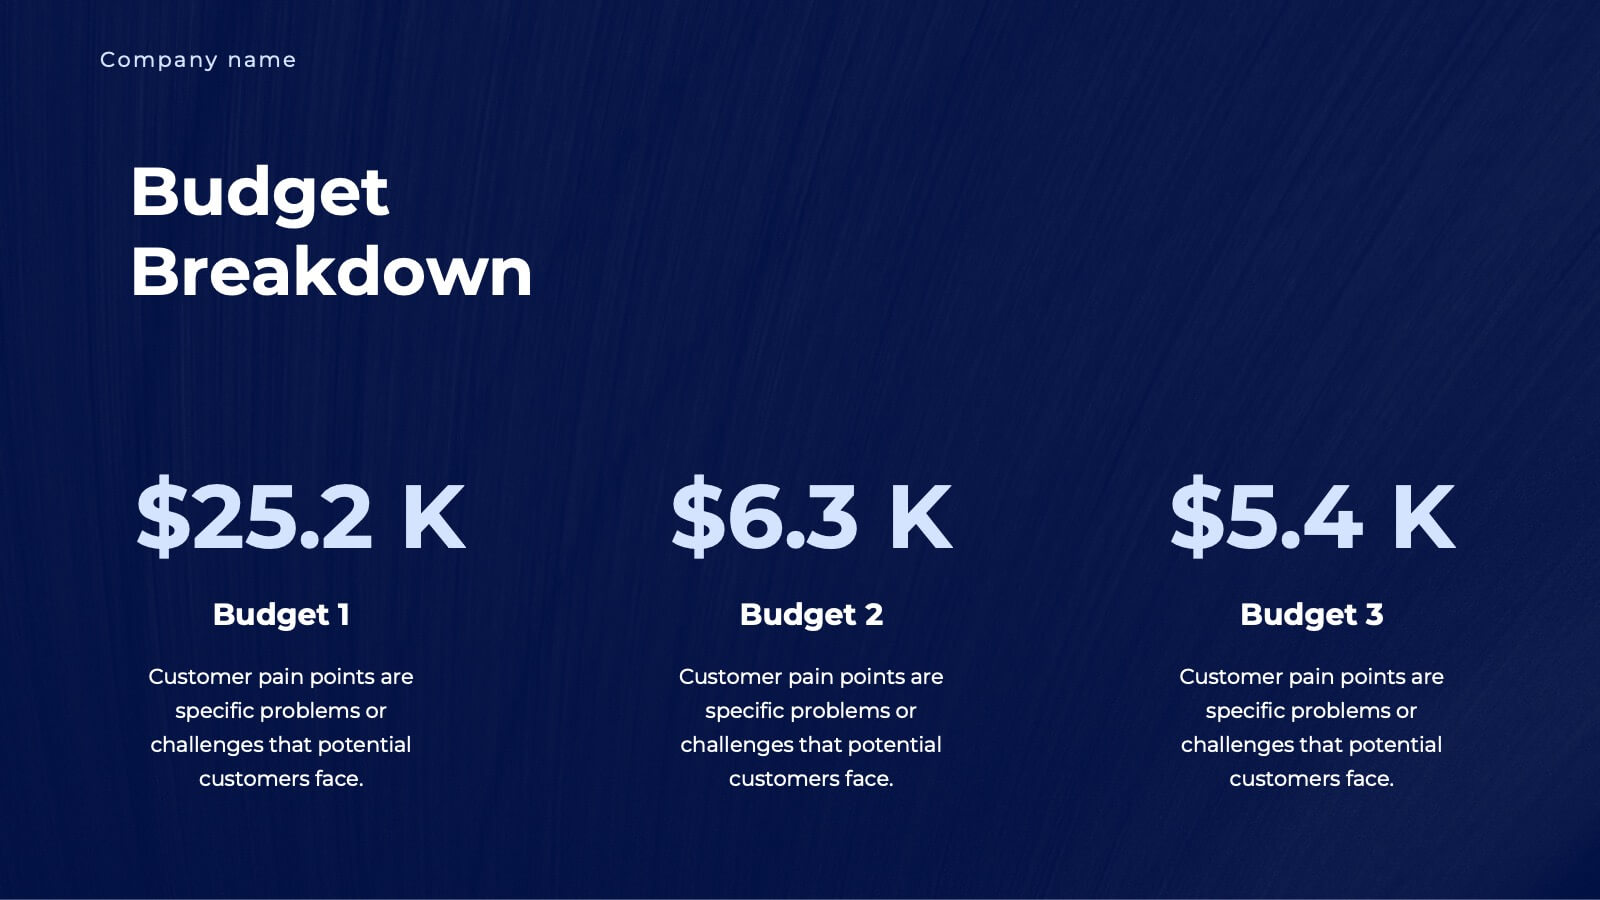
Progress Infographic Presentation Template
Our Progress template is designed with a simple layout for presenting your infographic with flow charts and progress bars. This layout is made to be used as a presentation layer so that you can easily change text and images from one slide to the next. It comes with useful icons and illustrations to help you create a more informative presentation. This is a well-organized template for PowerPoint presentations. It allows you to present important information with clear and concise structure. With its useful design and features, you can create an engaging presentation in just minutes.


6 slides
Employment Law Infographic
Employment law, also known as labor law, is a legal framework that governs the rights, responsibilities, and relationships between employers and employees in the workplace. This infographic template can be an effective way to convey key information about various aspects of employment law in a visually engaging manner. This template allows you to illustrate the importance of workplace safety regulations and the employer's responsibility to provide a safe working environment. The goal of this infographic is to educate and inform your audience about important aspects of employment law while maintaining a visually engaging and easily digestible format.


8 slides
Educational Lesson Plan Presentation
The "Educational Lesson Plan Presentation" template offers a vibrant and engaging method to display educational strategies and frameworks. This template uses a stacked blocks design that visually represents the hierarchical structure of lesson components. Each block is color-coded, facilitating easy distinction between different sections such as Title 01, Title 02, Title 03, and Title 04, which can be customized with specific educational goals or key points. This format is ideal for educators planning their lessons or for presentations at educational seminars, workshops, or teacher training sessions, where clarity and visual structure enhance communication and understanding.


5 slides
Competitive Strategy with Five Forces Presentation
Effectively visualize Porter’s Five Forces with this dynamic funnel-style infographic. Ideal for breaking down buyer power, supplier power, competitive rivalry, threats of substitution, and new entrants in a clear, engaging format. Perfect for consultants, strategists, and educators. Fully editable in PowerPoint, Keynote, and Google Slides.


7 slides
Organizational Analysis McKinsey 7S Presentation
Explore the core of organizational alignment with our McKinsey 7S Model presentation template. Perfectly crafted for analyzing and optimizing business structures, this template guides you through the seven essential elements: Strategy, Structure, Systems, Shared Values, Skills, Staff, and Style. Its intuitive design ensures effective communication and clarity in your presentations. Optimized for PowerPoint, Keynote, and Google Slides, it's an invaluable tool for consultants and business strategists aiming to enhance internal coherence and performance.


7 slides
SEO Strategy and Keyword Plan Presentation
Spark your marketing roadmap with a bold, idea-driven layout that makes every action step clear and memorable. This presentation helps you outline search goals, explore keyword opportunities, and map out strategic priorities in a simple, visual flow. Fully compatible with PowerPoint, Keynote, and Google Slides.


6 slides
Revenue Growth Sales Slide Presentation
Showcase your business success with this Revenue Growth Sales Slide Presentation. The upward-curved arrow design highlights five key milestones, each with customizable titles, icons, and color accents. Perfect for illustrating sales performance, growth metrics, or financial forecasts. Easy to edit in PowerPoint, Keynote, or Google Slides—ideal for sales teams, analysts, and executives.


3 slides
Financial Market Performance Overview Presentation
Analyze trends with clarity using the Financial Market Performance Overview presentation template. This layout features a storefront-style visual paired with pie charts and a trend graph, ideal for displaying key financial metrics, market breakdowns, or investment summaries. Perfect for analysts, economists, and finance teams aiming to convey insights with simplicity and style. Fully editable and compatible with PowerPoint, Keynote, and Google Slides.