


Features
- 4 Unique slides
- Fully editable and easy to edit in Microsoft Powerpoint, Keynote and Google Slides
- 16:9 widescreen layout
- Clean and professional designs
- Export to JPG, PDF or send by email


Do you have any questions?
Recommend


7 slides
Medical Care Infographic Presentation
A medical infographic is a visual representation of information related to medicine, health and healthcare. This infographic design can help people understand complex topics and communicate more effectively about science. This medical infographic template features a dynamic background image, along with a visual representation of information related to healthcare. It is a great way to promote your health-related content. This infographic is a great tool to provide patients with a breakdown of information. This template is compatible with Powerpoint, Keynote and Google Slides.


6 slides
Cyber Security Architect Infographic
Cybersecurity refers to the practice of protecting computer systems, networks, and data from unauthorized access, use, disclosure, disruption, modification, or destruction. This infographic template provides an overview of the role and responsibilities of a cyber security architect. This template is designed to showcase the key skills, expertise, and activities involved in the field of cyber security architecture. The infographic features a modern and professional design that immediately grabs attention. The infographic includes practical tips and best practices for individuals interested in pursuing a career as a cyber security architect.


7 slides
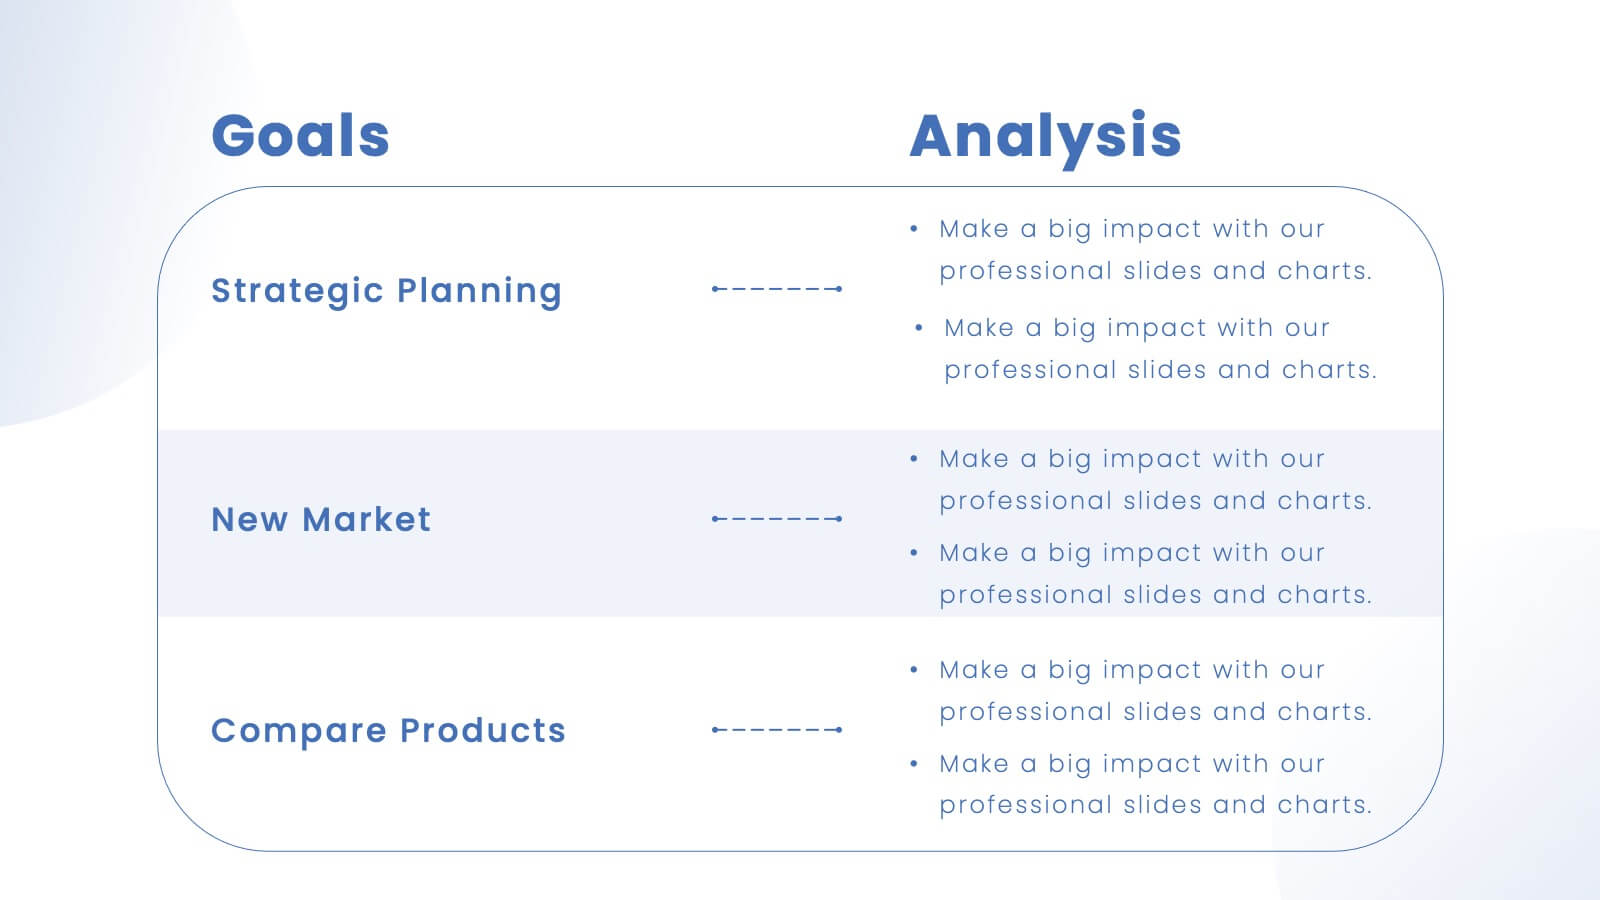
Editable List Slide Presentation
Organize your ideas with style and simplicity using this clean, structured layout designed for clarity and impact. Ideal for summarizing key points, checklists, or action plans, it keeps your content professional and easy to follow. Fully customizable and compatible with PowerPoint, Keynote, and Google Slides for seamless presentation design.


10 slides
Agile Project Status Review Presentation
Streamline your Agile methodologies with our "Agile Project Status Review" presentation templates. Designed to enhance visual communication, these templates help you effectively display project phases from start to finish. Ideal for dynamic project management, they are compatible with PowerPoint, Keynote, and Google Slides, ensuring seamless integration into your workflow.


28 slides
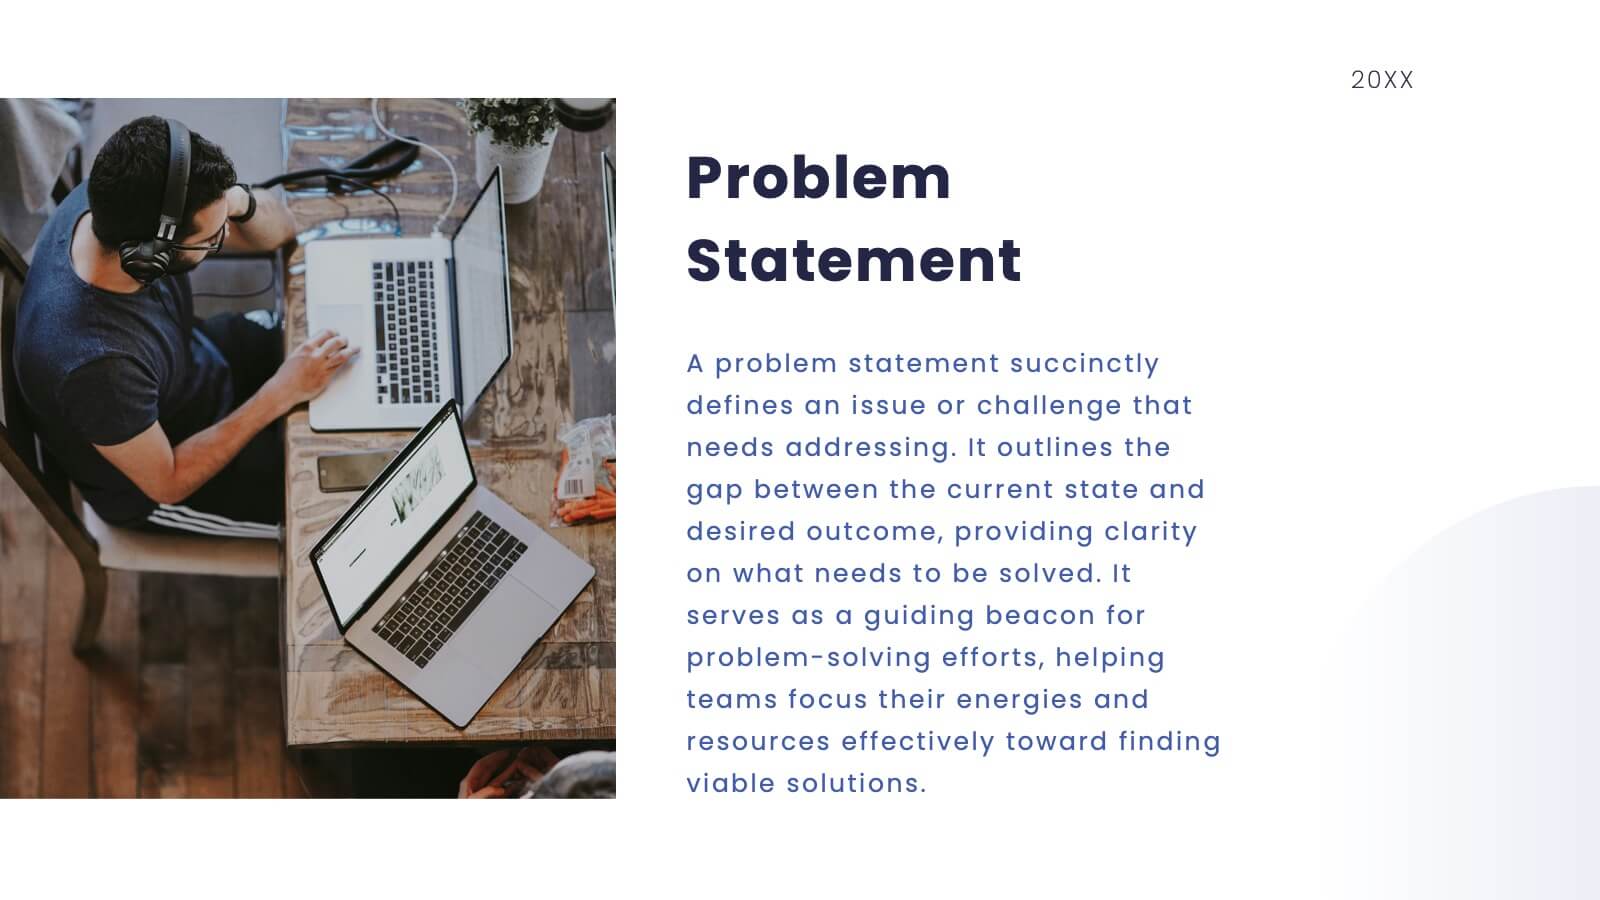
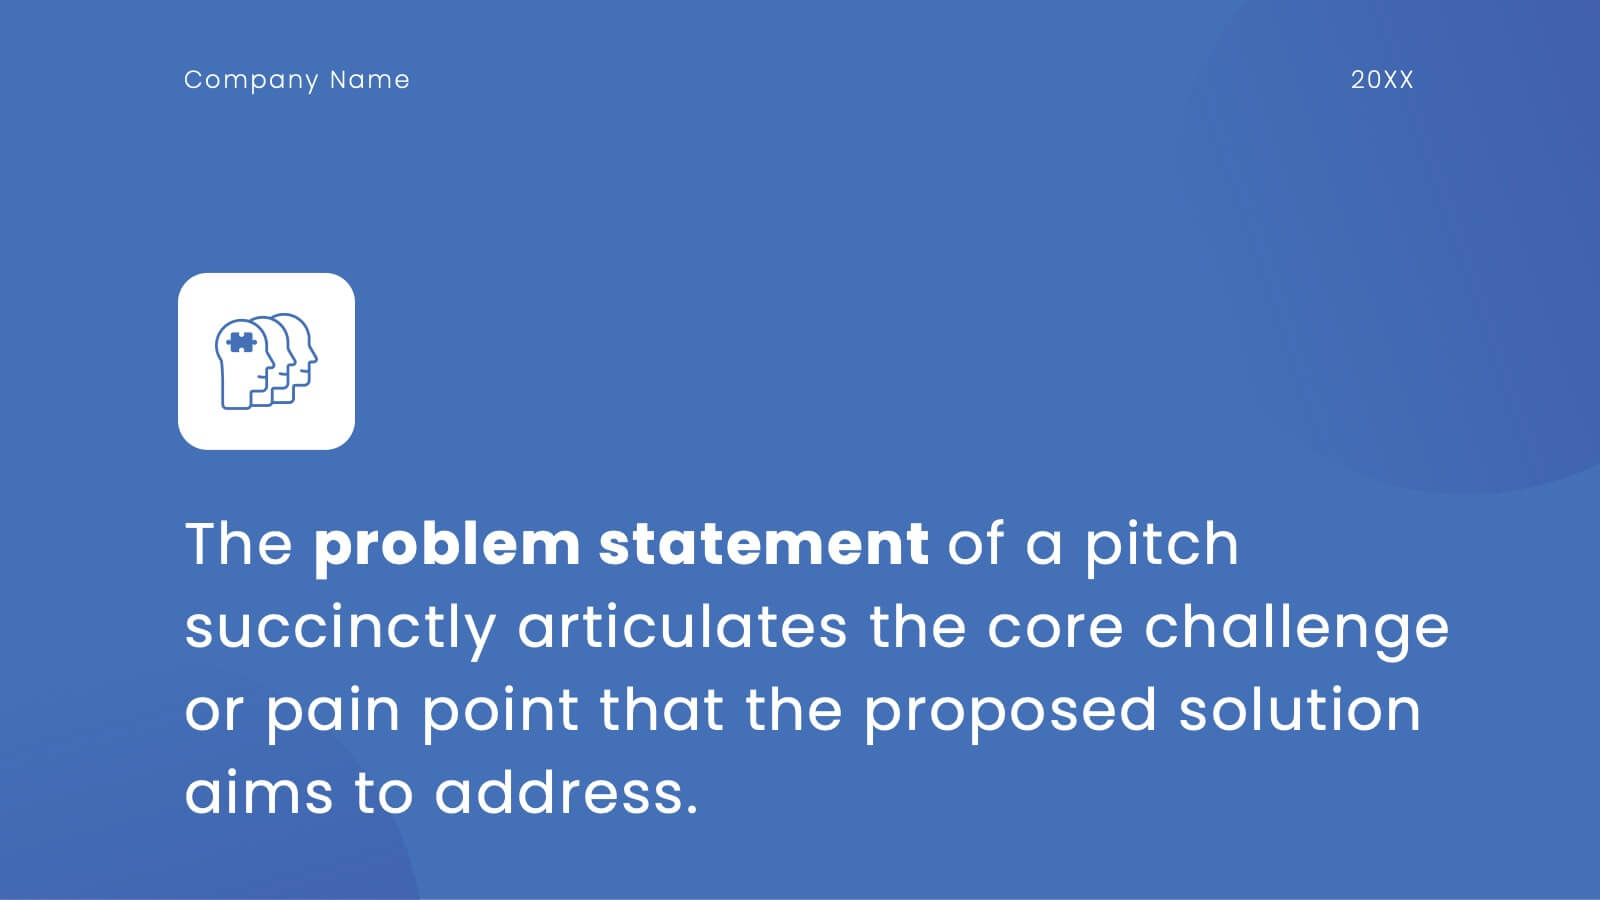
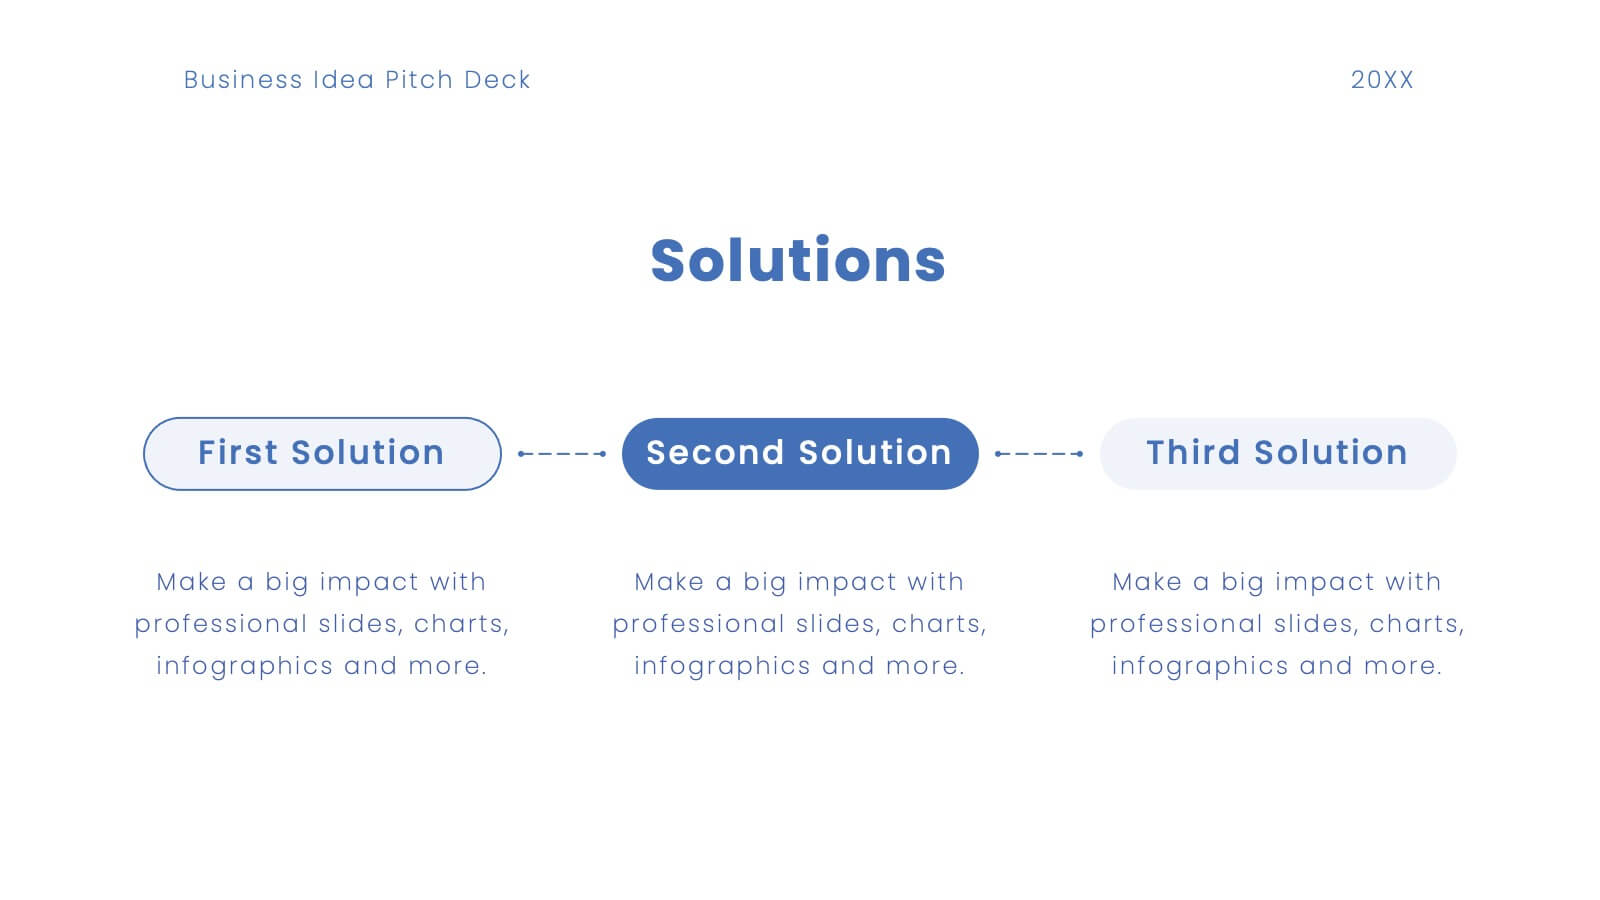
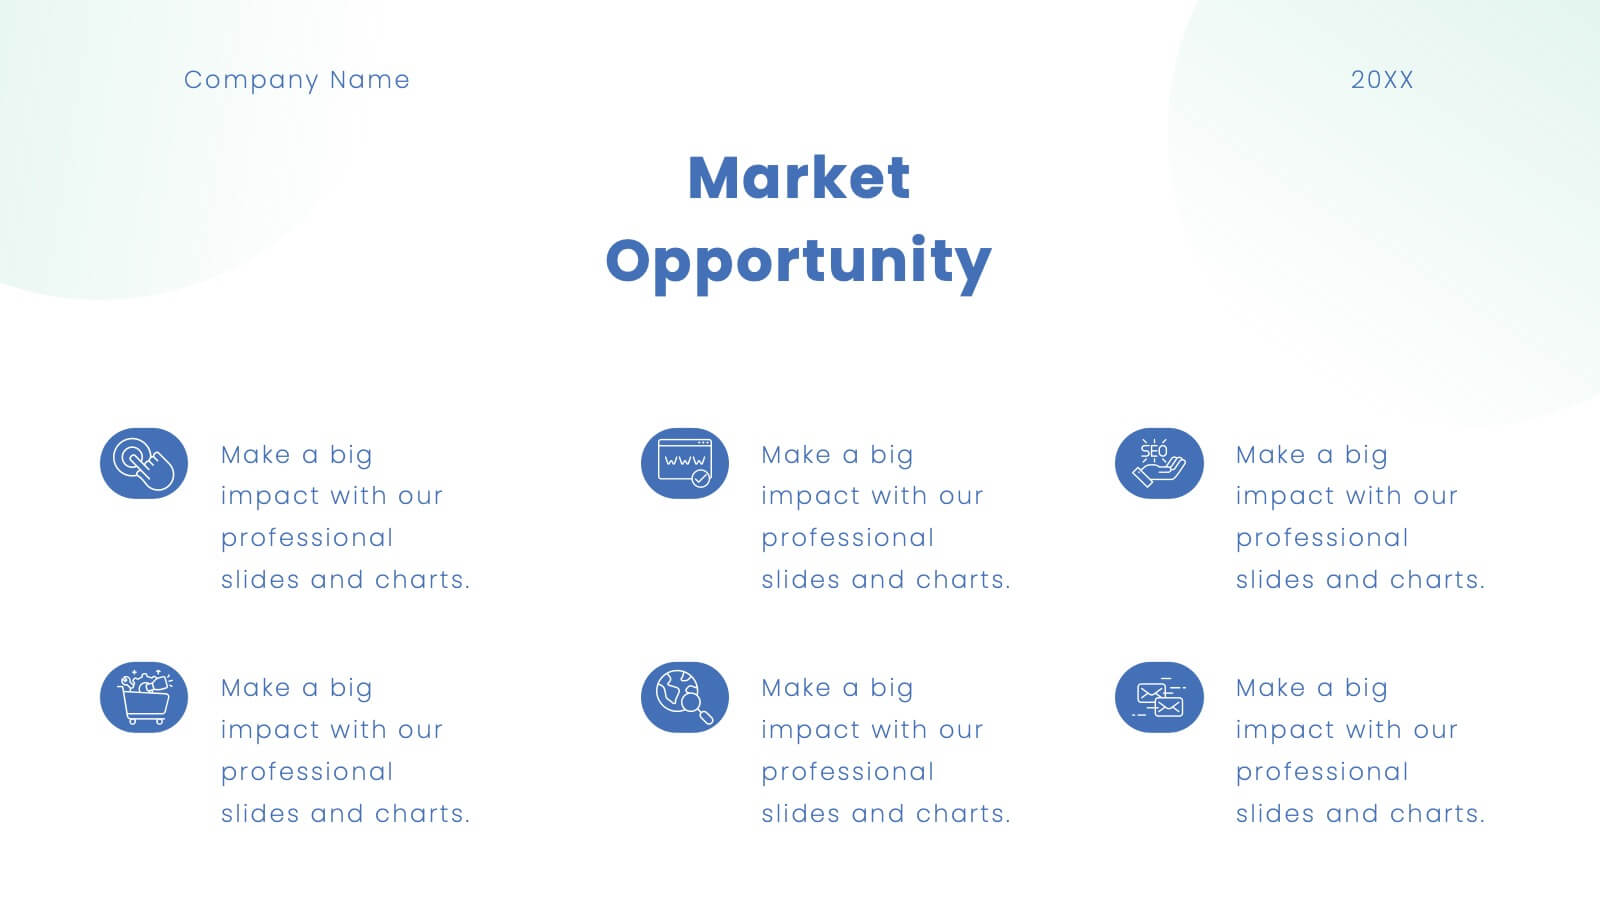
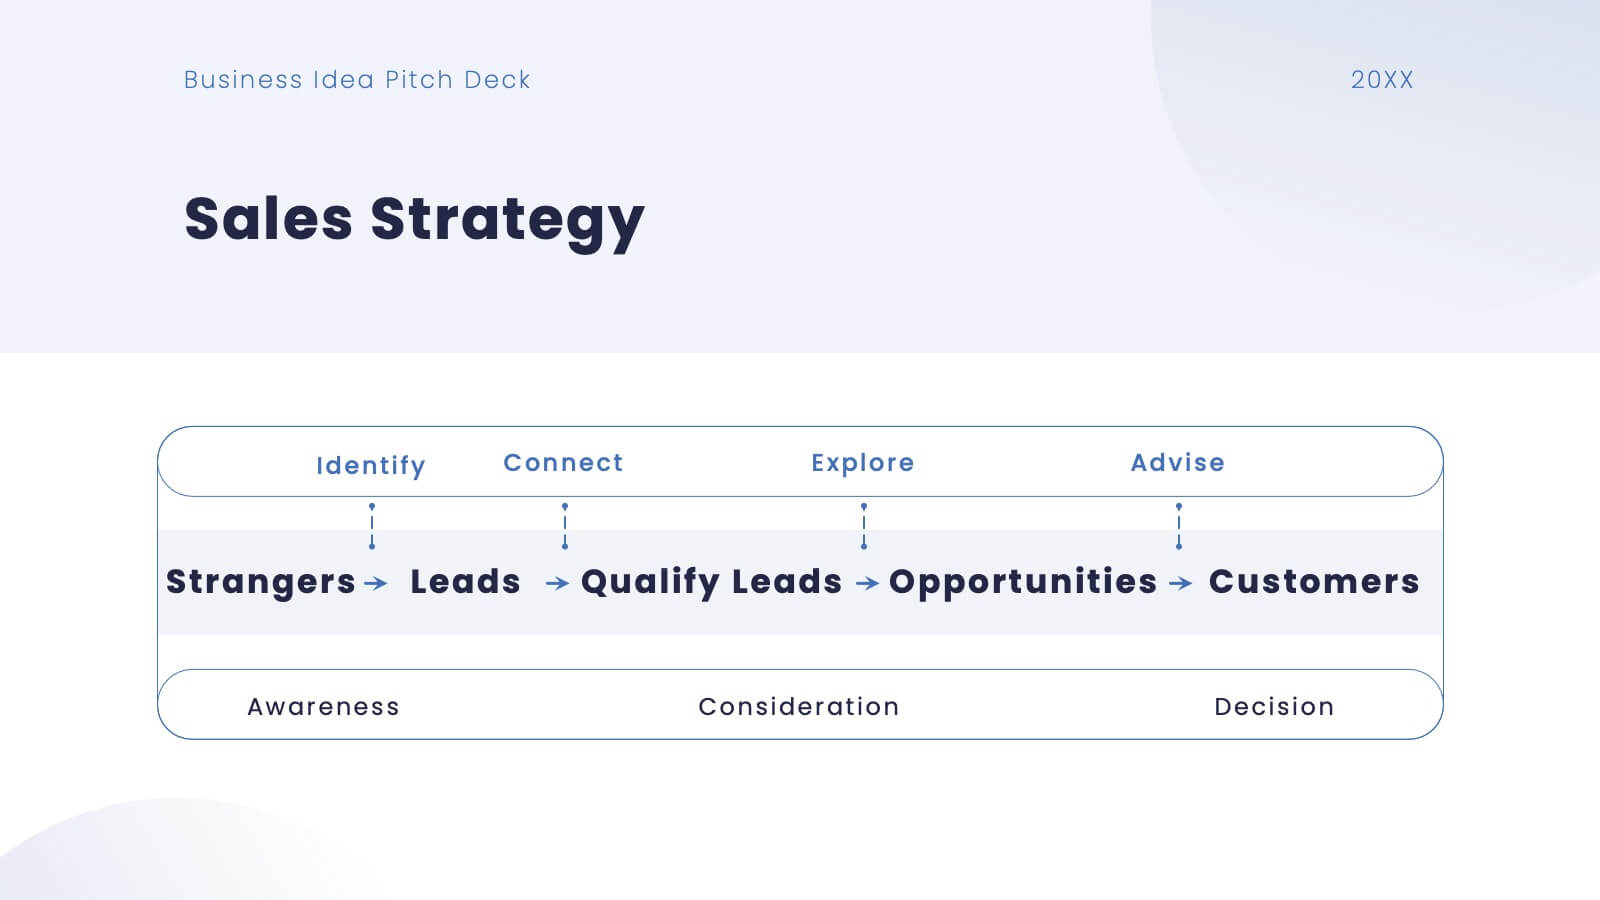
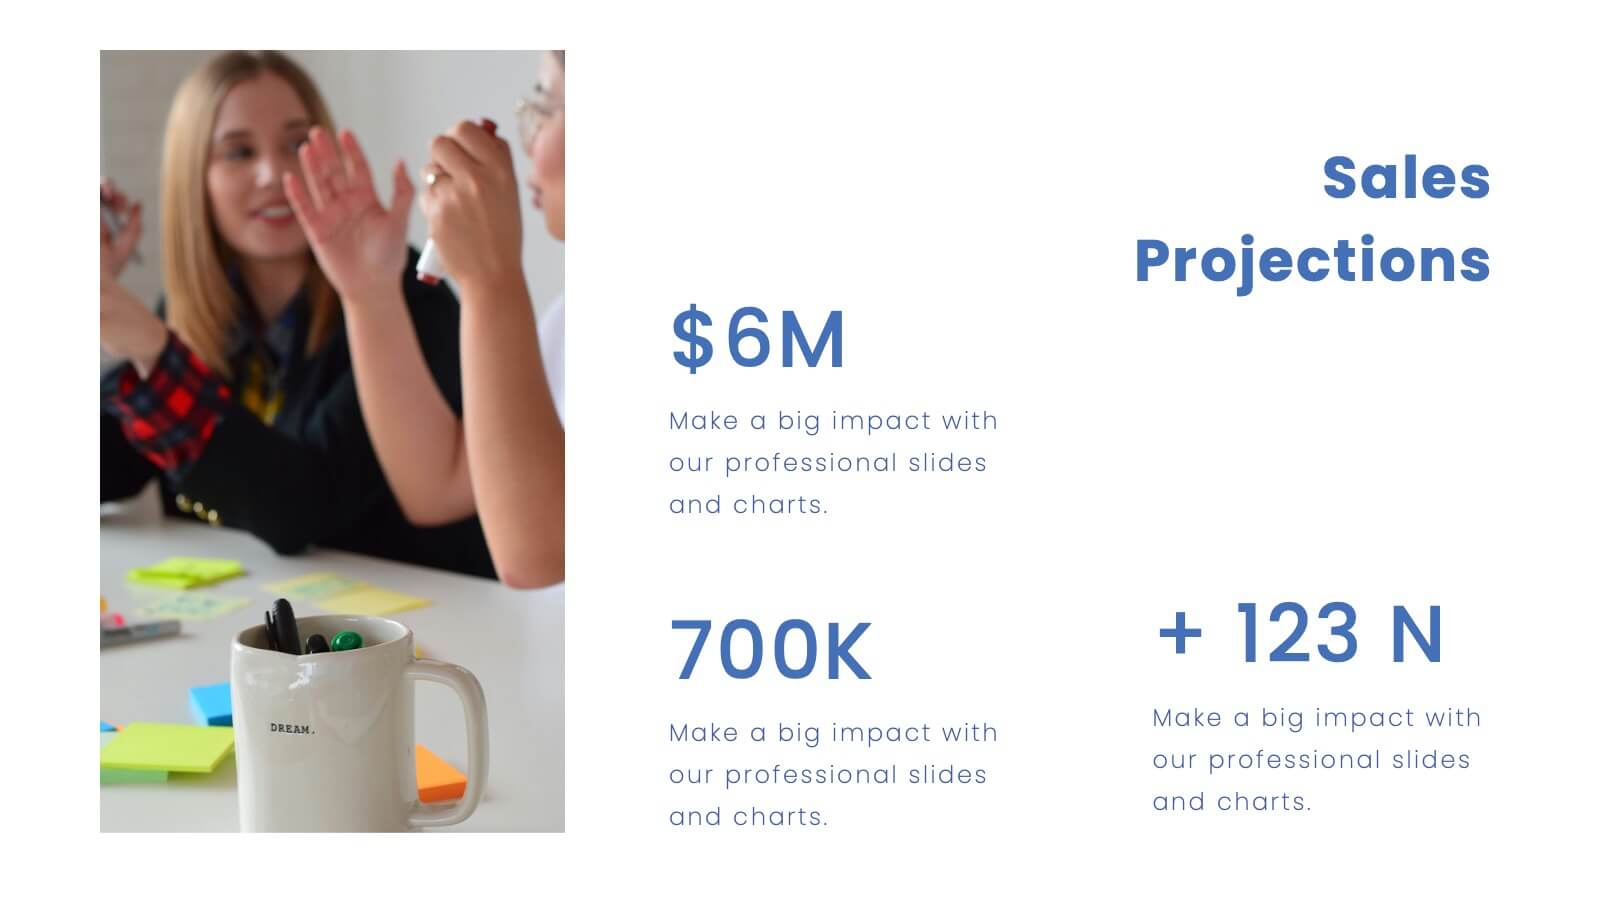
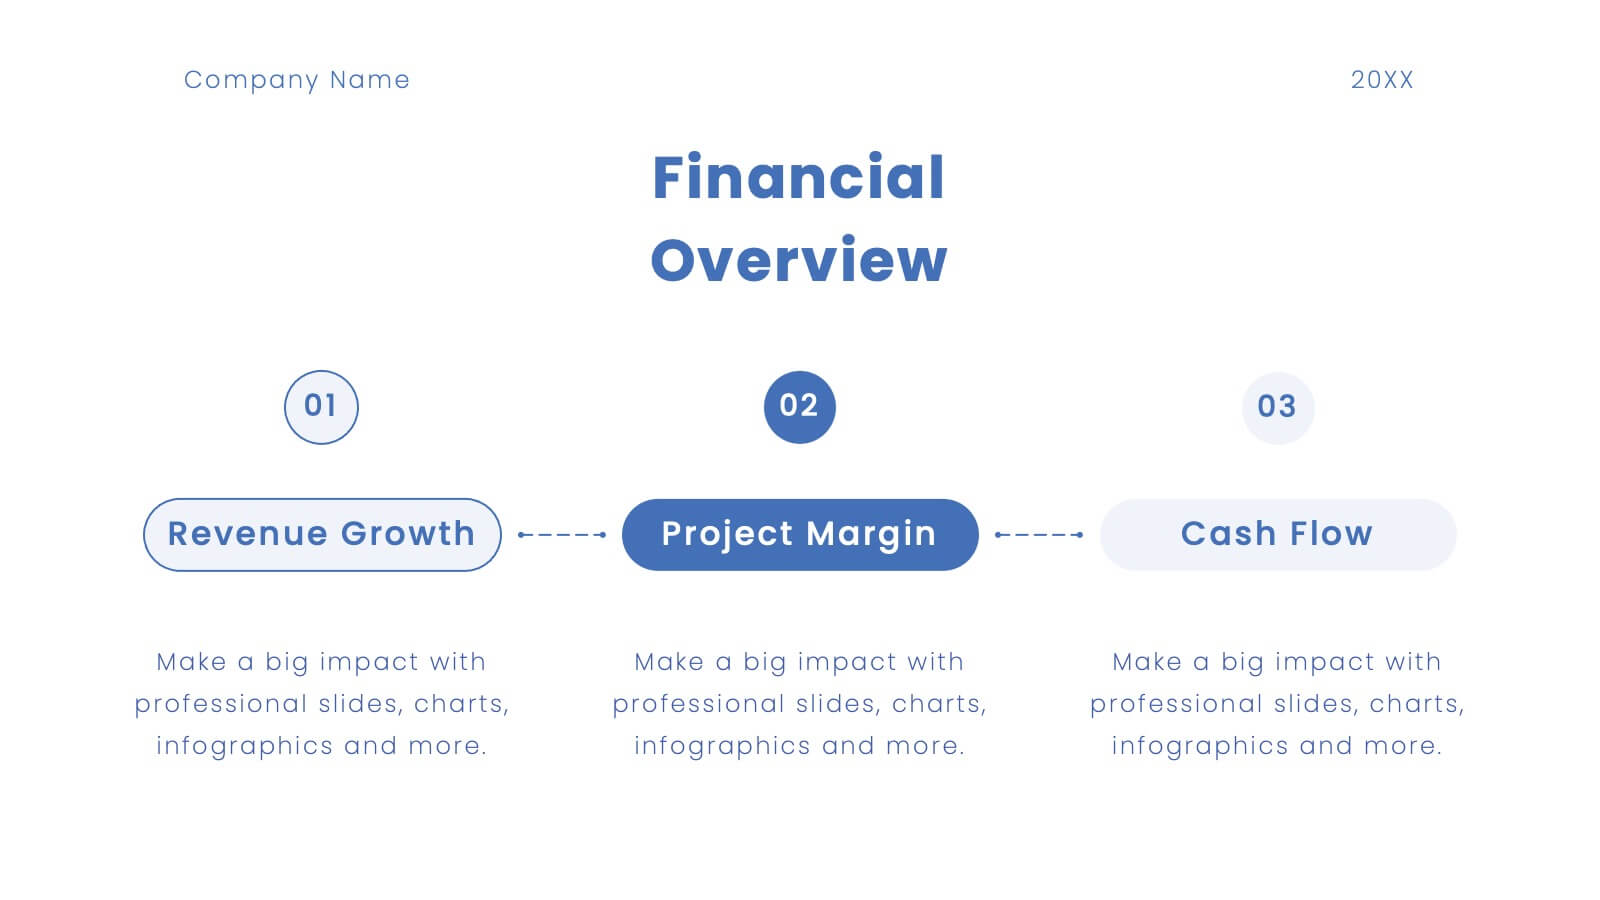
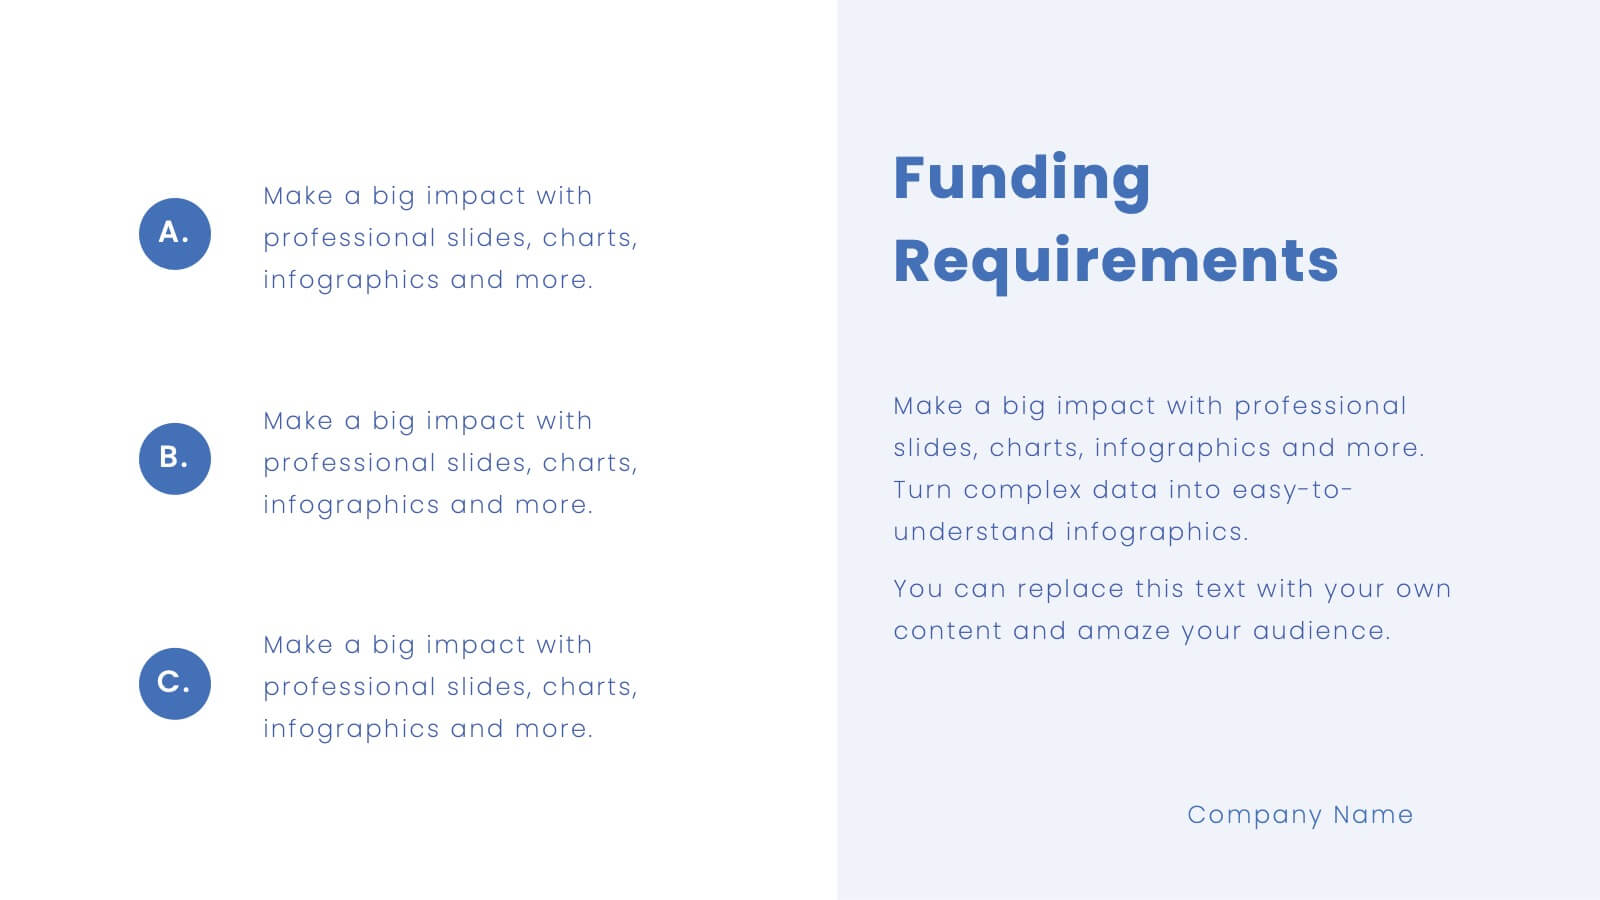
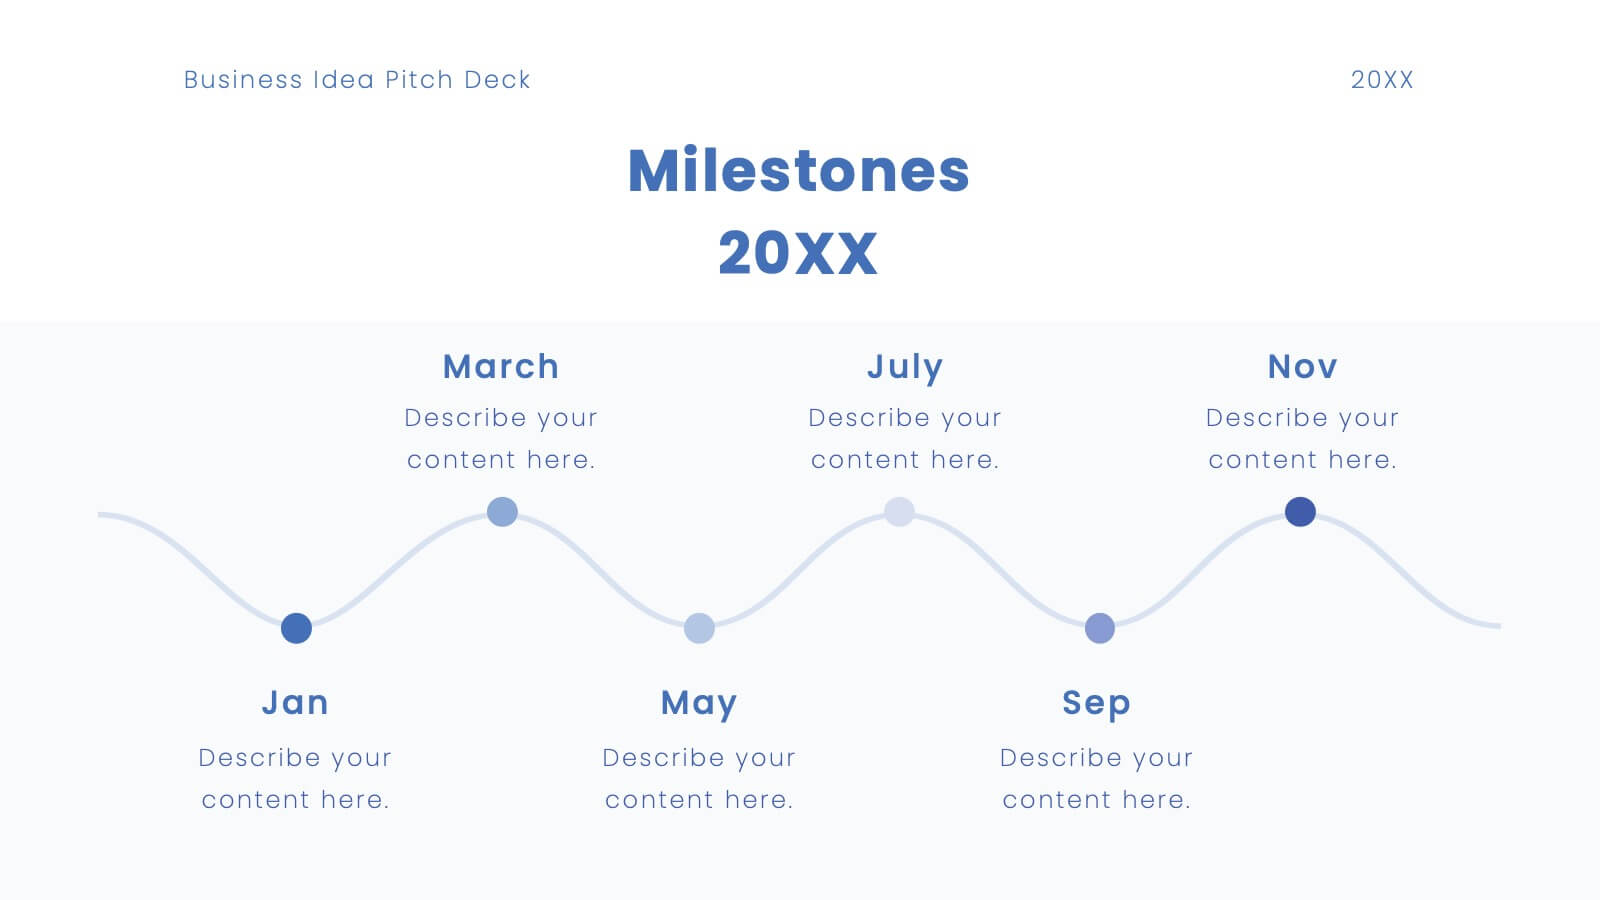
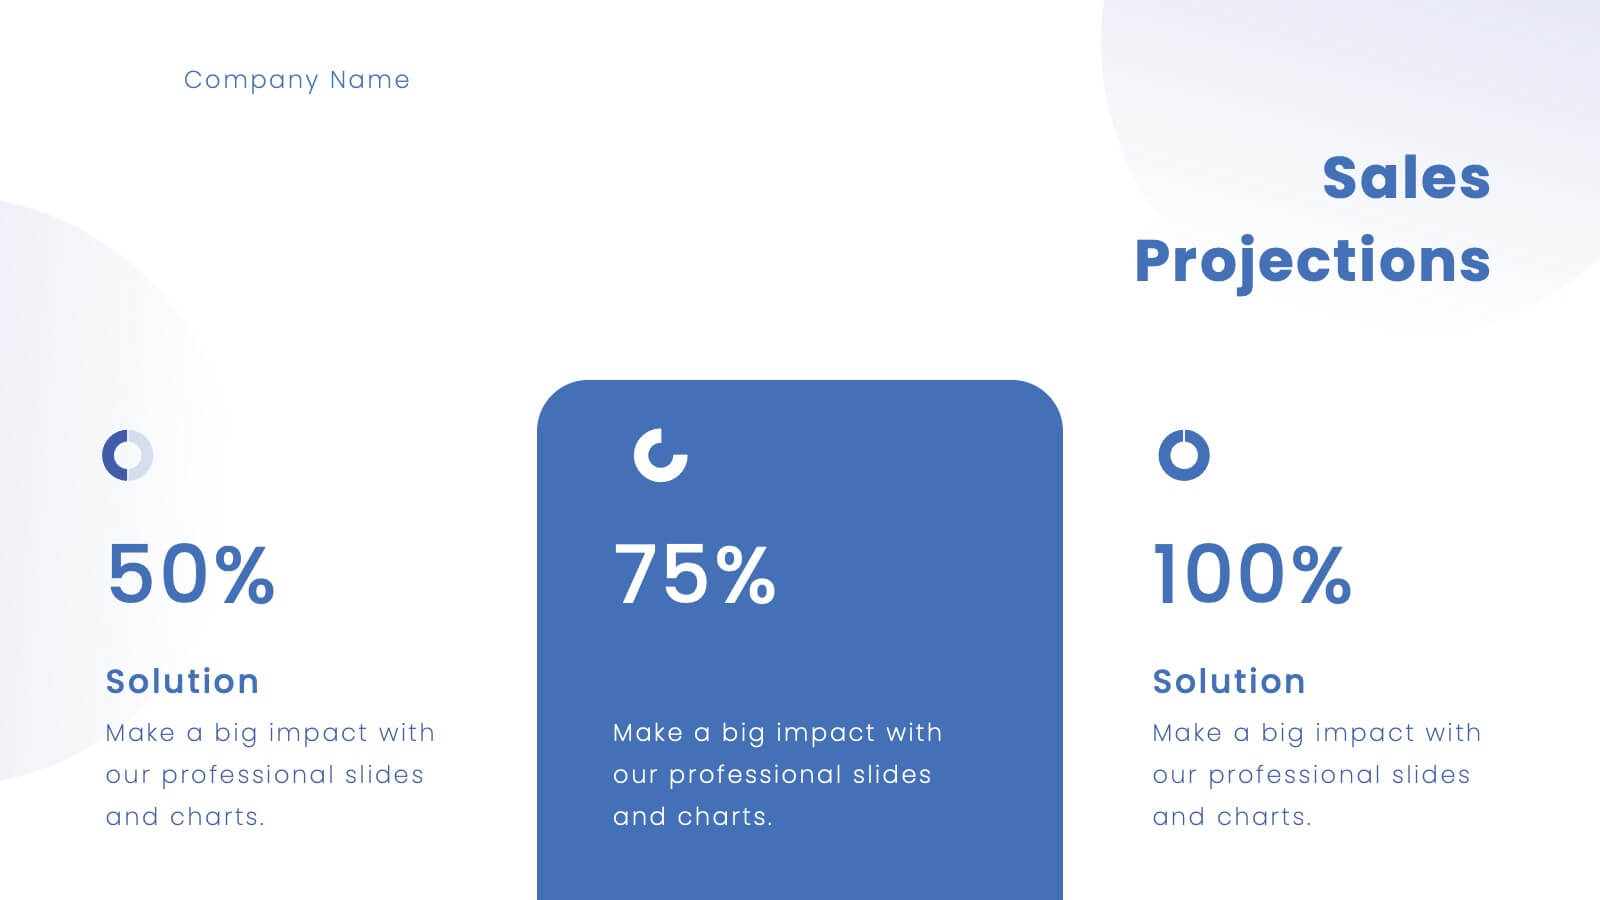
Platinum Business Idea Pitch Deck Presentation
Present your business idea with this sleek and professional pitch deck template! It includes everything from market opportunities to financial projections and sales strategies, providing a comprehensive structure for your pitch. Fully customizable and compatible with PowerPoint, Keynote, and Google Slides, this template is ideal for impressing investors and stakeholders.


7 slides
Financial Forecasting with Statistics Presentation
Unlock your financial future with the "Financial Forecasting with Statistics" presentation templates. These slides are designed to clearly present growth forecasts, trends, and statistics, empowering you to make informed decisions. Ideal for financial analysts and corporate strategists, these templates are fully compatible with PowerPoint, Keynote, and Google Slides.


4 slides
Modern Transportation and Logistics Strategy Presentation
Move your audience through a fast-paced world of movement and delivery with a clean, visual slide that maps out each step of your logistics process. This layout helps explain workflows, supply chain stages, and transportation planning with clarity and ease. Fully compatible with PowerPoint, Keynote, and Google Slides.


6 slides
Information Security Risk Analysis Presentation
Identify weak points before they become real threats. This information security risk analysis template makes it easy to present cybersecurity vulnerabilities, data protection gaps, and action plans in a visual and professional way. Ideal for IT audits or strategy meetings. Fully editable in PowerPoint, Keynote, and Google Slides.


4 slides
Team OKRs Alignment Slide Presentation
Bring clarity and collaboration to your team’s goals with a clean, connected layout that visualizes how objectives lead to measurable results. Perfect for aligning departments, tracking progress, or sharing performance updates, this presentation turns strategy into action. Fully compatible with PowerPoint, Keynote, and Google Slides for easy customization.
21 slides
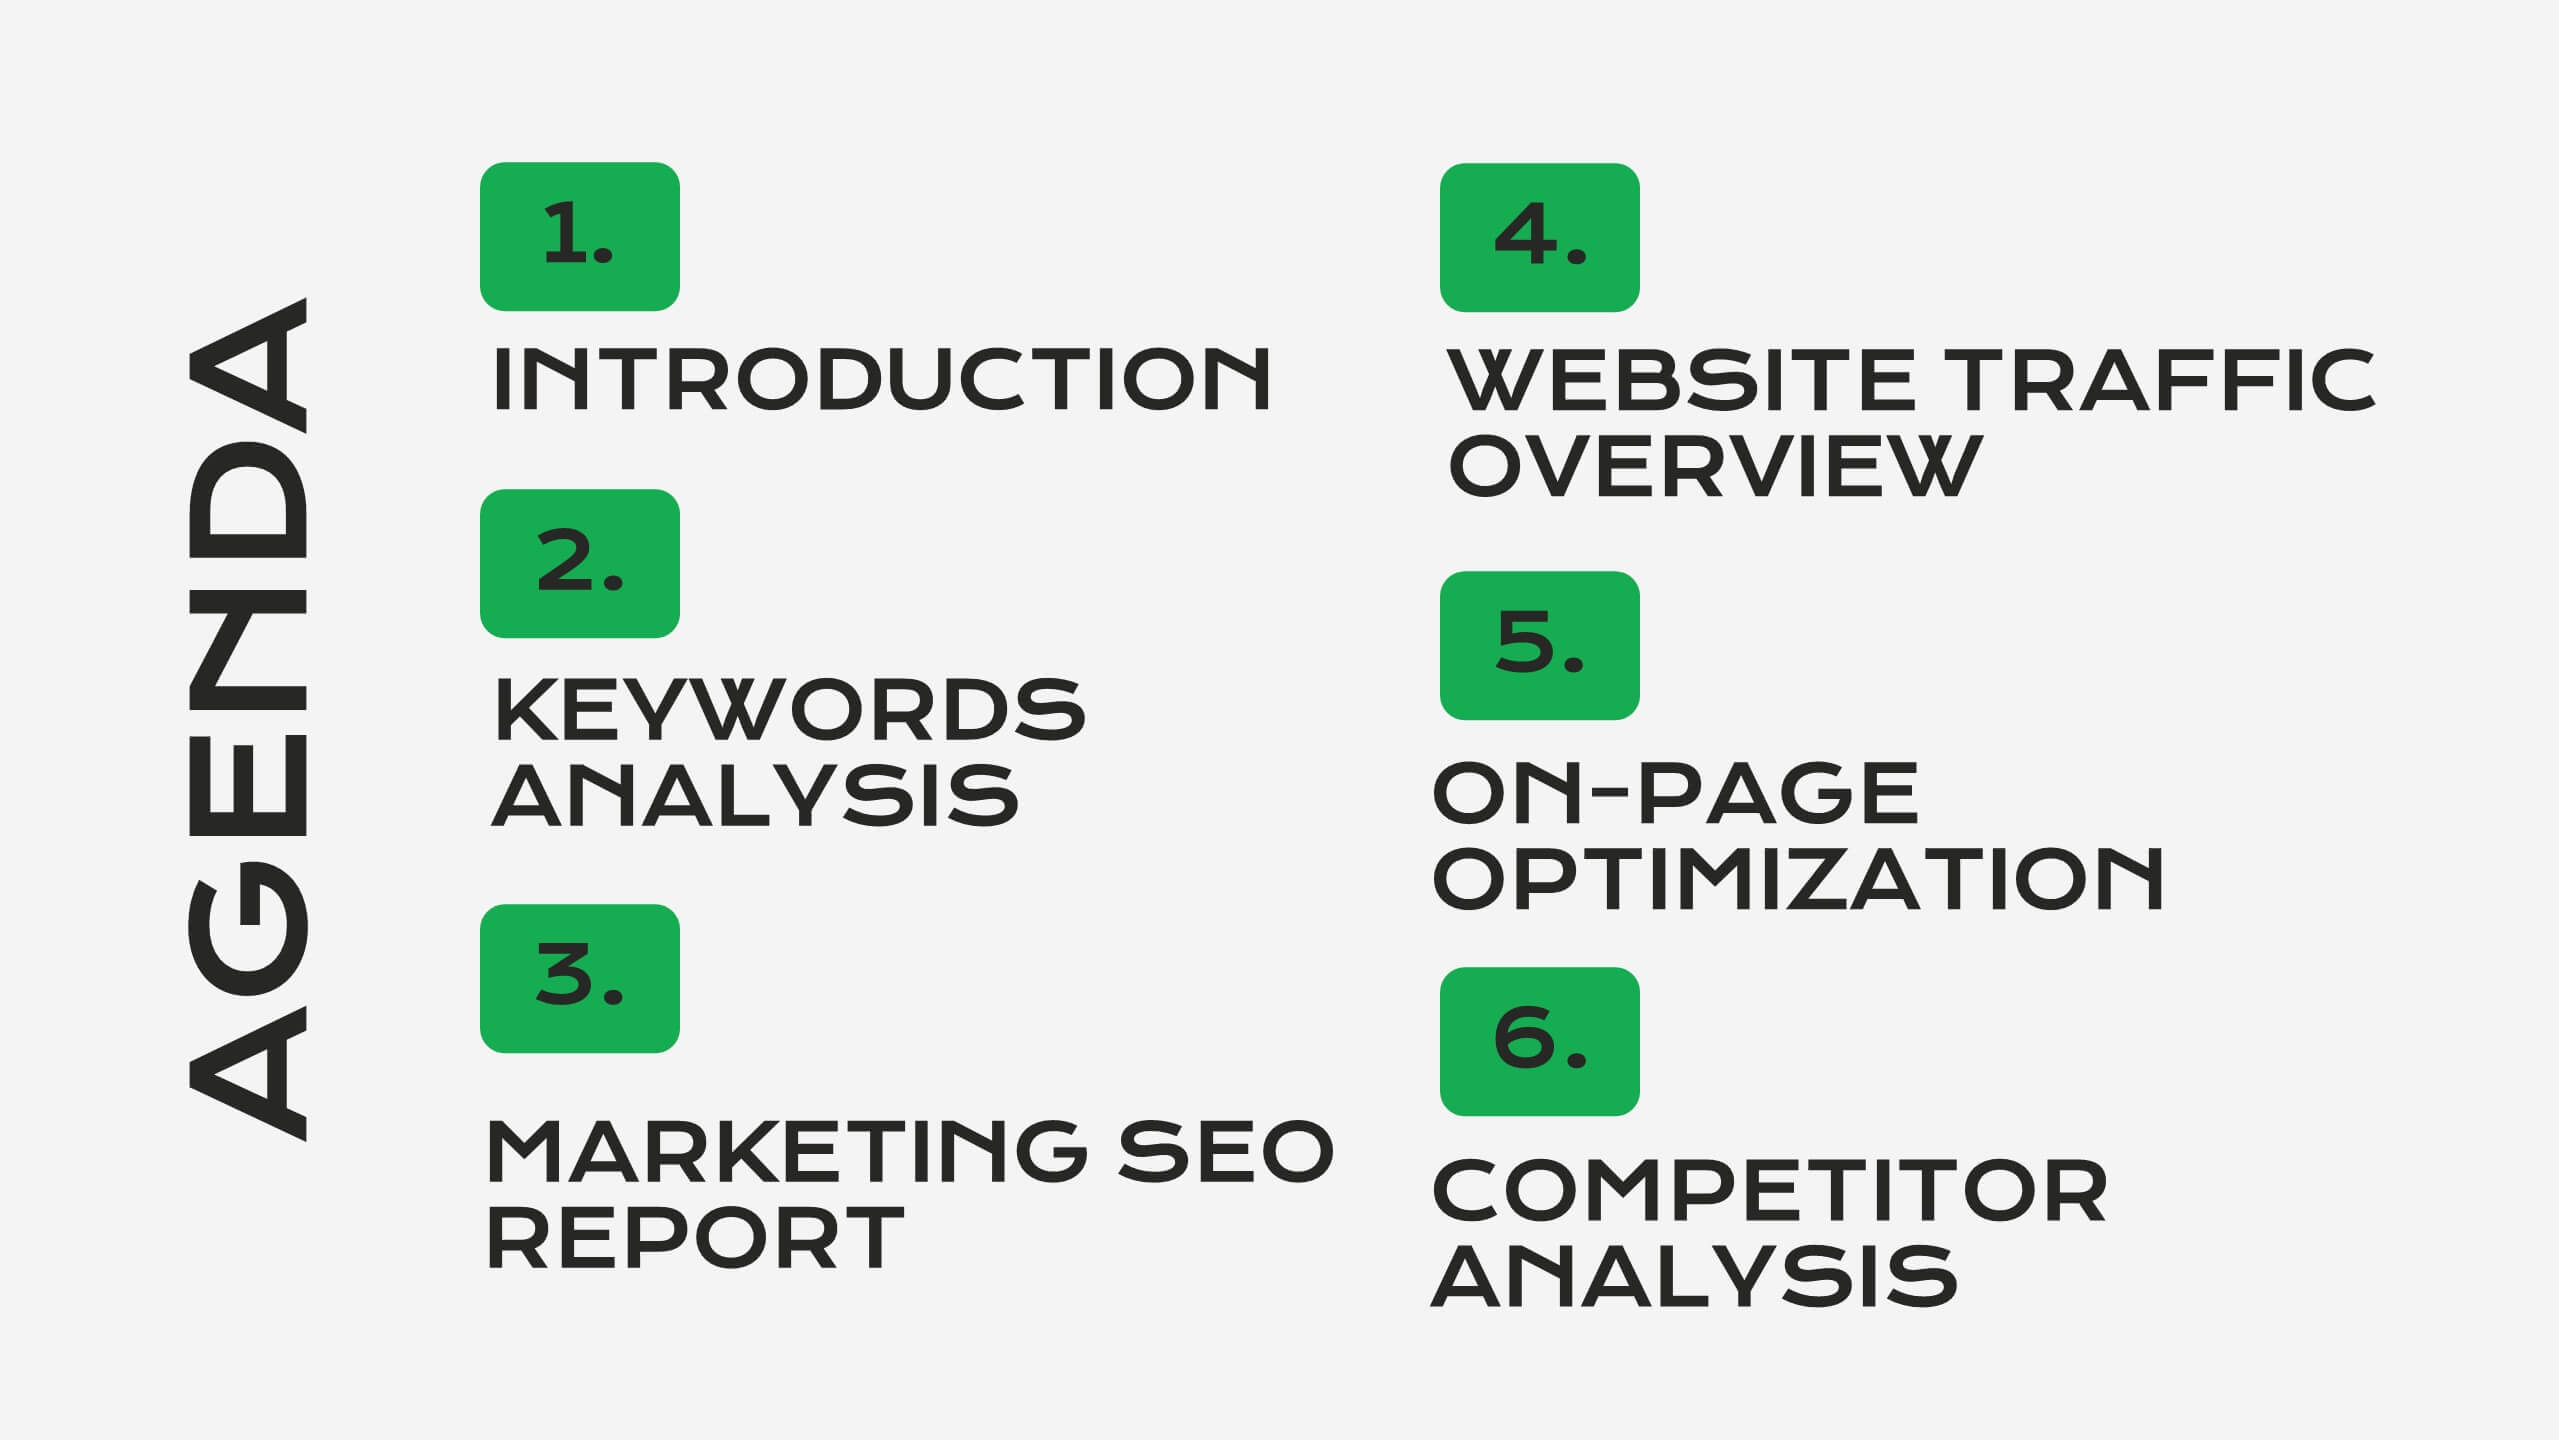
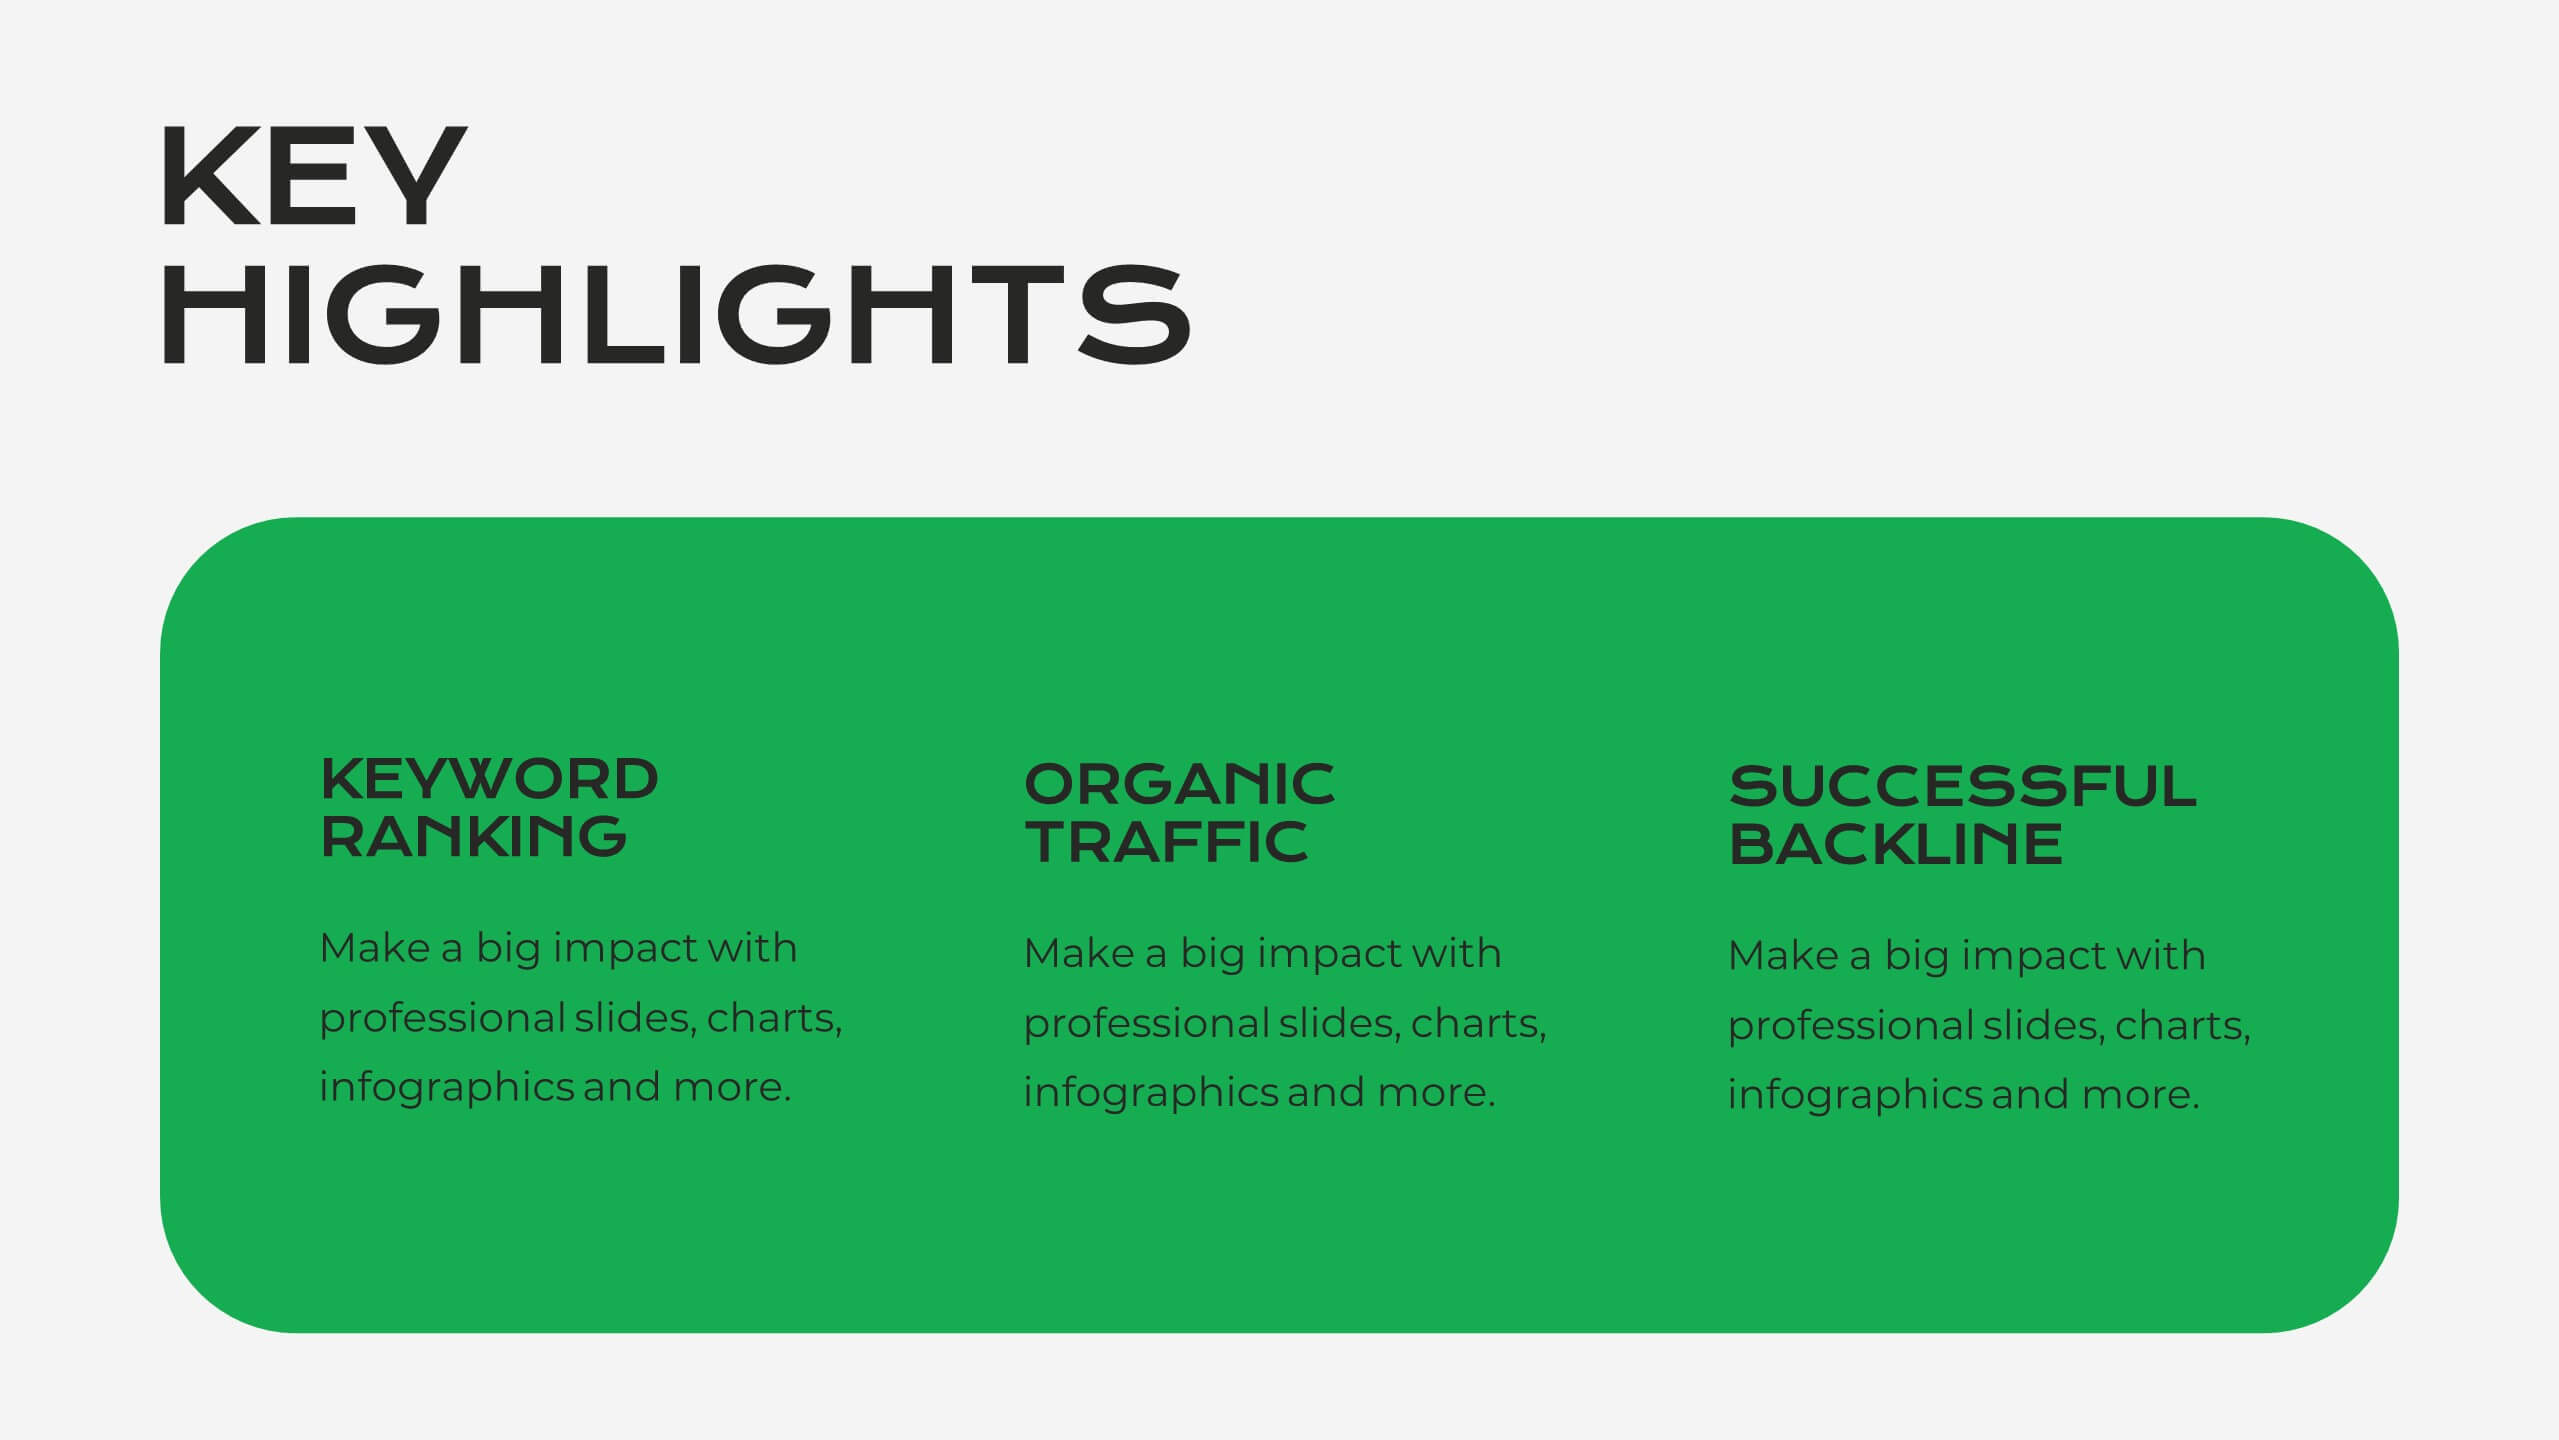
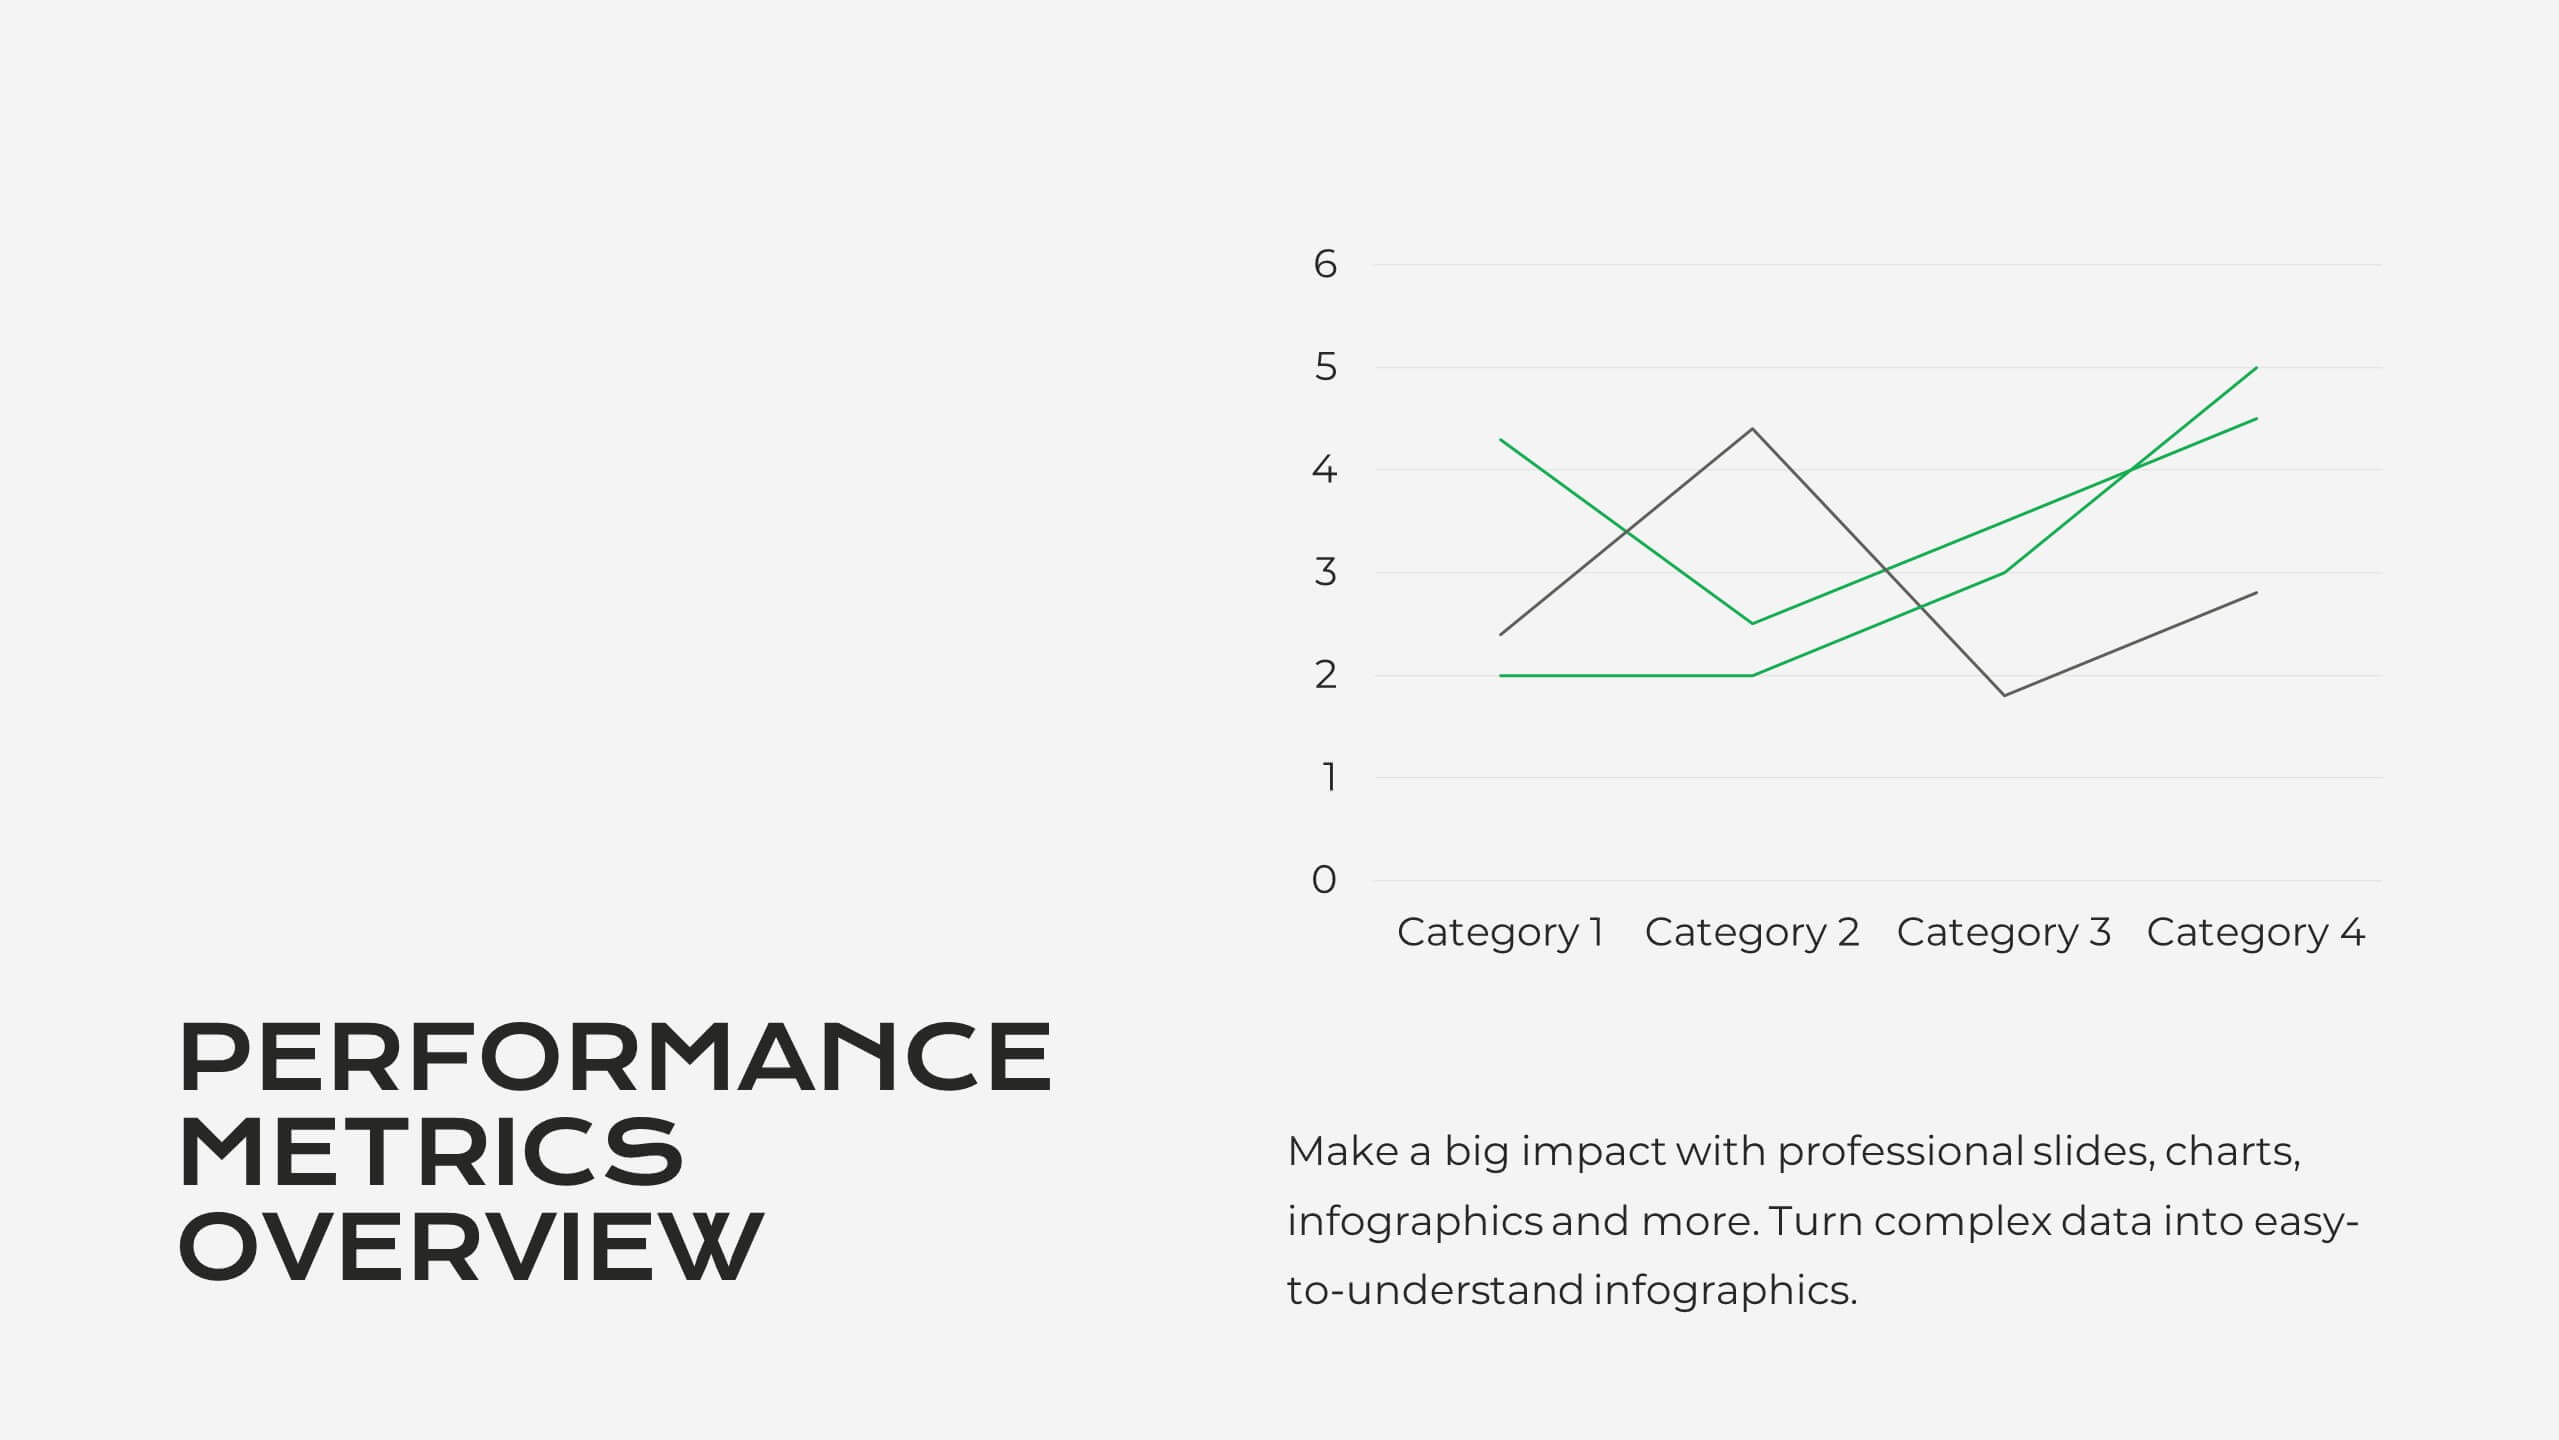
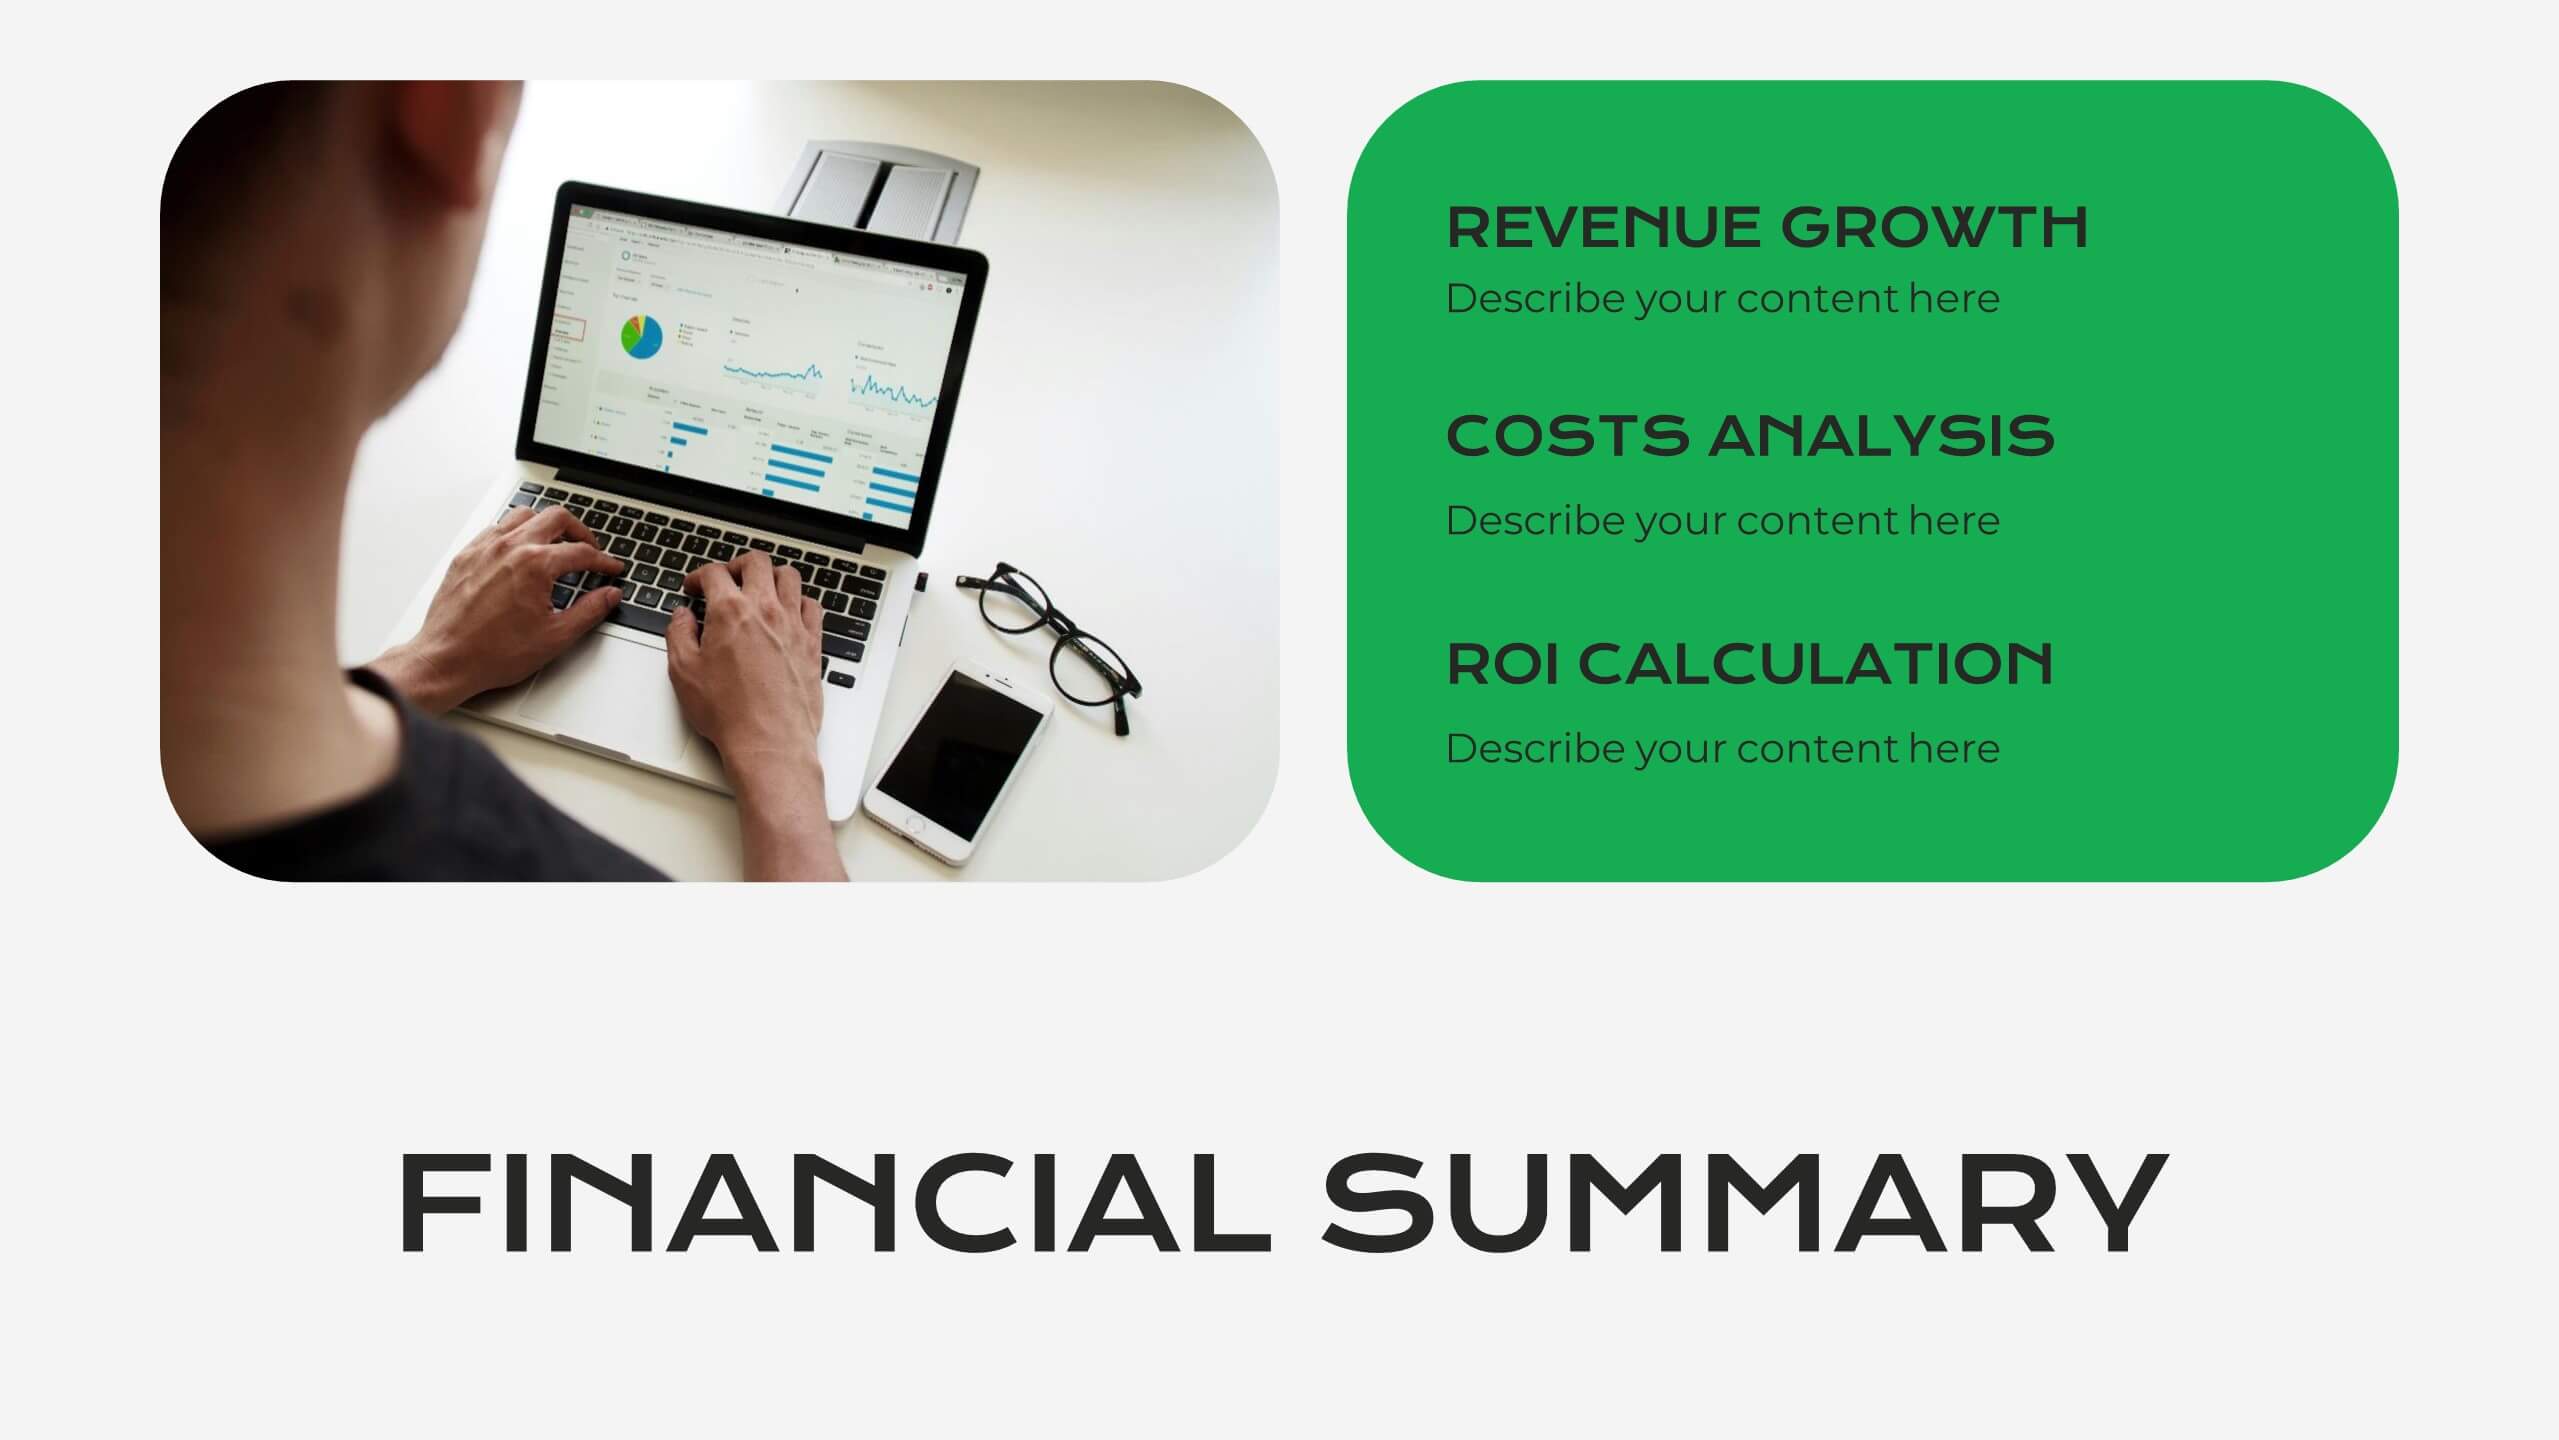
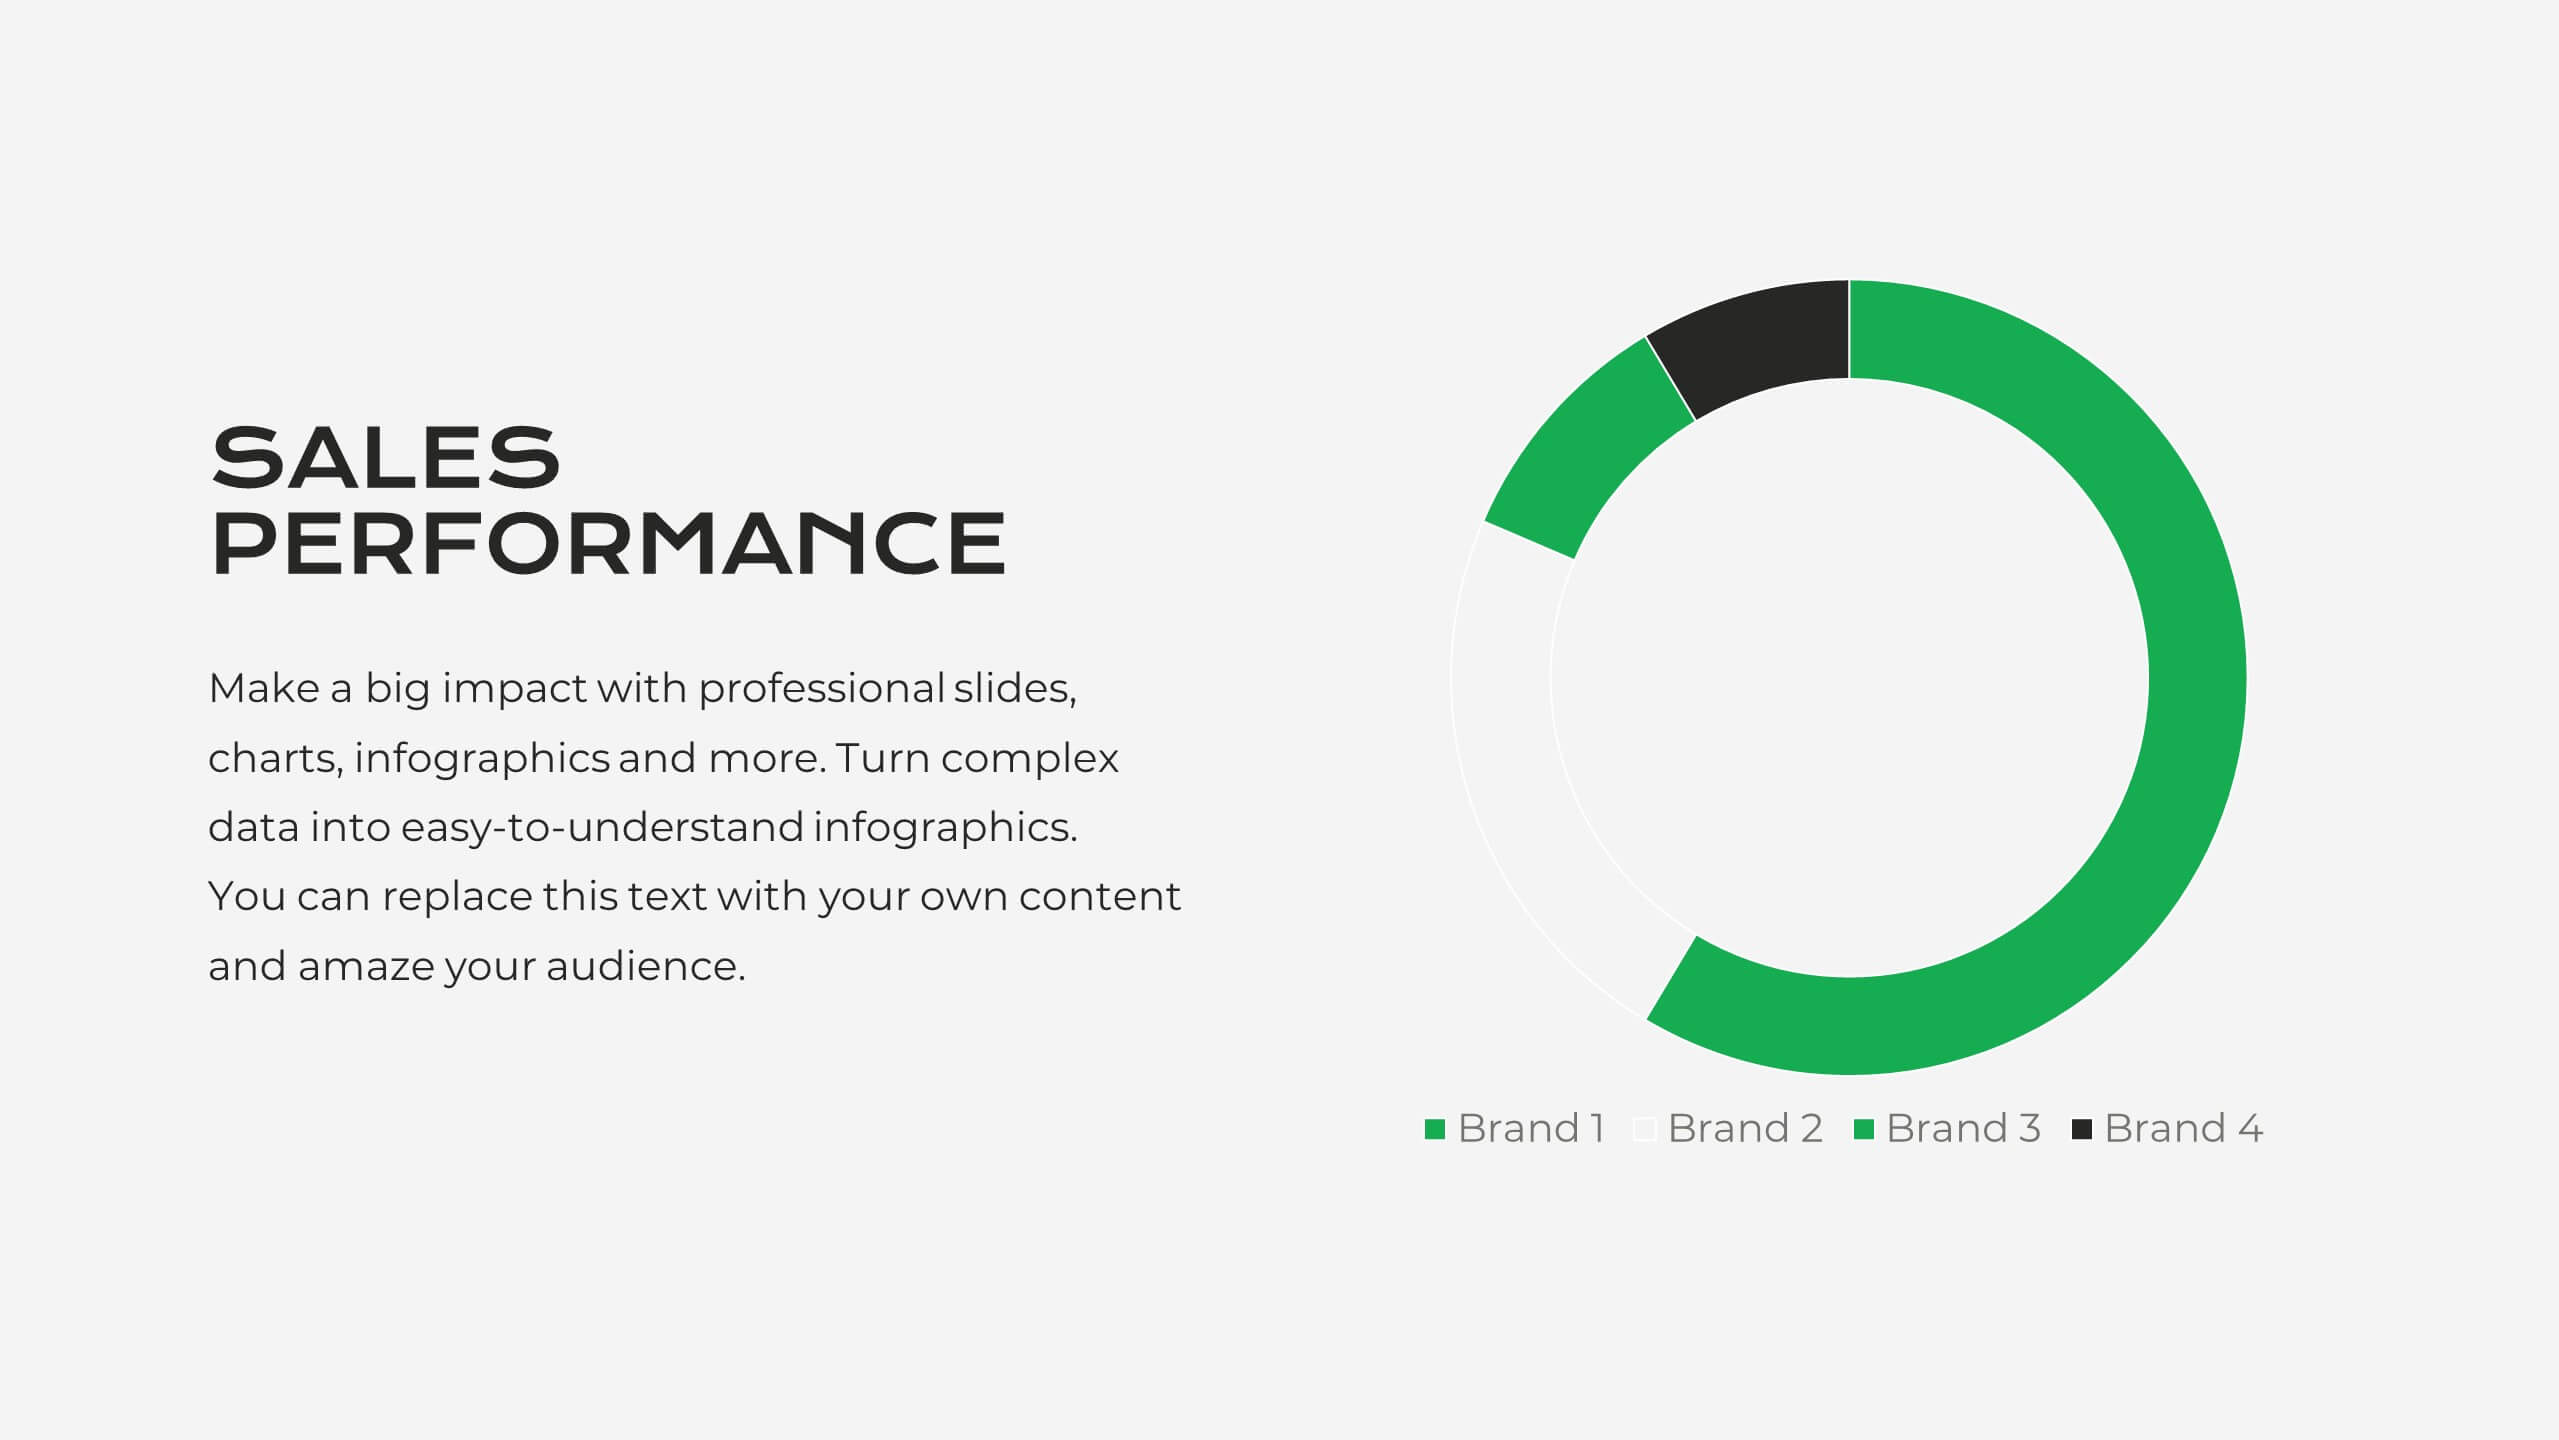
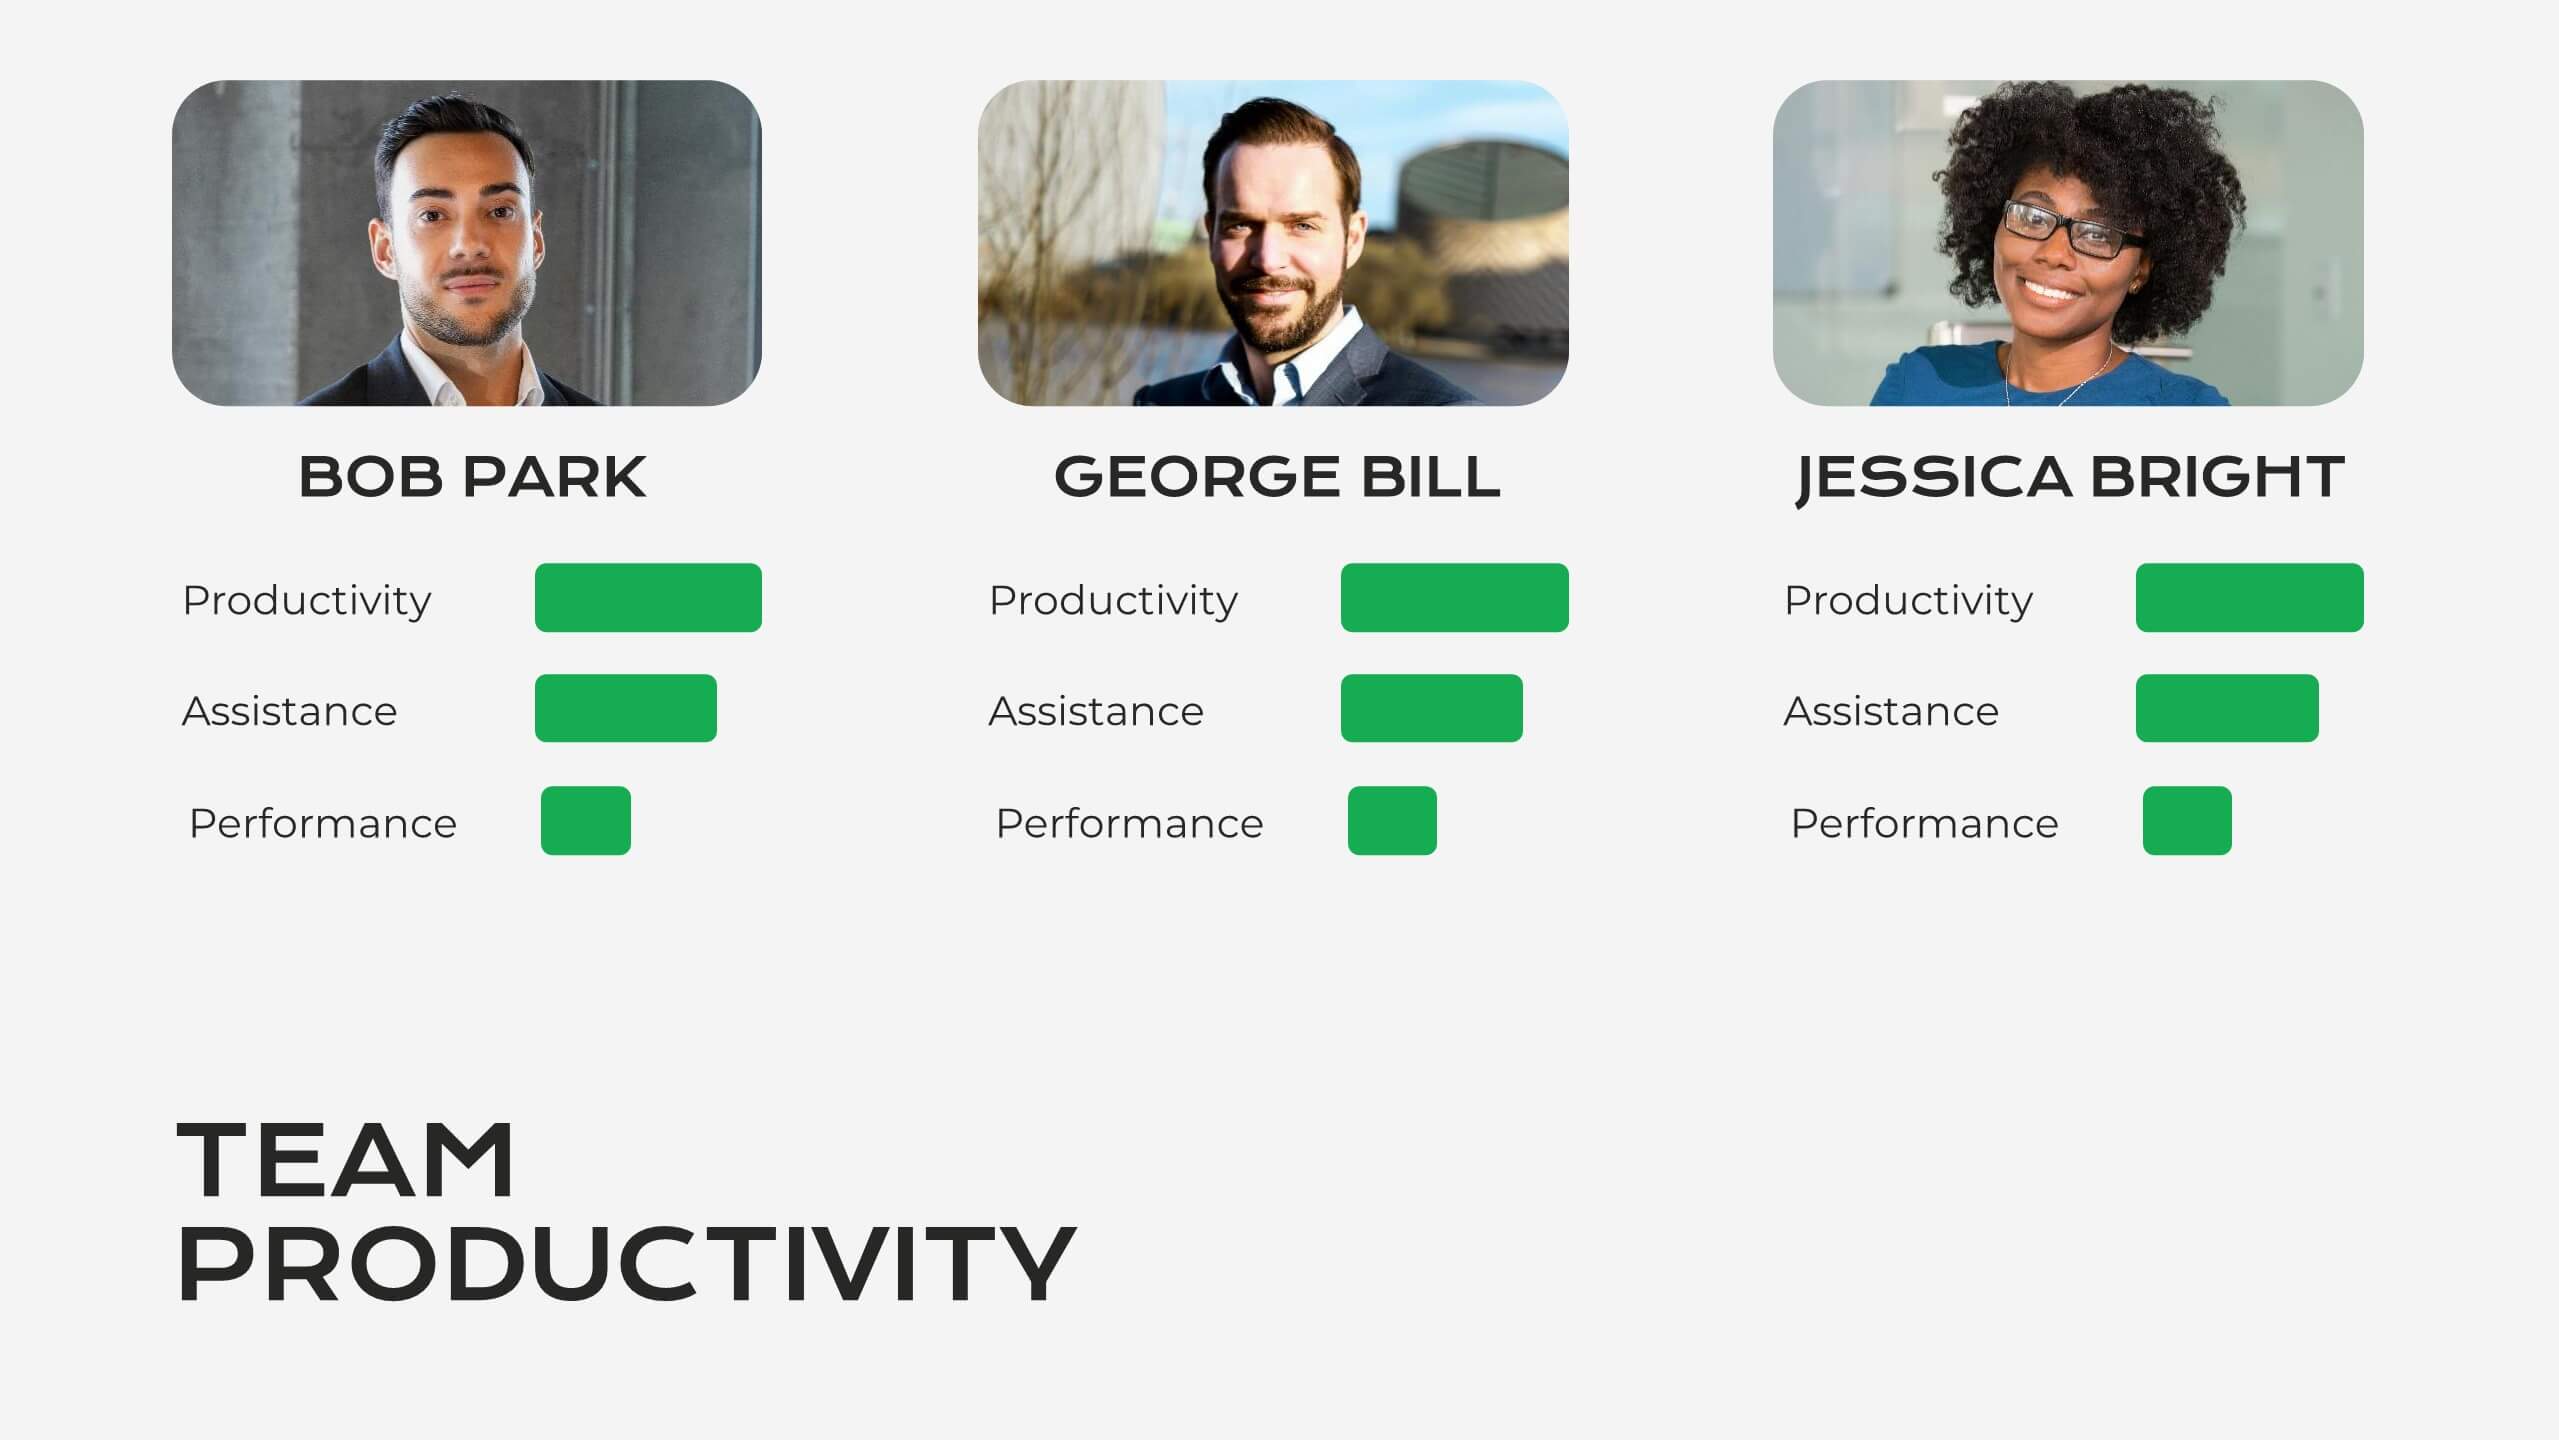
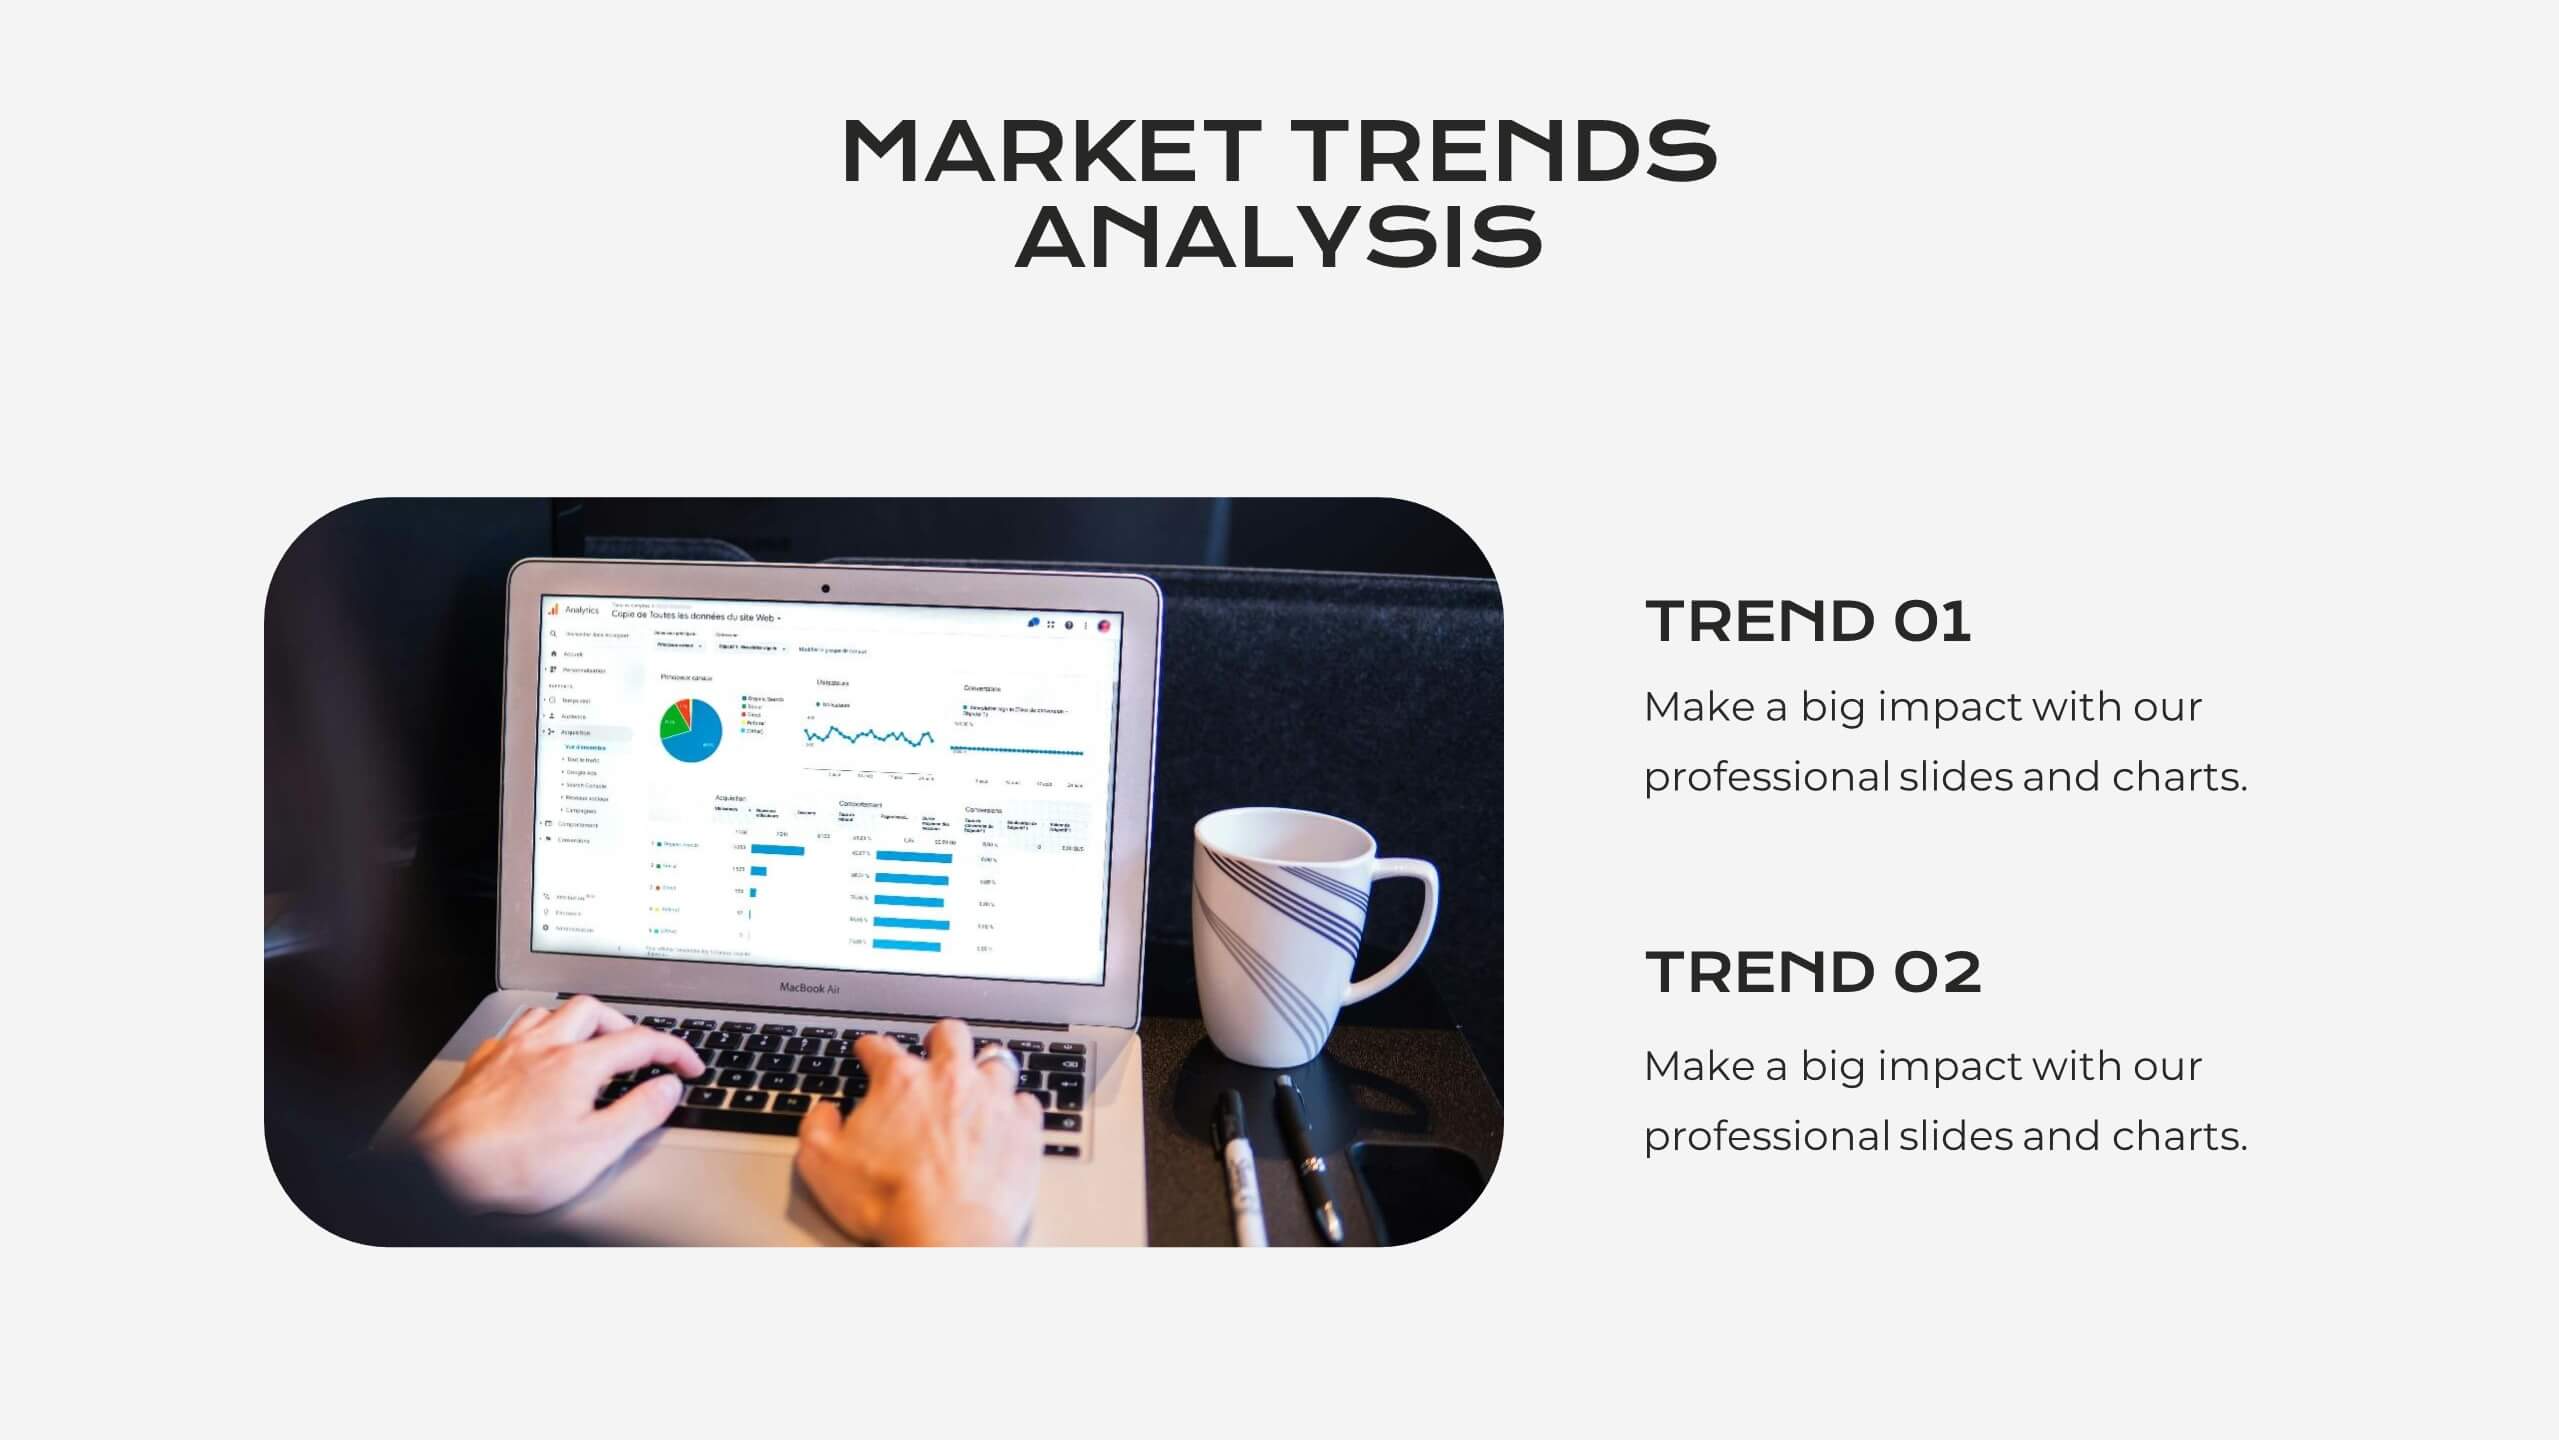
Serene Market Analysis Report Presentation
This modern and clean Market Analysis Report template is designed to help you present key data and insights with clarity and impact. Ideal for business professionals and analysts, it includes slides for key highlights, performance metrics, financial summaries, competitor insights, and strategic initiatives. The template's sleek layout ensures that your data is easy to understand and visually appealing, making it perfect for internal reports or client presentations. Customize it effortlessly in PowerPoint, Keynote, or Google Slides, and impress your audience with a polished and professional report.


5 slides
Mental Health Counseling Infographics
Mental health counseling is a form of therapy that focuses on helping individuals improve their mental and emotional well-being. These infographic templates are designed to raise awareness about mental health counseling and its benefits. This aims to educate and inform individuals about the importance of seeking professional help for mental health concerns and highlights the various aspects of mental health counseling. Use these to present your next educational presentation on mental health or online platforms, this provides essential information and visual aids to encourage the benefits of seeking counseling.


4 slides
Team and Department Setup Structure Presentation
Organize your team with clarity using the Team and Department Setup Structure Presentation. This template is perfect for showcasing internal team hierarchies, departmental layouts, or functional groupings in a clean and professional layout. Each slide is fully customizable, allowing you to edit icons, titles, and structure to suit your organization. Compatible with Canva, PowerPoint, Keynote, and Google Slides.


6 slides
Europe Region Overview Presentation
Bring your regional insights to life with a modern, minimal map layout that highlights key countries and data across Europe. Ideal for showcasing economic trends, business performance, or demographic overviews, this clean design ensures clarity and engagement. Fully compatible with PowerPoint, Keynote, and Google Slides for seamless editing.


4 slides
Personal Finance and Money Management Presentation
Effectively present Personal Finance and Money Management insights with this clean and professional slide template. Designed with a minimalist stopwatch infographic, this template helps visualize key financial principles like budgeting, saving, and investing. Fully customizable with editable text, colors, and icons, it’s perfect for business reports, financial workshops, or personal finance presentations. Compatible with PowerPoint, Keynote, and Google Slides for seamless editing.


25 slides
Draco Photography Portfolio Template Presentation
Showcase your photography portfolio with this dynamic template! Highlight your projects, style, client testimonials, and awards. Includes sections for pricing, services offered, and social media links. Ideal for photographers to create impactful presentations. Compatible with PowerPoint, Keynote, and Google Slides.


6 slides
Timeline Planning with Gantt Layout Presentation
Organize your schedules clearly with this Timeline Planning with Gantt Layout presentation. Designed for efficient project tracking, this template breaks down tasks across phases and months, using a clean horizontal bar layout. Perfect for teams, planners, and managers. Fully editable in Canva, PowerPoint, and Google Slides to suit any workflow.


8 slides
Architectural Design and Smart Home Trends Presentation
Showcase modern architecture insights and tech-savvy innovations with this layered home diagram slide. Ideal for real estate, construction, or smart home professionals, it highlights key features in a visually tiered format. Fully editable in PowerPoint, Keynote, and Google Slides—perfect for clean, tech-forward presentations with a sleek design.