


Features
- 6 Unique slides
- Fully editable and easy to edit in Microsoft Powerpoint, Keynote and Google Slides
- 16:9 widescreen layout
- Clean and professional designs
- Export to JPG, PDF or send by email


Do you have any questions?
Recommend


4 slides
Business Executive Summary Report
Get straight to the point with a clean, colorful slide designed to capture big-picture business insights at a glance. Perfect for summarizing key metrics, strategies, and results, this executive summary template keeps your presentation sharp, structured, and impactful. Fully compatible with PowerPoint, Keynote, and Google Slides for maximum flexibility.


6 slides
Credit Card Features Overview Presentation
Bring your audience into the world of smart spending with a clean, visual layout that explains key credit card features in a simple, engaging way. This presentation helps you break down benefits, terms, and essential details with clarity and confidence. Fully editable and compatible with PowerPoint, Keynote, and Google Slides.


4 slides
Customer Type Identification Strategy Deck Presentation
Visualize your customer segmentation strategy with this layered targeting slide. Perfect for identifying different customer types based on behavior or loyalty levels, this layout uses a human silhouette and concentric zones to highlight proximity to the core user. Fully editable and compatible with PowerPoint, Keynote, and Google Slides.


12 slides
Simple Gantt Chart Template Presentation
Track your project progress at a glance with this Simple Gantt Chart Template. Featuring color-coded circles for weekly task planning across two timelines, it’s perfect for visual project tracking. Easily customizable for PowerPoint, Keynote, or Google Slides. Ideal for quick updates, team syncs, and keeping your workflow organized.


7 slides
Sports Training Camp Schedule Deck Presentation
Plan and present weekly training programs with this Sports Training Camp Schedule Deck. Featuring a clean, color-coded layout for Monday to Saturday, this slide helps coaches organize sessions clearly. Ideal for team meetings, camp planning, or fitness schedules. Fully editable in PowerPoint, Keynote, and Google Slides for easy customization.


20 slides
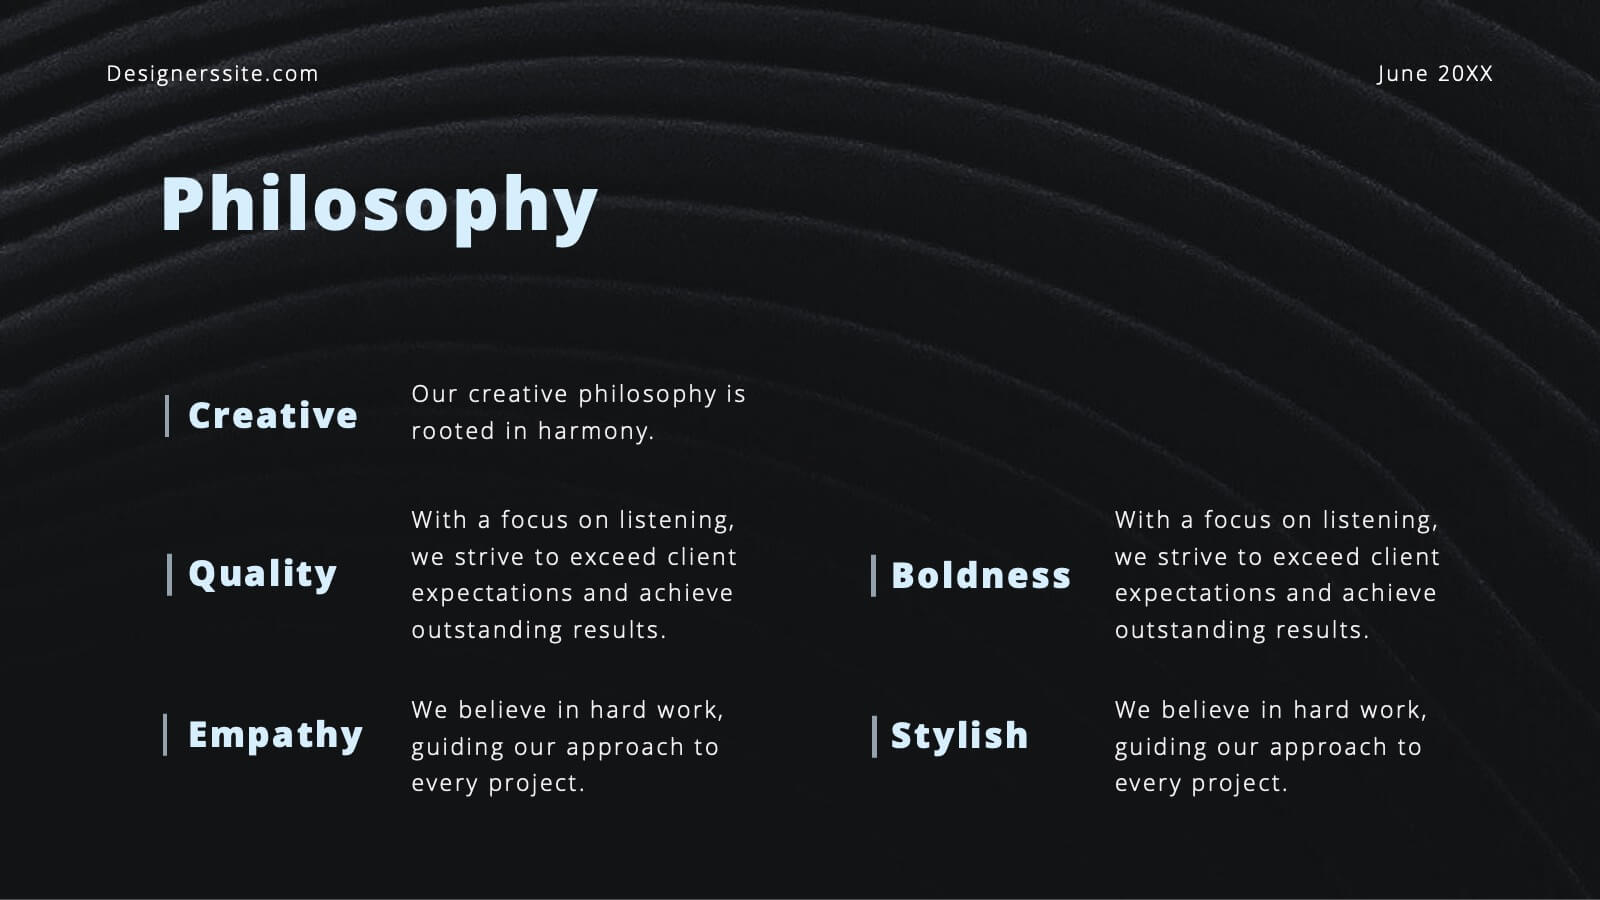
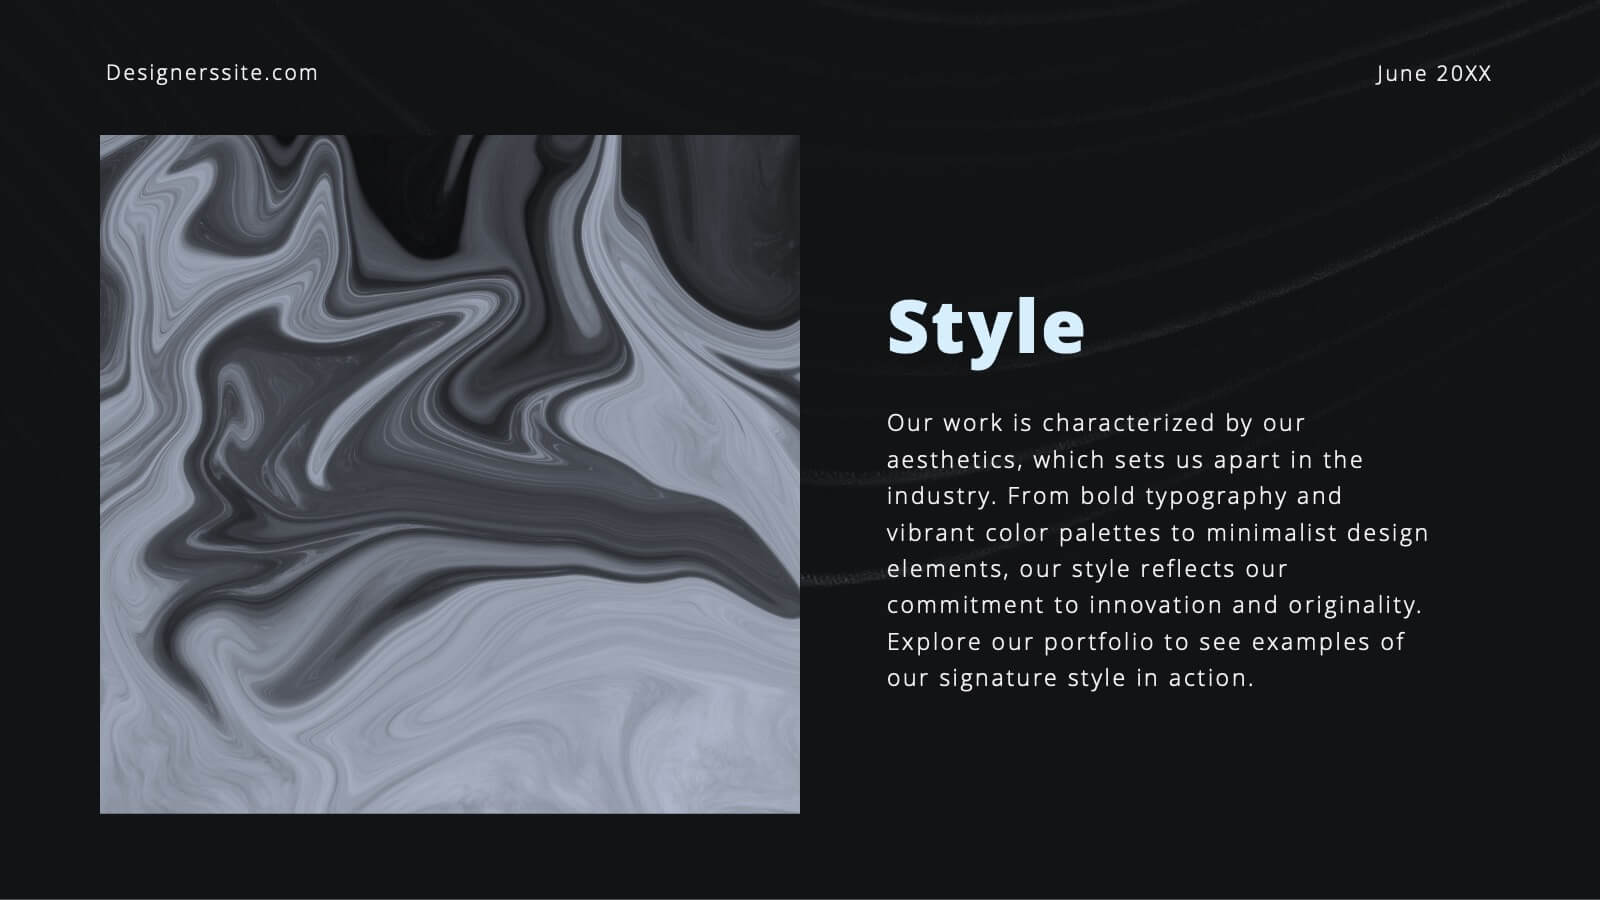
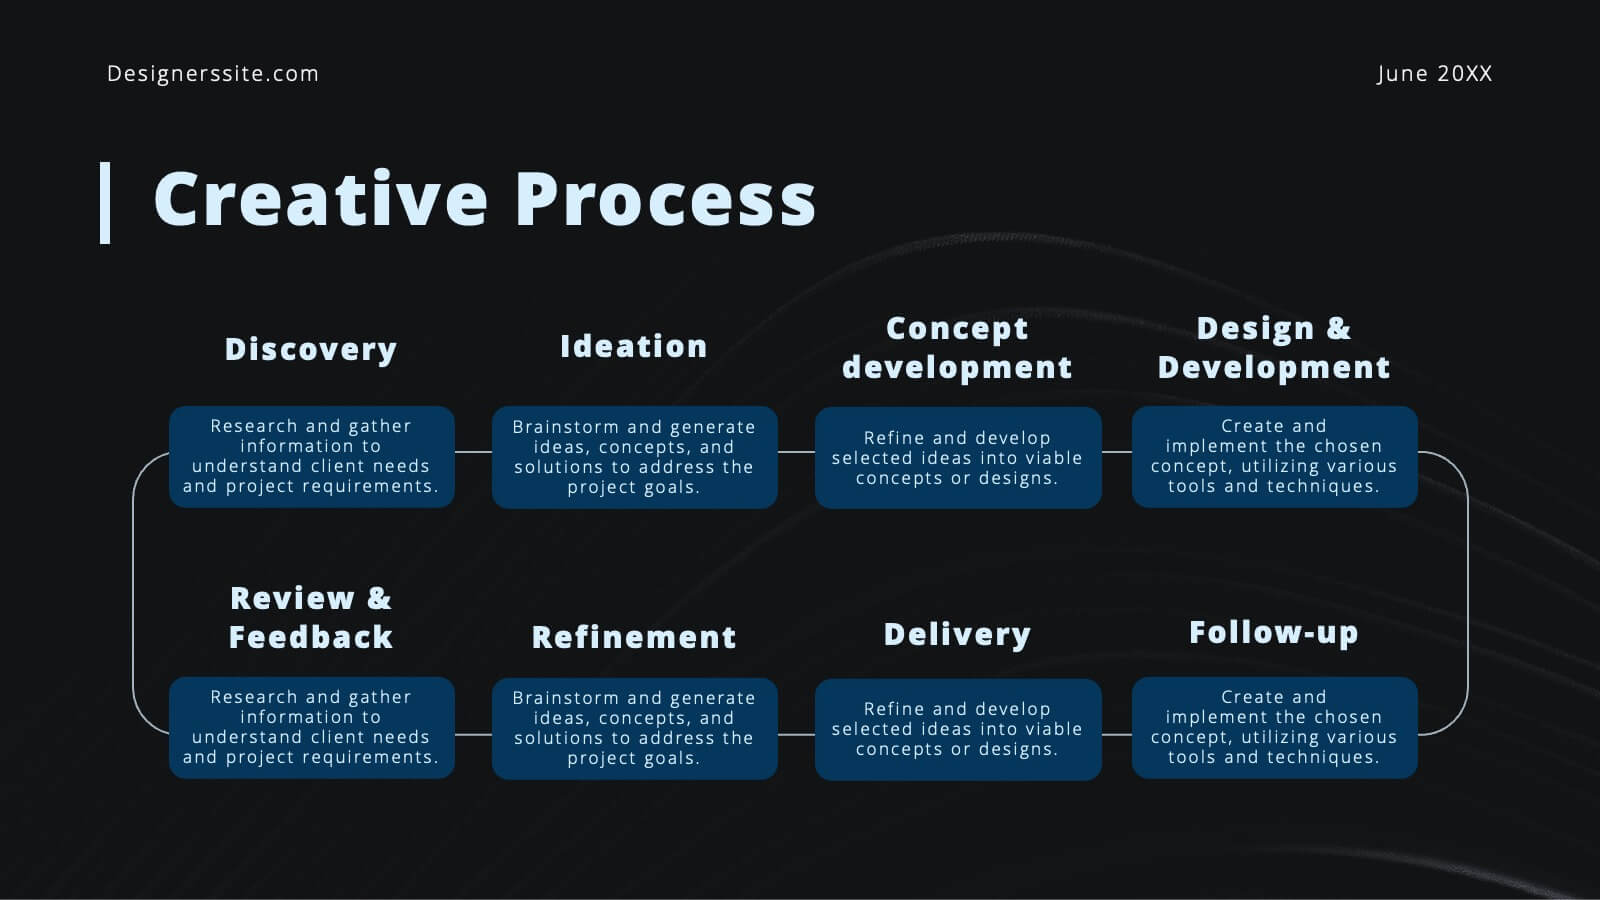
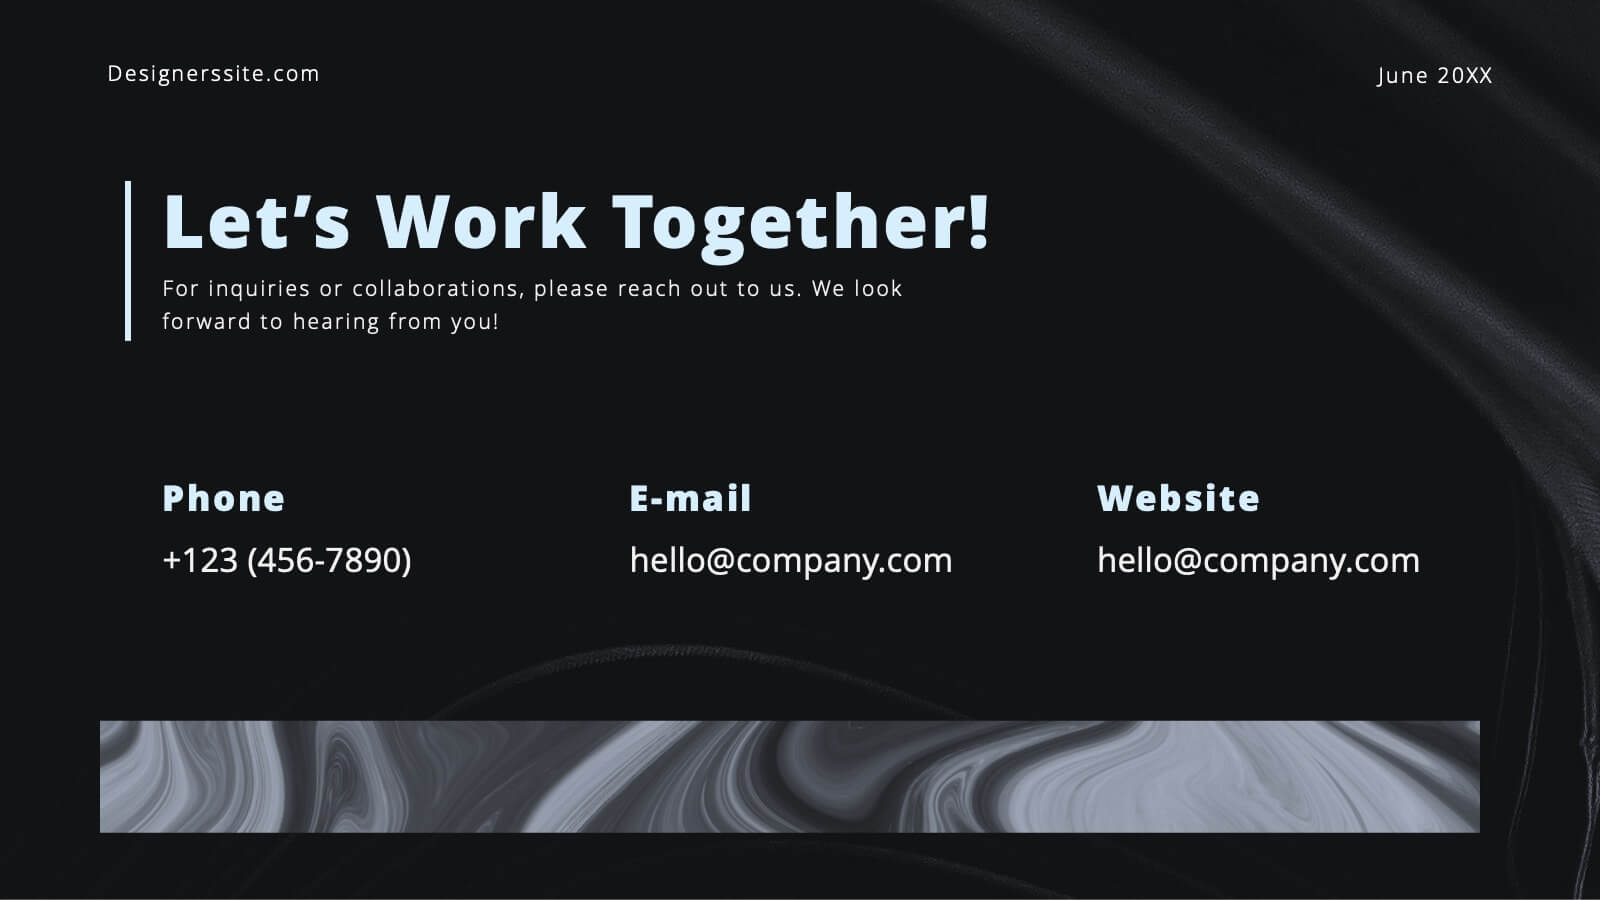
Bravo Creative Portfolio Presentation
Showcase your creative prowess with this sleek, modern portfolio presentation template. Perfect for highlighting featured projects, client testimonials, and your creative process, this template ensures your work shines. Its stylish design and professional layout make it ideal for impressing potential clients and collaborators. Compatible with PowerPoint, Keynote, and Google Slides, it's versatile for any platform.


21 slides
Apollo Sales Pitch Deck Template Presentation
Create an impressive sales pitch with this sophisticated template. Highlight your company overview, problem statement, solutions, and market opportunities. Showcase your unique selling proposition and marketing strategy. Ideal for PowerPoint, Keynote, and Google Slides.


5 slides
Monthly Financial Report Infographics
Dive into financial analytics with our monthly financial report infographics template. This indispensable tool, designed for finance professionals, managers, and business owners, comes in a stimulating mix of orange, pink, and green, reflecting the dynamic nature of finance. The template stands out with creative graphics, detailed icons, and designated areas for images that encapsulate various financial parameters. Ideal for depicting key statistics, trends, and financial insights in a clear, engaging manner, this vertical-style infographic template is perfect for simplifying complex data, ensuring your monthly reports are both comprehensive and captivating.


6 slides
Step-by-Step Process Guide Presentation
Clearly outline your workflow with this step-by-step process guide template, featuring six bold arrow graphics for sequential planning. Perfect for illustrating procedures, timelines, or strategies, this modern design ensures clarity and flow. Fully editable in Canva, PowerPoint, or Google Slides, making it ideal for business, project management, or training presentations.


5 slides
Physical Science Infographics
Immerse in the realm of physical sciences with our physical science infographics template. Set against a deep cosmos of blues and purples, this template serves as a bridge between complex scientific principles and audiences, ideal for educators, students, and science communicators. The design, balancing creativity and informativeness, integrates stunning graphics and icons, turning data and facts into captivating visual stories. This dark-themed, visually engaging layout is not just an educational tool, but a spark that ignites curiosity and exploration in classrooms, scientific presentations, or educational content, making science both profound and accessible.


6 slides
Gantt Chart for Project Phasing Presentation
Plan and visualize your timeline effortlessly with this Gantt Chart for Project Phasing presentation. Ideal for breaking down tasks by month, this template helps you communicate project stages, team responsibilities, and key milestones clearly. Fully editable in Canva, PowerPoint, and Google Slides—customize colors, titles, and durations to match your workflow.


5 slides
Alcohol Effects Infographics
Alcohol can have various effects on the body and mind, depending on the amount consumed, the individual's tolerance, and other factors. These unique vertical Infographics provide information about the physical, psychological, and social effects of alcohol use. They are designed to educate people about the risks of drinking too much and the consequences of alcohol abuse. To help you present your data these include statistics, illustrations, and other visual aids to help your audience understand the impact of alcohol on their health. By providing information about the effects of alcohol, this helps people make informed decisions about alcohol use.


4 slides
Sales Performance Heat Map Overview Presentation
Get a quick visual pulse on your data with the Sales Performance Heat Map Overview Presentation. Ideal for showing activity levels or trends across time, this slide uses a gradient color scale to help teams identify high and low performance instantly. Fully editable in Canva, PowerPoint, Keynote, and Google Slides—great for sales managers, team leads, and marketing analysts.


5 slides
Rental Business Milestone Timeline Presentation
Showcase your company's growth journey with this clean Rental Business Milestone Timeline layout. Designed for tracking key achievements, it features a horizontal timeline with icons and customizable date markers. Perfect for business reviews or investor updates, it’s fully editable in PowerPoint, Keynote, and Google Slides for a professional presentation


4 slides
Performance Gap Analysis Diagram Presentation
Bridge the gap between current and desired performance with this strategic diagram. Featuring a split-path layout and central bridge graphic, this template helps visualize obstacles, goals, and solutions. Ideal for strategy teams, consultants, and analysts. Fully editable in PowerPoint, Keynote, and Google Slides—clear, impactful, and easy to customize.


6 slides
Capability Gap Analysis Infographic
Gap analysis is a strategic management tool used to compare an organization's current performance or situation with its desired or target state. This infographic template is a visual representation of the process of conducting a capability gap analysis, which is a strategic assessment used to identify the gaps between their current capabilities and the capabilities required to achieve their goals or meet specific objectives. The infographic aims to provide a clear and concise overview of the capability gap analysis process and its key components. Compatible with Powerpoint, Keynote, and Google Slides.


6 slides
International Breast Cancer Day Infographics
Celebrate International Breast Cancer Day with our customizable infographic template, designed to raise awareness and share vital information about breast cancer. This template is fully compatible with popular presentation software such as PowerPoint, Keynote, and Google Slides, allowing you to easily personalize it to convey your unique message. The International Breast Cancer Day infographic template serves as a versatile canvas for displaying facts, statistics, prevention methods, and support resources related to breast cancer. Whether you're a healthcare professional, advocate, or someone passionate about promoting breast health, this template offers a user-friendly platform to create informative presentations and awareness materials. Make an impact with this SEO-optimized International Breast Cancer Day infographic template, meticulously crafted for clarity and ease of use. Customize it to share stories of survivors, highlight the importance of early detection, and spread the message of hope and support. Start creating your personalized infographic to contribute to the cause today!