


Features
- 21 Unique Slides
- Fully editable and easy to edit in Microsoft Powerpoint, Keynote and Google Slides
- 16:9 widescreen layout
- Clean and professional designs
- Export to JPG, PDF or send by email


Do you have any questions?
Recommend


5 slides
Visual Decision-Making with Harvey Balls Presentation
Simplify complex evaluations with this Harvey Ball comparison chart. Ideal for product comparisons, feature assessments, or decision-making matrices, this slide presents up to 6 items and 4 features with intuitive visual cues. Fully editable in PowerPoint, Keynote, or Google Slides, it’s perfect for business, marketing, and strategy teams seeking clear and compelling insights.


21 slides
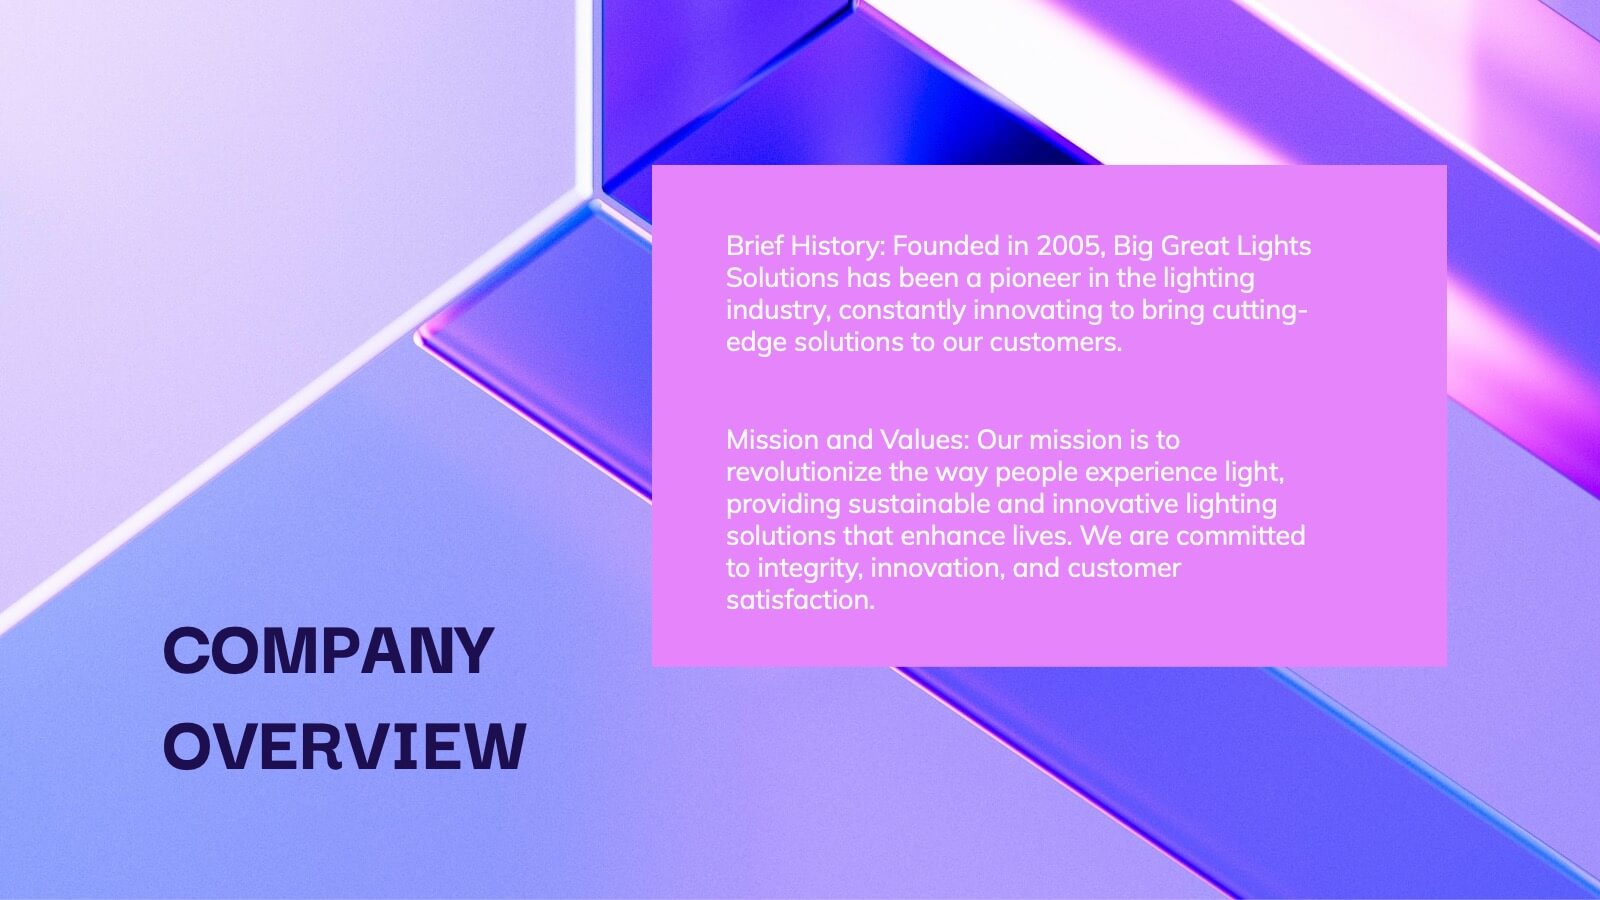
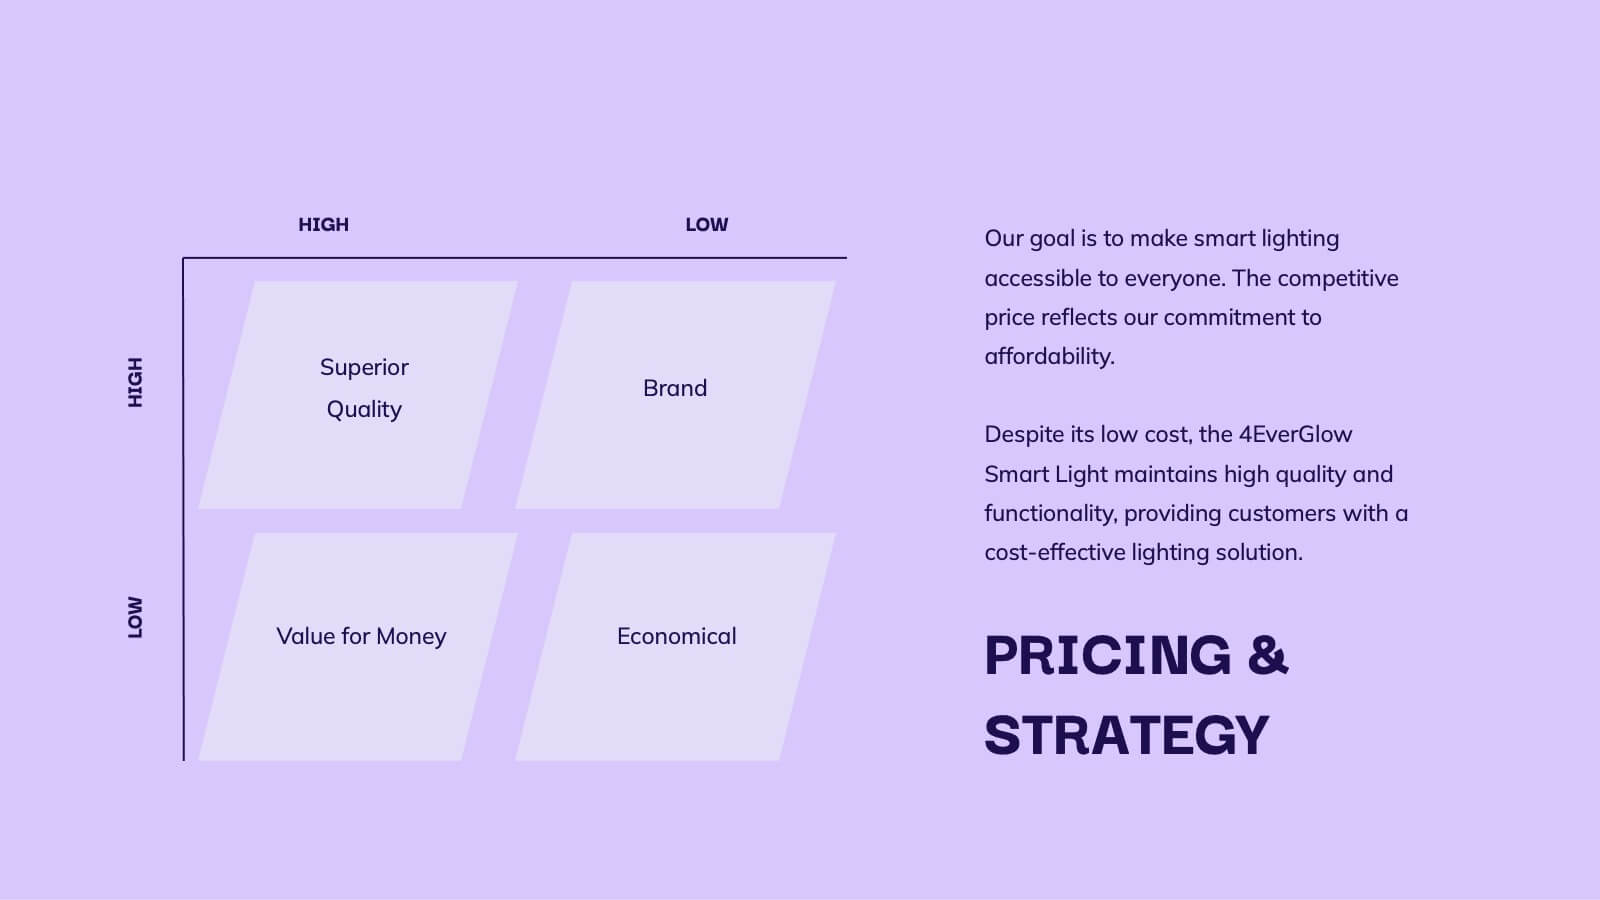
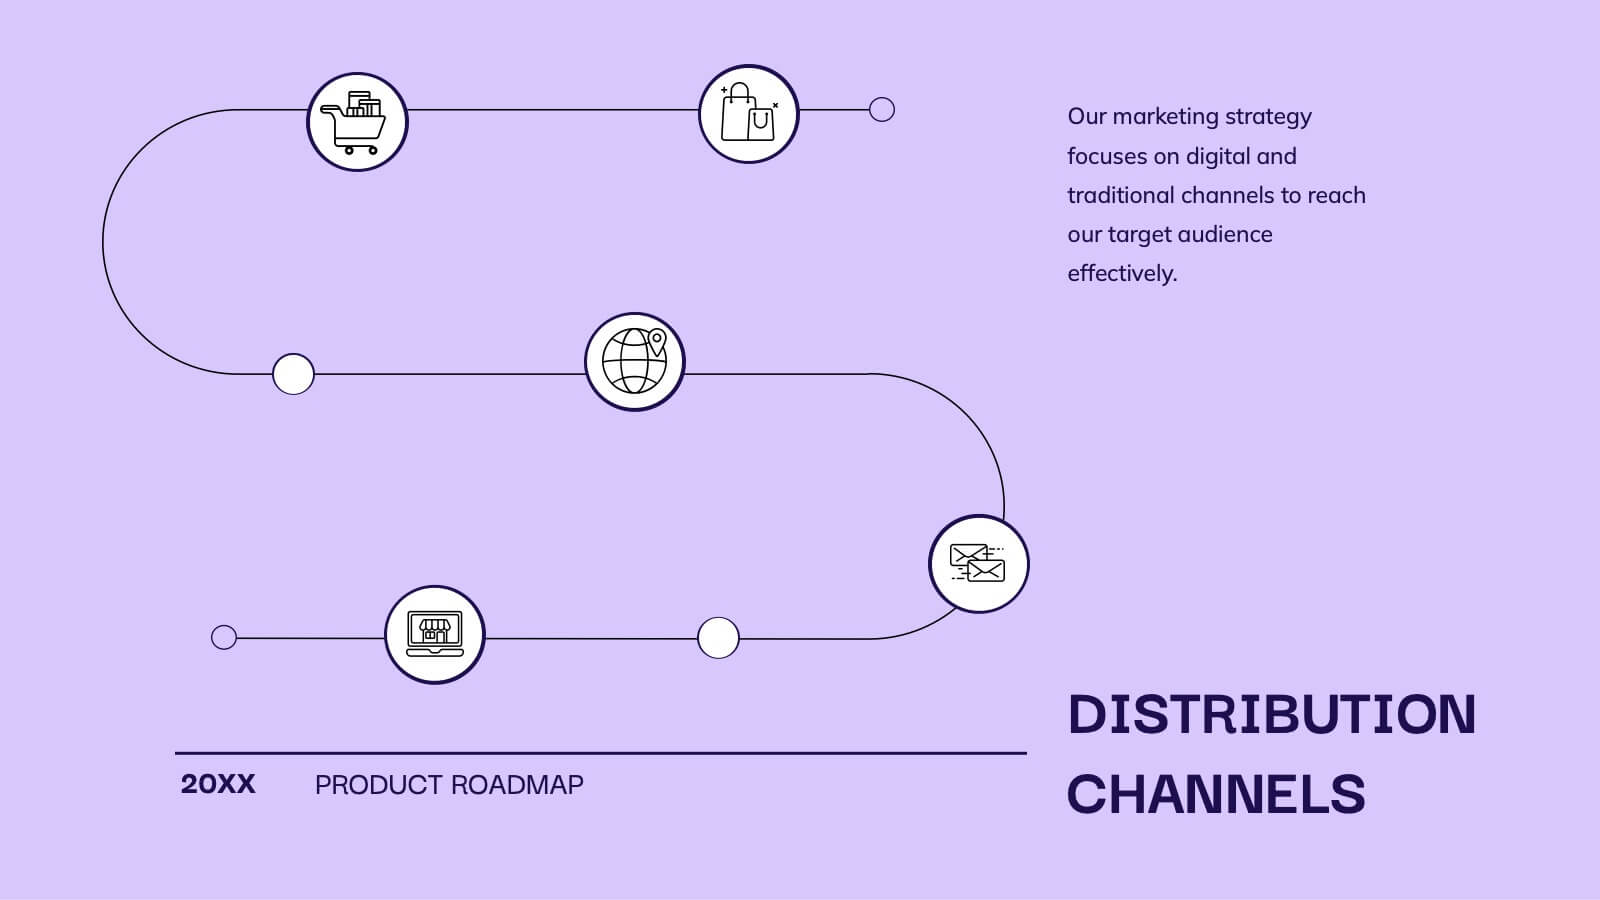
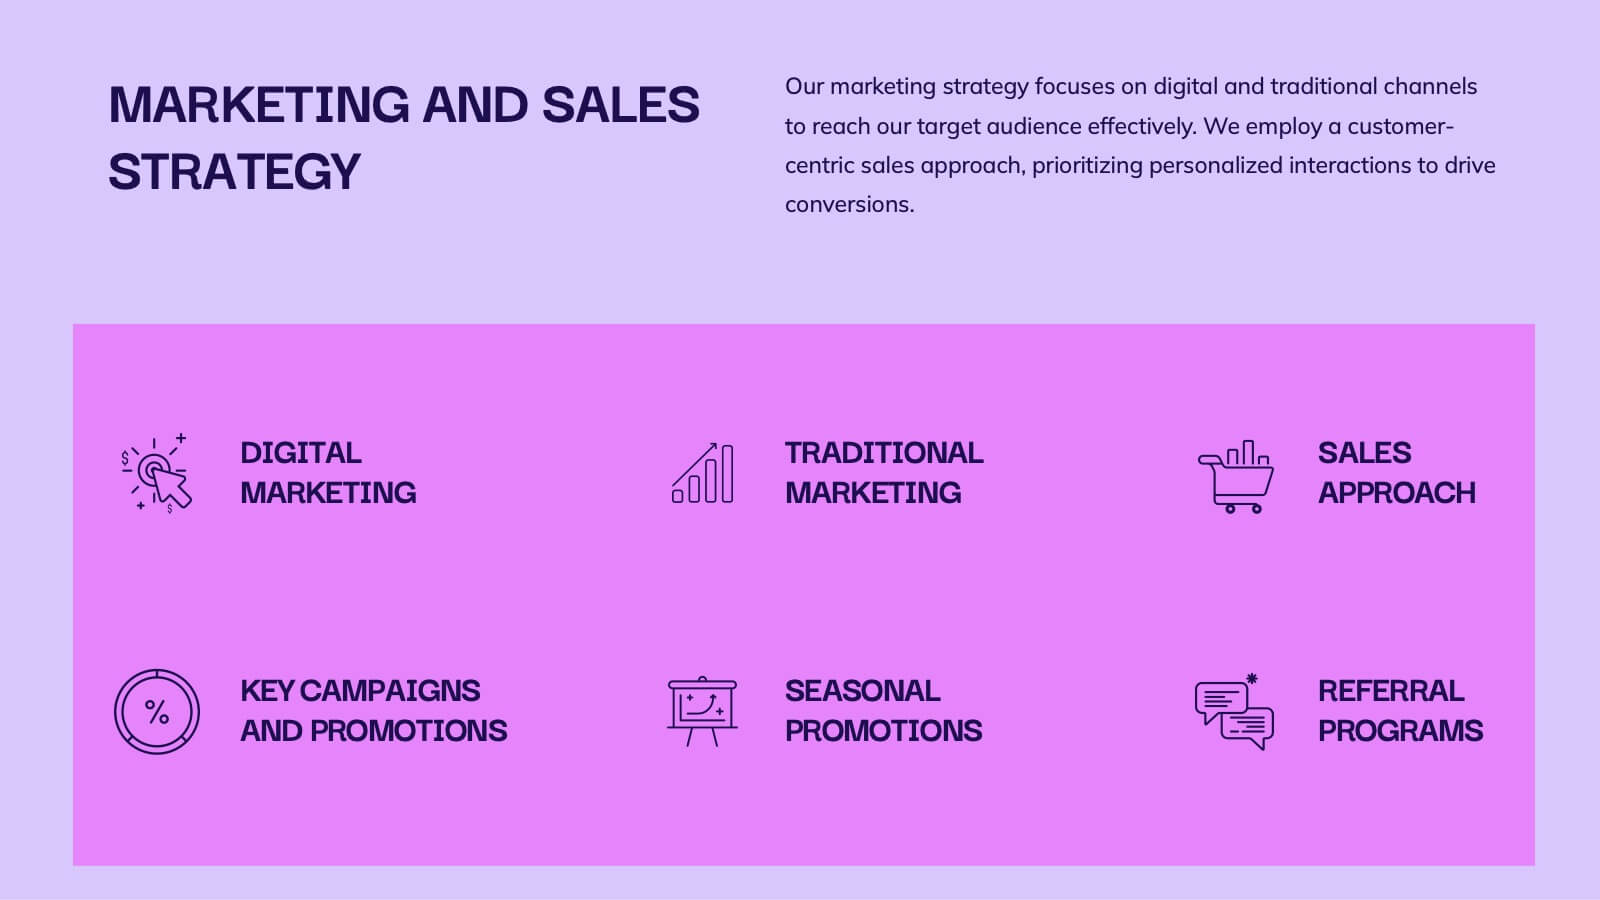
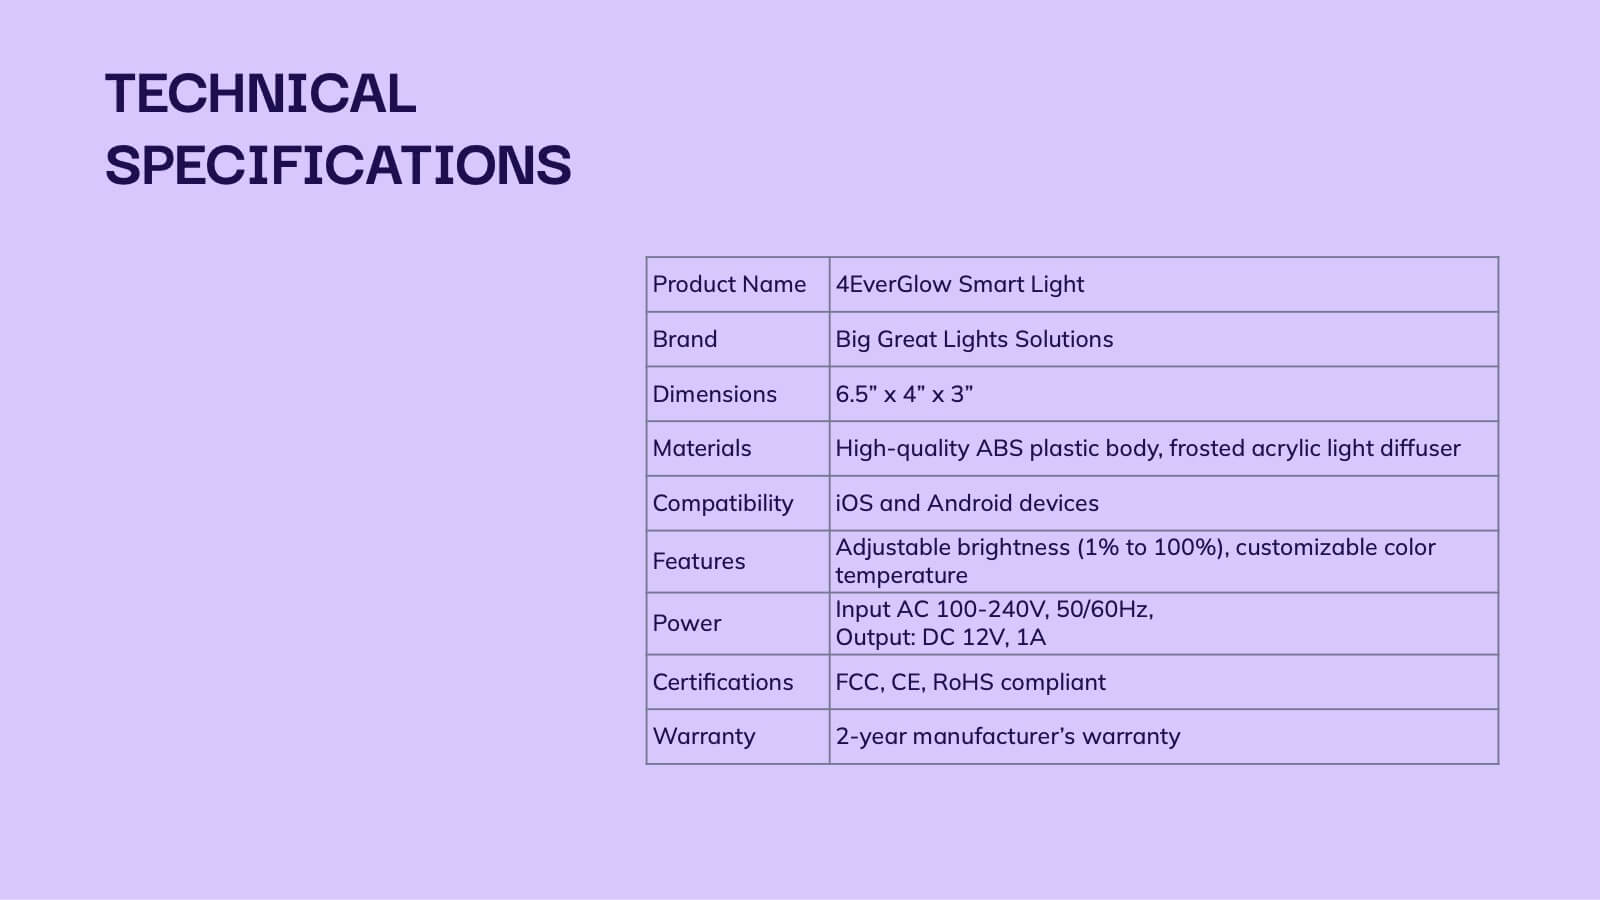
Glimmer Product Roadmap Presentation
Illuminate your product's future with this vibrant glimmer-themed presentation template! Perfect for outlining your product roadmap, it allows you to present key milestones, features, and timelines in a visually engaging way. Captivate your audience and keep them informed about your exciting journey ahead. Compatible with PowerPoint, Keynote, and Google Slides.


25 slides
The Power of HIIT Presentation
Supercharge your fitness routine with this high-energy presentation on the power of HIIT. Covering key benefits like fat burning, muscle endurance, metabolism boost, and time-efficient workouts, this template helps break down the science behind high-intensity interval training. Fully customizable and compatible with PowerPoint, Keynote, and Google Slides for a seamless presentation experience.


21 slides
Graphium Market Analysis Report Presentation
Deliver actionable insights with this sleek market analysis report presentation template. Highlight key areas such as performance metrics, market trends, competitor insights, and strategic initiatives to inform stakeholders and drive decisions. Perfect for analysts and business teams, this template is fully compatible with PowerPoint, Keynote, and Google Slides.


5 slides
Brainstorming Session Diagram Presentation
Spark creativity and structure your next idea session with the Brainstorming Session Diagram Presentation. Featuring a central brain icon and four labeled input areas, this layout makes it easy to visualize and organize group contributions. Fully editable in PowerPoint, Canva, and Google Slides for seamless collaboration and customization.


6 slides
Goal Setting and Strategic Planning Presentation
Present objectives and action plans with the Goal Setting and Strategic Planning template. Featuring a modern segmented design, this layout is perfect for outlining priorities, initiatives, and milestones. Fully editable in Canva, PowerPoint, and Google Slides, allowing you to adapt colors, icons, and text to match your business vision.


6 slides
Oceania Regional Coverage Strategy Presentation
Plan and present your regional focus with the Oceania Regional Coverage Strategy Presentation. This slide template features a clear map of Oceania with pinpoint markers and corresponding callout labels, perfect for visualizing expansion zones, logistics hubs, or target markets. Fully customizable in Canva, PowerPoint, and Google Slides.


6 slides
Project Timeline Calendar Presentation
Kick your planning into high gear with a clean, colorful layout that makes tracking progress feel effortless. This presentation helps you map tasks across the week, visualize timelines, and communicate project schedules with absolute clarity. It’s fully editable and works seamlessly in PowerPoint, Keynote, and Google Slides.


7 slides
Environmental Planning Infographic Presentation
Environmental infographics are an essential tool in raising awareness about the state of the environment and the impact of human activities on the planet. This template presents a broad range of data text on the environment for you to input. Use this eye-catching infographic design to educate and raise awareness about the environment. This template is ideal to give an overview of the topic, its importance and the main issues. Stay on track using facts and figures, good visuals and data visualizations. This presentation is easy to use and can be edited in Powerpoint, Keynote or Google Slides.


21 slides
Utopia Marketing Proposal Template Presentation
Unleash your marketing potential with this vibrant, modern presentation template. Perfect for presenting marketing proposals, industry overviews, and consumer behavior analysis, it features a colorful design that captures attention. Highlight key strategies like social media, influencer marketing, and SEO trends to engage your audience. Compatible with PowerPoint, Keynote, and Google Slides, it ensures seamless presentations on any platform.


4 slides
Business Operations Office Theme Presentation
Make your workflow feel effortless with this sleek, illustrated office layout designed to simplify complex business operations. Ideal for presenting processes, responsibilities, or resource planning, the clean visuals and structured format help communicate your message clearly. Fully editable and compatible with PowerPoint, Keynote, and Google Slides for seamless customization.


5 slides
Process Improvement Cycle Mapping Presentation
Illustrate continuous growth and optimization with this modern process improvement cycle template. Featuring a dynamic circular flow design, it’s ideal for showcasing iterative strategies, workflow enhancements, or business development stages. Fully editable in Canva, PowerPoint, and Google Slides, it ensures clarity and professionalism in mapping each step toward better performance.


5 slides
Attention to Action Model Framework Presentation
This sleek presentation visualizes the four key stages—Attention, Interest, Desire, and Action—in a clear, pyramid-based layout. Ideal for marketing, sales, or behavioral strategy discussions. Each step is color-coded for emphasis, making it easy to follow and present. Fully editable in Canva to fit your brand and messaging needs.


5 slides
SMART Objectives Slide Presentation
Kick your planning into gear with a bold, structured layout that makes goal-setting feel energetic and achievable. This presentation helps you outline clear objectives, track progress, and communicate strategy with a clean, organized flow designed for teams and leaders. Fully compatible with PowerPoint, Keynote, and Google Slides.


6 slides
IT Operations Workflow Presentation
Visualize your IT processes with a sleek, structured flow that highlights every operational step from start to finish. Ideal for presenting systems management, network operations, or support frameworks, this presentation brings clarity to technical workflows. Fully compatible with PowerPoint, Keynote, and Google Slides for easy customization and seamless presentation delivery.


22 slides
Arachne Digital Marketing Strategy Plan Presentation
Weave a powerful digital marketing strategy with this sleek, Arachne-inspired presentation! Perfect for outlining your digital marketing plans, this template helps you highlight key strategies, analytics, and campaign goals in a structured and visually engaging way. Its modern design keeps your audience focused. Compatible with PowerPoint, Keynote, and Google Slides.


26 slides
Nahla Presentation Template
Brand guidelines are the set of rules that define the overall look and feel of your brand. They allow you to build a brand identity. A brand style guide is the ultimate resource for communicating your brand’s identity to everyone on your team. Use the Nahla template to help define your company's branding the correct way. This is a highly customizable, responsive template. Create a unique ambience that your customers and audience can recognize across all platforms. Nahla provides a platform for the design team to help shape the direction of your brand, while ensuring consistency.