


Features
- 5 Unique slides
- Fully editable and easy to edit in Microsoft Powerpoint, Keynote and Google Slides
- 16:9 widescreen layout
- Clean and professional designs
- Export to JPG, PDF or send by email


Do you have any questions?
Recommend


6 slides
Creative Thinking and Innovation Presentation
Unleash Creative Thinking and Innovation with this engaging infographic. Featuring a visually dynamic brain puzzle design, this template is perfect for presenting problem-solving strategies, brainstorming techniques, and creative business solutions. Fully editable and compatible with PowerPoint, Keynote, and Google Slides.


2 slides
Website UI Mockup Device Display Presentation
Showcase your website's interface with the Website UI Mockup Device Display slide. This professional and modern layout features a desktop screen to elegantly present your web design, user interface, or digital product. Perfect for designers, developers, and marketing presentations. Fully editable and compatible with PowerPoint, Keynote, and Google Slides.


5 slides
Alcohol Abuse Infographics
Alcohol Abuse refers to the excessive and harmful consumption of alcohol, which can have serious physical, psychological, and social consequences. These infographic templates are a powerful tool to educate and inform individuals about the risks and consequences of alcohol abuse. This is perfect for educational campaigns, healthcare professionals, or community organizations. This is designed to raise awareness about the issue of alcohol abuse. This template allows you to provides an overview of alcohol abuse, its impact on individuals and society, and key facts and statistics related to this issue.


22 slides
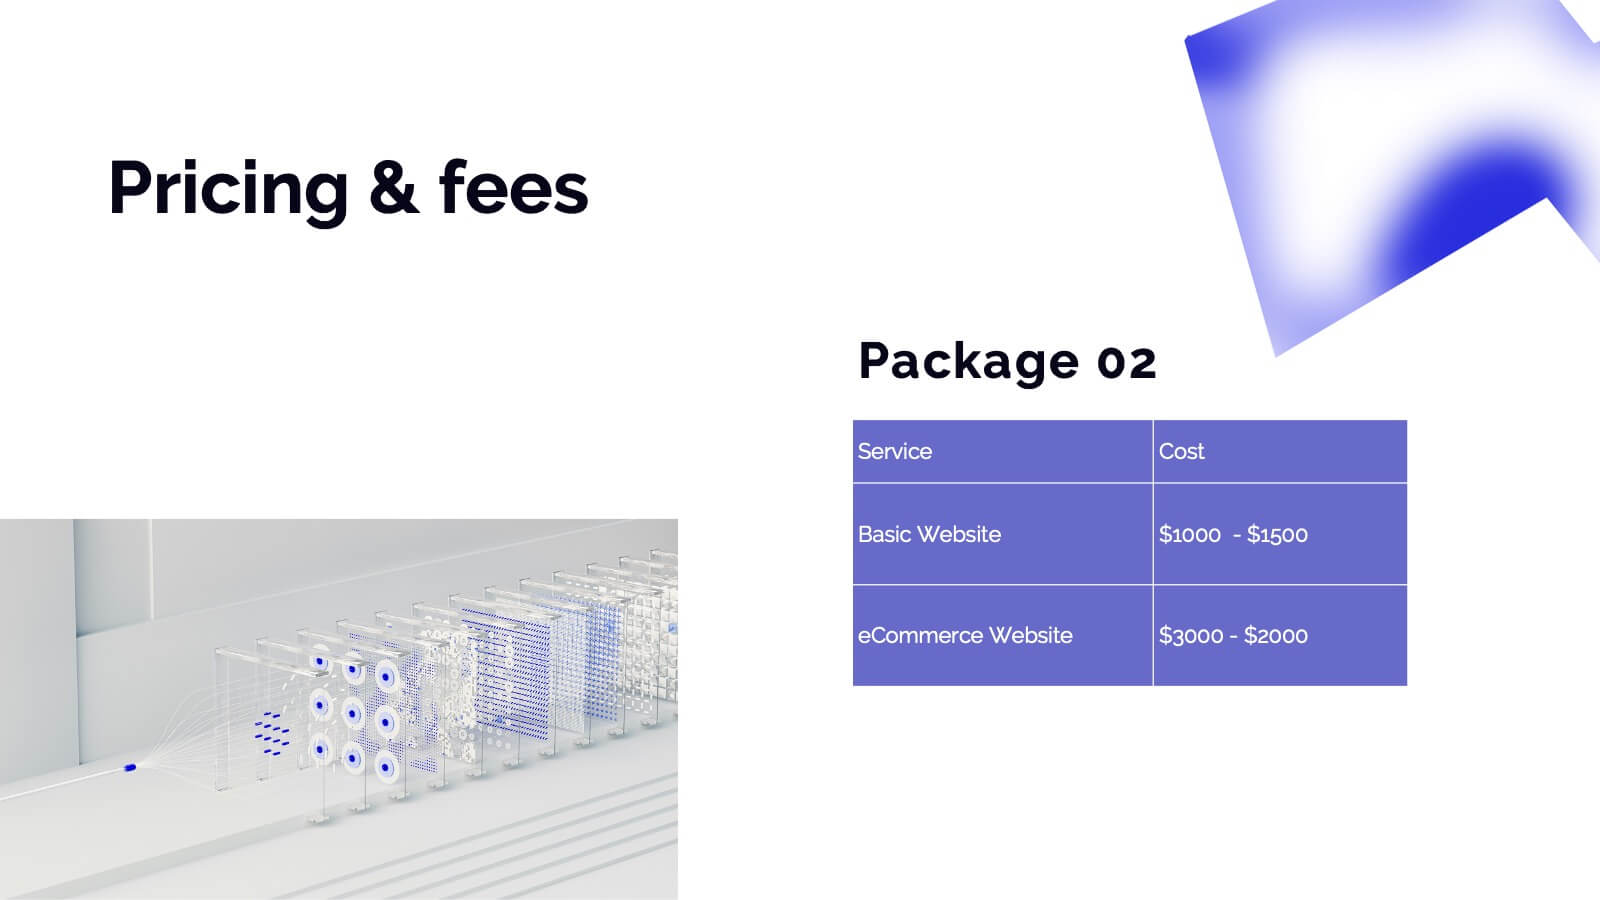
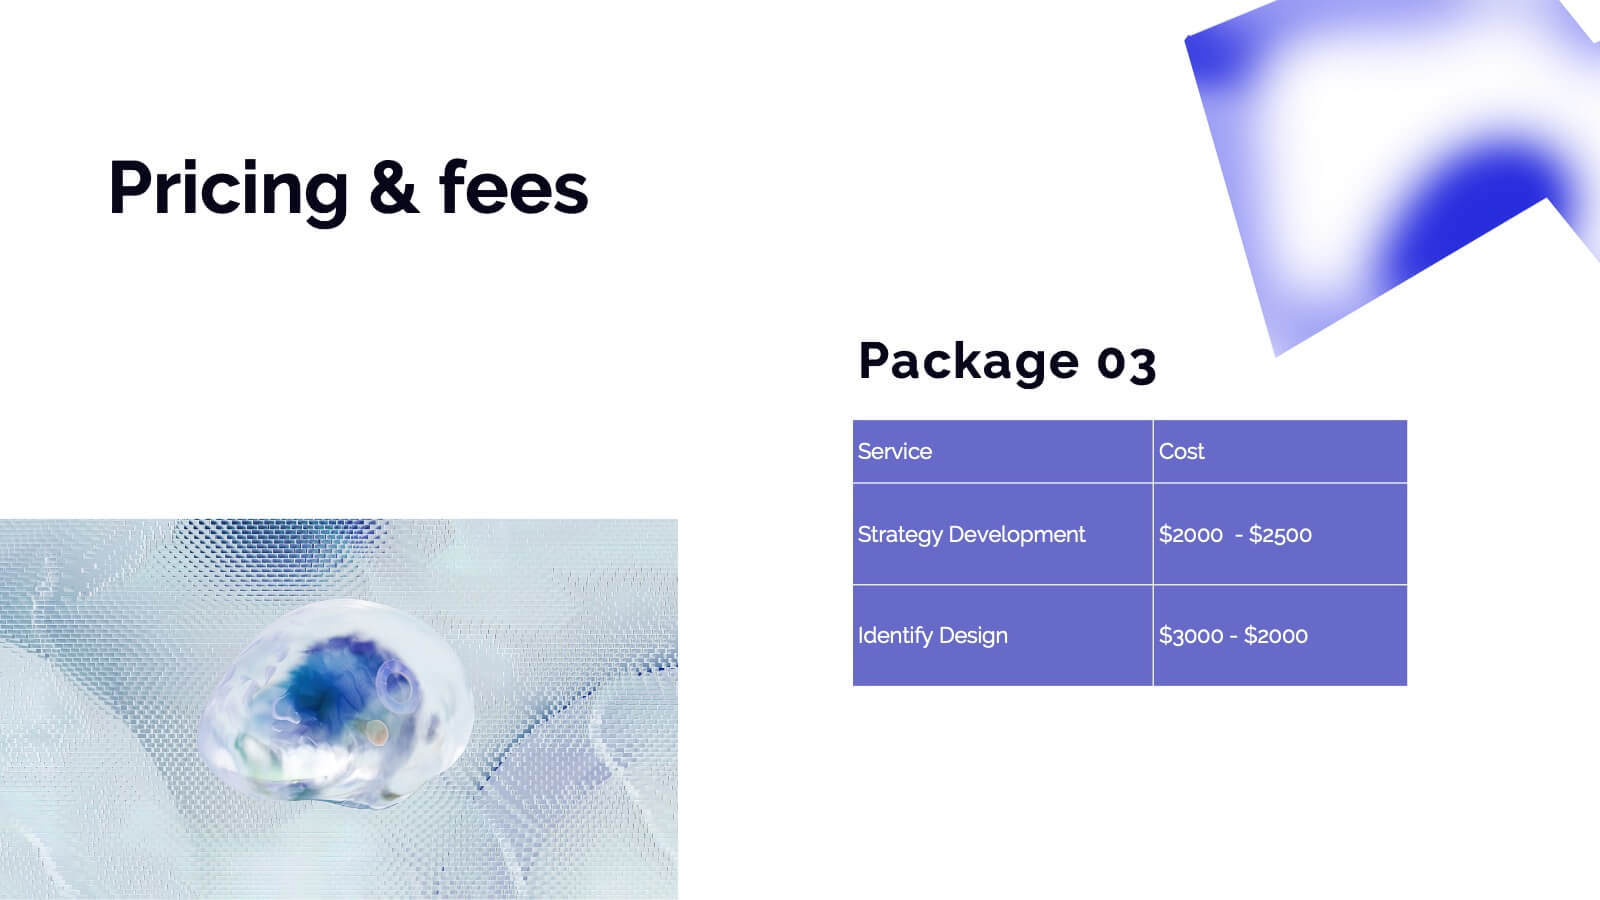
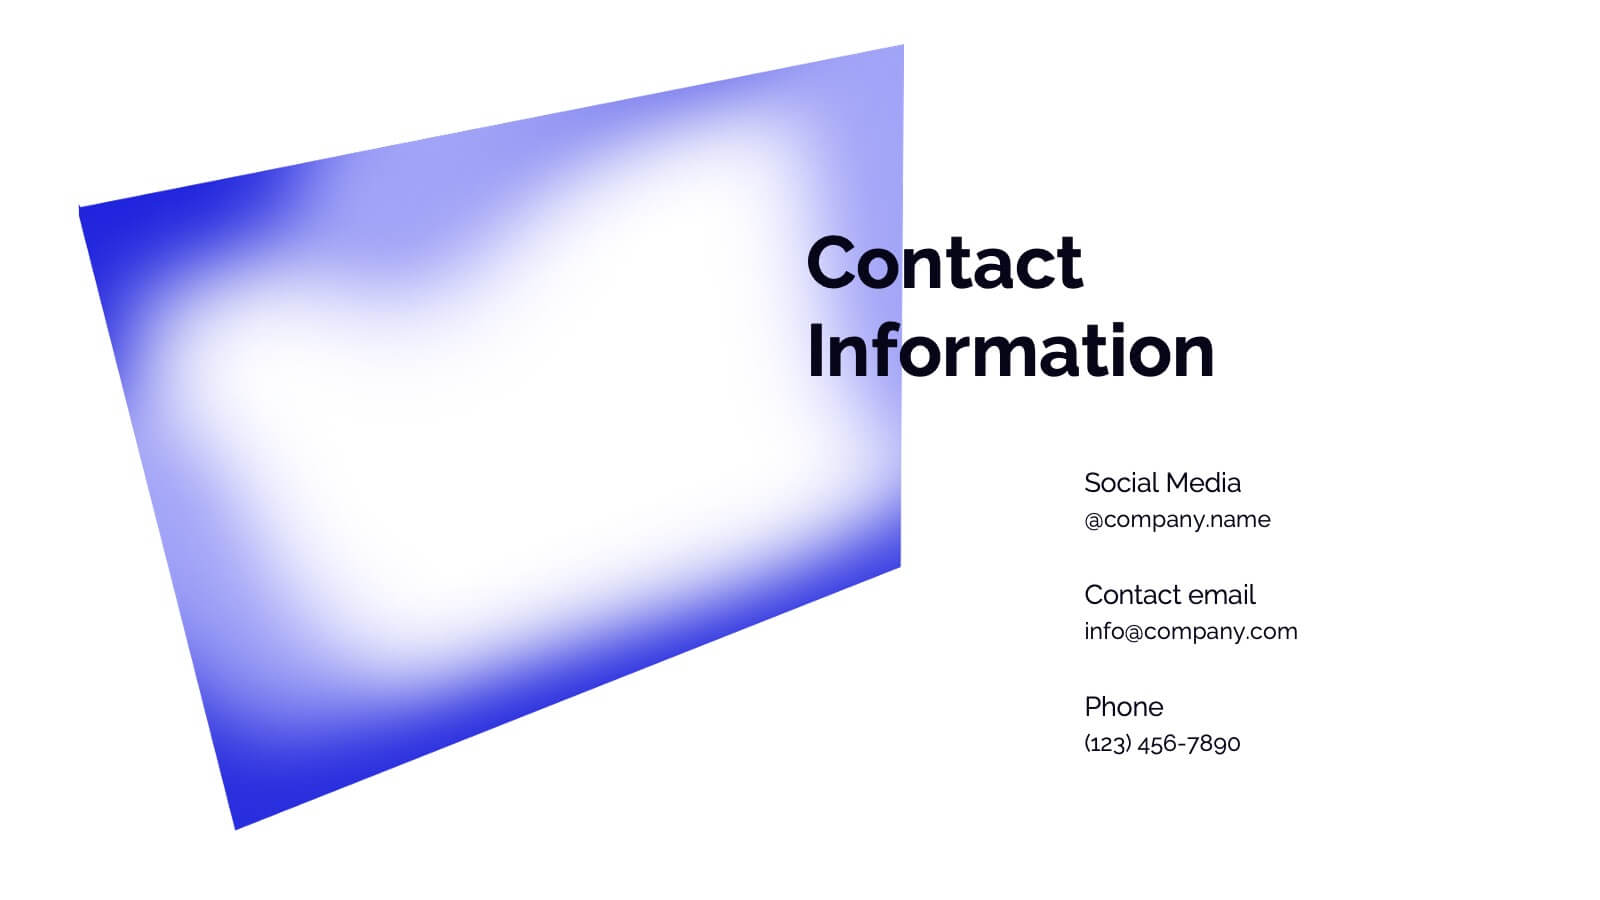
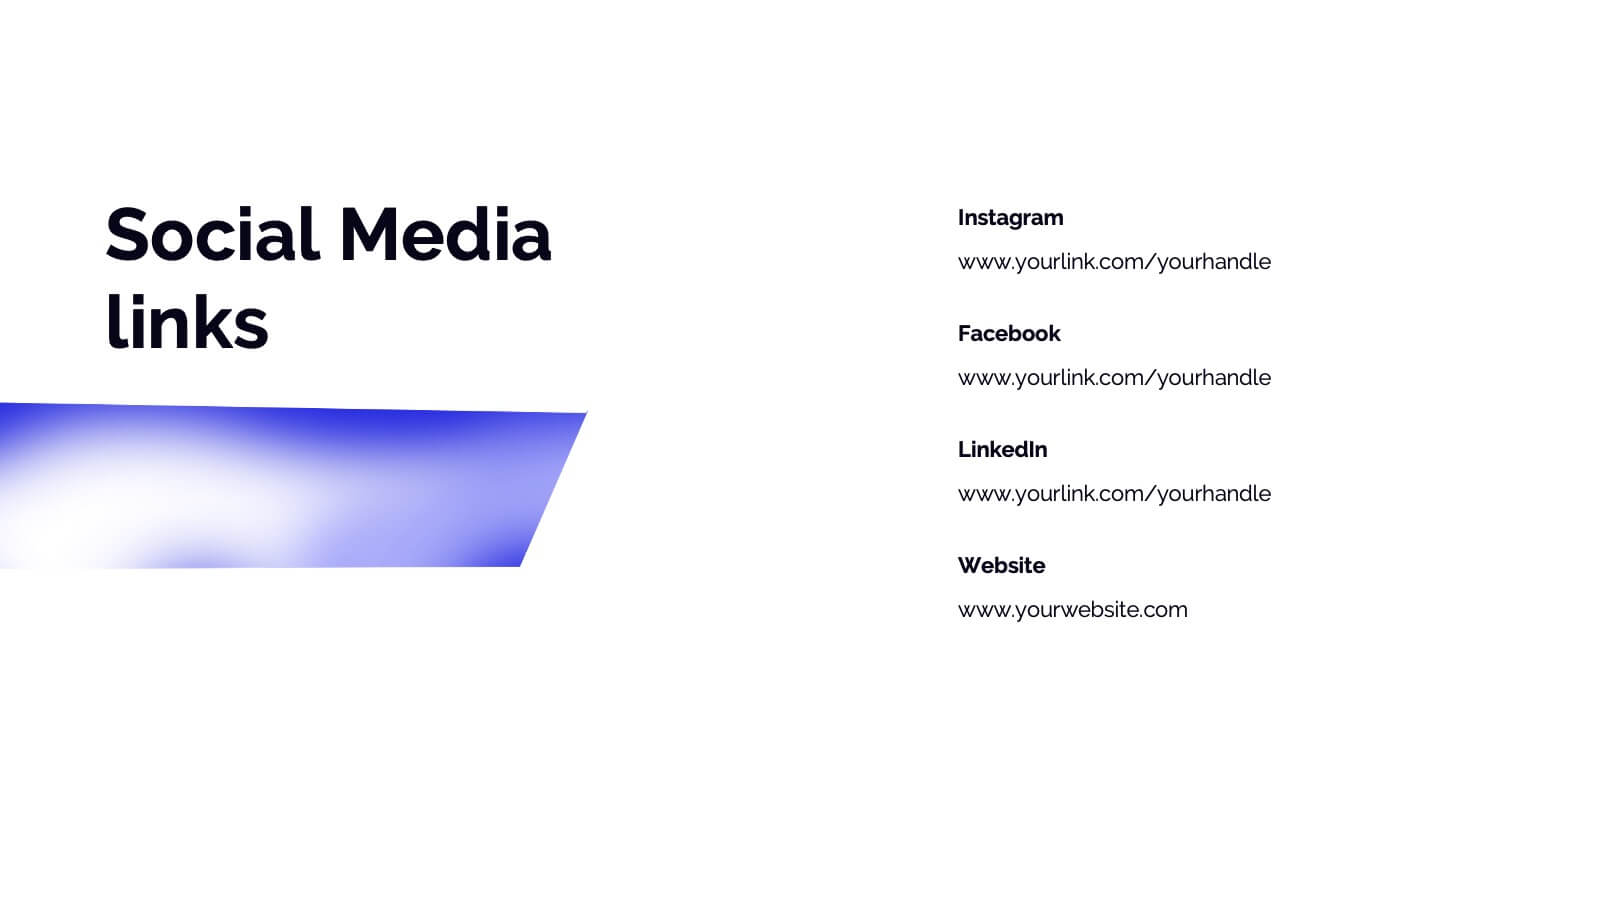
Etherwind Advertising Agency Proposal Presentation
This Advertising Agency Proposal Presentation Template offers a sleek and professional layout, perfect for showcasing your agency's capabilities, services, and success stories. Covering essential sections such as market analysis, strategy development, campaign execution, and client testimonials, it ensures a compelling pitch to potential clients. Designed for easy customization in PowerPoint, Keynote, and Google Slides, making it a versatile choice for agencies looking to impress their audience.


4 slides
Customer Market Segmentation Analysis Presentation
Understand your audience with clear and effective segmentation analysis. This Customer Market Segmentation Analysis template provides a professional visual representation of audience groups, helping businesses target the right demographics. Ideal for marketers, business strategists, and sales teams. Fully editable and compatible with PowerPoint, Keynote, and Google Slides for seamless customization.


6 slides
Professional Company Profile Deck Presentation
Present your business with impact using this modern company profile deck. Designed for clarity and professionalism, it includes structured icons, visual highlights, and customizable content sections. Ideal for pitches, internal briefings, or executive introductions. Fully editable in PowerPoint, Keynote, and Google Slides to match your brand and messaging effortlessly.


6 slides
Stock Market Investment and Analysis Presentation
Showcase your market insights with this dynamic zigzag arrow diagram—perfect for highlighting bullish vs. bearish trends, financial analysis, and investment milestones. The slide features a split-path layout with icons and editable text areas to clearly compare strategies or illustrate turning points. Fully customizable in PowerPoint, Keynote, and Google Slides.


4 slides
Employee Training and Development
Train smarter, not harder—with this bold funnel-style visual that maps your employee development journey from initial training to measurable impact. It's perfect for illustrating progress, performance shifts, or development stages across teams or roles. Fully customizable in PowerPoint, Keynote, and Google Slides for smooth integration into any professional presentation.


5 slides
Environment News Infographics
Dive into the pressing issues of our times with environment news infographics. Crafted in shades of a serene blue palette, this collection is designed for environmental activists and journalists. It stands out with its creative, vertical style, making it perfect for detailed storytelling and comprehensive data representation related to environmental news and studies. Compatible with Powerpoint, Keynote, and Google Slides. The template features innovative graphics, icons, and image placeholders, all customizable to highlight ecological statistics, climate change advancements, or conservation efforts, making complex information accessible and engaging.

23 slides
Dryad Photography Portfolio Template Presentation
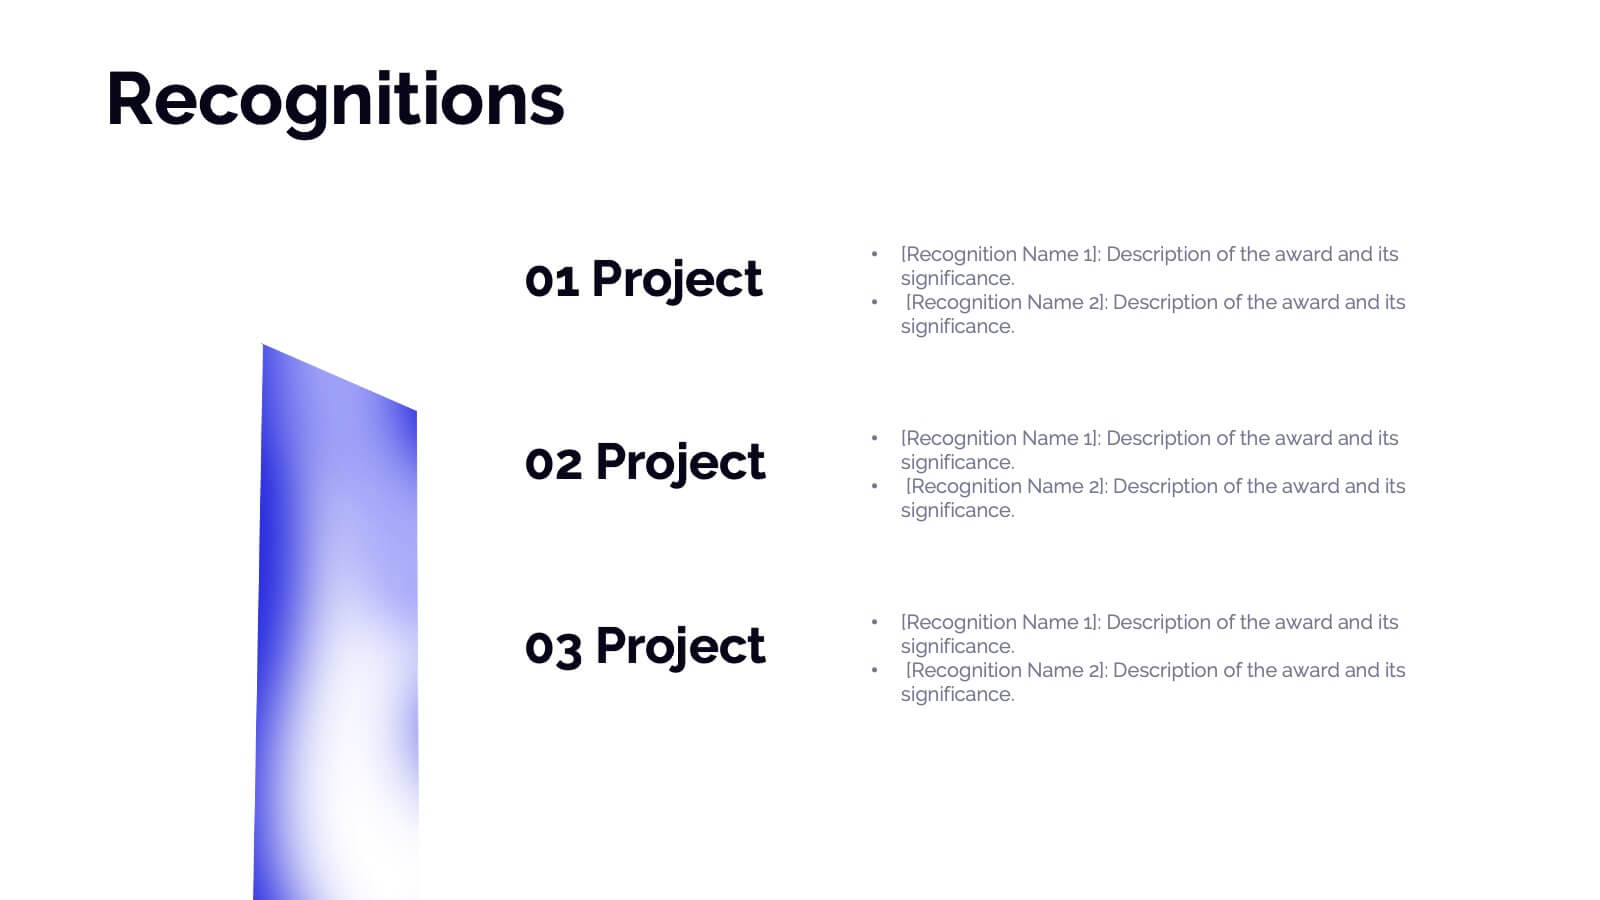
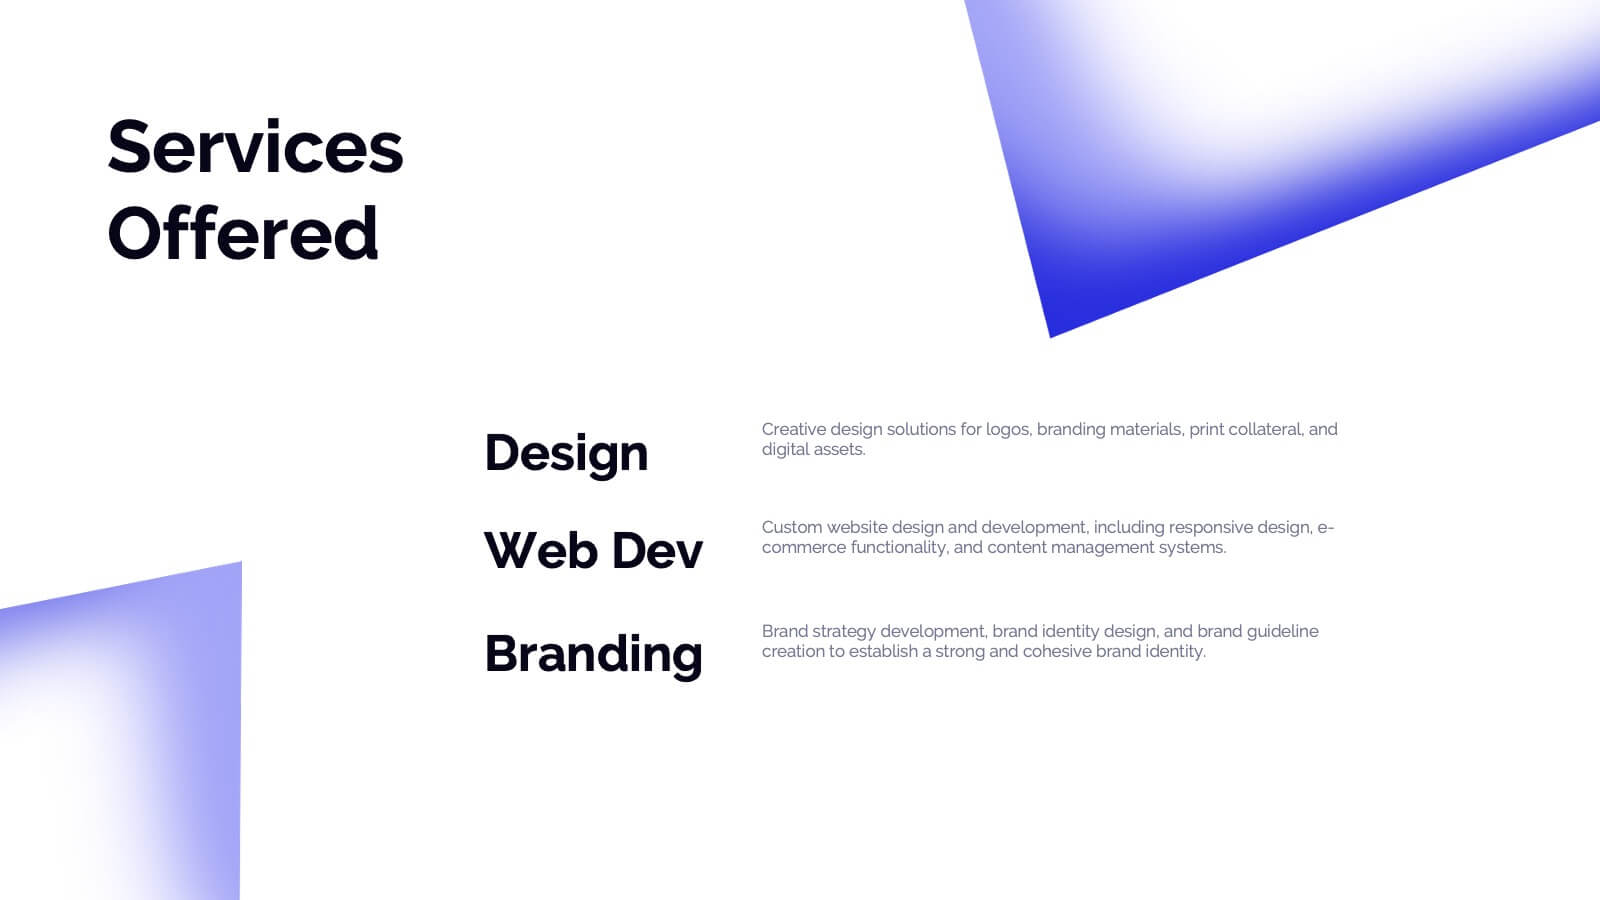
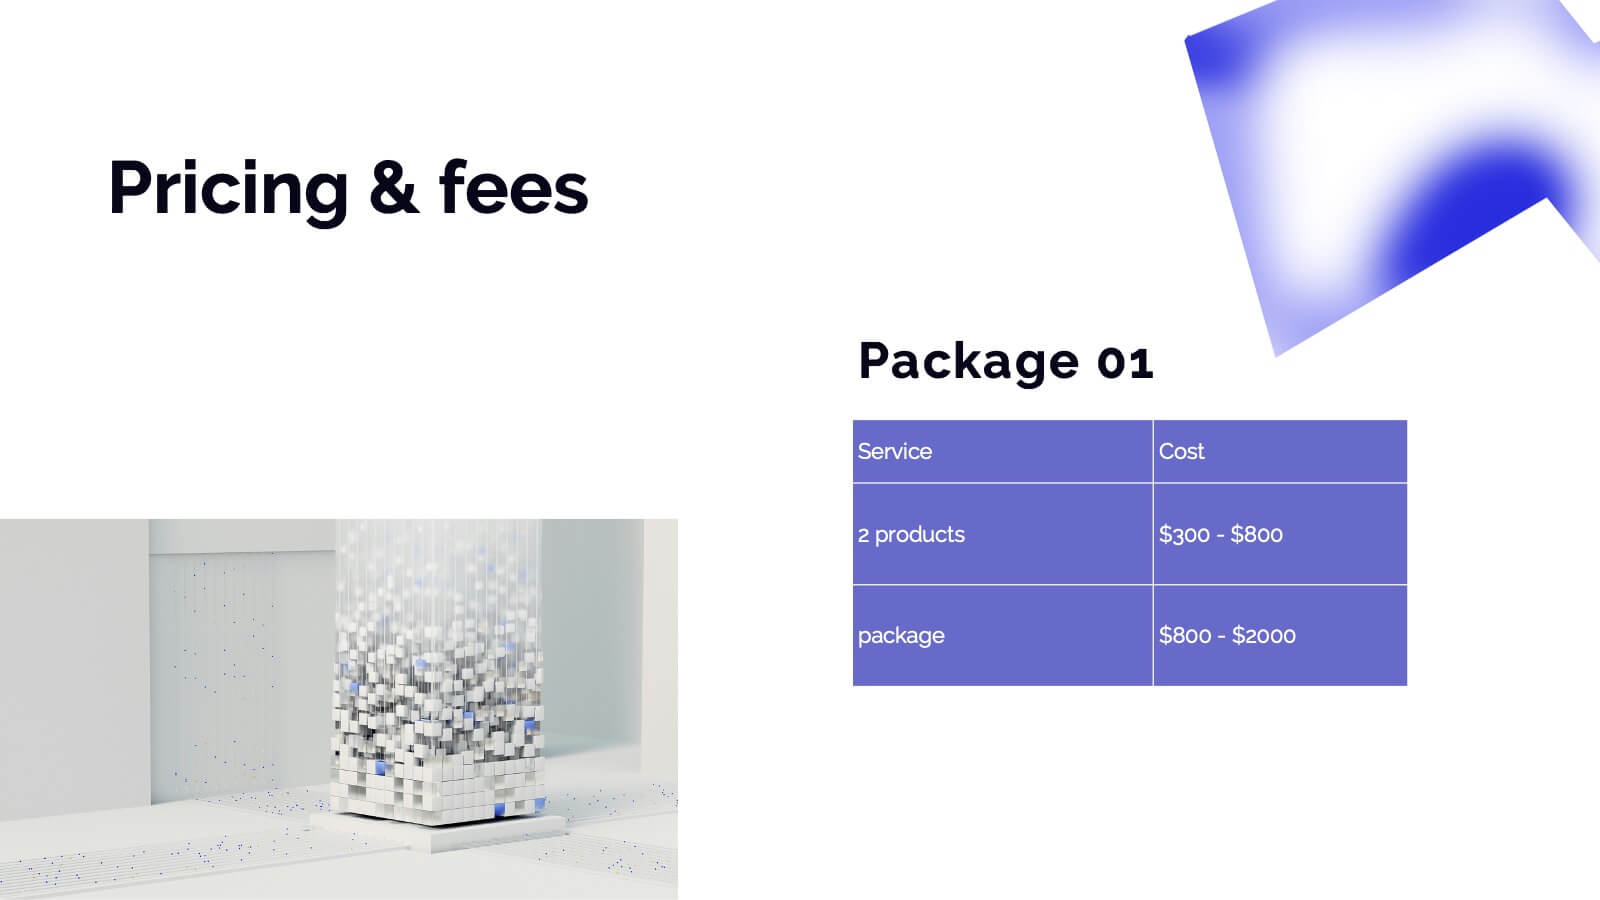
Showcase your photography skills with this elegant and professional portfolio presentation template! Perfect for highlighting your projects, style, and creative process, this template covers everything from client testimonials to pricing and services offered. It’s ideal for photographers wanting to present their work with style and clarity. Compatible with PowerPoint, Keynote, and Google Slides for effortless sharing and presentations.


20 slides
Quasar Design Strategy Proposal Presentation
Elevate your design strategy presentations with this modern, engaging template. Perfect for showcasing design briefs, concept development, and project timelines, it features a sleek layout with a cohesive color scheme. Highlight key elements like typography, textures, and feedback processes to captivate your audience. Compatible with PowerPoint, Keynote, and Google Slides, it ensures seamless presentations on any platform.


5 slides
Project Task Management Presentation
Stay on top of your workflow with this visually organized project task management slide. It features a clear table layout with editable fields for subject, priority level, due date, task status, progress percentage, and last modified date. Ideal for teams managing multiple tasks and deadlines. Use color-coded status bars and icons to communicate task progress at a glance. Perfect for project managers and team leaders. Compatible with PowerPoint, Keynote, and Google Slides.


5 slides
IT Support and Systems Presentation
Streamline your tech communication with a clean, structured layout that highlights your IT services, support processes, and system workflows. Perfect for teams presenting solutions, infrastructure overviews, or technical strategies, this presentation brings clarity to complex topics. Fully compatible with PowerPoint, Keynote, and Google Slides for effortless editing and delivery.


4 slides
Target Audience Analysis Presentation
Dive deep into your market with our "Target Audience Analysis" presentation template. This design aids in visually segmenting and understanding your potential customers through demographics, behaviors, and preferences. Ideal for marketers and strategists, this template is compatible with PowerPoint, Keynote, and Google Slides, providing a clear framework to tailor your strategies effectively to different audience segments.


5 slides
Search Engine Marketing Analysis Presentation
Showcase your SEM insights with a presentation slide that’s as sharp as your strategy. This layout helps you break down ad performance, keyword data, and campaign elements clearly and visually. Perfect for marketers presenting to clients or teams, and fully compatible with PowerPoint, Keynote, and Google Slides.


7 slides
Fishbone Stitch Infographic
Thread together insights with our fishbone stitch infographic. Set on a crisp white canvas, accented with the depth of purple, the intensity of red, and the freshness of green, this template elegantly showcases the intricate details of the fishbone stitch technique. Accentuated with intuitive infographics, emblematic icons, and specific image placeholders, it provides a detailed walk-through of this unique stitching method. Perfectly tailored for Powerpoint, Keynote, or Google Slides. A must-have for fashion designers, textile students, craft enthusiasts, or anyone with a passion for intricate stitchwork.


7 slides
IT Architecture Services Infographic Presentation
An IT Architecture Infographic presents information related to the design, structure, and components of an organization's architecture. IT Architecture refers to the overall framework of an organization's IT systems and infrastructure. This template is designed to communicate the design, structure, and components of your organization's IT architecture. The template features a modern design with a blue color scheme, giving your presentation a professional and sleek look. It is compatible with Powerpoint, Keynote, and Google Slides, making it simple for you to create a professional presentation.