


Features
- 6 Unique slides
- Fully editable and easy to edit in Microsoft Powerpoint, Keynote and Google Slides
- 16:9 widescreen layout
- Clean and professional designs
- Export to JPG, PDF or send by email


Do you have any questions?
Recommend


7 slides
Table Infographic Presentation Template
A Table Infographic is a table format used to organize and present data or information in a structured way. It is often used to present numerical data or statistics in an easy-to-understand format, and can be used in a variety of settings, such as in business, finance, or healthcare. This template is designed to help in organizing your information and make it more understandable. This is compatible with Powerpoint, Keynote, and Google Slides, so you can use it on any device. Use this table infographic to present numerical data or statistics in an easy to understand manner for your audience.


5 slides
Music Eras Infographics
Music history is often divided into distinct eras or periods based on the characteristics and predominant styles of music during specific time periods. These infographic templates are designed to present a chronological overview of significant musical periods, highlighting their characteristics, key composers, notable genres, and major developments. These templates serves as a comprehensive visual guide to help audiences understand the evolution of music throughout history. This template provides a captivating overview of the major music eras, allowing viewers to appreciate the distinct characteristics and contributions of each period.


24 slides
Silver Product Launch Presentation
Unleash the potential of your product launch with this vibrant and engaging presentation template! Designed to showcase your product's unique features, market positioning, and competitive edge, this template helps you tell a compelling story from start to finish. It’s perfect for grabbing attention and driving impact. Compatible with PowerPoint, Keynote, and Google Slides.


5 slides
Digital Marketing Plan Presentation
Build momentum for your online strategy with a clean, structured layout that turns complex ideas into clear, stackable steps. This presentation helps outline goals, channels, and campaign actions in a visual flow that’s easy to follow and adapt. Fully customizable for PowerPoint, Keynote, and Google Slides.


5 slides
Corporate Teamwork and People Focus
Show how every team member powers success with this people-centered visual designed to highlight collaboration, roles, and interconnected efforts. Ideal for HR briefings, corporate values, or teamwork strategies, this gear-inspired layout places individuals at the heart of progress. Fully compatible with PowerPoint, Keynote, and Google Slides.


6 slides
Ideal Customer Profile Infographic
A customer profile, also known as a buyer persona, is a detailed and semi-fictional representation of your ideal customer. This infographic template can help businesses visualize and communicate their target audience characteristics and preferences. This template is a valuable tool for educating your team and clients about your ideal customer profile. This customer profile infographic can help your team align their efforts towards effectively targeting and engaging the right audience for your products or services. Compatible with Powerpoint, Keynote, and Google Slides. Incorporate your brand's logo and color scheme to maintain consistency.

21 slides
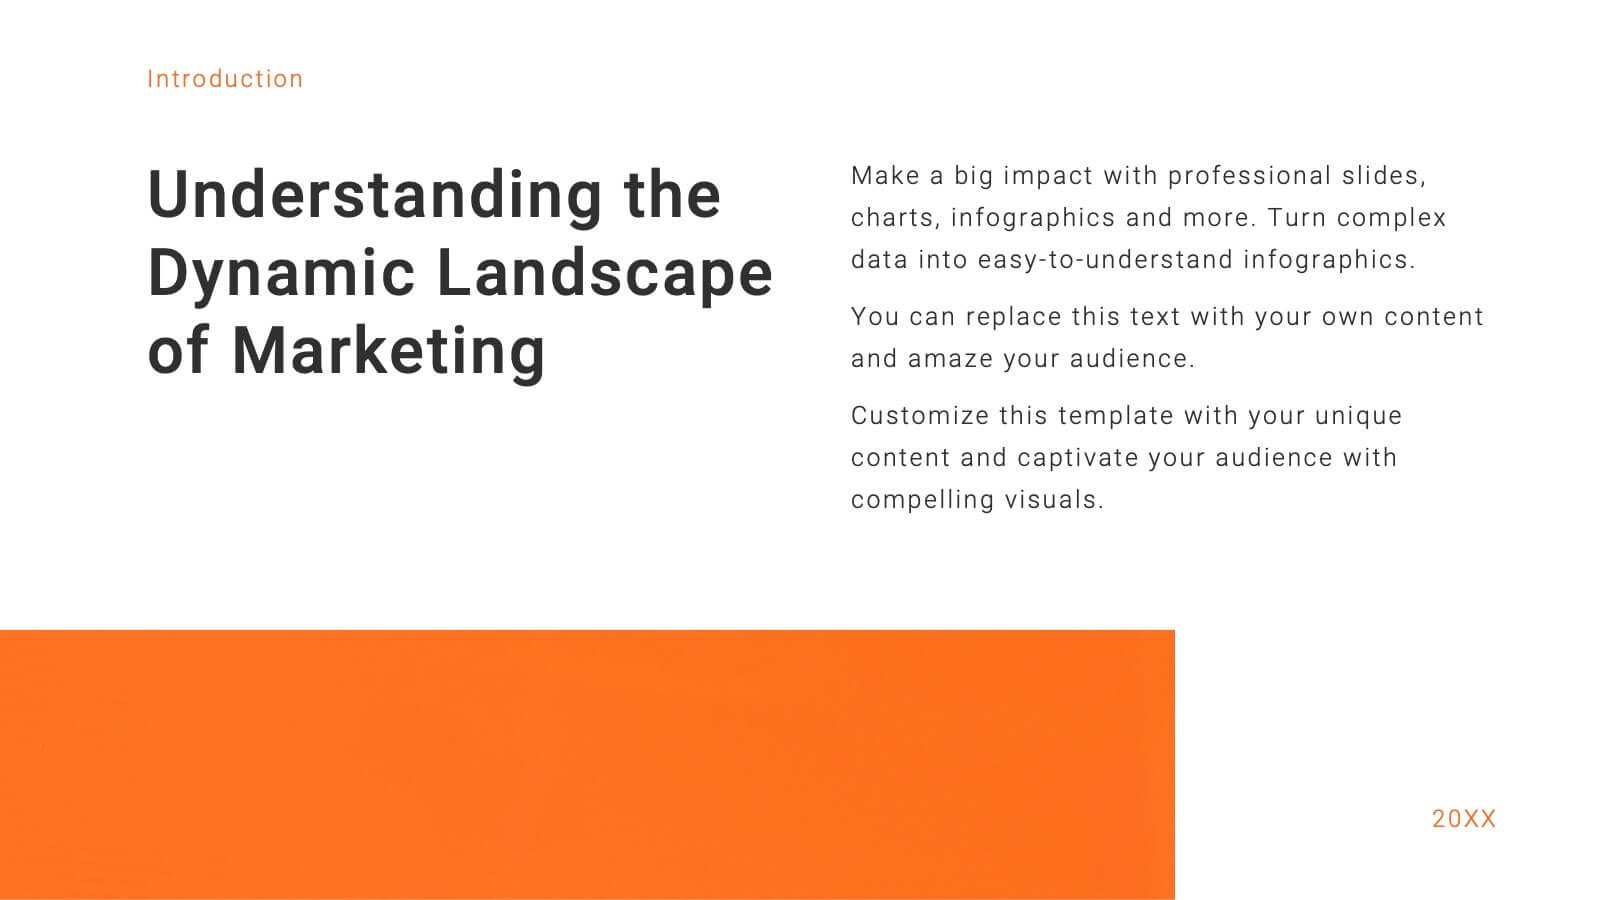
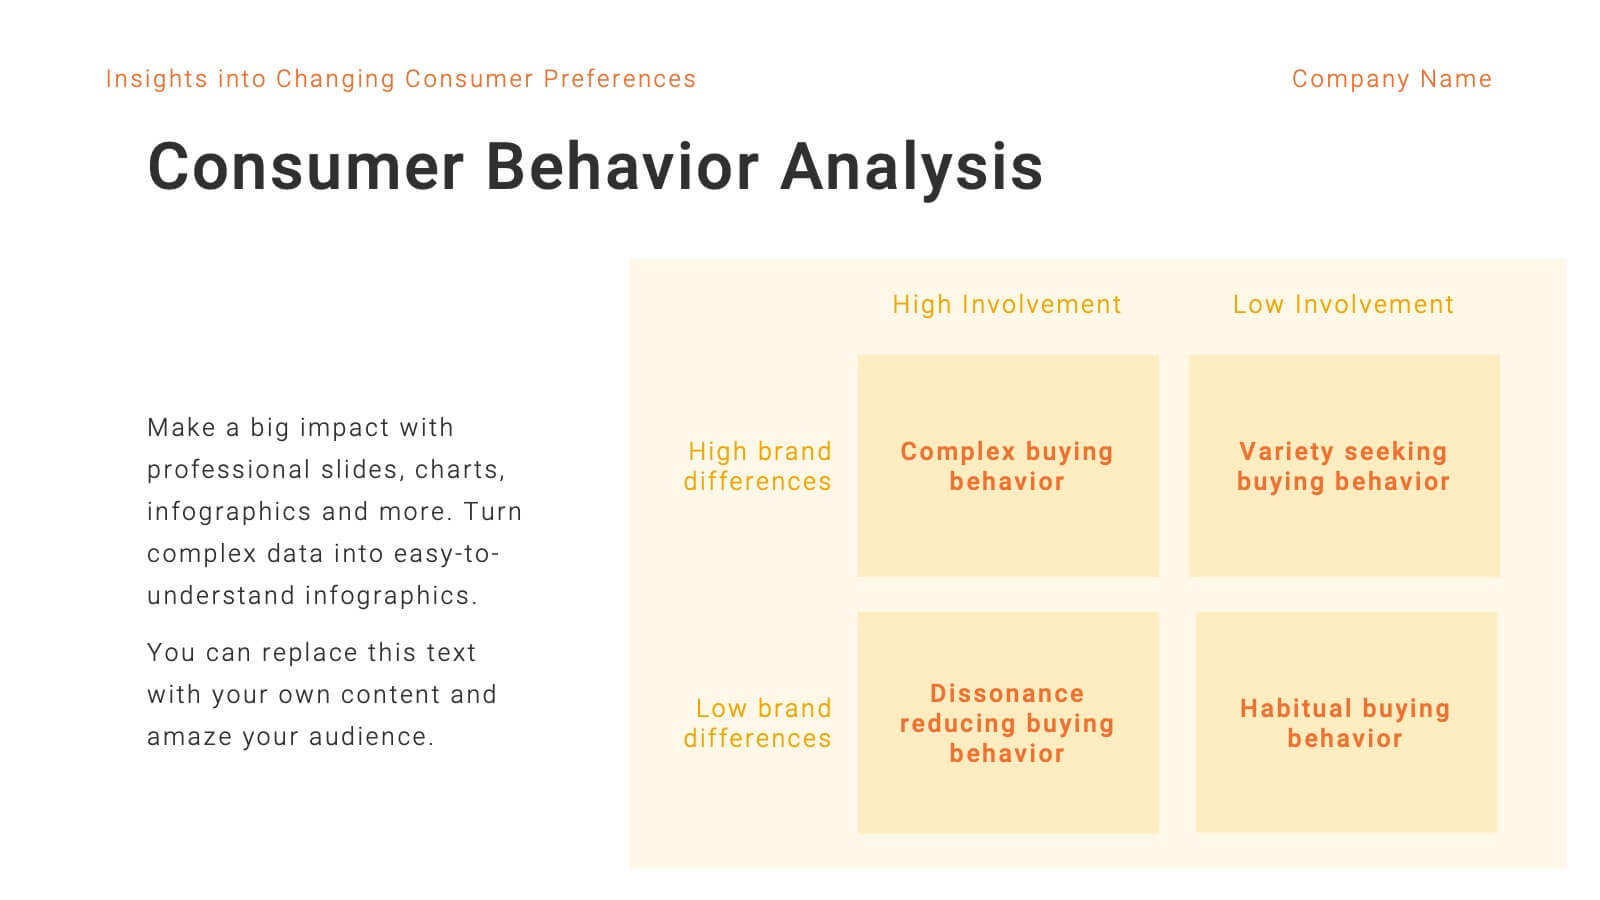
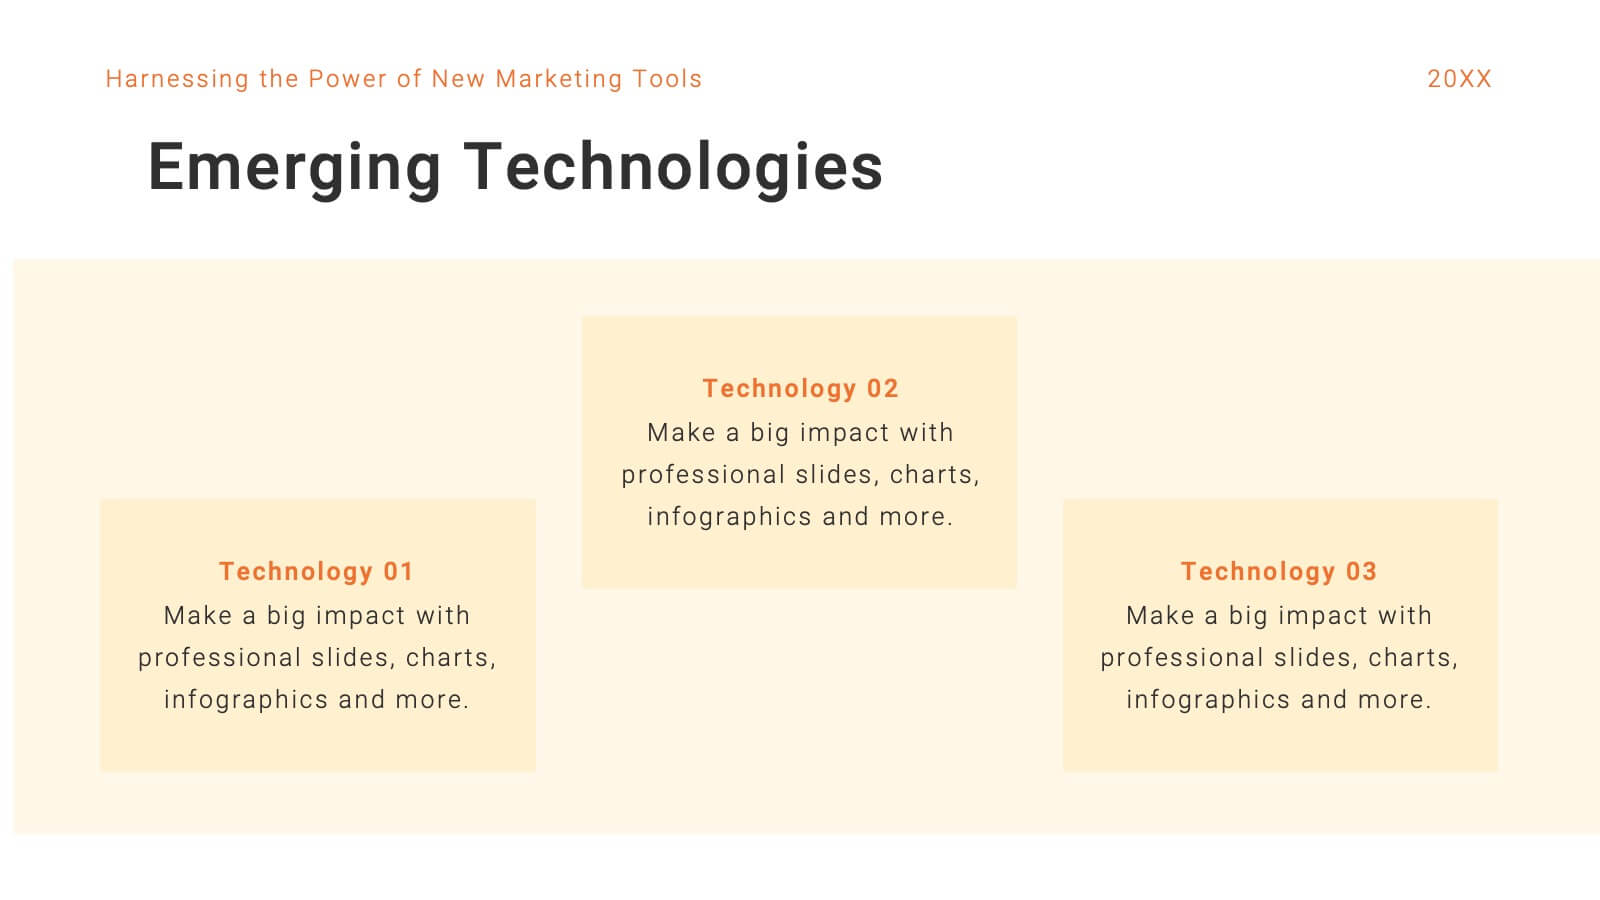
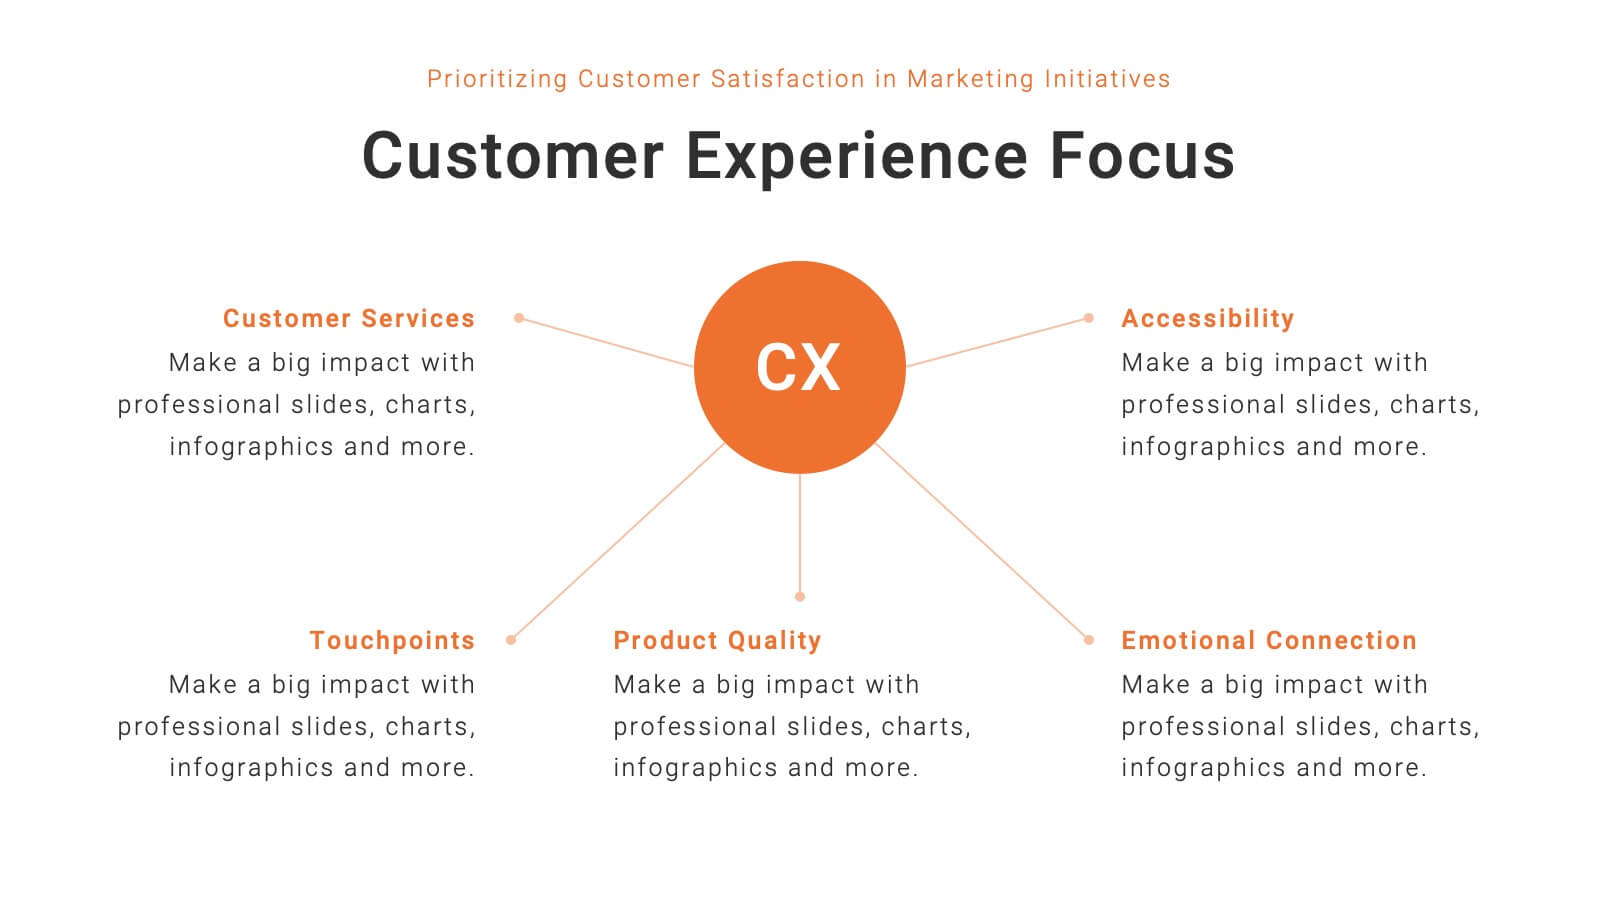
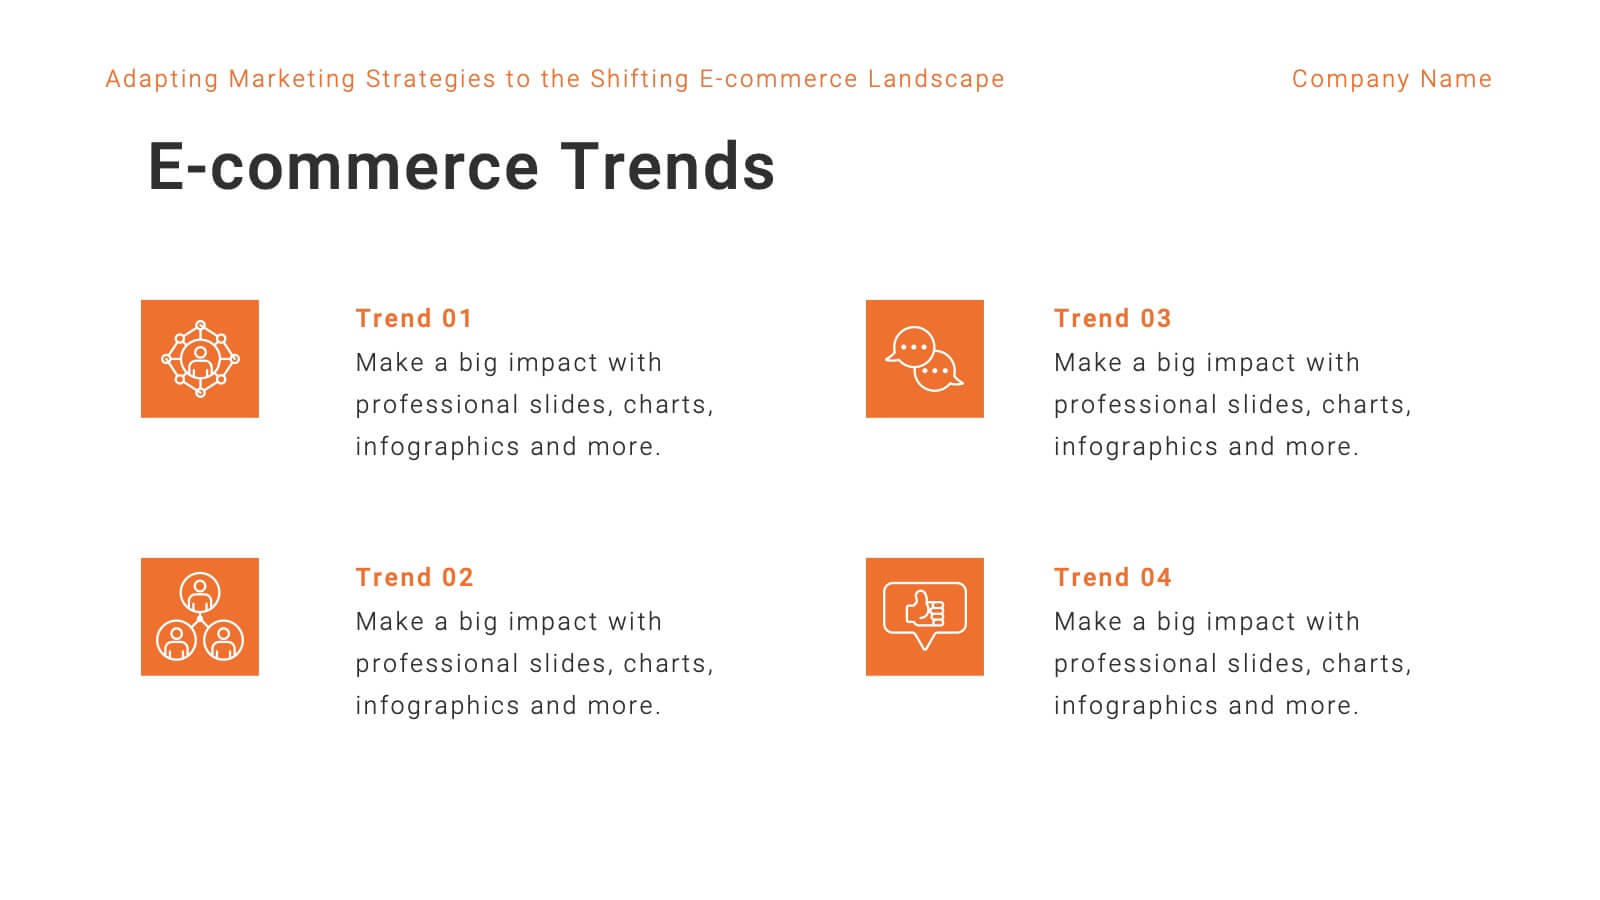
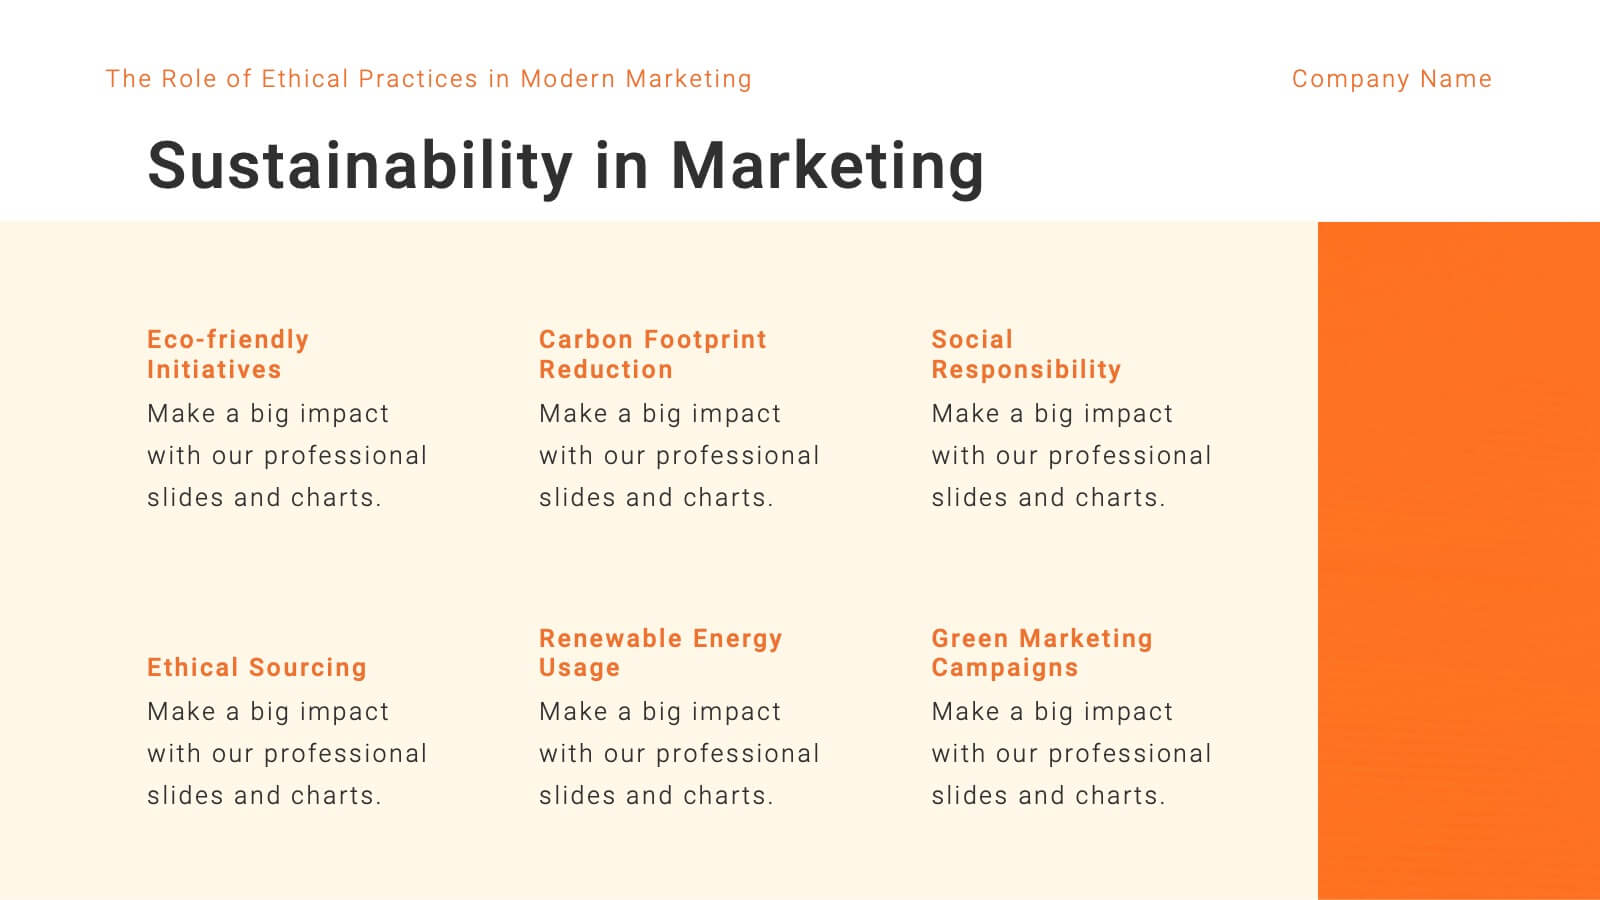
Mercury Marketing Research Report Presentation
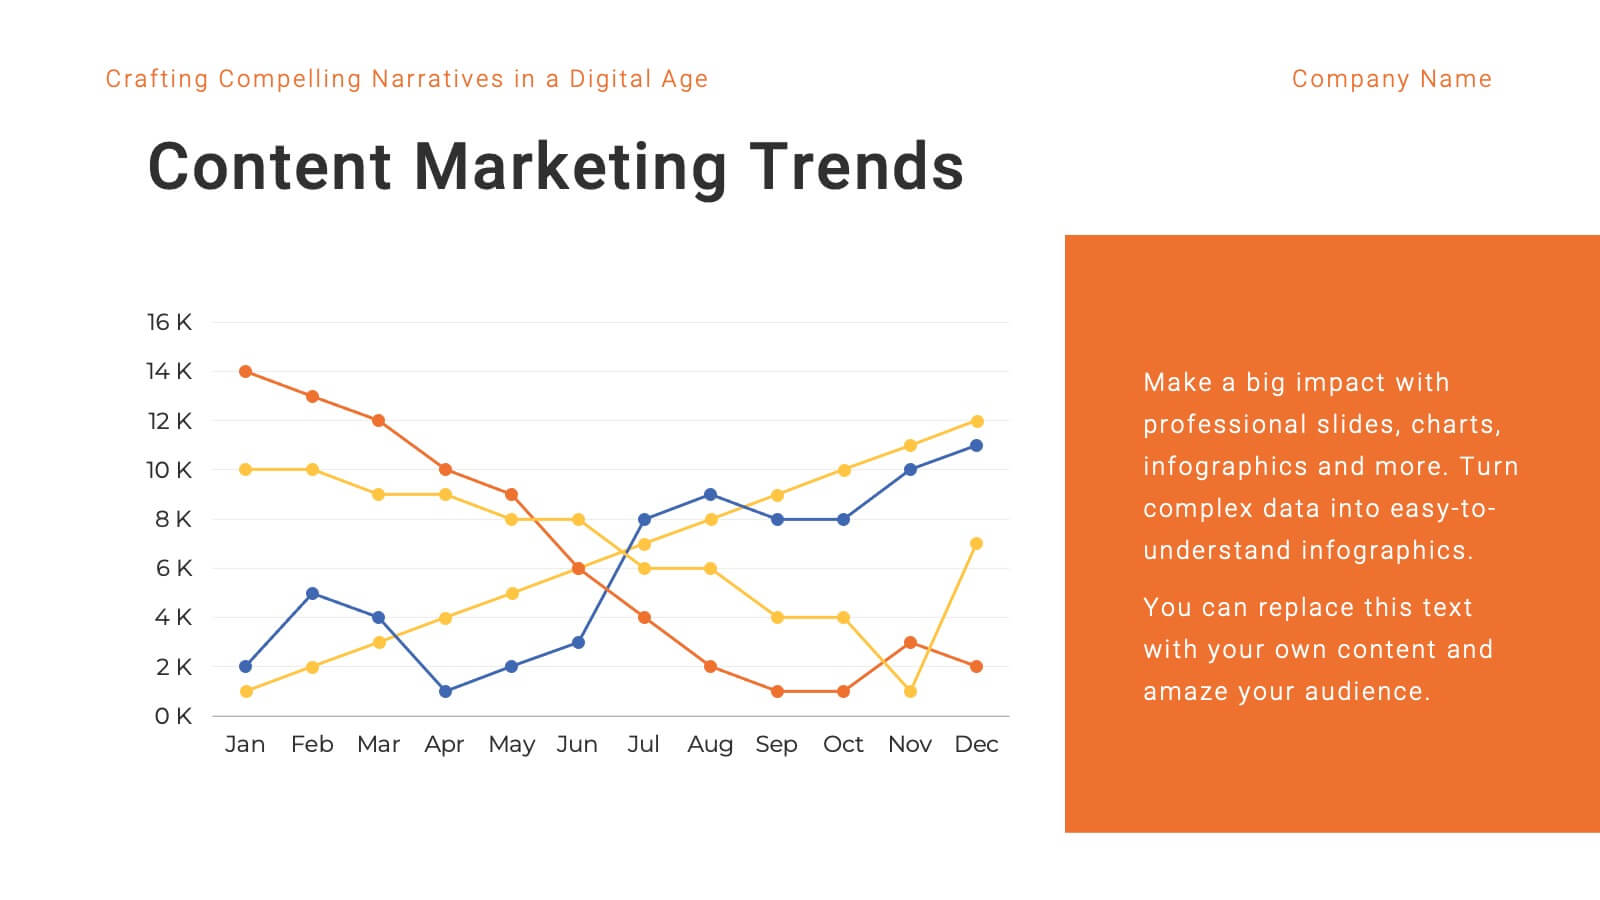
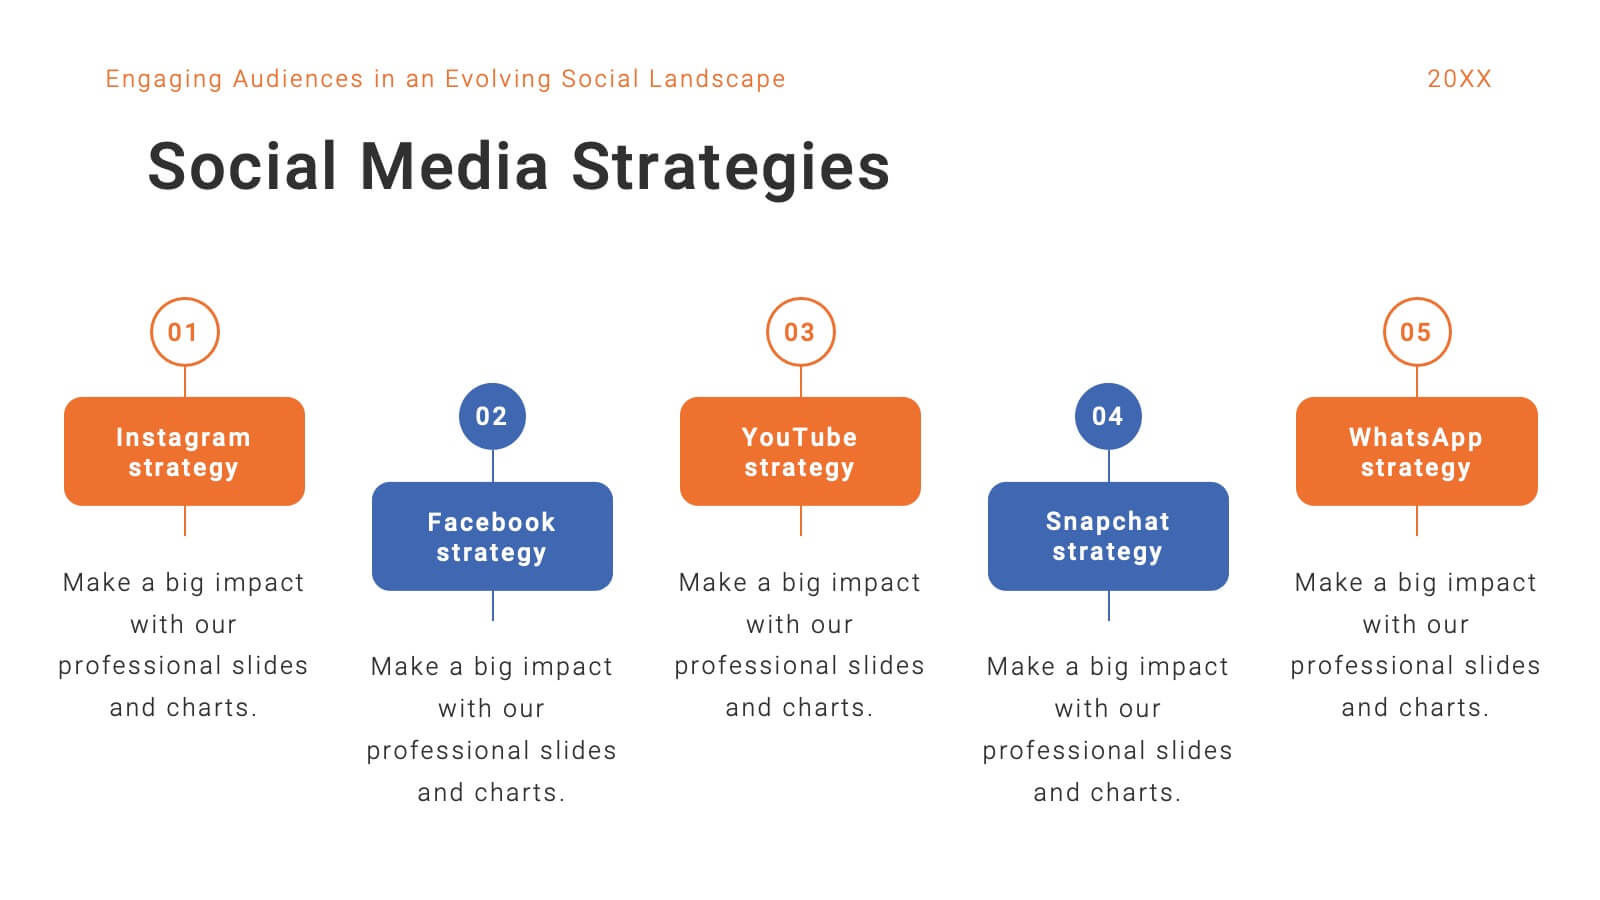
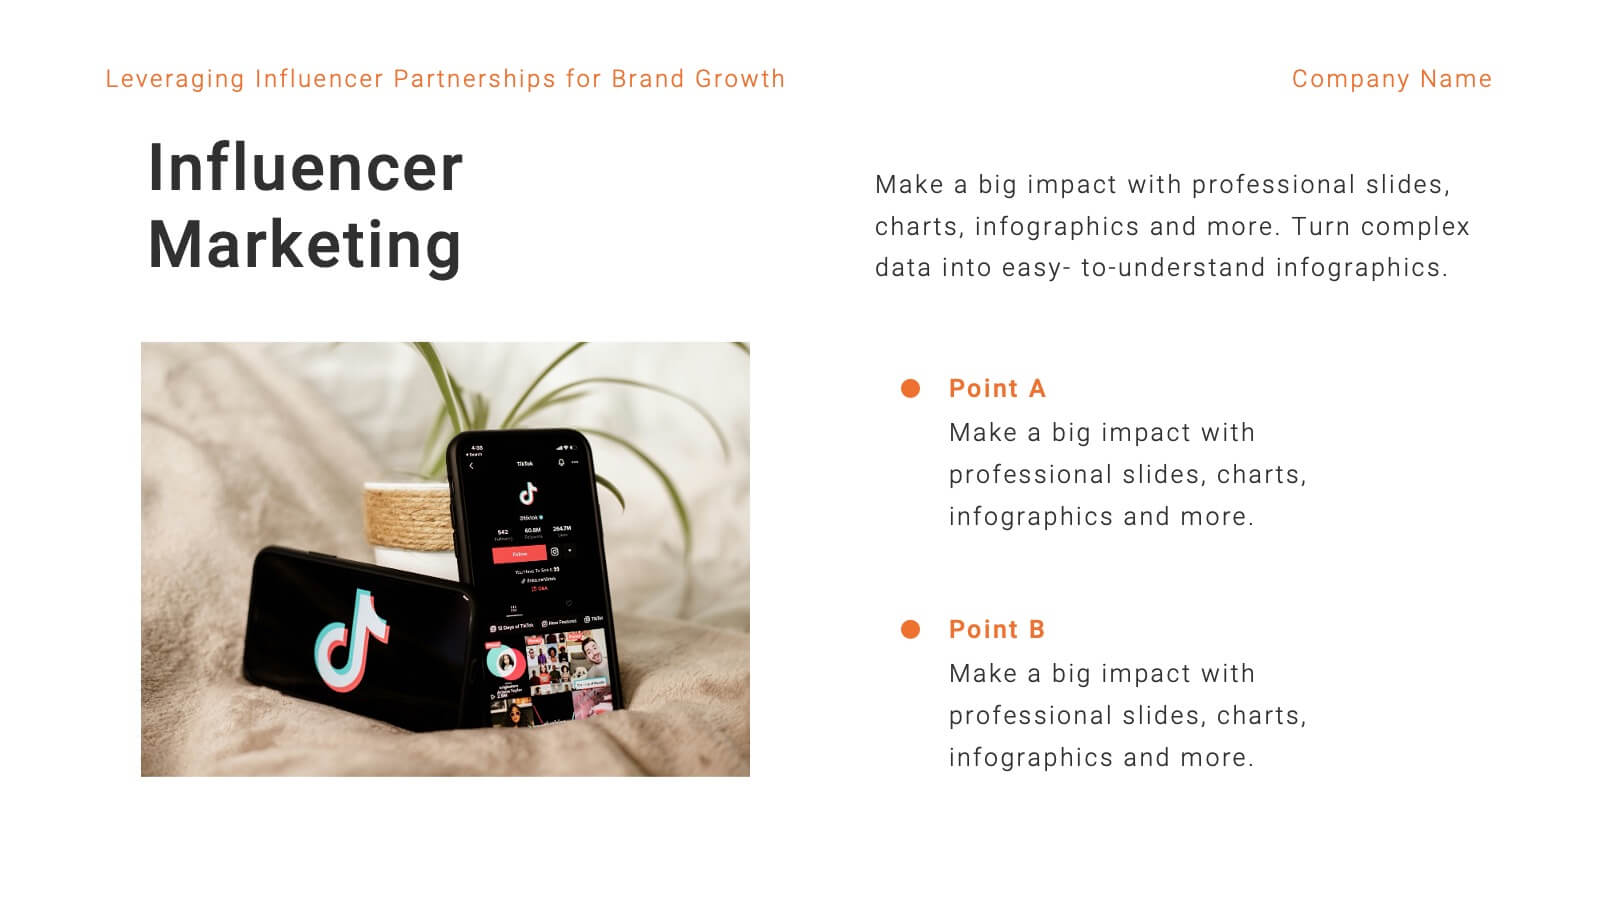
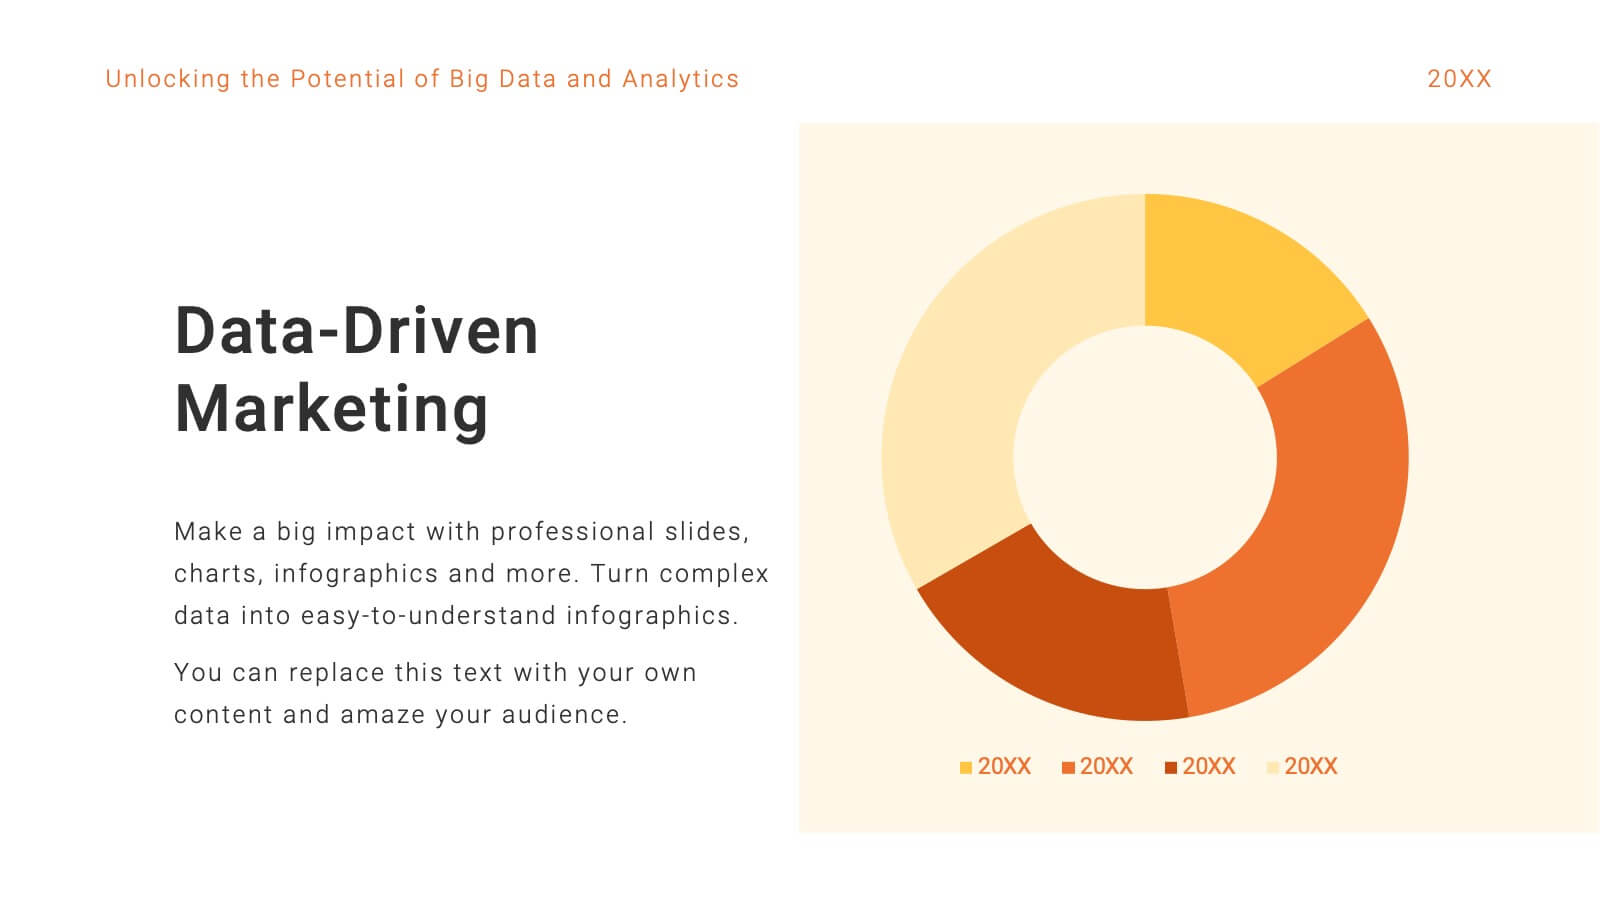
Elevate your marketing strategy with this insightful and data-driven presentation template! Perfect for analyzing trends, consumer behavior, and emerging technologies, this template provides a thorough overview of today’s marketing landscape. From social media strategies to e-commerce trends, it covers all key areas. Fully customizable and compatible with PowerPoint, Keynote, and Google Slides for easy use.


8 slides
Team Time Allocation and Planning Presentation
Stay on top of your team's workload with the Team Time Allocation and Planning presentation slide. This template features a clear, month-by-month Gantt-style layout, helping you visualize team tasks, priorities, and resource distribution across the year. Ideal for project managers, department leads, or operations teams aiming to streamline scheduling and improve collaboration. Fully customizable in PowerPoint, Keynote, and Google Slides.


12 slides
Sales Metrics Dashboard Presentation
Unlock a sharper view of your sales story with a clean, data-driven layout that highlights performance trends at a glance. This presentation organizes KPIs, charts, and progress indicators into an easy-to-follow dashboard that supports smarter decision-making. Fully compatible with PowerPoint, Keynote, and Google Slides.


7 slides
Empathy Map Infographic Presentation Template
An Empathy Map is a collaborative tool organizations can use to gain a deeper insight into their customers. Similar to a user persona, an empathy map can represent a group of users, such as a customer segment. An empathy map helps to map what a design team knows about the potential audience. Use this template to gain a deeper understanding of your target audience. This template comes with many empathy maps you can use to discover how to empathize with your customers. The empathy maps available in this template are designed to give you an avenue into the mind of your target audience.


20 slides
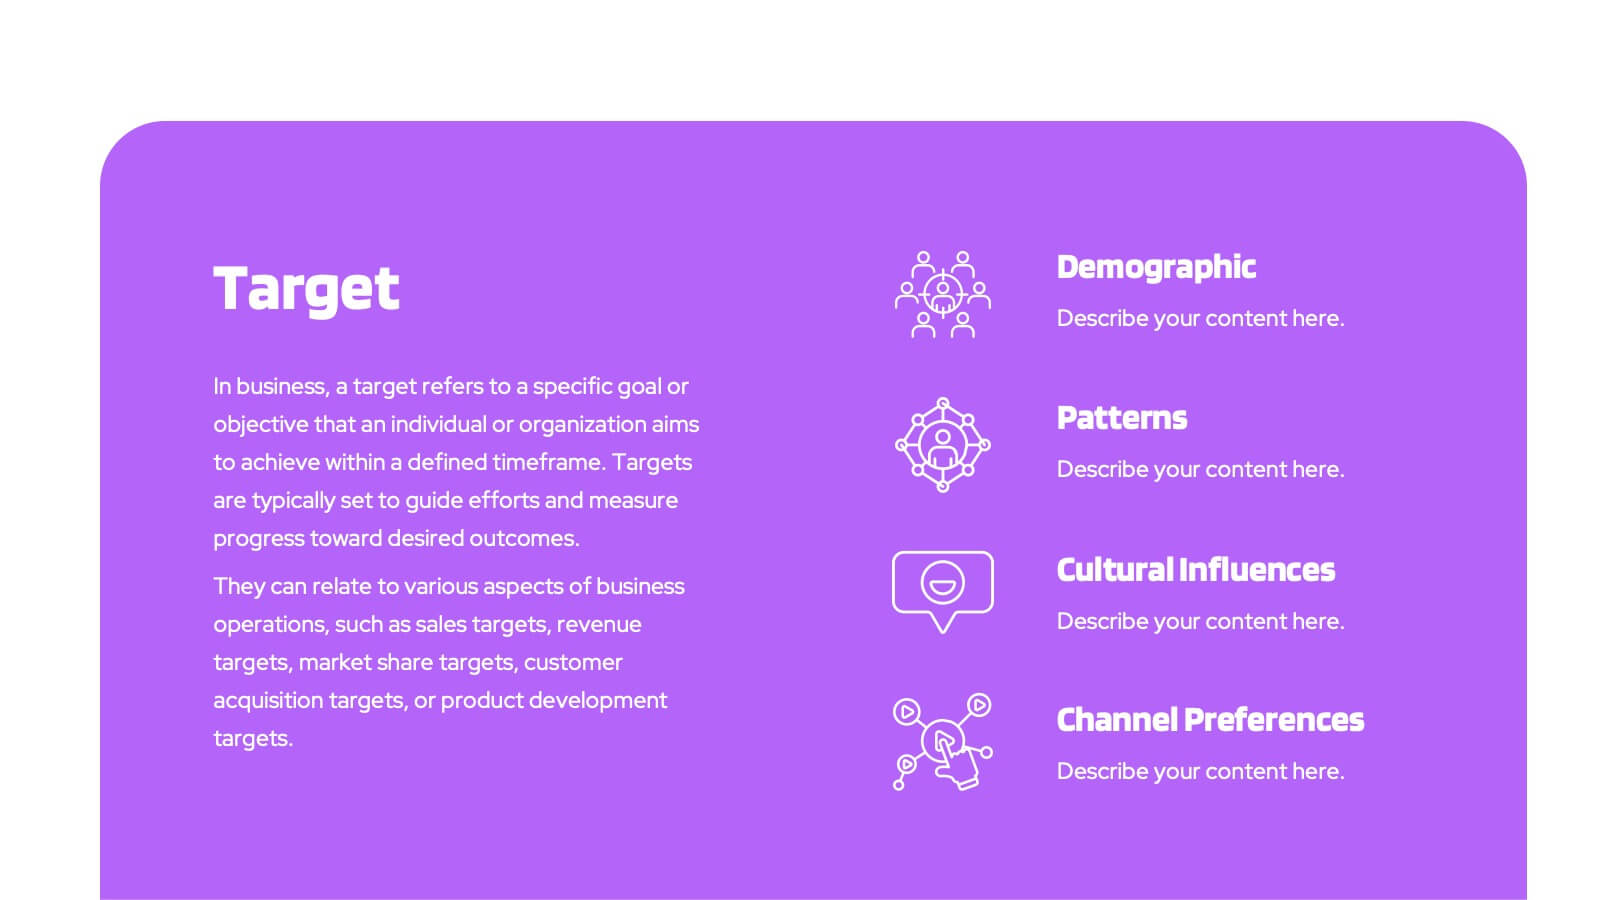
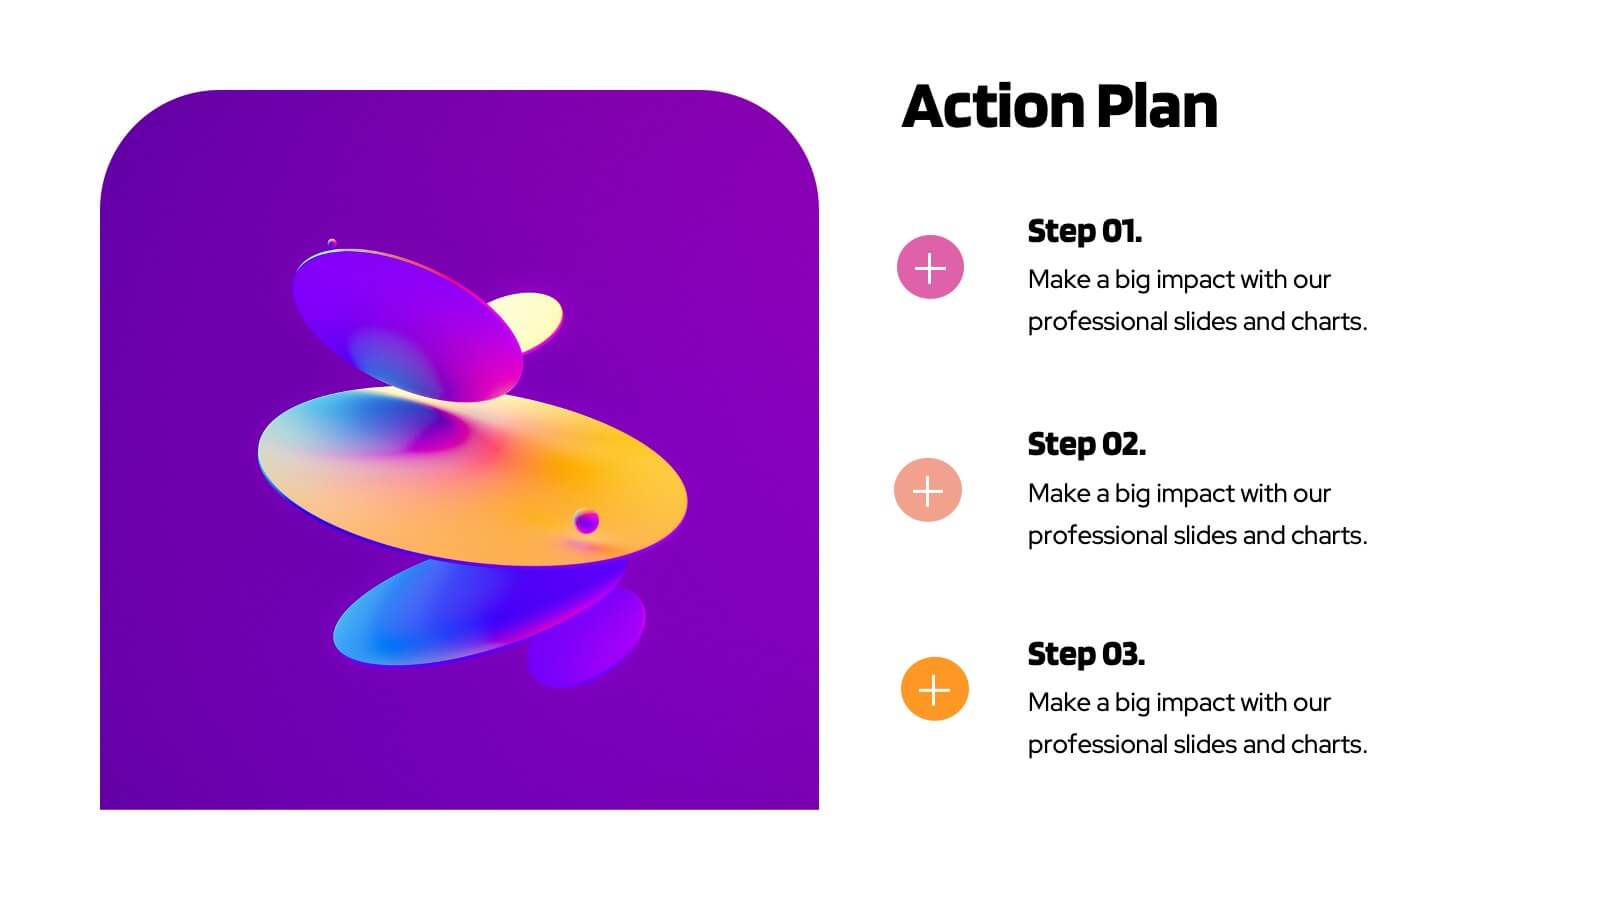
Planetary Sales Performance Report Presentation
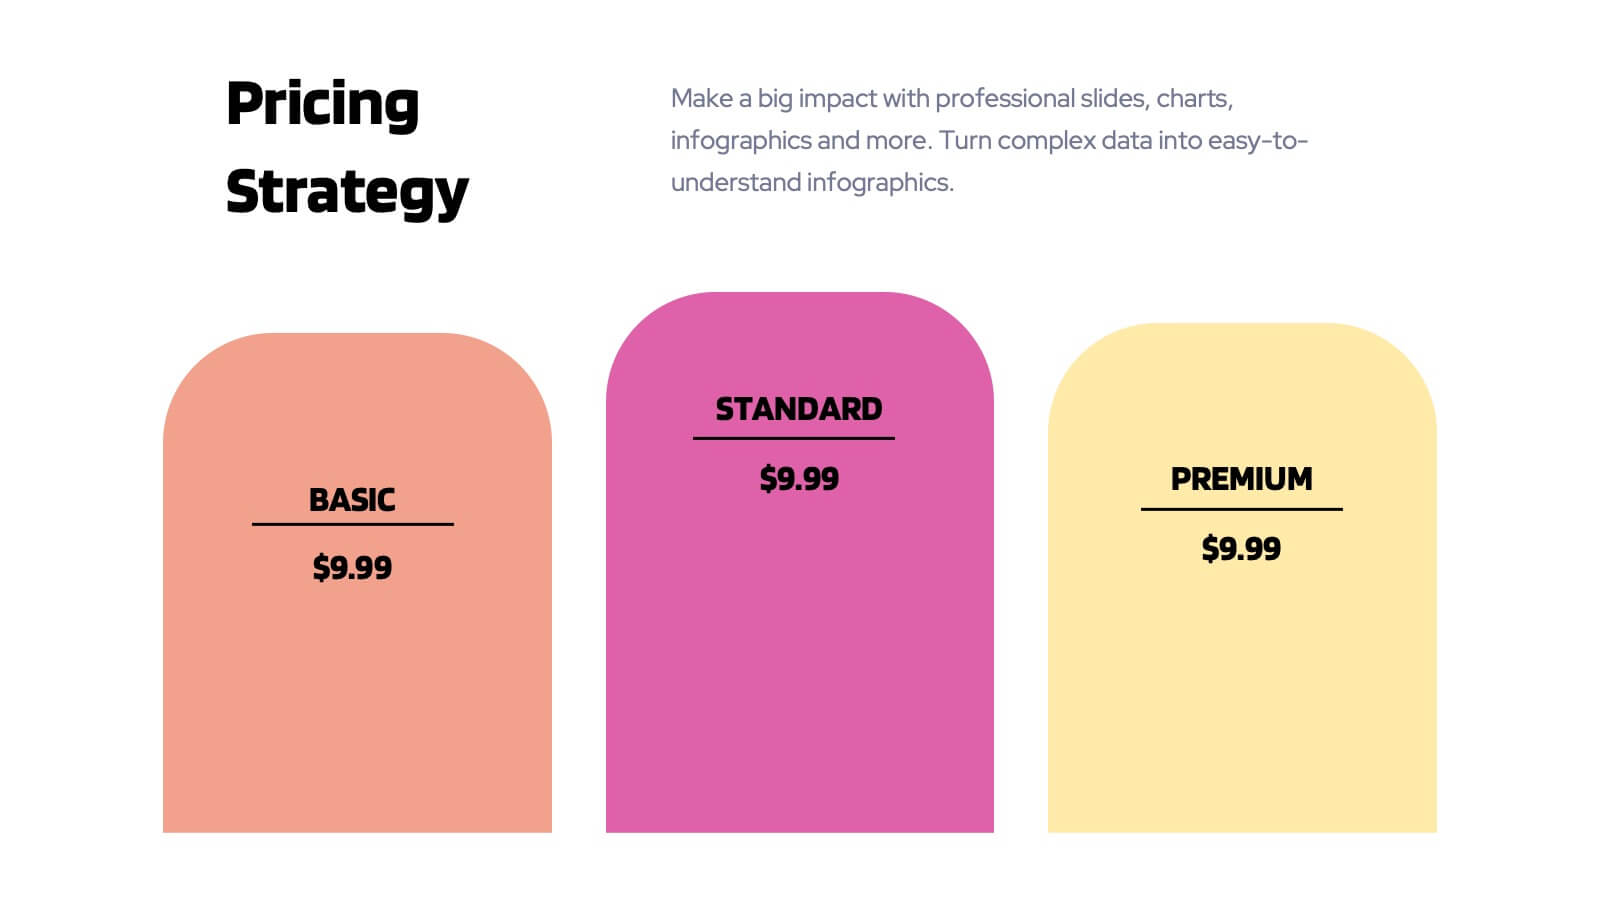
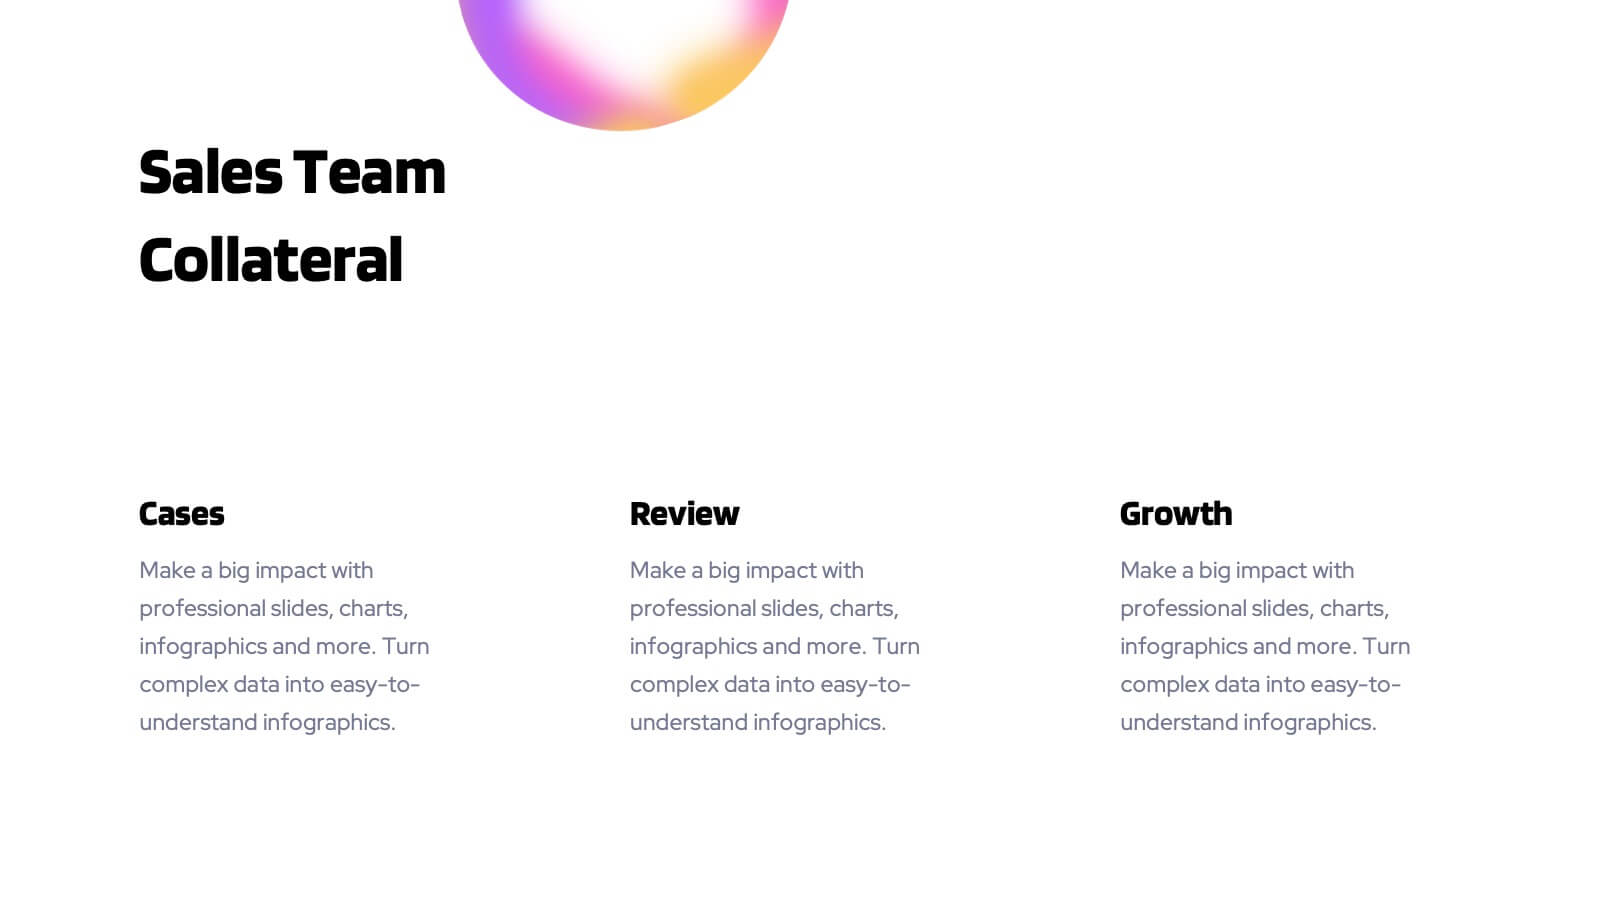
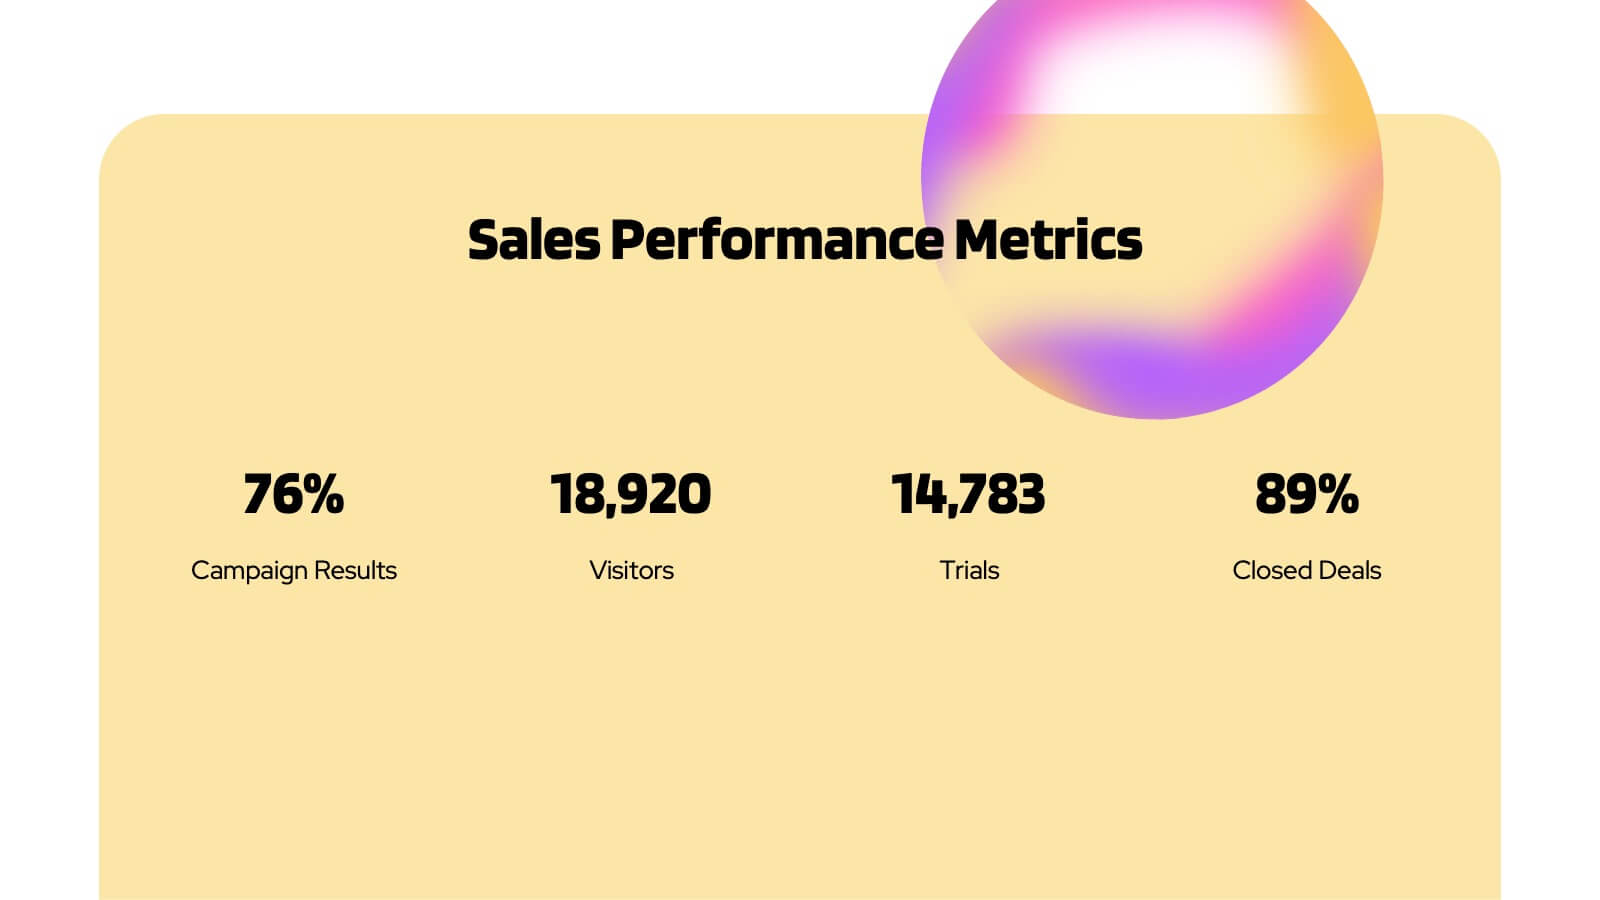
Energize your sales efforts with this vivid sales performance presentation template. It includes sections for company overview, detailed sales metrics, and future goals, perfect for showcasing achievements. Compatible with PowerPoint, Google Slides, and Keynote, it’s designed to inform and motivate sales teams effectively.


5 slides
Home Investment and Property Value Presentation
Visualize key real estate insights with this skyline-themed slide, ideal for showcasing home investment data and market value trends. Designed for realtors, analysts, or housing consultants, it features a cityscape layout for clear comparison. Fully editable in PowerPoint, Keynote, and Google Slides for effortless customization and polished presentations.


26 slides
Jenna Presentation Template
Want to let your customers know how your services can help with their interior design needs? The Jenna template features attractive images of different room designs, color palettes, services, and lighting concepts that this business can help you with. This presentation uses soft pastel colors and a clean design so that potential clients can focus on the importance of your services. With its eye-catching graphics, informative content, and organized structure, this presentation template will engage and inspire your audience as you present your ideas for creating beautiful, functional interior spaces.


6 slides
User Satisfaction Scoring System
Showcase user feedback with this vibrant User Satisfaction Scoring System Presentation. Featuring a semi-circle scale with expressive icons, it's perfect for visualizing survey results or customer experience insights. Fully editable in PowerPoint, Keynote, and Google Slides, this slide helps simplify scoring metrics while keeping your presentation clear, engaging, and professional


5 slides
Root Cause Business Problem Slide
Uncover the foundation of complex challenges with this tree-inspired slide—perfect for visualizing root causes behind business problems. Showcase contributing factors at each root to guide effective solutions. Fully editable in PowerPoint, Keynote, and Google Slides.


5 slides
Enterprise Risk Management Framework Presentation
Visualize your organization’s risk strategy with the Enterprise Risk Management Framework Presentation. This slide outlines four core steps—Set Objective, Identify Risks, Assess Risks, and Risk Response—using a clear, directional design. Perfect for risk assessments, board updates, or audit reviews. Fully editable in PowerPoint, Google Slides, and Canva.


5 slides
Pandemic Prevention and Treatment Options Infographics
Pandemic Prevention is the proactive measures taken to reduce the risk of the spread and impact of infectious diseases on a global scale. These infographic templates are designed to communicate the essential information about pandemic prevention and treatment options. It provides a visually appealing and easy-to-understand overview of key concepts, preventive measures, and treatment options. Use this template to educate and empower your audience with the knowledge needed to navigate pandemics effectively and contribute to public health and safety. This template is perfect for healthcare professionals, educators, and organizations looking to share valuable information.