


Features
- 6 Unique slides
- Fully editable and easy to edit in Microsoft Powerpoint, Keynote and Google Slides
- 16:9 widescreen layout
- Clean and professional designs
- Export to JPG, PDF or send by email


Do you have any questions?
Recommend


21 slides
Eidolon Digital Strategy Presentation
Craft a forward-thinking presentation with a dynamic template designed for digital strategies. Highlight key components such as current landscape analysis, market trends, and competitive insights to provide a comprehensive overview of your strategic vision. Use the SWOT analysis and key challenges slides to identify opportunities and areas of growth. Showcase your value proposition and strategic initiatives, backed by detailed plans for resource allocation, risk management, and implementation timelines. The template also includes sections for performance metrics, communication strategies, and team roles and responsibilities, ensuring every detail is covered. With its sleek and professional design, this template is fully editable and compatible with PowerPoint, Google Slides, and Keynote, making it an ideal choice for businesses, consultants, or agencies aiming to communicate their digital strategies with precision and impact.


8 slides
Africa Market Potential and Improvement Map Presentation
Visualize market opportunities across Africa with this insightful map template. Featuring percentage-based growth indicators and color-coded country highlights, it’s perfect for showcasing regional potential, trends, and business expansion strategies. Fully customizable in PowerPoint, Keynote, and Google Slides, this template supports clear, data-driven storytelling for marketing, economic, or strategic presentations.


2 slides
Eye-Catching Title Cover Slide Presentation
Capture attention instantly with this bold, modern title cover slide. Featuring vibrant colors, oversized geometric shapes, and strong typography, this layout is ideal for setting the tone in creative, marketing, or business presentations. The design is fully editable and compatible with PowerPoint, Keynote, and Google Slides—making it easy to tailor to your brand and message.
21 slides
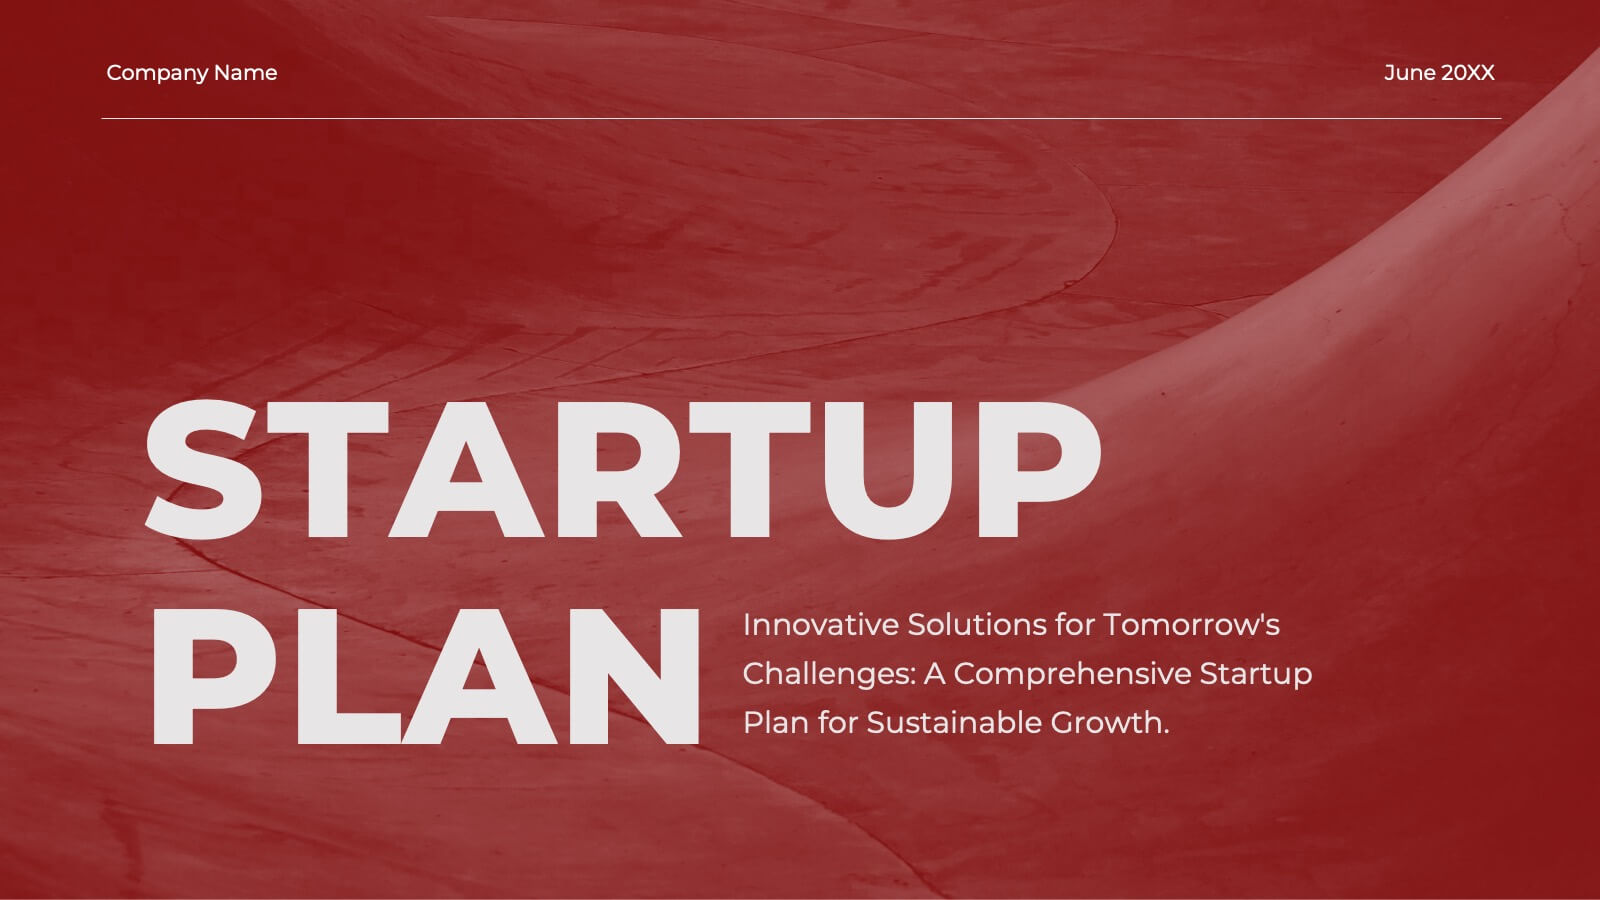
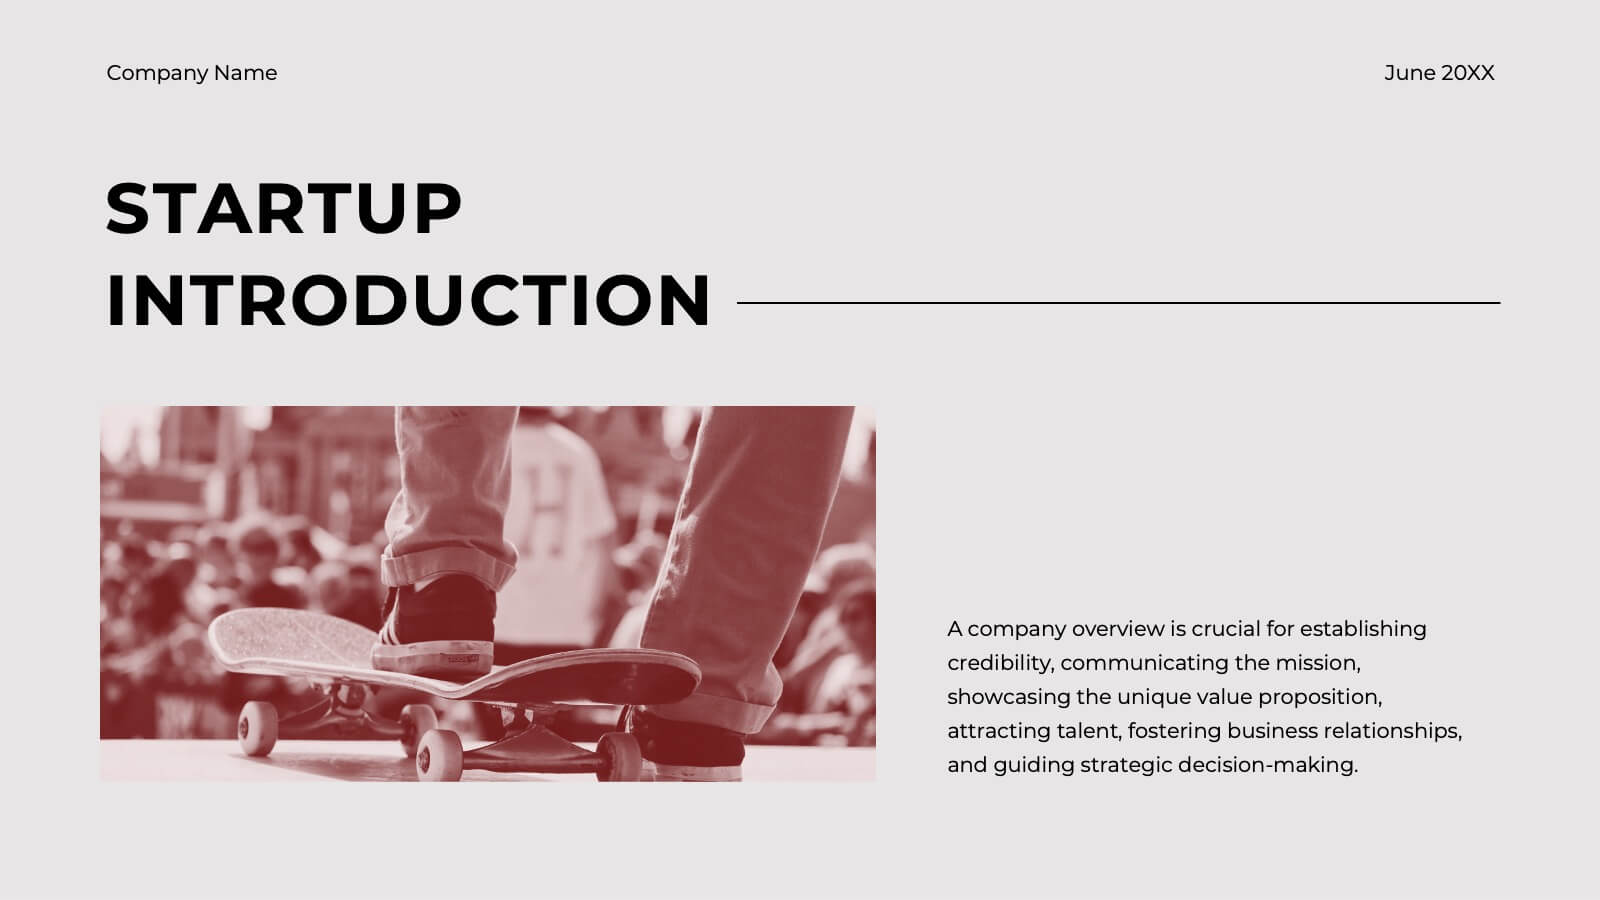
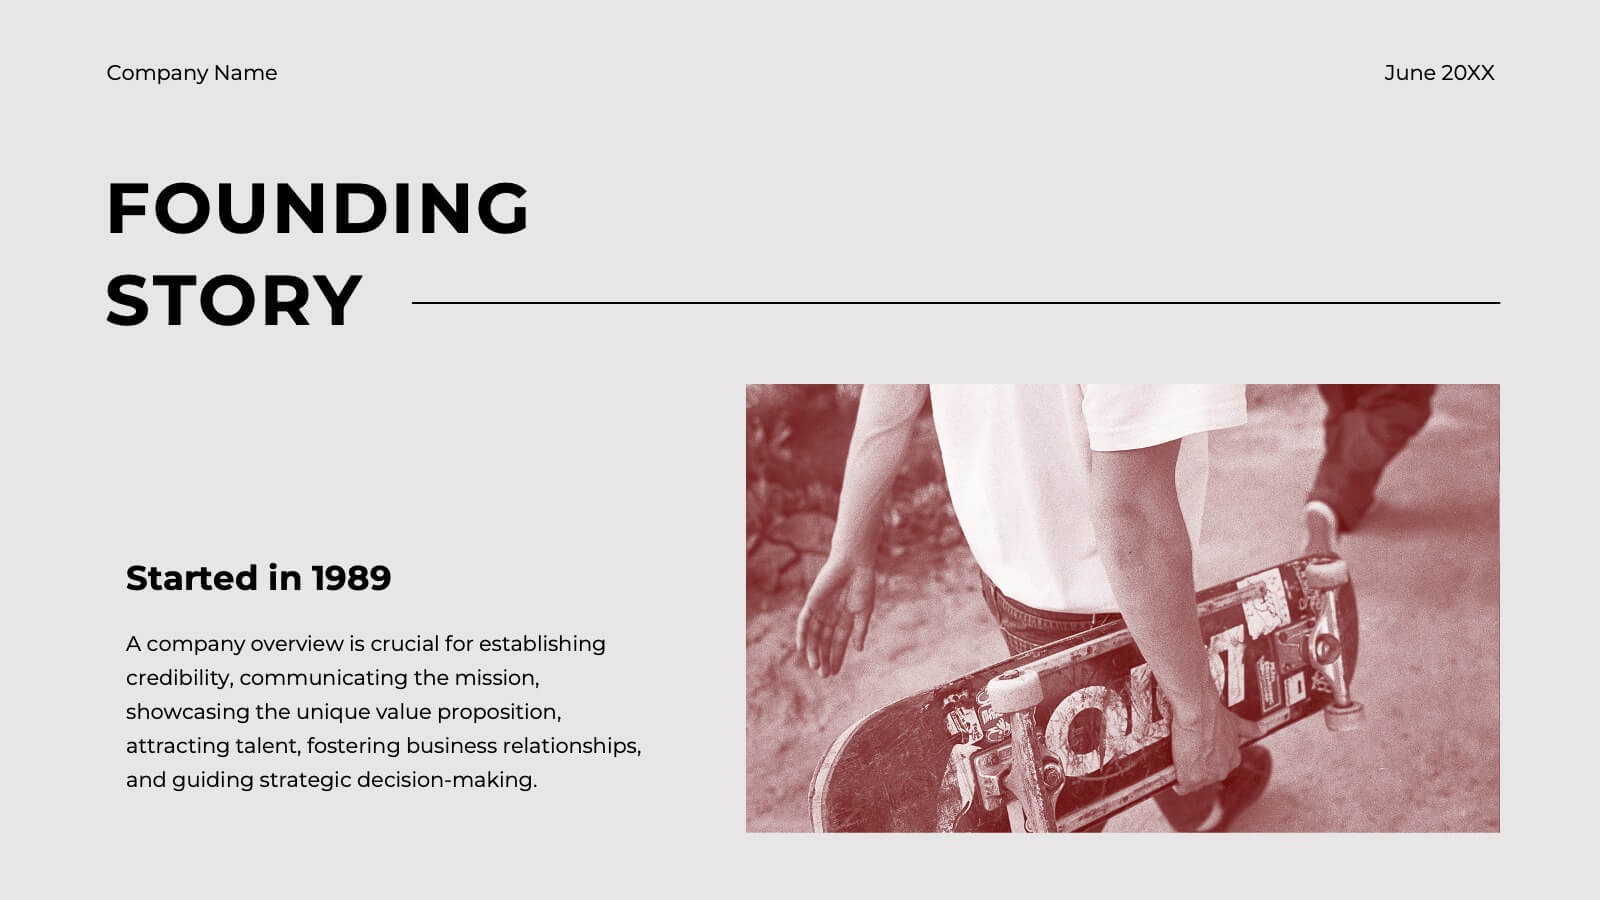
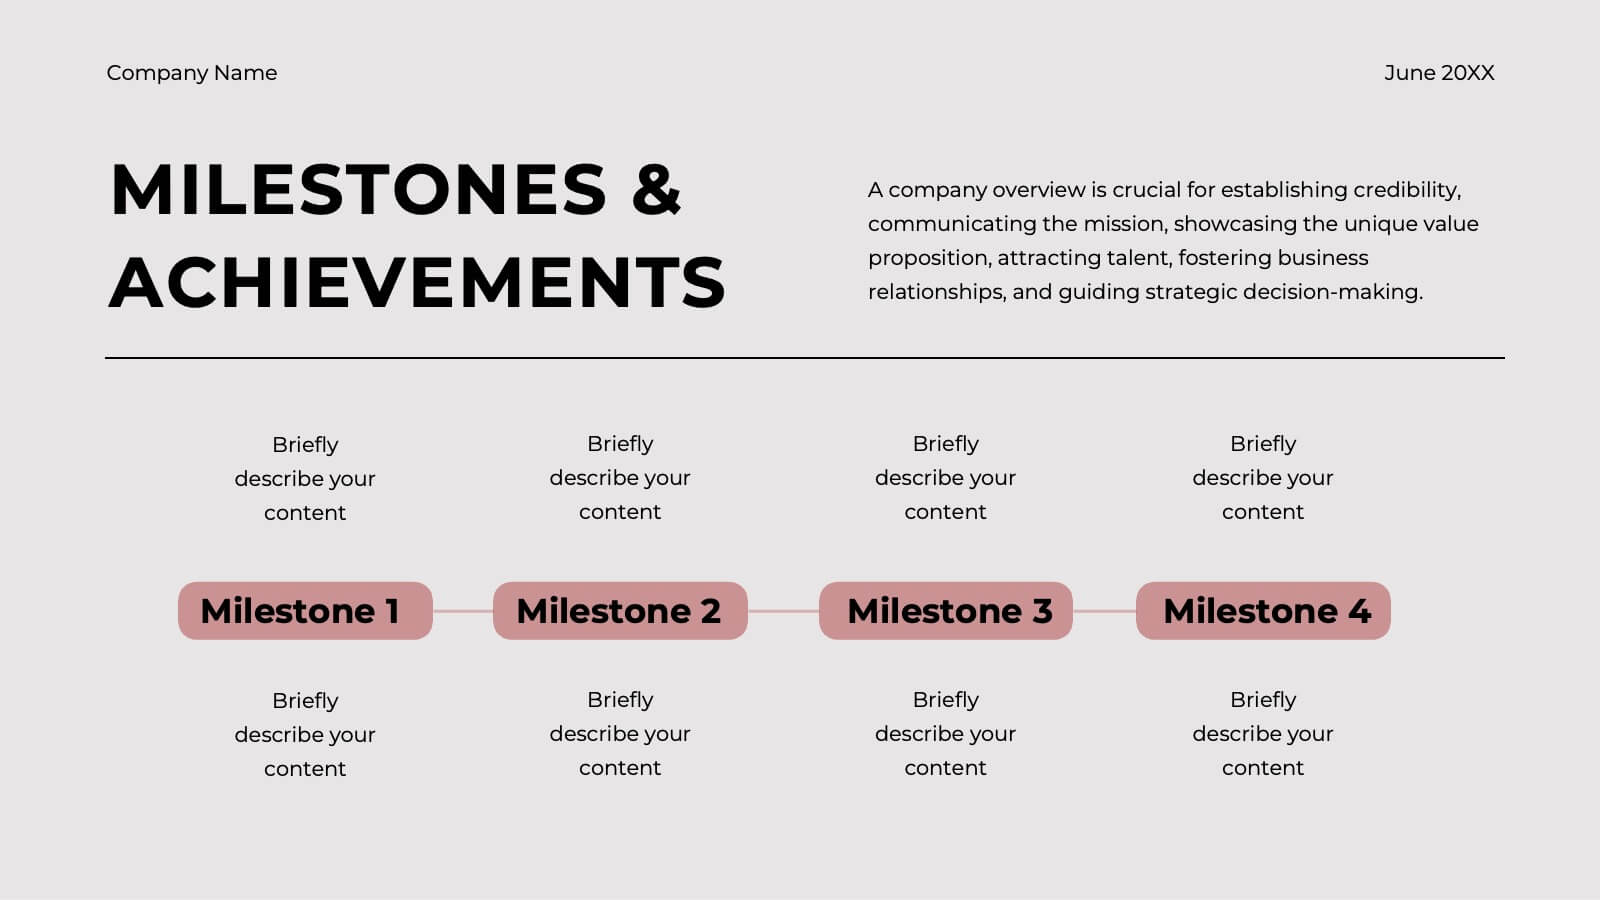
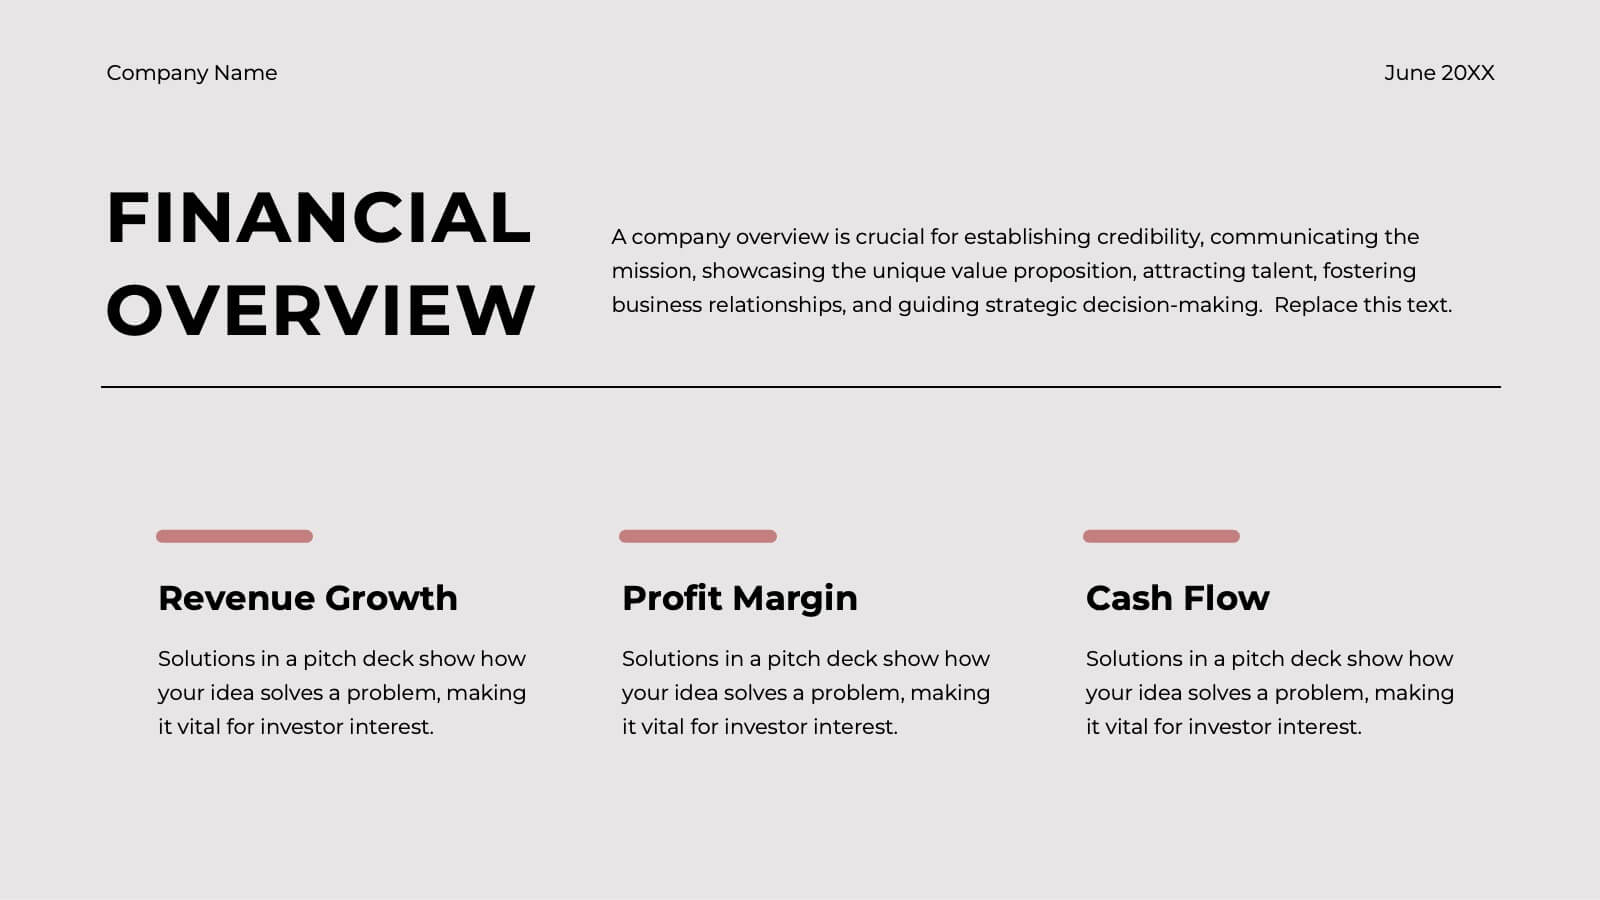
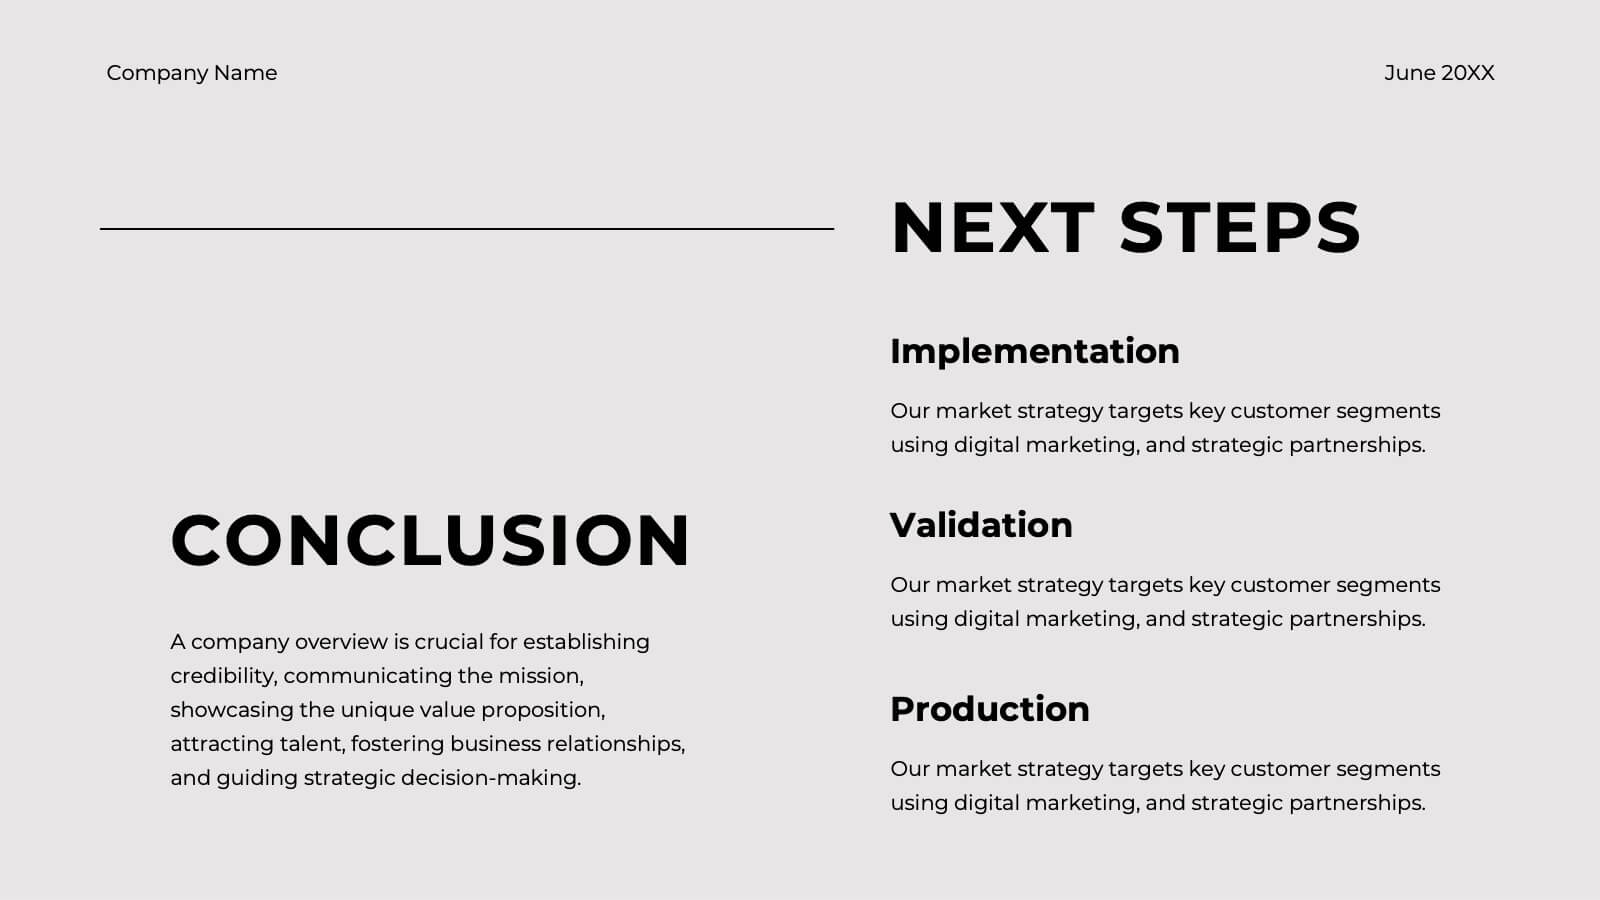
Ember Startup Growth Plan Presentation
Launch your entrepreneurial journey with this dynamic startup plan template! Perfect for detailing your mission, market strategy, and unique value proposition, it features professional slides for customer analysis, business models, and financial projections. Present your innovative ideas clearly and convincingly. Compatible with PowerPoint, Keynote, and Google Slides for seamless presentations on any platform.


3 slides
Clean Water Initiative Overview Presentation
Communicate sustainability goals with this clean, modern layout featuring water droplet and faucet visuals. Ideal for summarizing three core focus areas of your environmental or nonprofit program. The minimalist design keeps attention on your key points. Fully editable and compatible with PowerPoint, Keynote, and Google Slides for easy customization.


8 slides
Project Goals and Deliverables
Visualize your project milestones with this dynamic layout, designed to clearly differentiate between goals and deliverables. Use color-coded hexagons and numbered segments to communicate each stage with clarity and impact. Fully editable in PowerPoint, Keynote, and Google Slides.


5 slides
Meal Plan and Nutrition Guide Presentation
Simplify your nutrition strategy with the Meal Plan and Nutrition Guide Presentation. This visually engaging circular layout lets you outline five key nutrition pillars or daily meals with icons and editable titles. Ideal for dietitians, wellness coaches, or health brands. Compatible with PowerPoint, Canva, and Google Slides for seamless customization.


8 slides
Target Demographic Insights
Get a clear view of your audience with the Target Demographic Insights Presentation. This template uses a visual bullseye layout to highlight key demographic data through concentric circles and percentages. Ideal for marketers, brand strategists, or analysts, it helps you communicate audience segmentation and market reach effectively. Fully editable in PowerPoint, Keynote, and Google Slides.


5 slides
RACI Matrix Responsibility Breakdown Presentation
Visualize roles and responsibilities with this RACI Matrix slide. Clearly assign who is Responsible, Accountable, Consulted, or Informed across key tasks. Ideal for project planning and team alignment, this editable layout helps avoid confusion and ensures accountability. Perfect for PowerPoint, Keynote, or Google Slides in any business context.


21 slides
Duskflare Corporate Strategy Proposal Presentation
Present your corporate strategy effectively with this comprehensive template, featuring sections on market trends, SWOT analysis, strategic initiatives, and risk management. Designed for clarity and impact, it’s ideal for outlining high-level goals and action plans. Compatible with PowerPoint, Keynote, and Google Slides for seamless presentations.


6 slides
Customer Support Team Infographic
The set of slides presented is meticulously designed to encapsulate the essence of customer support team operations, highlighting various key aspects such as teamwork, communication channels, customer interaction points, and support strategies. Each slide utilizes a clean and professional design, integrating soft color palettes and structured layouts to clearly convey complex information in an accessible way. These slides are particularly useful for customer support teams looking to present or revamp their strategy, showcasing how they handle customer queries and feedback across different platforms. The visual elements such as graphs, hierarchical diagrams, and process flows are strategically used to illustrate the team’s structure, response processes, and efficiency metrics, making it easier for stakeholders to grasp the effectiveness of customer support initiatives. Such a collection is indispensable for training new team members, demonstrating the team's impact on customer satisfaction, and internal reviews to improve service delivery. By using these slides, teams can ensure a consistent understanding of goals, roles, and procedures, which is crucial for maintaining high standards of customer service and team alignment.
4 slides
Directional Arrow Diagram Slide Presentation
Make your message stand out with a bold visual that points your audience in the right direction. This presentation uses clear directional arrows to highlight steps, options, or key decisions in a way that’s easy to follow and visually compelling. Fully editable and compatible with PowerPoint, Keynote, and Google Slides.


7 slides
Watercolor Strategy Infographic
Dive into a cascade of strategic insights with our watercolor strategy infographic. Presented on a crisp white canvas, the splash of yellow, green, and blue emanates a fluidity that mirrors the dynamic nature of business strategies. Each hue merges seamlessly to provide a visual treat while retaining the core informational value. Tailored for Powerpoint, Keynote, and Google Slides, this template is embellished with customizable graphics, intricate icons, and flexible image placeholders, making it an ideal choice for any strategic visualization. Let your strategy flow, vivid and vibrant, just like watercolors on paper.


6 slides
Strategic Business Case Study
Present detailed business case analyses with this layered castle-style layout, ideal for step-by-step storytelling. Each section visually represents a different stage or insight, helping you build a clear and convincing narrative. Fully editable and compatible with PowerPoint, Keynote, and Google Slides.


6 slides
SMART Goals Breakdown Presentation
Bring clarity and momentum to your planning with this clean, easy-to-follow slide that breaks down each step of the SMART framework. It helps audiences understand how goals become actionable through structure and measurement. Perfect for training, strategy, or coaching sessions. Fully compatible with PowerPoint, Keynote, and Google Slides.


5 slides
Creative Alphabet Infographic Presentation
Make learning and presentations more engaging with this Creative Alphabet Infographic Presentation template. Featuring bold, letter-based visual elements resembling pencils, this slide is perfect for educational content, branding, or step-by-step processes. Fully editable and compatible with PowerPoint, Keynote, and Google Slides.


5 slides
Business Vision Statement Presentation
Focus on the future with our "Business Vision Statement" presentation template, ideal for outlining your company's aspirations. This visually engaging template helps you present your business's core values and long-term goals, ensuring alignment across the organization. Perfect for strategic meetings and stakeholder presentations, it is compatible with PowerPoint, Keynote, and Google Slides. This template is a crucial tool for leaders looking to inspire and direct their teams towards common objectives.