


Features
- 4 Unique slides
- Fully editable and easy to edit in Microsoft Powerpoint, Keynote and Google Slides
- 16:9 widescreen layout
- Clean and professional designs
- Export to JPG, PDF or send by email


Do you have any questions?
Recommend


5 slides
Contracts and Law Capacity Infographics
In the context of contracts and law, "capacity" refers to a person's legal ability to enter into a contract and be bound by its terms. These colorful infographics are designed to simplify the complex concepts of contracts and law capacity for the audience. This infographic template aims to provide essential information about the legal aspects of contracts and the concept of capacity in a visually appealing manner. This section provides a clear definition of contracts and highlights the essential elements. The template incorporates engaging infographics, icons, and illustrations to visualize key concepts and make the information more memorable.


5 slides
Customer Retention and Loyalty Marketing Presentation
Showcase your loyalty strategies in a visually compelling way with this modern shopping cart-themed slide. Ideal for outlining customer retention initiatives, this template highlights five key tactics or rewards using numbered icons and clean layout sections. Great for marketers, retail teams, and business consultants. Fully editable in PowerPoint, Keynote, and Google Slides.


10 slides
Chronological Event Timeline Presentation
Present events with clarity using this linear timeline slide. Ideal for showcasing project milestones, historical developments, or sequential achievements. Features 5 editable points with icons, titles, and dates for easy customization. Compatible with PowerPoint, Keynote, and Google Slides—perfect for planners, managers, educators, and strategists needing organized time-based visuals.


5 slides
Revenue Streams & Expense Management Layout Presentation
Visualize your income and costs with the Revenue Streams & Expense Management Layout Presentation. This slide layout uses a vertical arrow chart to display four data categories, ideal for comparing sources of income and related expenditures. Great for financial reports, budgeting reviews, and strategy discussions. Compatible with Canva, PowerPoint, Google Slides, and Keynote.


26 slides
Kohen Presentation Template
Kohen is a minimal coffee shop template that features slide designs you can use together, making it perfect for sharing your business and services. It is easy to use, resulting in convenient high quality presentations. This template design can be used to create more elaborate presentations about food and restaurants. It is complete with charts, images, and text boxes for endless presentation possibilities. This template will help make your message more compelling and informative. The presentation includes a variety of tools and resources, to highlight key points and ideas with minimal text.


6 slides
Cognitive Psychology Infographics
Delve into the fascinating realm of Cognitive Psychology with our customizable infographic template. This template is fully compatible with popular presentation software like PowerPoint, Keynote, and Google Slides, allowing you to easily tailor it to convey essential concepts and insights within the field of Cognitive Psychology. The Cognitive Psychology infographic template serves as a visually engaging platform for summarizing key principles, theories, and research findings. Whether you're a psychology student, educator, or simply intrigued by the workings of the human mind, this template provides a user-friendly canvas to create informative presentations and educational materials. Enhance your understanding of Cognitive Psychology with this SEO-optimized infographic template, designed for clarity and ease of use. Customize it to showcase cognitive processes, influential experiments, and practical applications, making complex concepts more accessible to your audience. Start crafting your personalized infographic today to explore the depths of Cognitive Psychology.


6 slides
Simple Horizontal Timeline Design Presentation
Bring your story to life with a smooth, step-by-step visual that guides viewers through key events with clarity and ease. This presentation helps you outline timelines, processes, or project stages in a clean horizontal flow that’s simple to follow and easy to customize. Fully compatible with PowerPoint, Keynote, and Google Slides.


21 slides
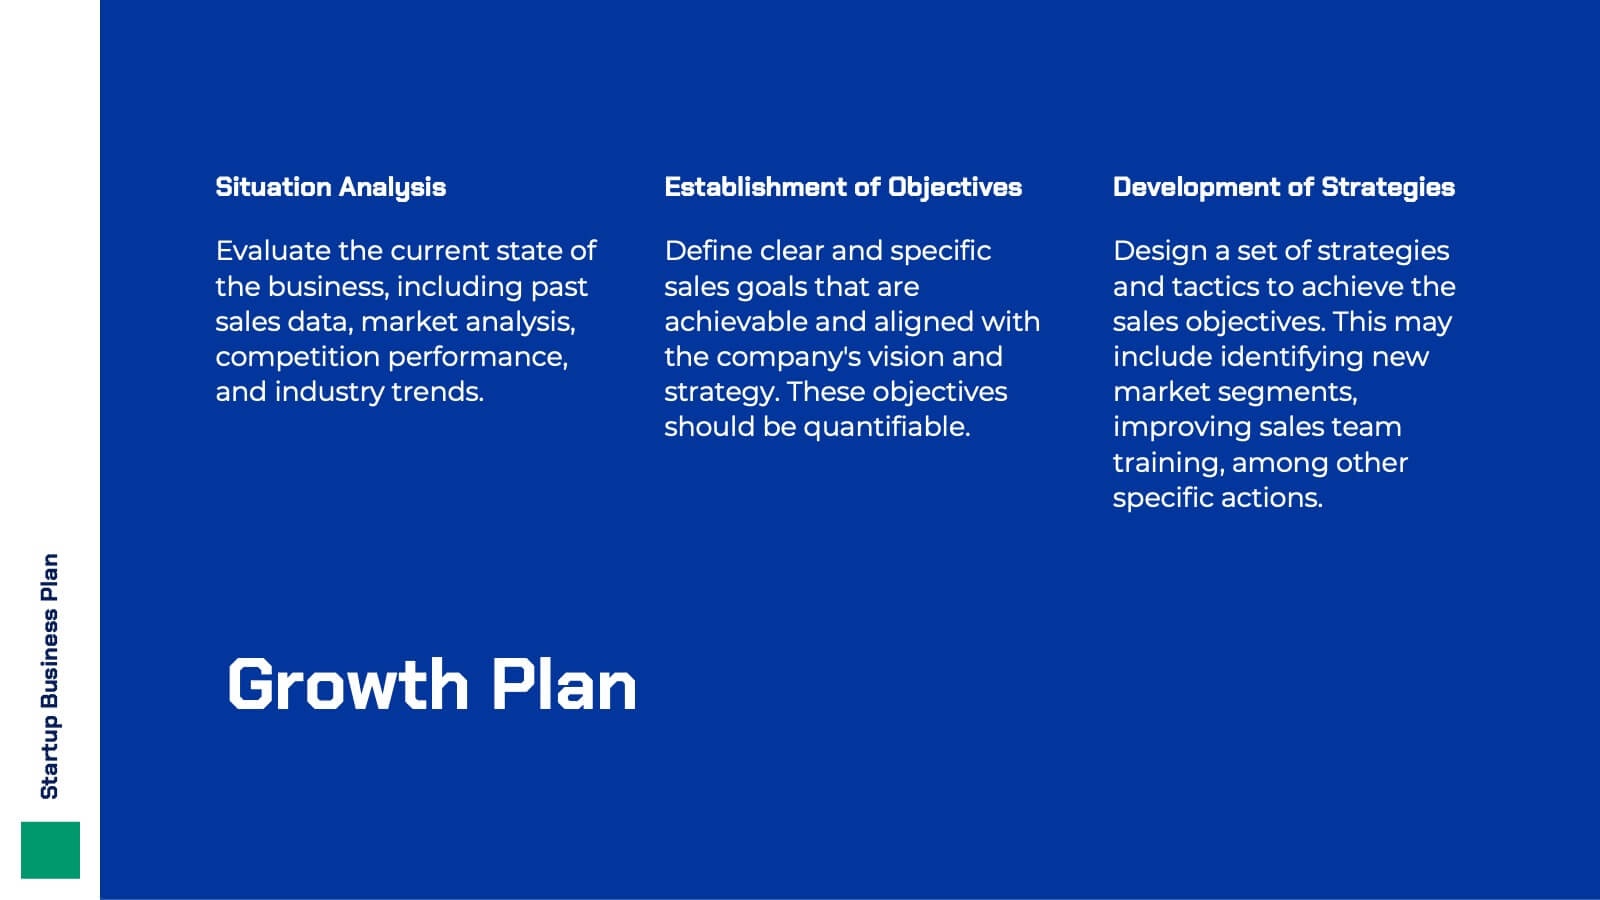
Hyperluma Startup Business Plan Presentation
Launch your vision with this startup business plan template, crafted to communicate your mission, market potential, and growth strategy with clarity and impact. Covering customer needs, unique value propositions, and financial projections, it’s ideal for entrepreneurs and founders. This template is compatible with PowerPoint, Keynote, and Google Slides, ready to fuel your startup’s journey.


5 slides
Creative Brainstorming Presentation
Enhance your brainstorming sessions with this Creative Brainstorming template. Designed with a modern head outline and idea mapping structure, it visually organizes key insights for innovative discussions. Fully customizable with editable text, colors, and icons to fit your needs. Compatible with PowerPoint, Keynote, and Google Slides for seamless integration.


10 slides
SWOT-Based Competitive Analysis Presentation
Identify your competitive edge with a clear, structured approach! This SWOT-based analysis template helps businesses assess strengths, weaknesses, opportunities, and threats in a visually engaging format. Perfect for strategic planning, it ensures clarity and impact in every presentation. Fully customizable and compatible with PowerPoint, Keynote, and Google Slides.


6 slides
Business Milestone Roadmap
Visualize key achievements and future goals with this dynamic Business Milestone Roadmap. Perfect for project planning, annual reviews, or startup timelines, this layout walks through five key years or phases with clear markers and icons. Fully editable in PowerPoint, Keynote, and Google Slides.


4 slides
Products Comparison Table Presentation
Make your decision-making story instantly clear with a bold visual that balances options in a clean, modern way. This presentation helps you compare features, weigh benefits, and highlight key differences using simple graphics and intuitive labeling. Fully compatible with PowerPoint, Keynote, and Google Slides.


5 slides
Marketing Customer Journey Presentation
Visualize your customer’s path with the Marketing Customer Journey Presentation. This slide layout is perfect for outlining the stages of your buyer’s decision-making process—from awareness to action. Highlight critical touchpoints and engagement strategies with a clean, easy-to-follow design. Fully customizable and compatible with PowerPoint, Keynote, and Google Slides.


2 slides
Engaging Opening Introduction Presentation
Make a lasting first impression with this Engaging Opening Introduction Slide. Designed for professional presentations, networking events, and business pitches, this slide offers a modern, structured layout with a dynamic image section and clear text area. Fully customizable in PowerPoint, Keynote, and Google Slides, you can easily adjust colors, fonts, and content to match your brand.


6 slides
SCAR Process Model Presentation
The "SCAR Process Model" presentation template provides a clear visualization of the SCAR (Supplier, Corrective, Action, Request) model, designed to help professionals manage and enhance supplier relationships effectively. Each quadrant of the template is dedicated to one of the SCAR components, neatly arranged around a central hub, symbolizing the interconnected nature of these processes. The circular layout facilitates the understanding of how each component influences the others, leading to a more streamlined approach in handling supplier interactions and corrective actions. This template is perfect for presentations in supply chain management, operational reviews, and strategic planning meetings, offering a practical framework for discussing and planning effective supply chain strategies.


7 slides
Environmental Planning Infographic Presentation
Environmental infographics are an essential tool in raising awareness about the state of the environment and the impact of human activities on the planet. This template presents a broad range of data text on the environment for you to input. Use this eye-catching infographic design to educate and raise awareness about the environment. This template is ideal to give an overview of the topic, its importance and the main issues. Stay on track using facts and figures, good visuals and data visualizations. This presentation is easy to use and can be edited in Powerpoint, Keynote or Google Slides.


20 slides
Chordstream Professional Portfolio Showcase Presentation
The Portfolio Presentation Template offers a modern and creative design, perfect for showcasing your projects, philosophy, and services. With 20 customizable slides, it includes sections for project highlights, pricing, client testimonials, and contact information. Compatible with PowerPoint, Keynote, and Google Slides, this template ensures professional impact for creatives.