
Características


¿Tienes alguna pregunta?
Recomendar


8 diapositivas
Team Performance and Sports Analysis Presentation
Highlight team rankings and sports metrics with the Team Performance and Sports Analysis template. Featuring a dynamic race track-inspired layout with numbered positions, icons, and vivid color coding, it’s ideal for comparing performance. Fully customizable in Canva, PowerPoint, and Google Slides to match your sport, brand colors, and presentation goals.


6 diapositivas
Business Process Checklist Overview Presentation
Simplify your workflow presentations with the Business Process Checklist Overview Presentation. This circular layout is ideal for outlining five sequential or cyclical steps in a business process, featuring icon-labeled checkpoints and editable titles. Each step is visually marked with subtle checkmarks, making it perfect for status tracking, task progression, or implementation plans. Clean, professional, and fully customizable in PowerPoint, Keynote, and Google Slides.


5 diapositivas
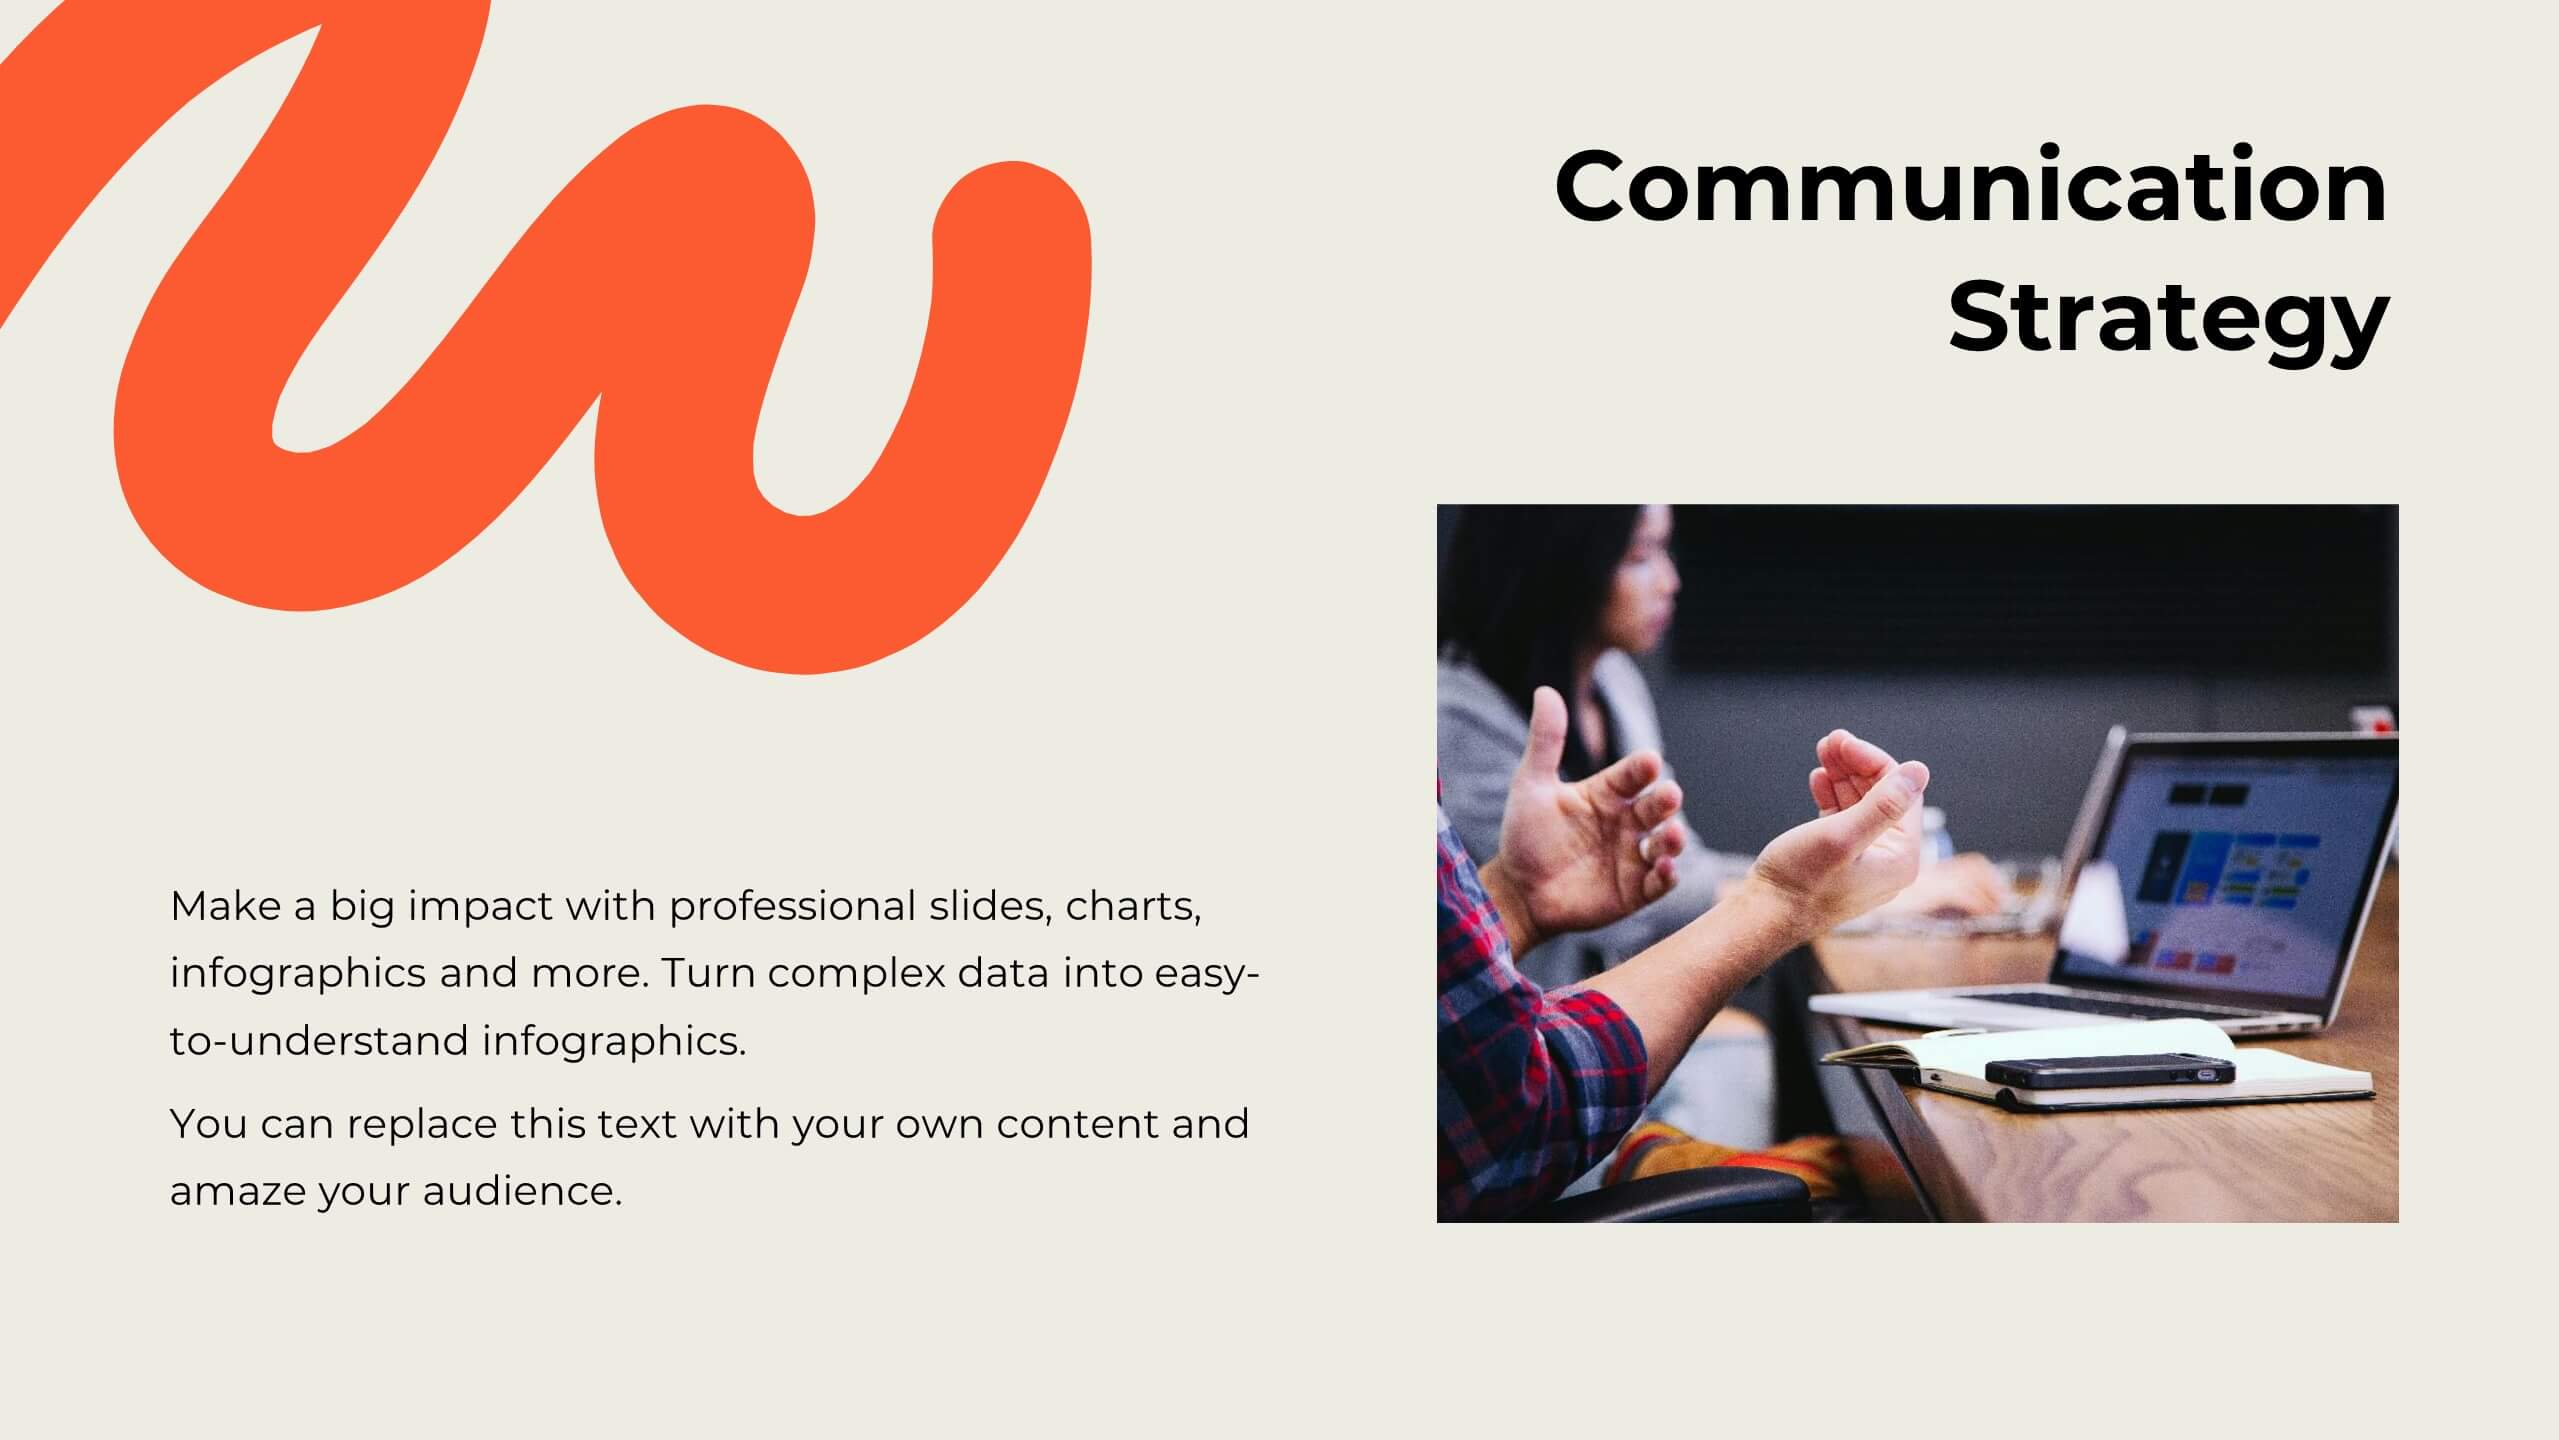
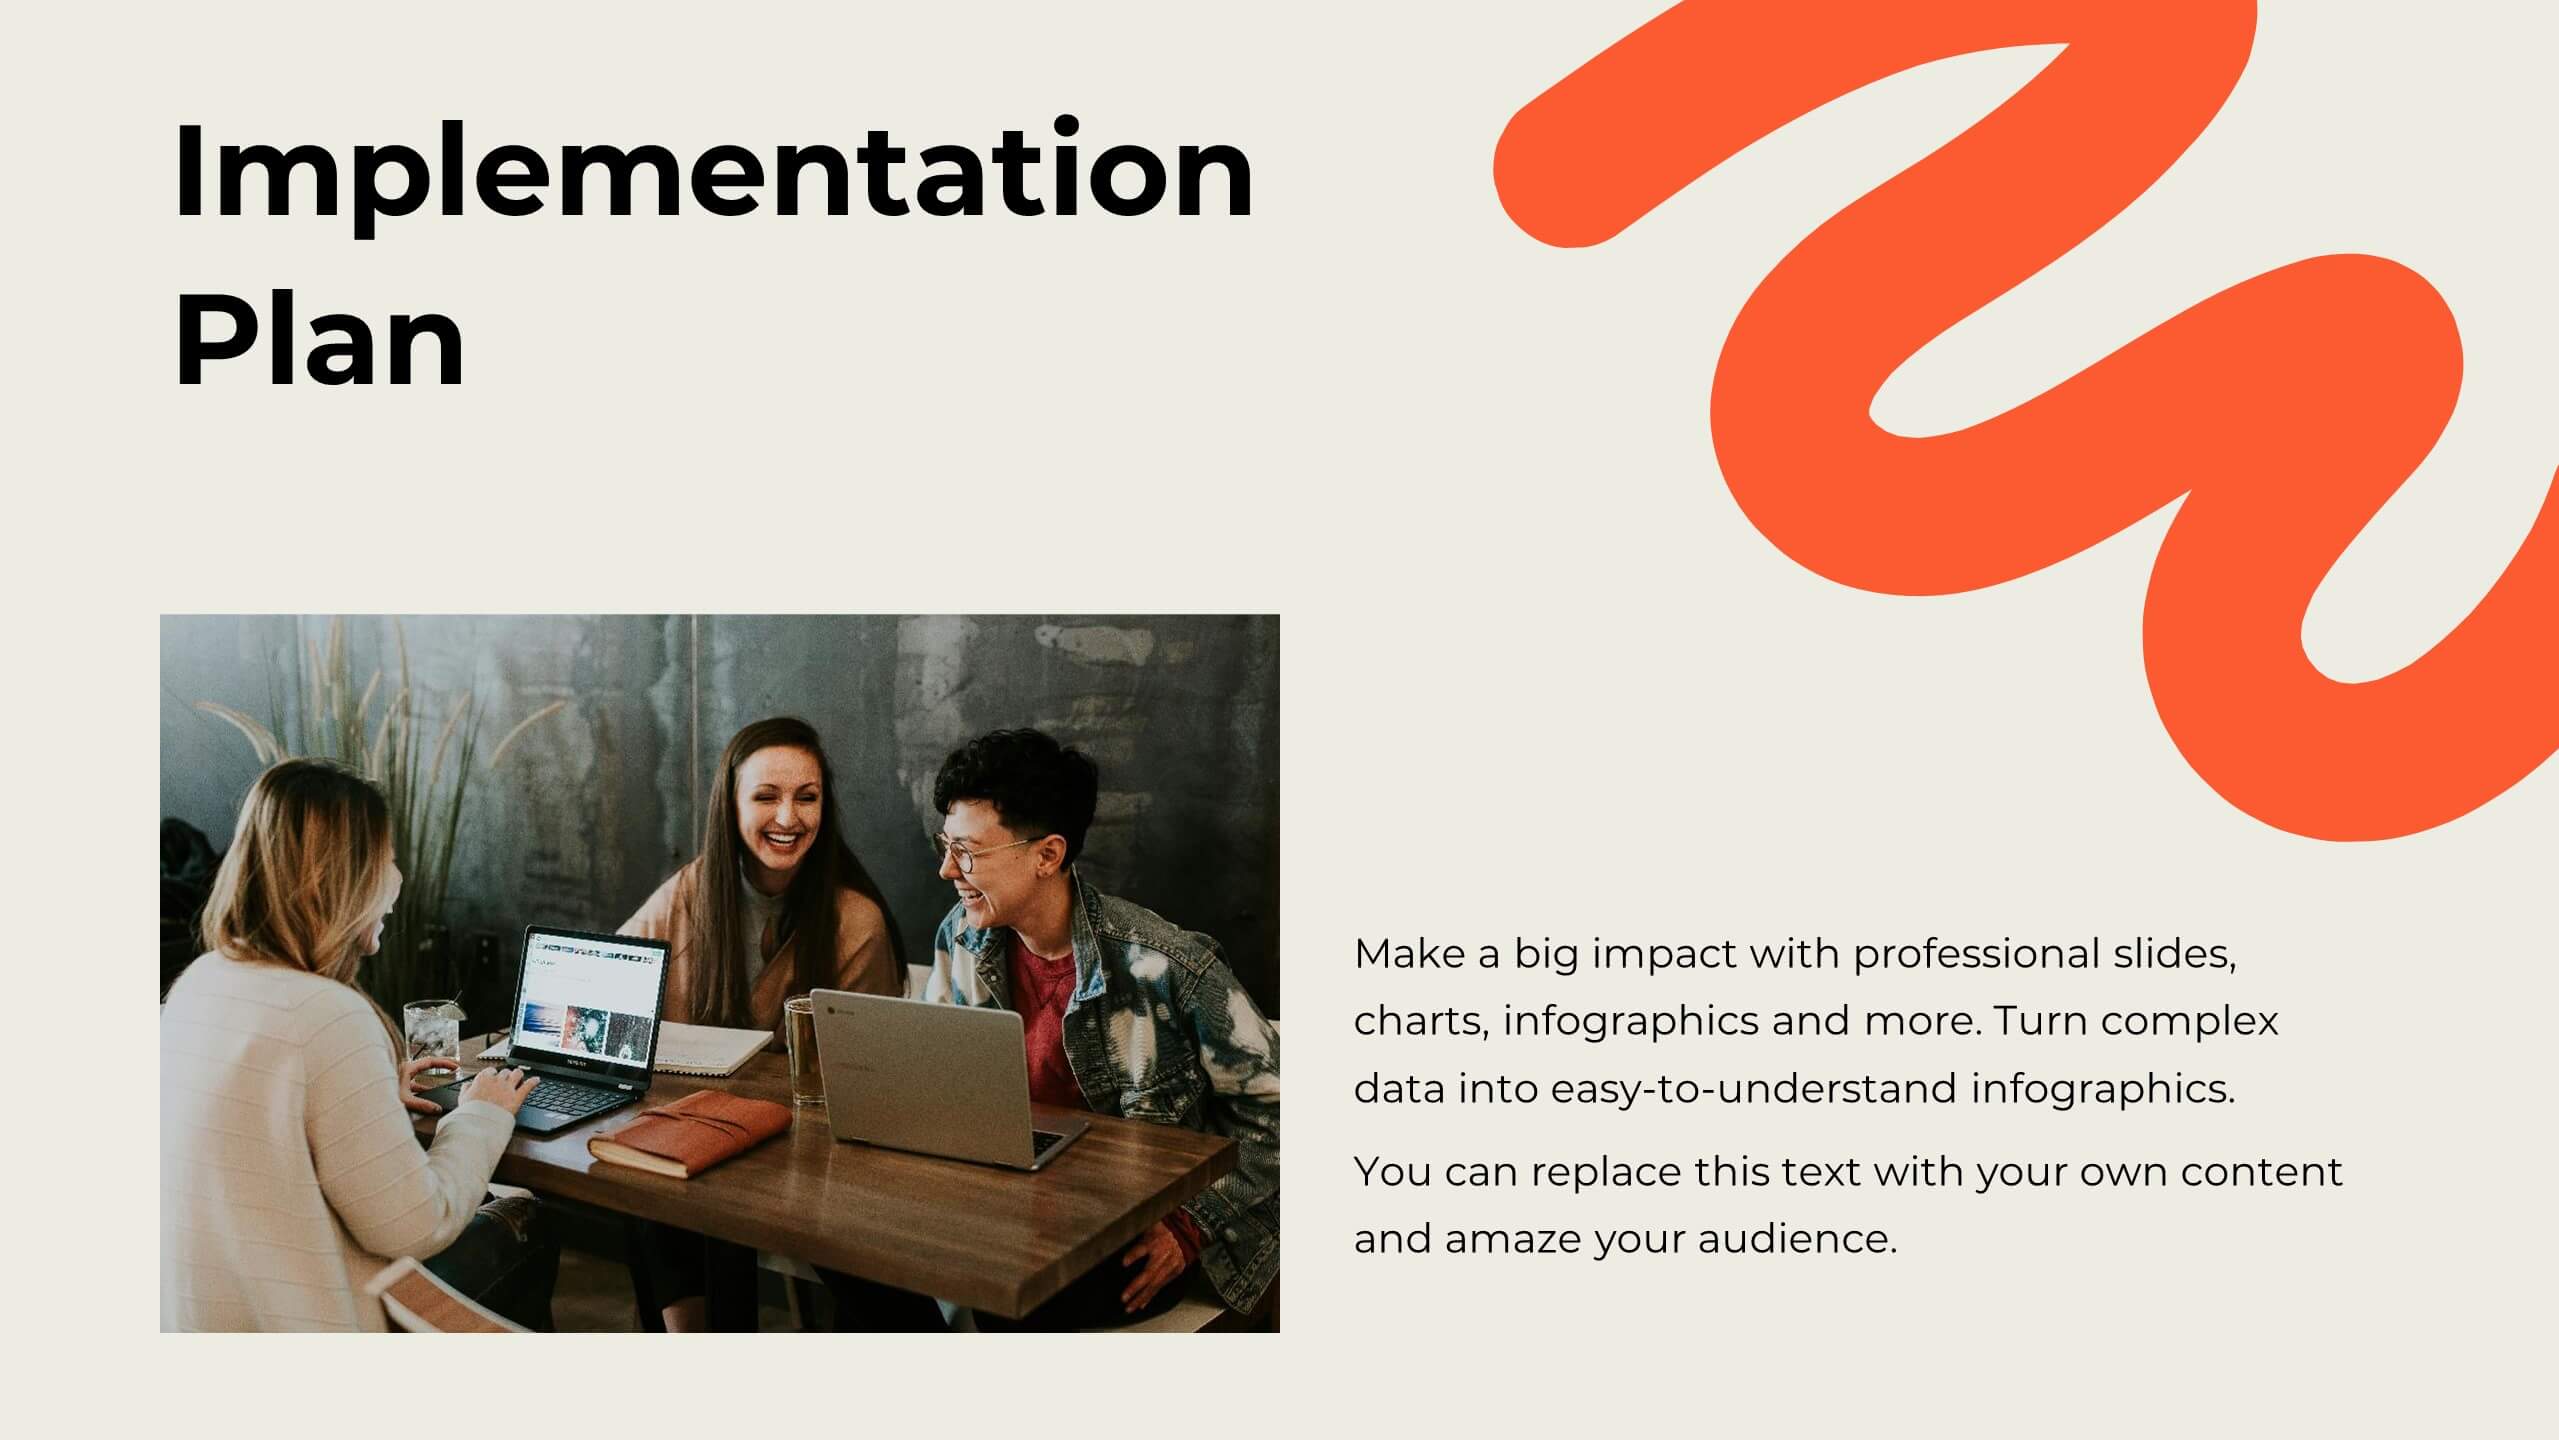
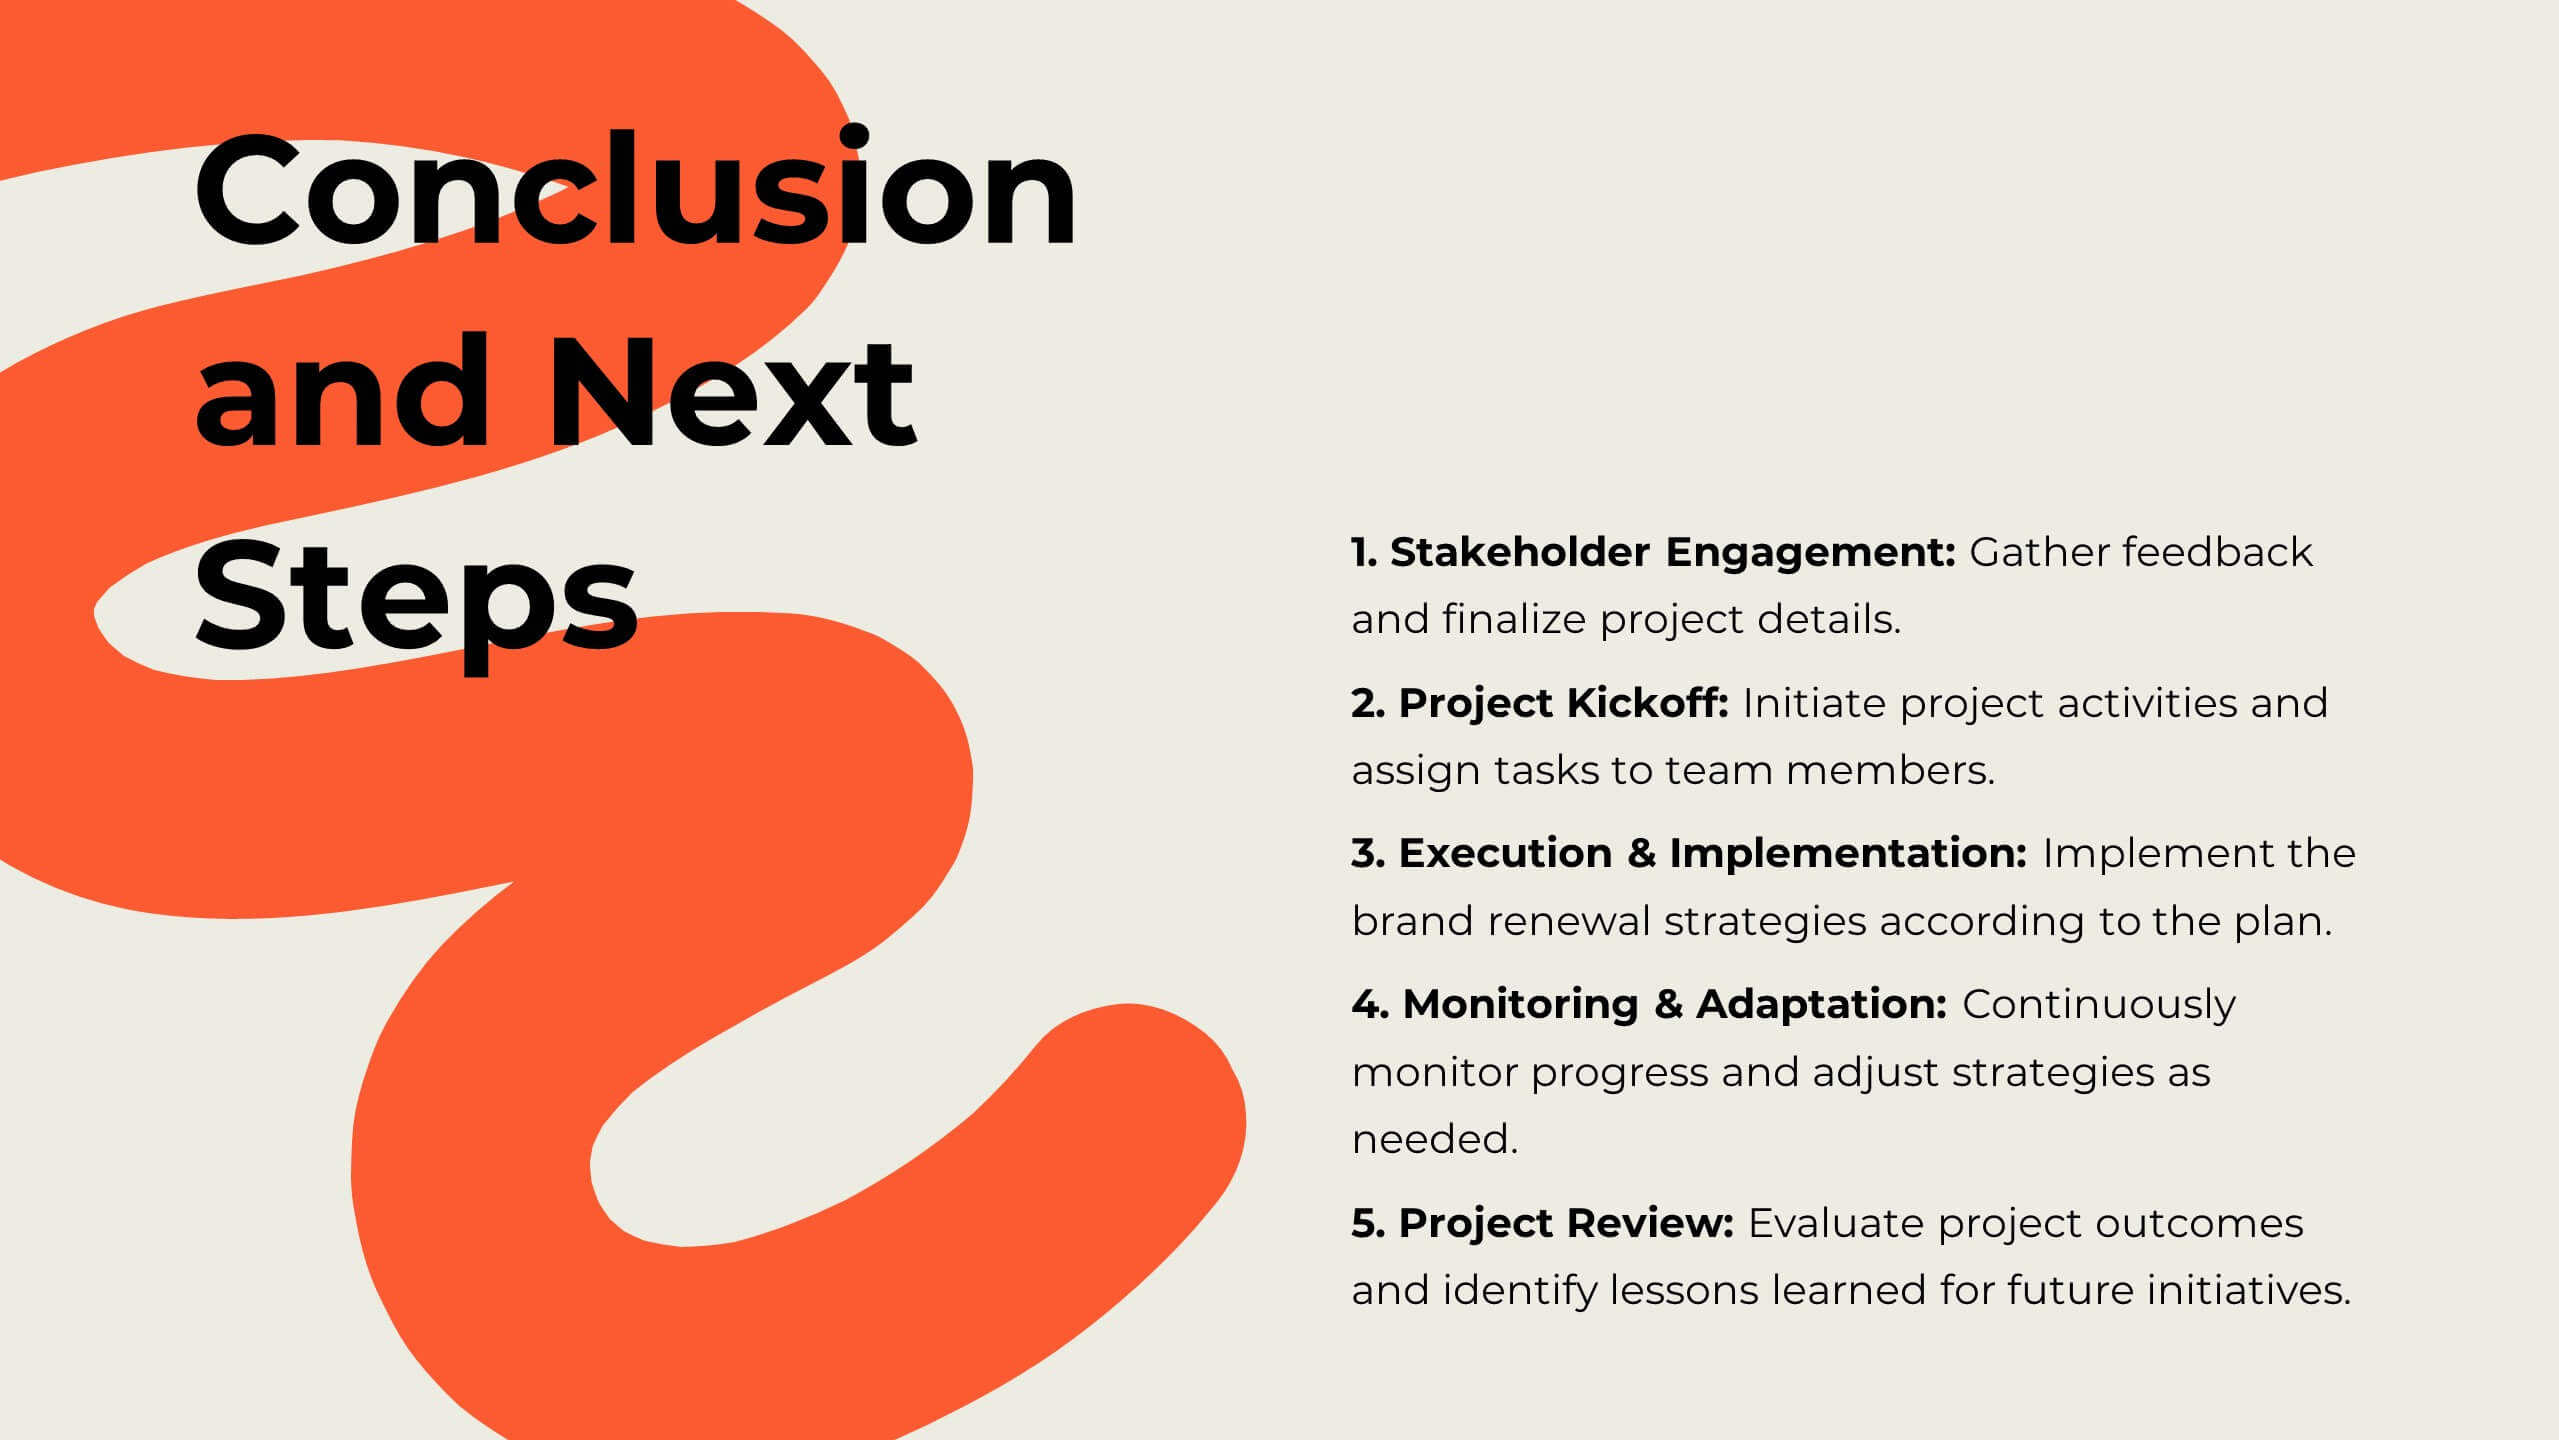
Professional Business Proposal Presentation
Make your pitch stand out with a polished, minimal design that highlights every key stage of your business strategy. This clean visual layout is perfect for outlining project phases, services, or data-driven insights with clarity and impact. Fully compatible with PowerPoint, Keynote, and Google Slides for easy customization.


6 diapositivas
Cloud Engineering Infographics
Discover the world of Cloud Engineering with our customizable infographic template. This template is fully compatible with popular presentation software like PowerPoint, Keynote, and Google Slides, allowing you to easily customize it to illustrate and communicate various aspects of cloud engineering. The Cloud Engineering infographic template offers a visually engaging platform to explore and explain the principles, practices, and technologies related to cloud computing and engineering. Whether you're a cloud engineer, IT professional, business leader, or simply interested in cloud technology, this template provides a user-friendly canvas to create informative presentations and educational materials. Deepen your understanding of Cloud Engineering with this SEO-optimized infographic template, thoughtfully designed for clarity and ease of use. Customize it to highlight key concepts, cloud service models, deployment strategies, and the benefits of cloud engineering, ensuring that your audience gains valuable insights into this rapidly evolving field. Start crafting your personalized infographic today to delve into the world of Cloud Engineering.


6 diapositivas
Problem-Solving with Design Thinking
Communicate your innovation process with clarity using the Problem-Solving with Design Thinking Presentation. This slide visualizes the six key phases of the design thinking methodology (e.g., Empathize, Define, Ideate, Prototype, Test, Implement) arranged in a dynamic hexagonal loop. Each section is color-coded and icon-labeled for easy navigation, with editable titles and space for explanatory text. Ideal for creative workshops, team brainstorming, innovation strategy, and agile process presentations. Fully editable in PowerPoint, Keynote, and Google Slides.


4 diapositivas
Global Market Overview with World Map Presentation
Present international data visually with this world map slide layout. Ideal for showcasing market reach, regional insights, or global performance metrics. Each pin can be customized with location-specific information and iconography. Perfect for business overviews, sales reports, and investor decks. Editable in PowerPoint, Keynote, and Google Slides.


10 diapositivas
Business Relationship Management Presentation
Navigate the nuances of professional partnerships with the "Business Relationship Management" presentation templates. These layouts offer a structured approach to delineating the roles and interactions within business relationships, making them an essential tool for managers and team leaders. Designed to be compatible with PowerPoint, Keynote, and Google Slides, these templates provide a clear pathway for discussing and managing business relationships effectively.


4 diapositivas
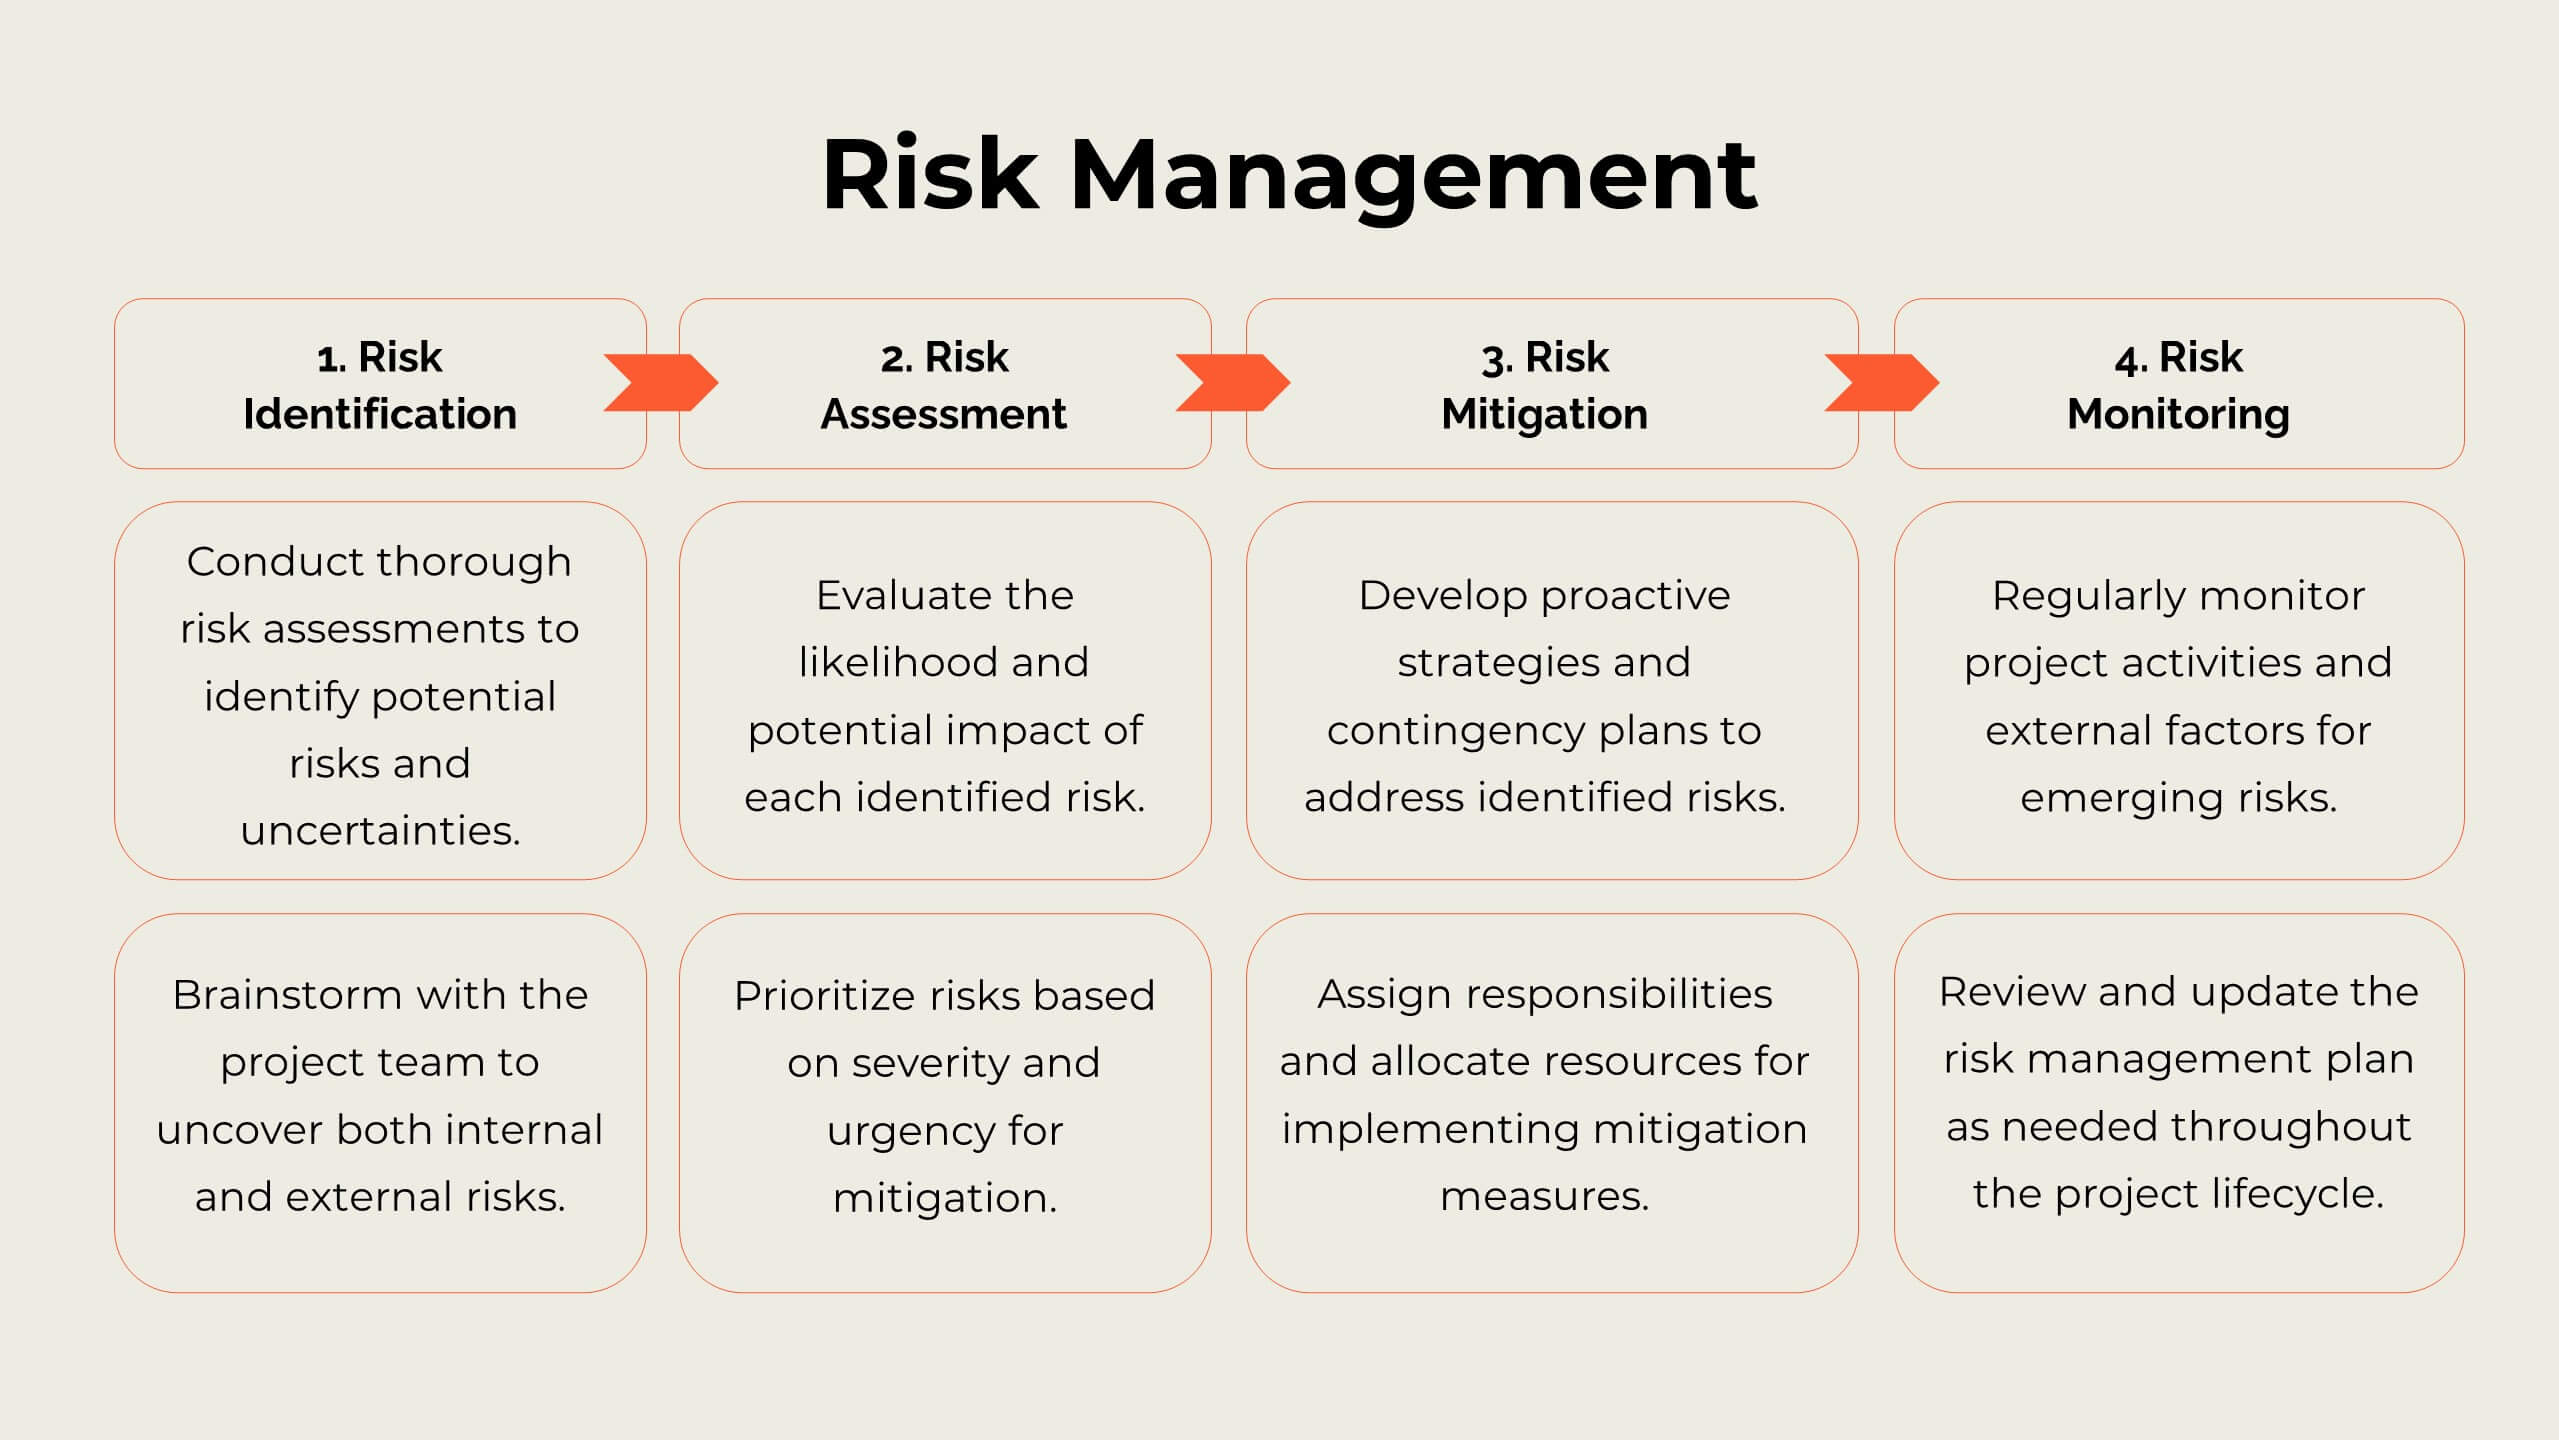
Risk Assessments Matrix Presentation
Bring clarity to complex decisions with this bold, color-coded layout designed to pinpoint threats, compare impact levels, and communicate risks with confidence. This presentation makes evaluation simple, structured, and visually clear for any audience. Fully editable and ready for professional use. Compatible with PowerPoint, Keynote, and Google Slides.


6 diapositivas
Leadership and Business Teamwork Presentation
Drive results through synergy with this dynamic Leadership and Business Teamwork presentation slide. Designed with a six-part segmented pie chart, this layout helps visualize collaborative frameworks, team roles, or leadership models in an engaging way. Ideal for team workshops, leadership development, or strategic planning meetings. Easy to personalize in PowerPoint, Keynote, or Google Slides.


20 diapositivas
Cinderbark Product Launch Pitch Deck Presentation
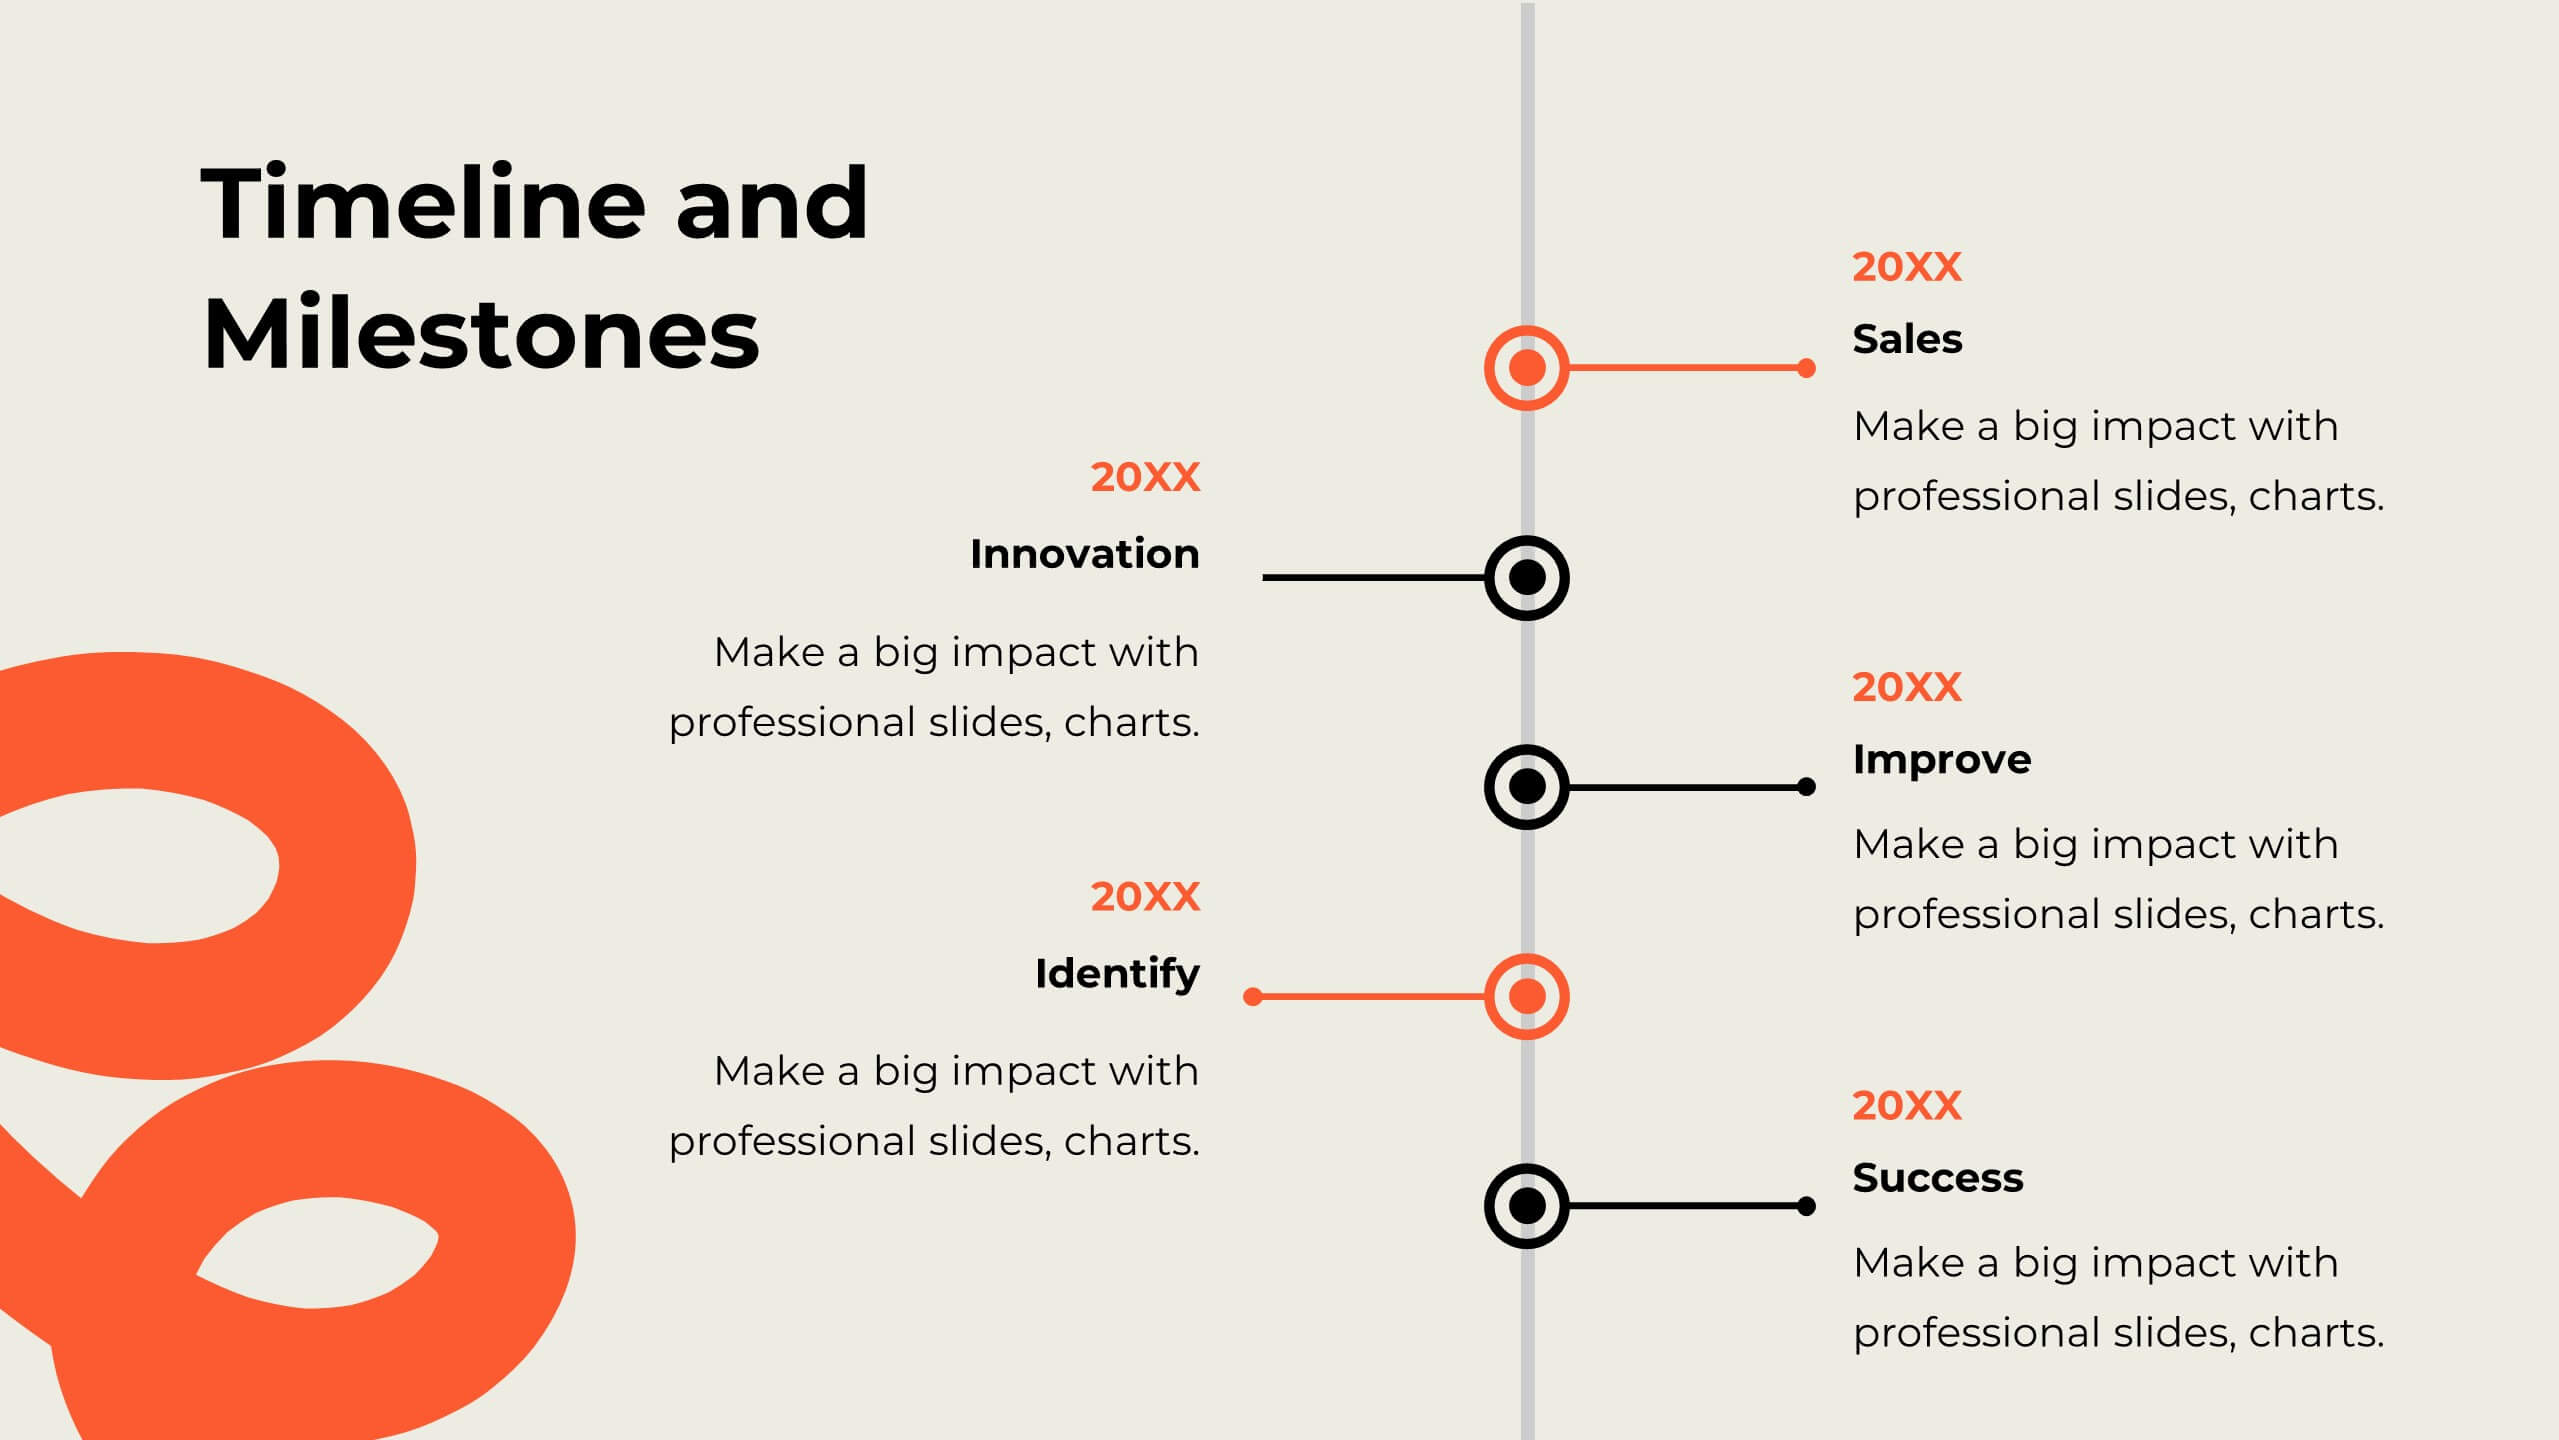
Showcase your product launch with a sleek, modern, and professional pitch deck template. This design empowers you to captivate stakeholders by clearly presenting your problem statement, unique solutions, and market opportunity. Effectively highlight your target audience, revenue model, and competitive landscape to demonstrate market viability. Create impact with visuals detailing your sales strategy, growth projections, and financial summary, ensuring transparency and confidence in your business plan. Timeline and milestone slides keep the focus on key achievements and future goals, while team introduction pages establish credibility and expertise. Fully customizable and compatible with PowerPoint, Google Slides, and Keynote, this template is ideal for startups, entrepreneurs, and product managers aiming for a polished and compelling presentation. Tailor it to your needs and deliver your vision with clarity and style.


23 diapositivas
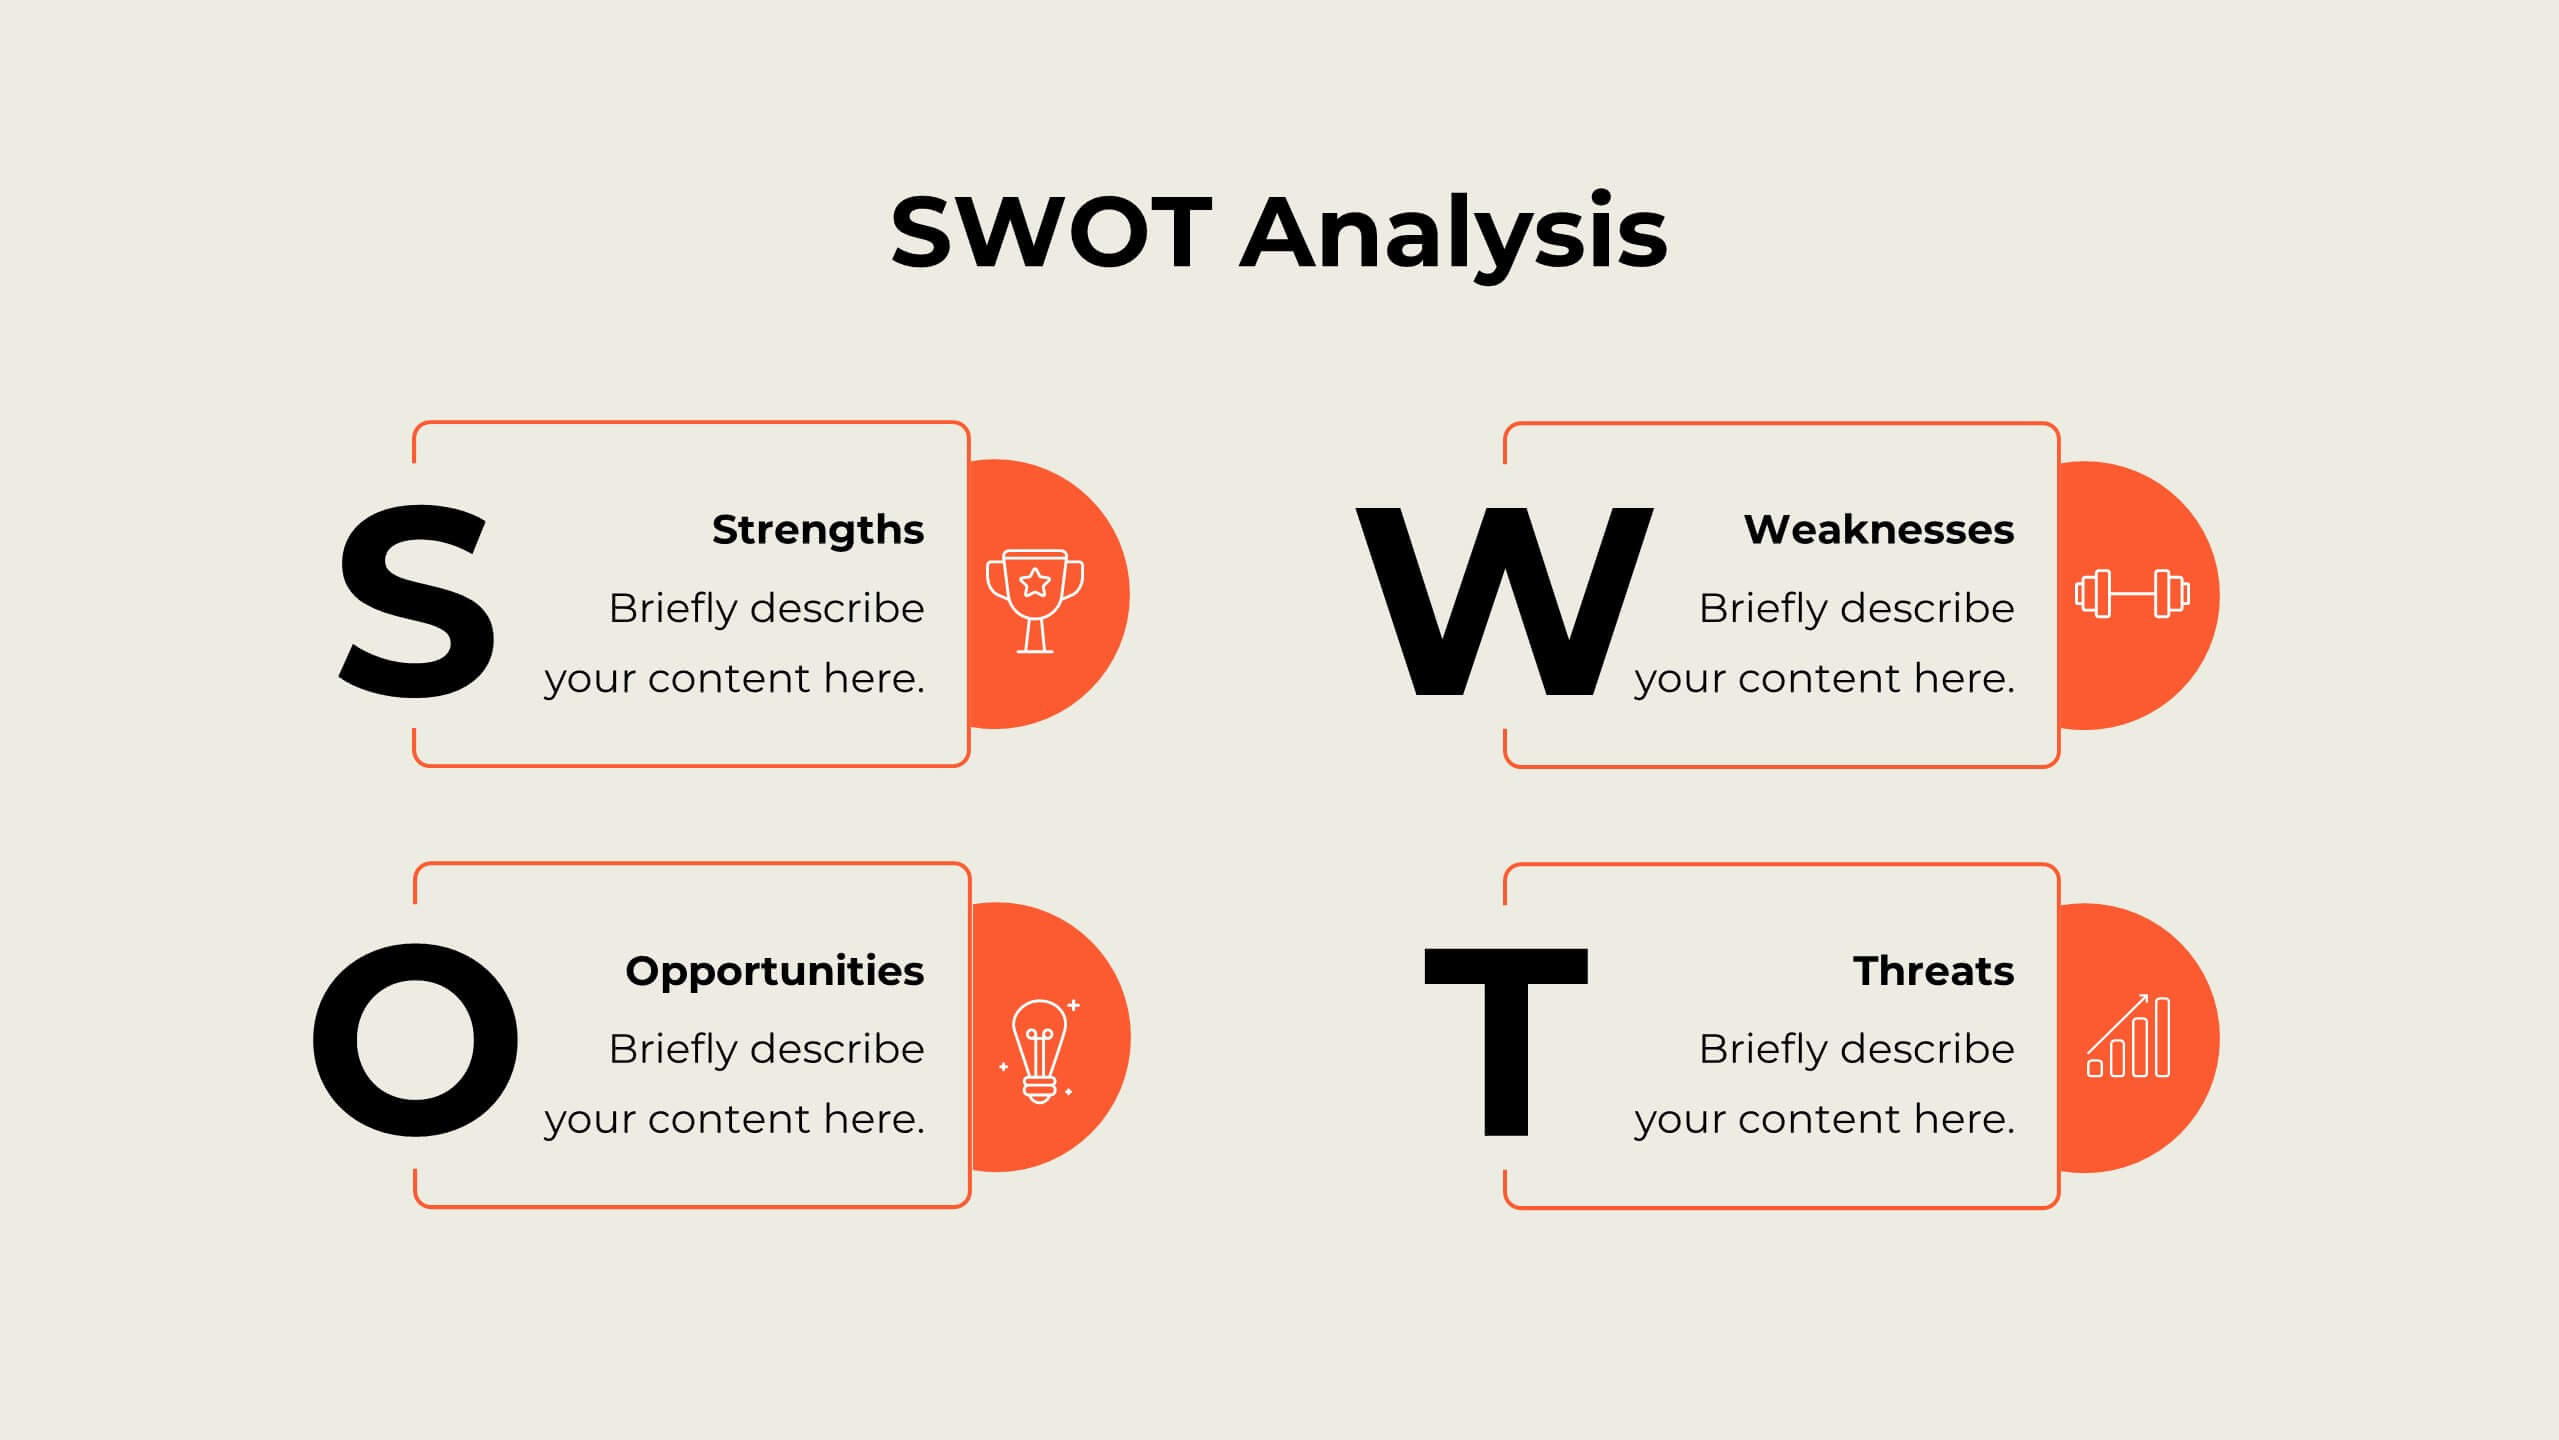
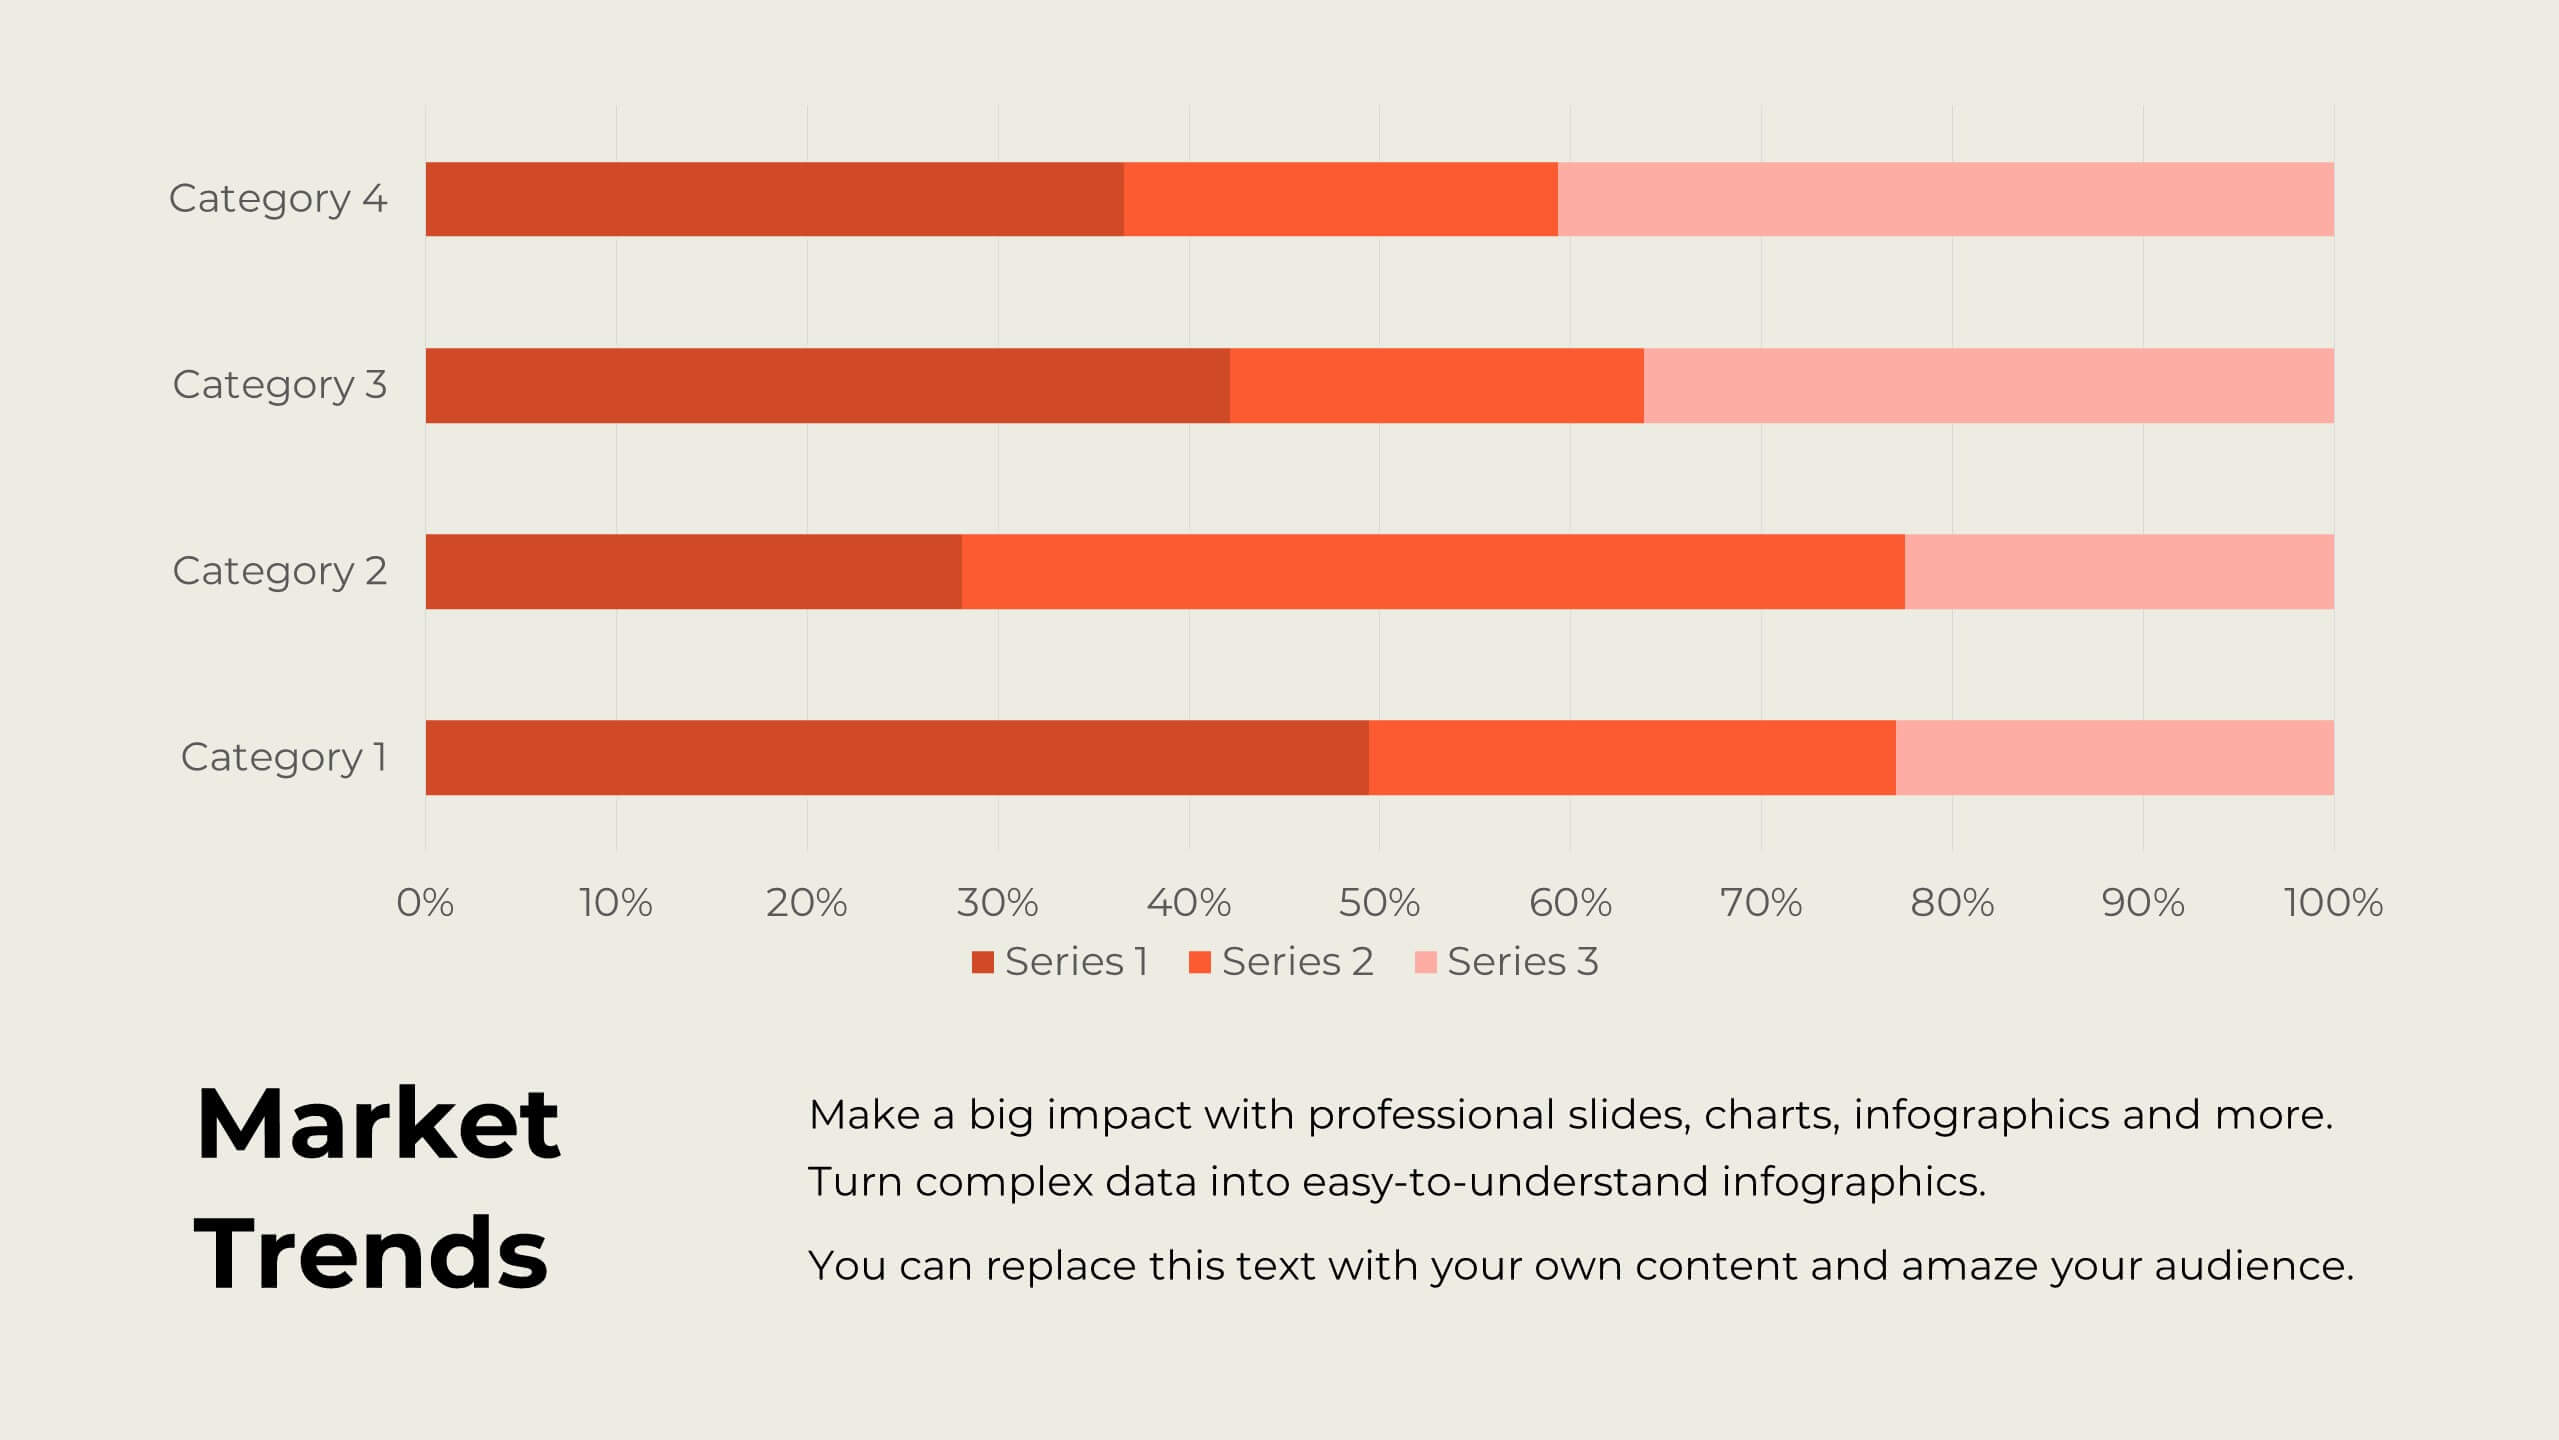
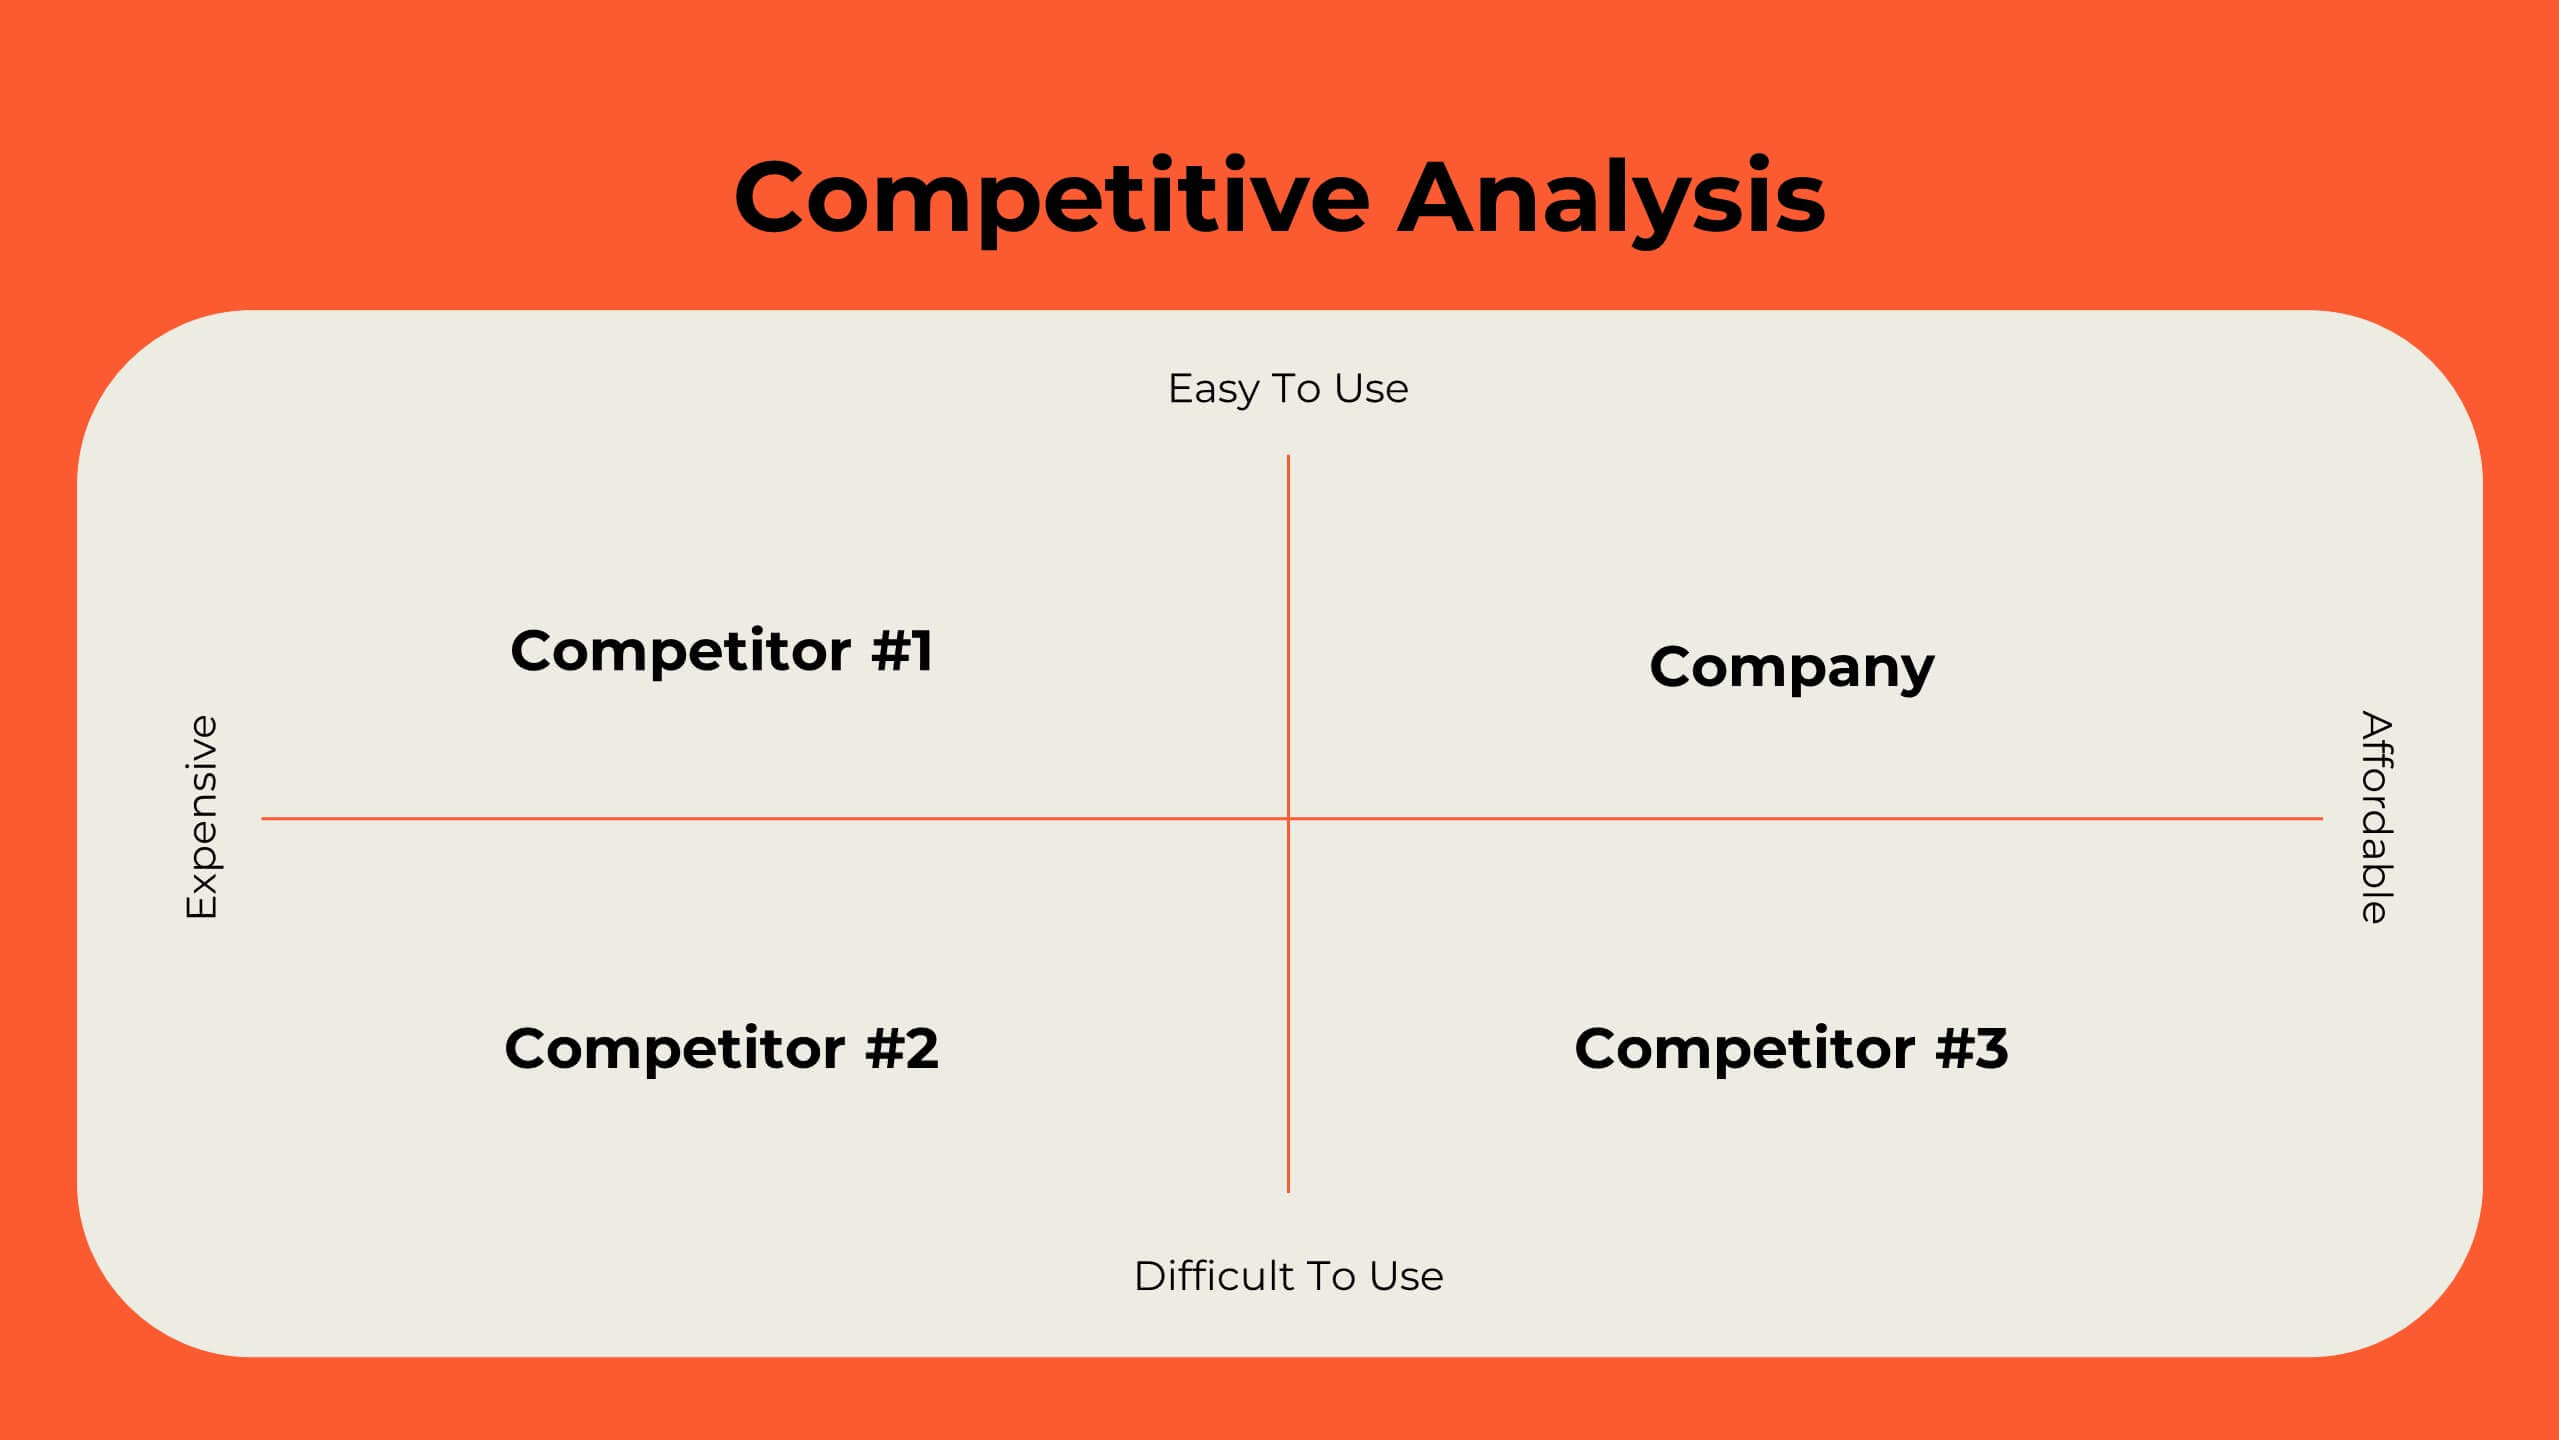
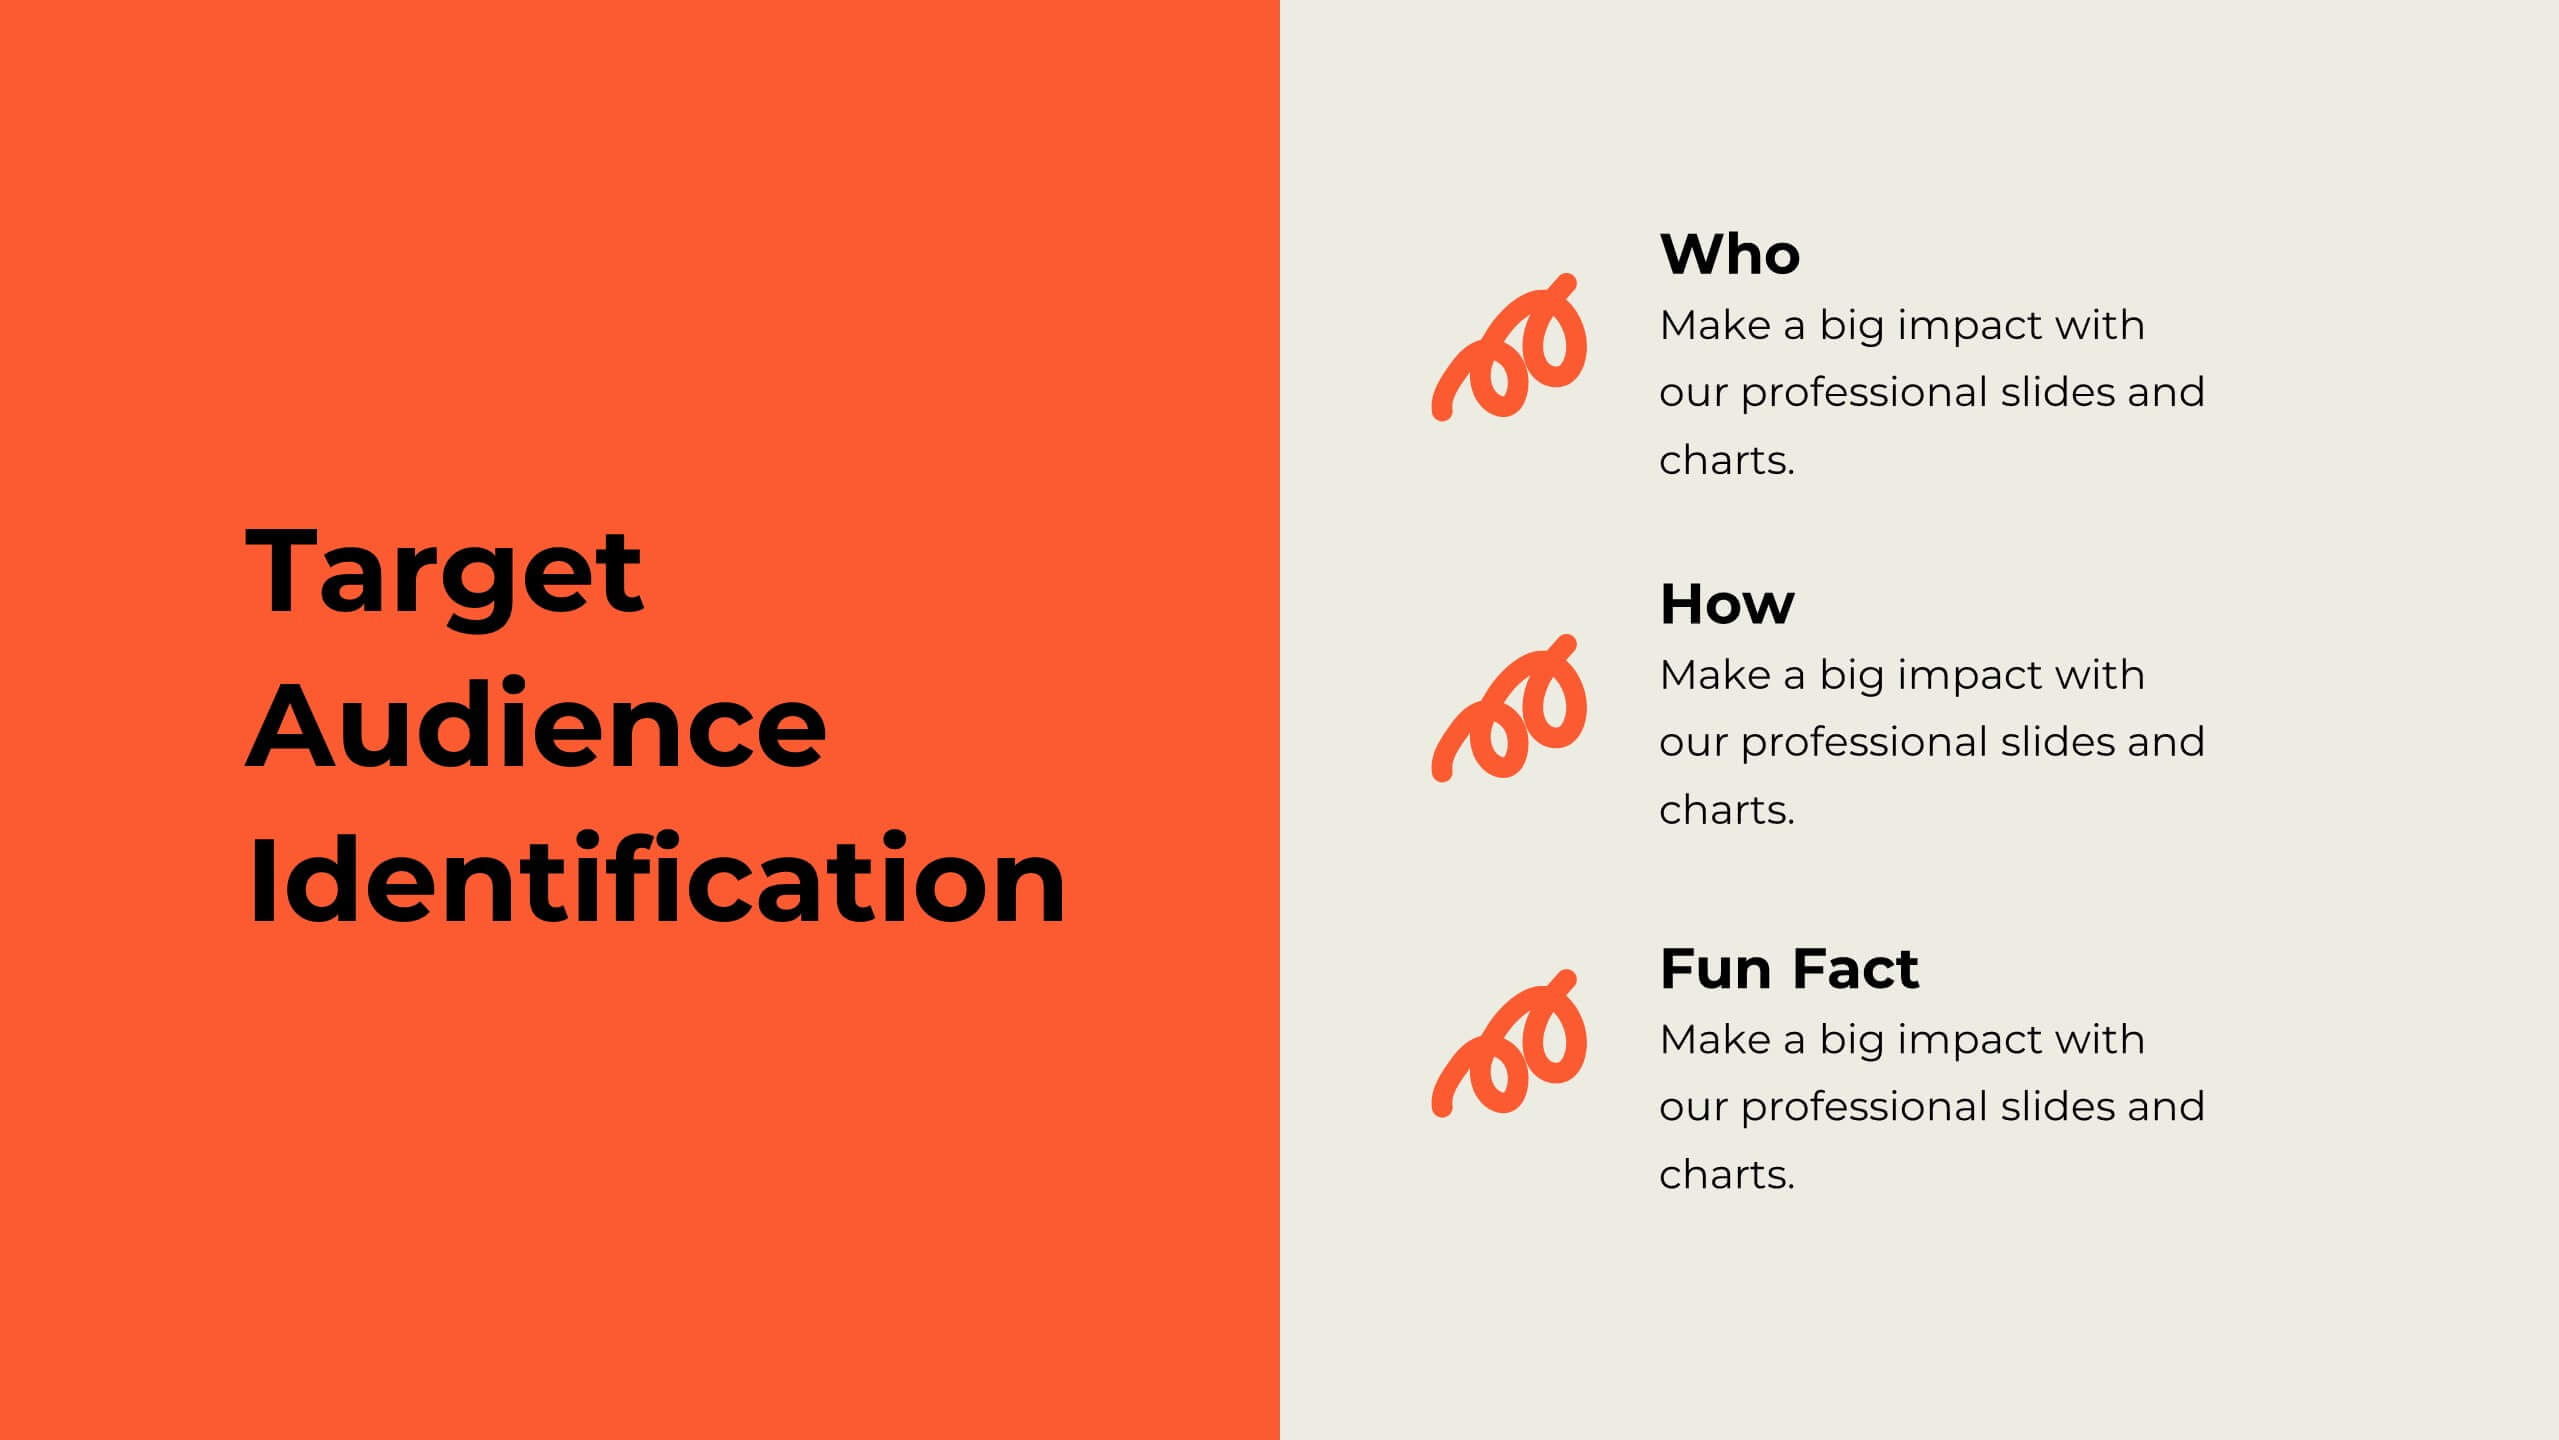
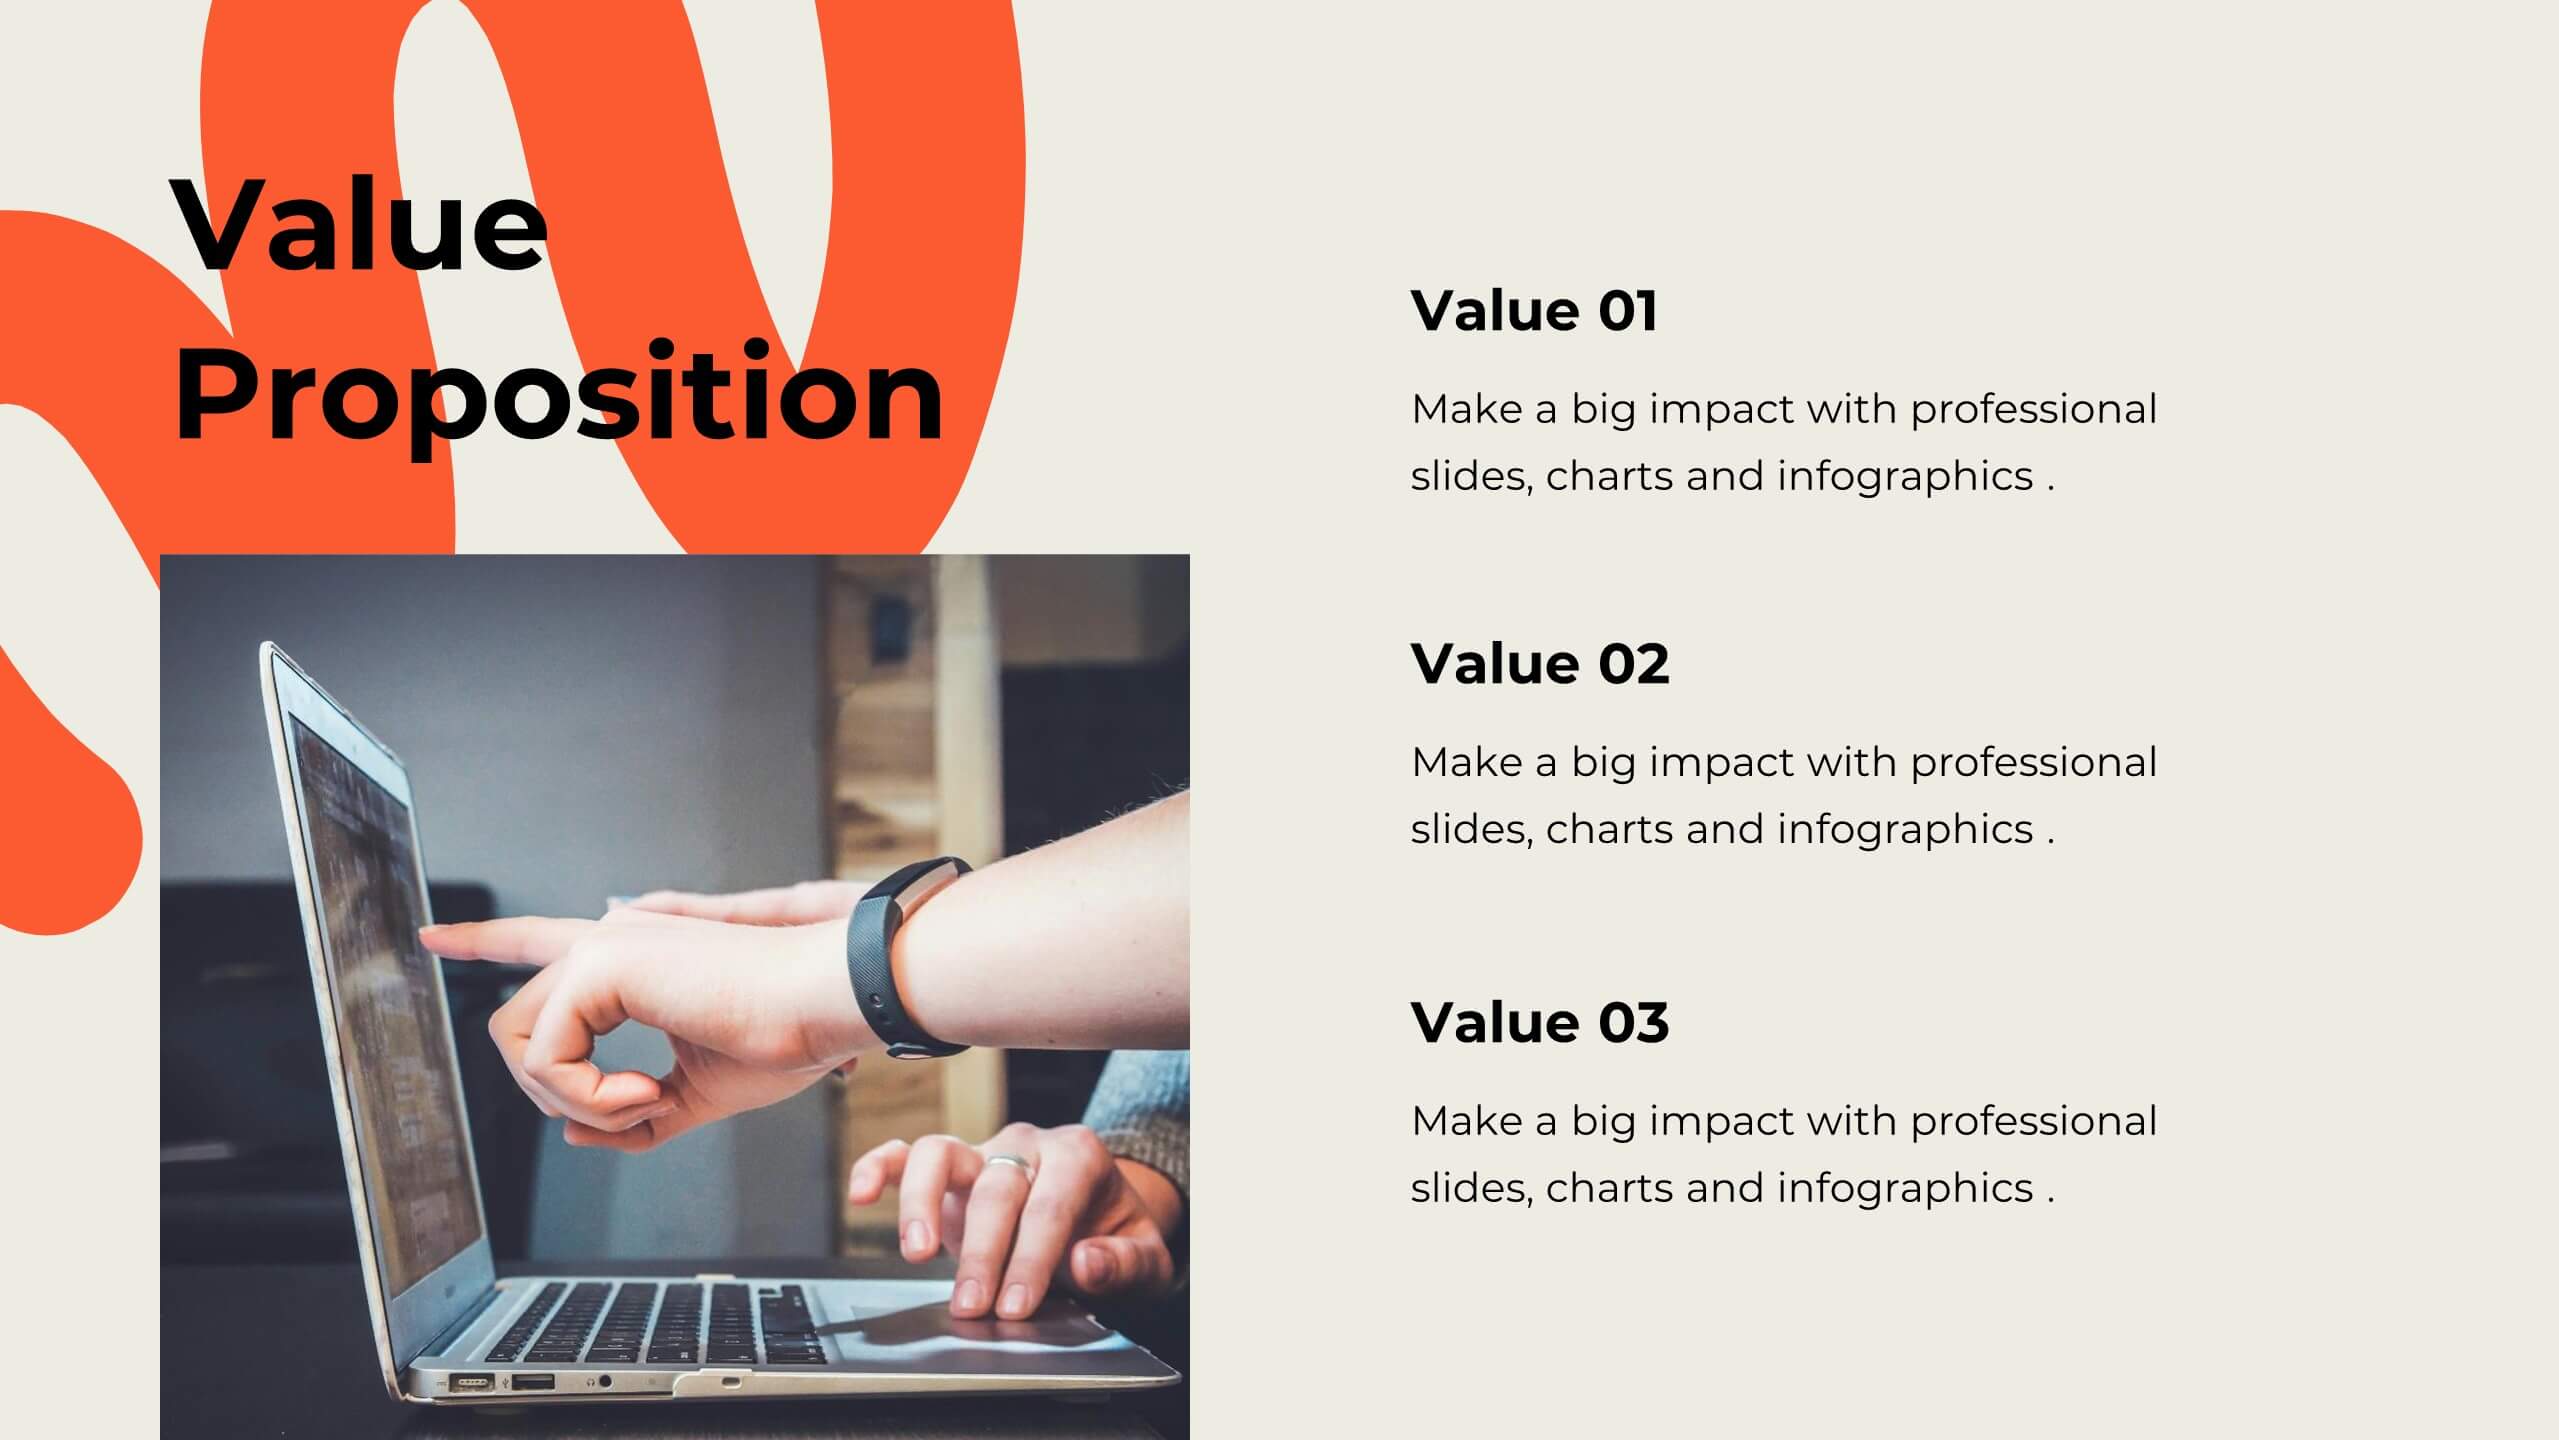
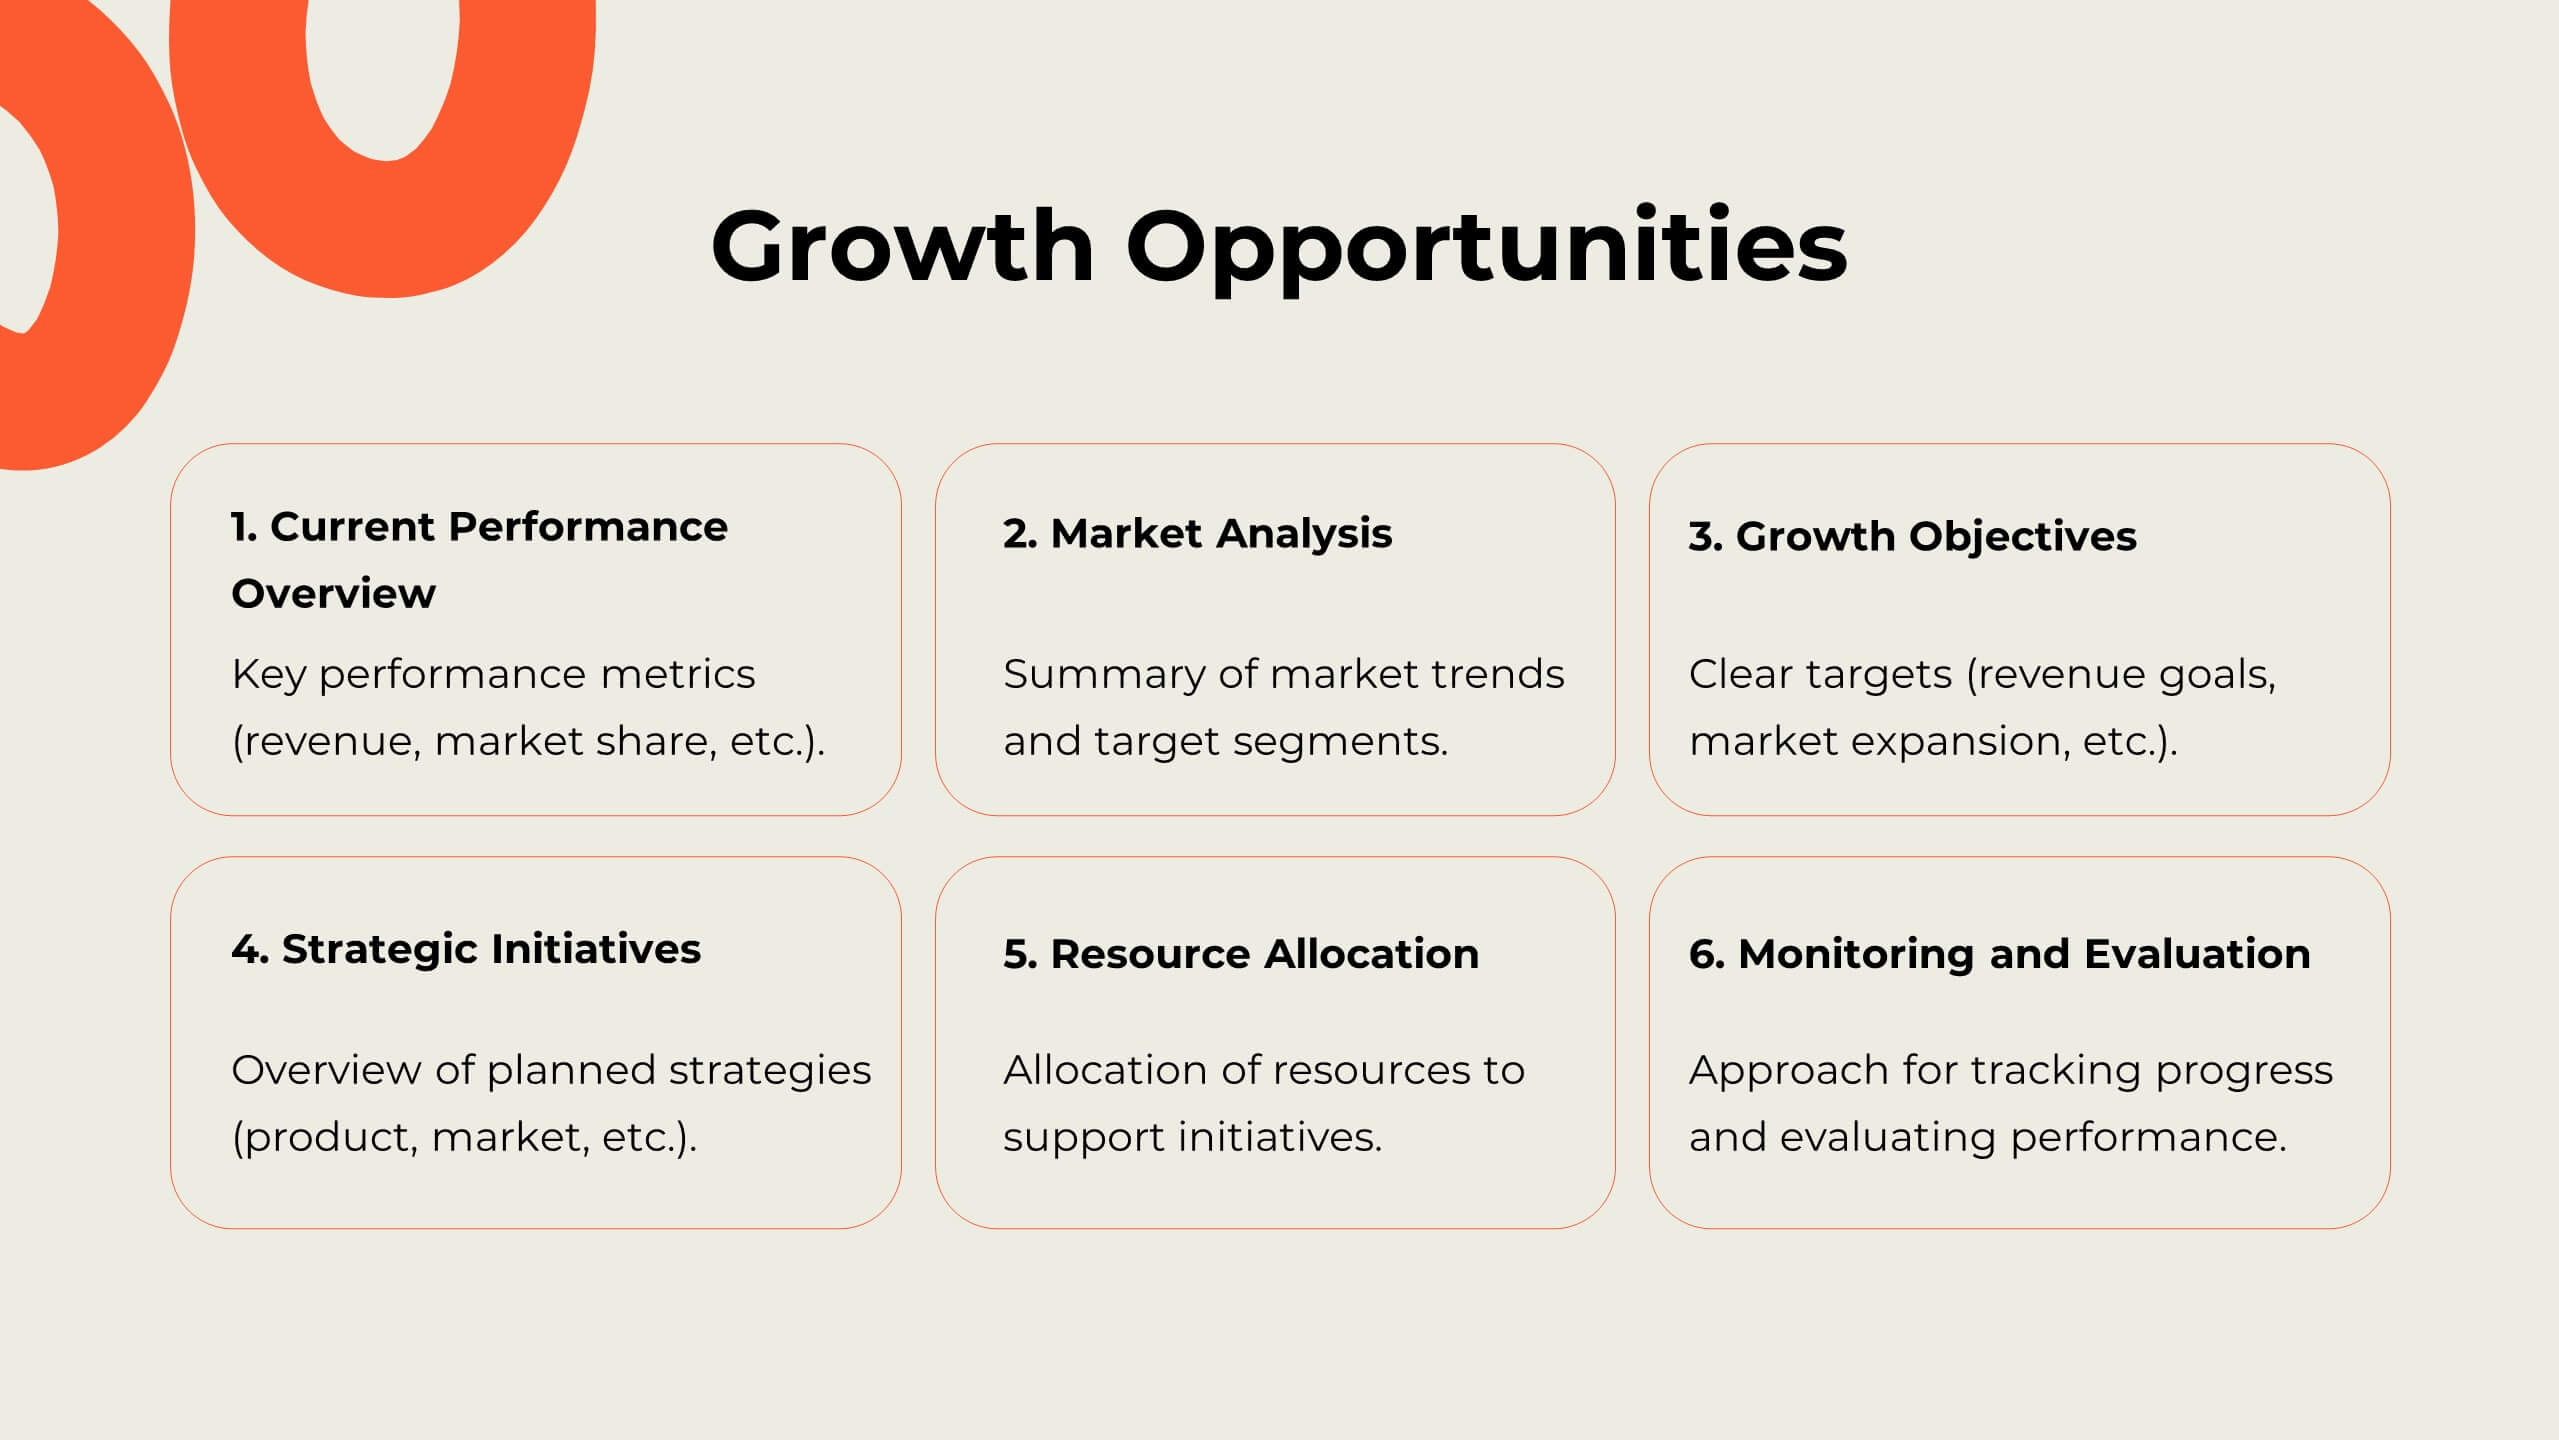
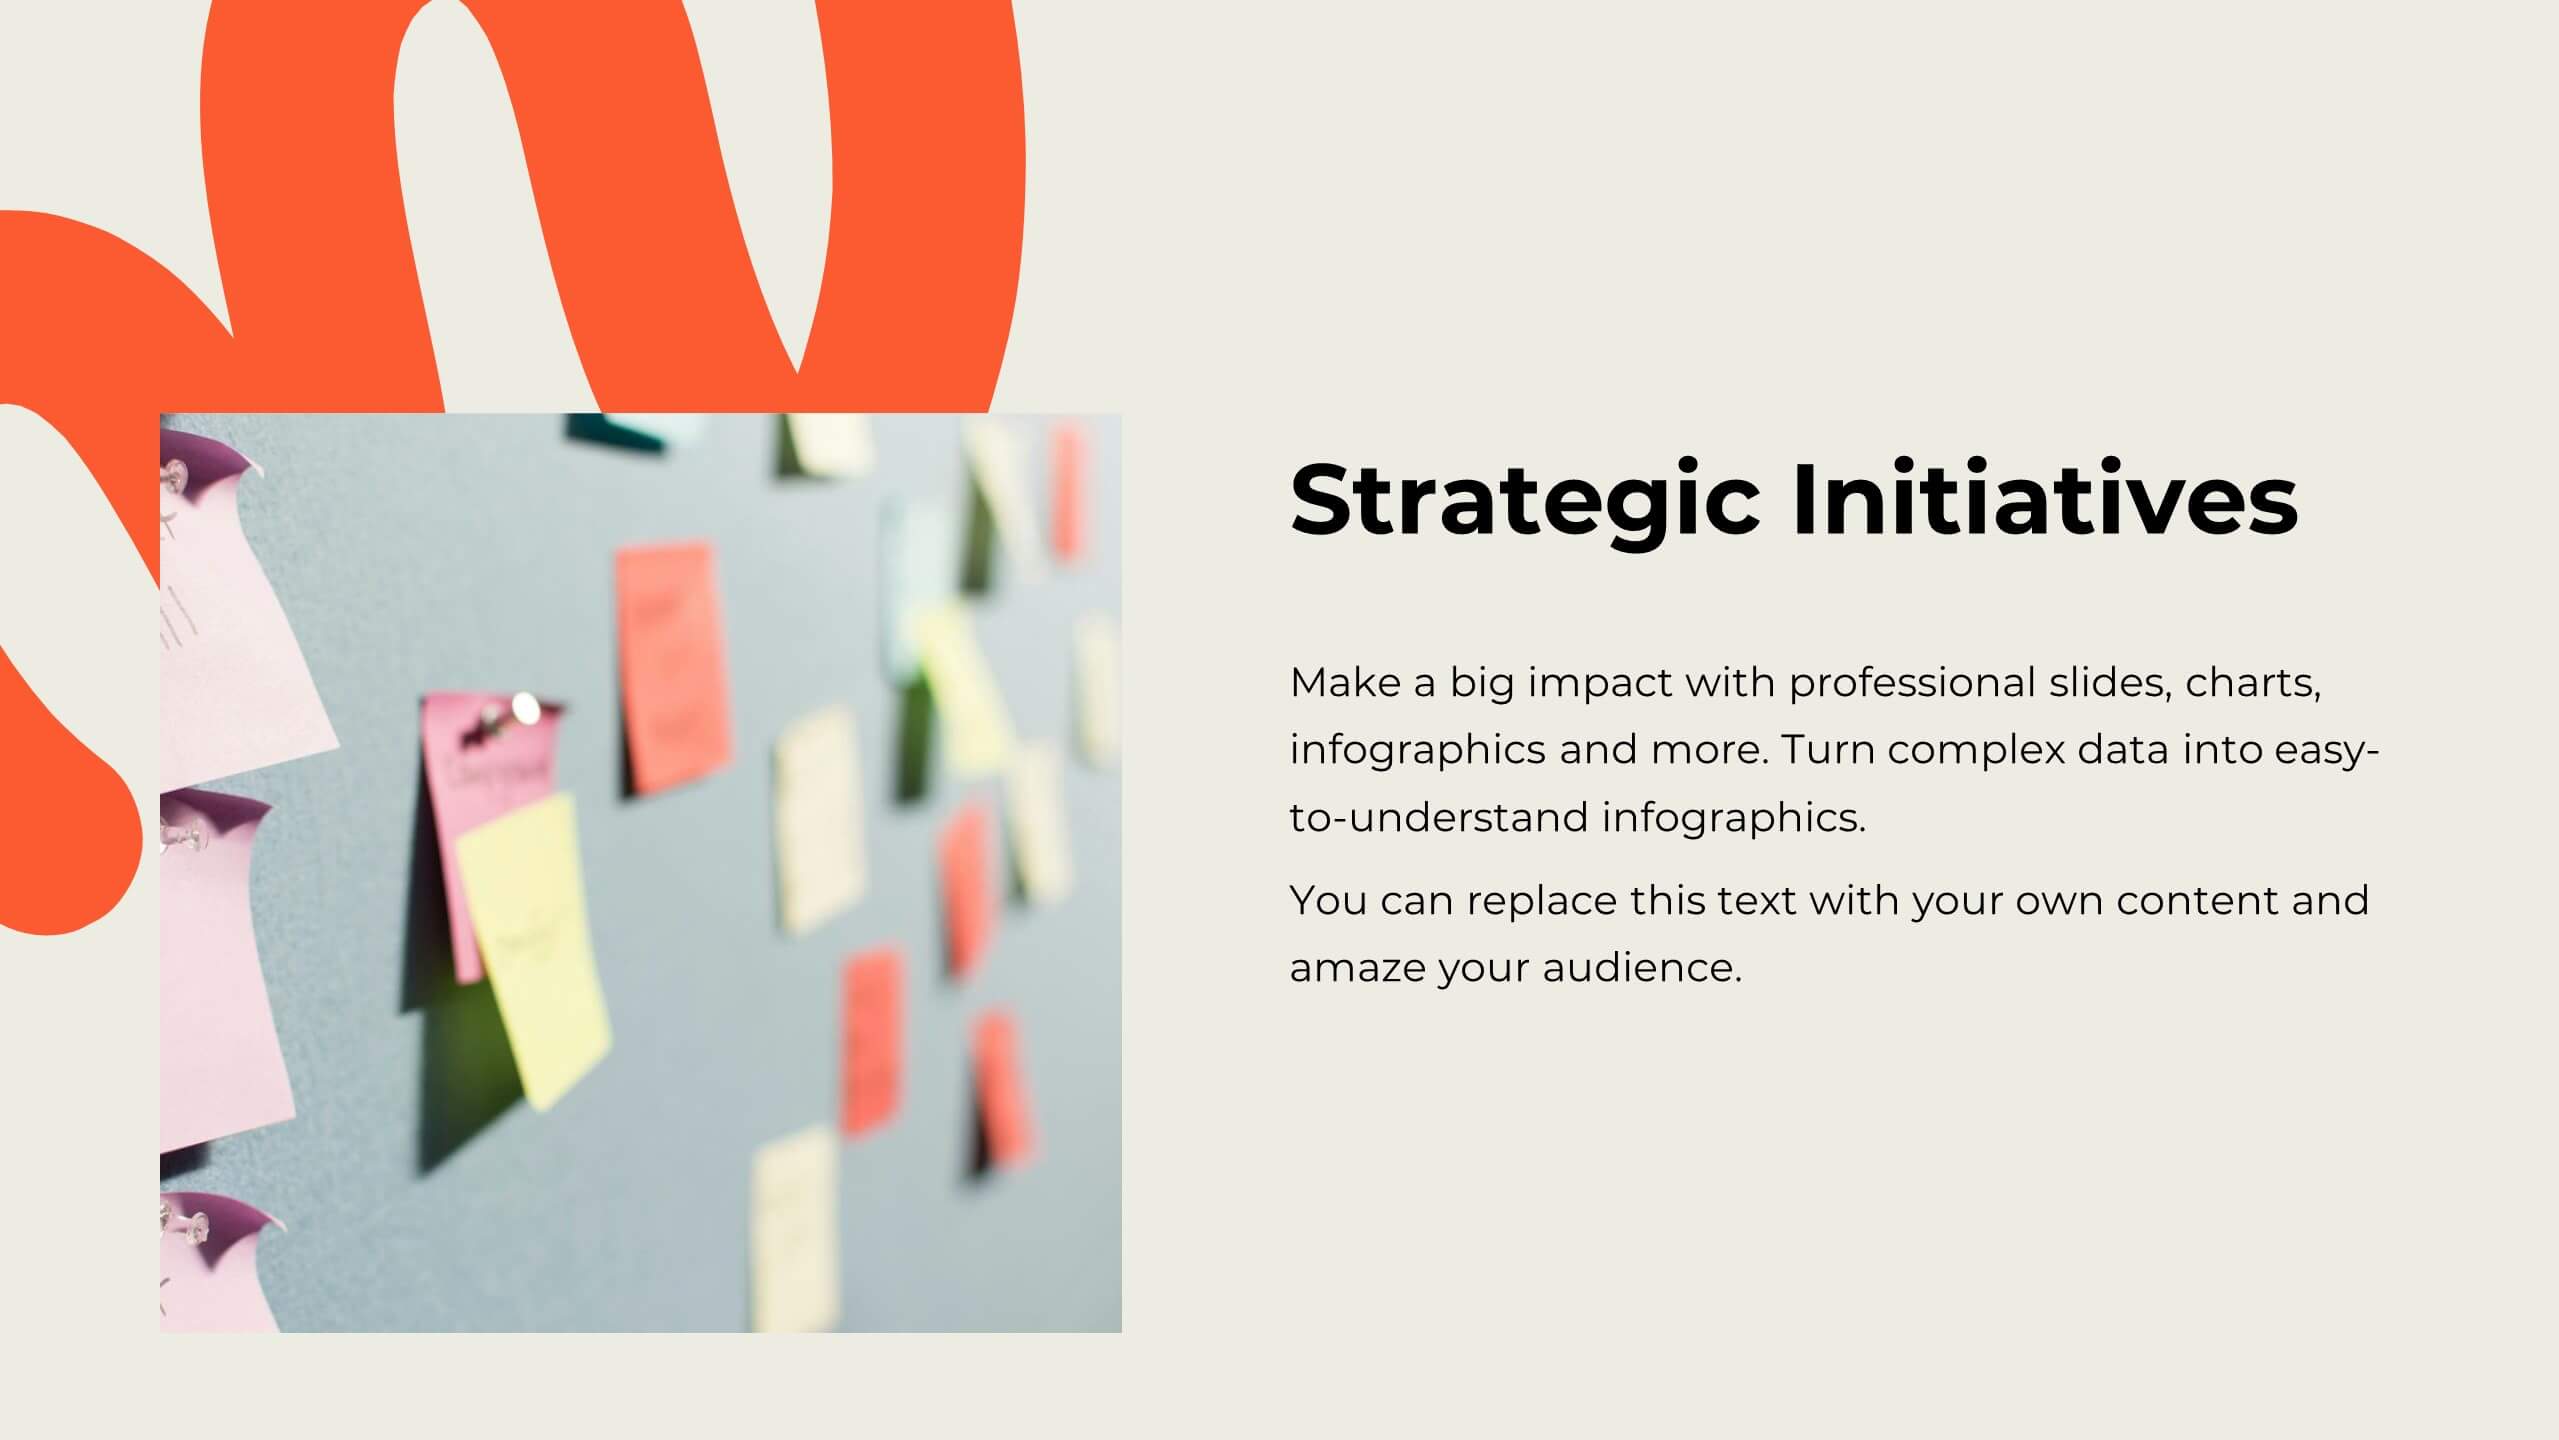
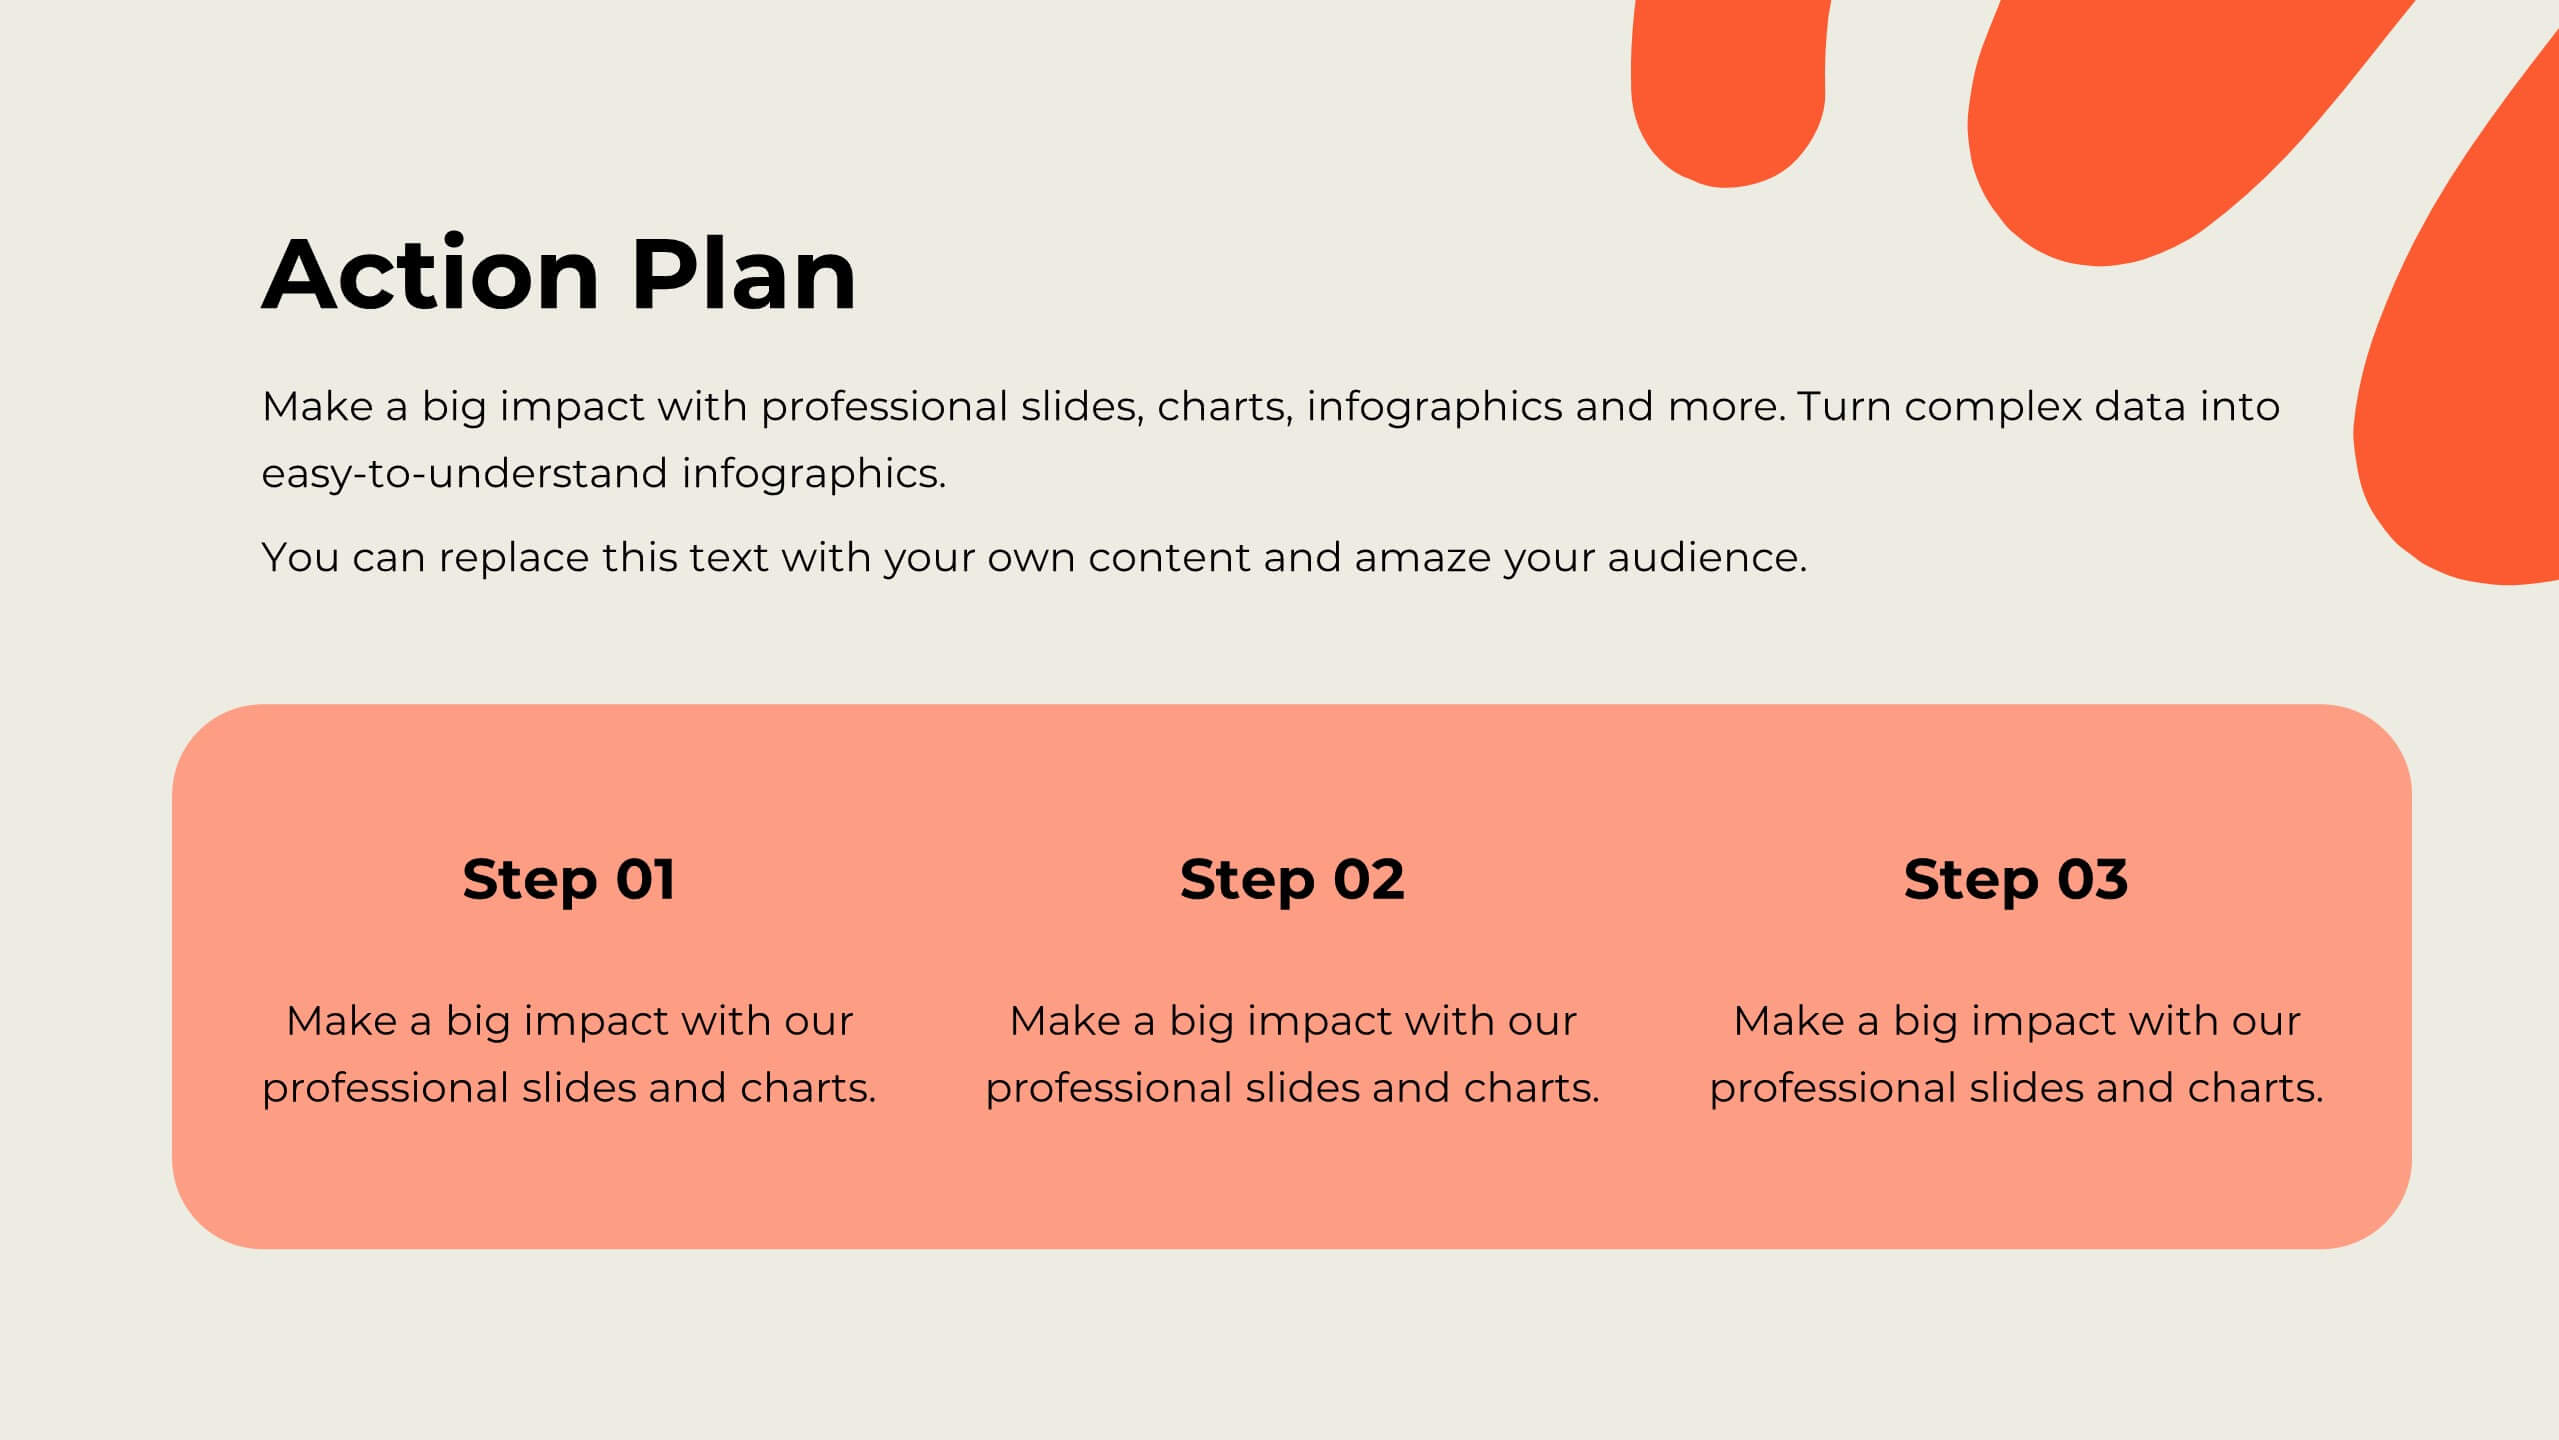
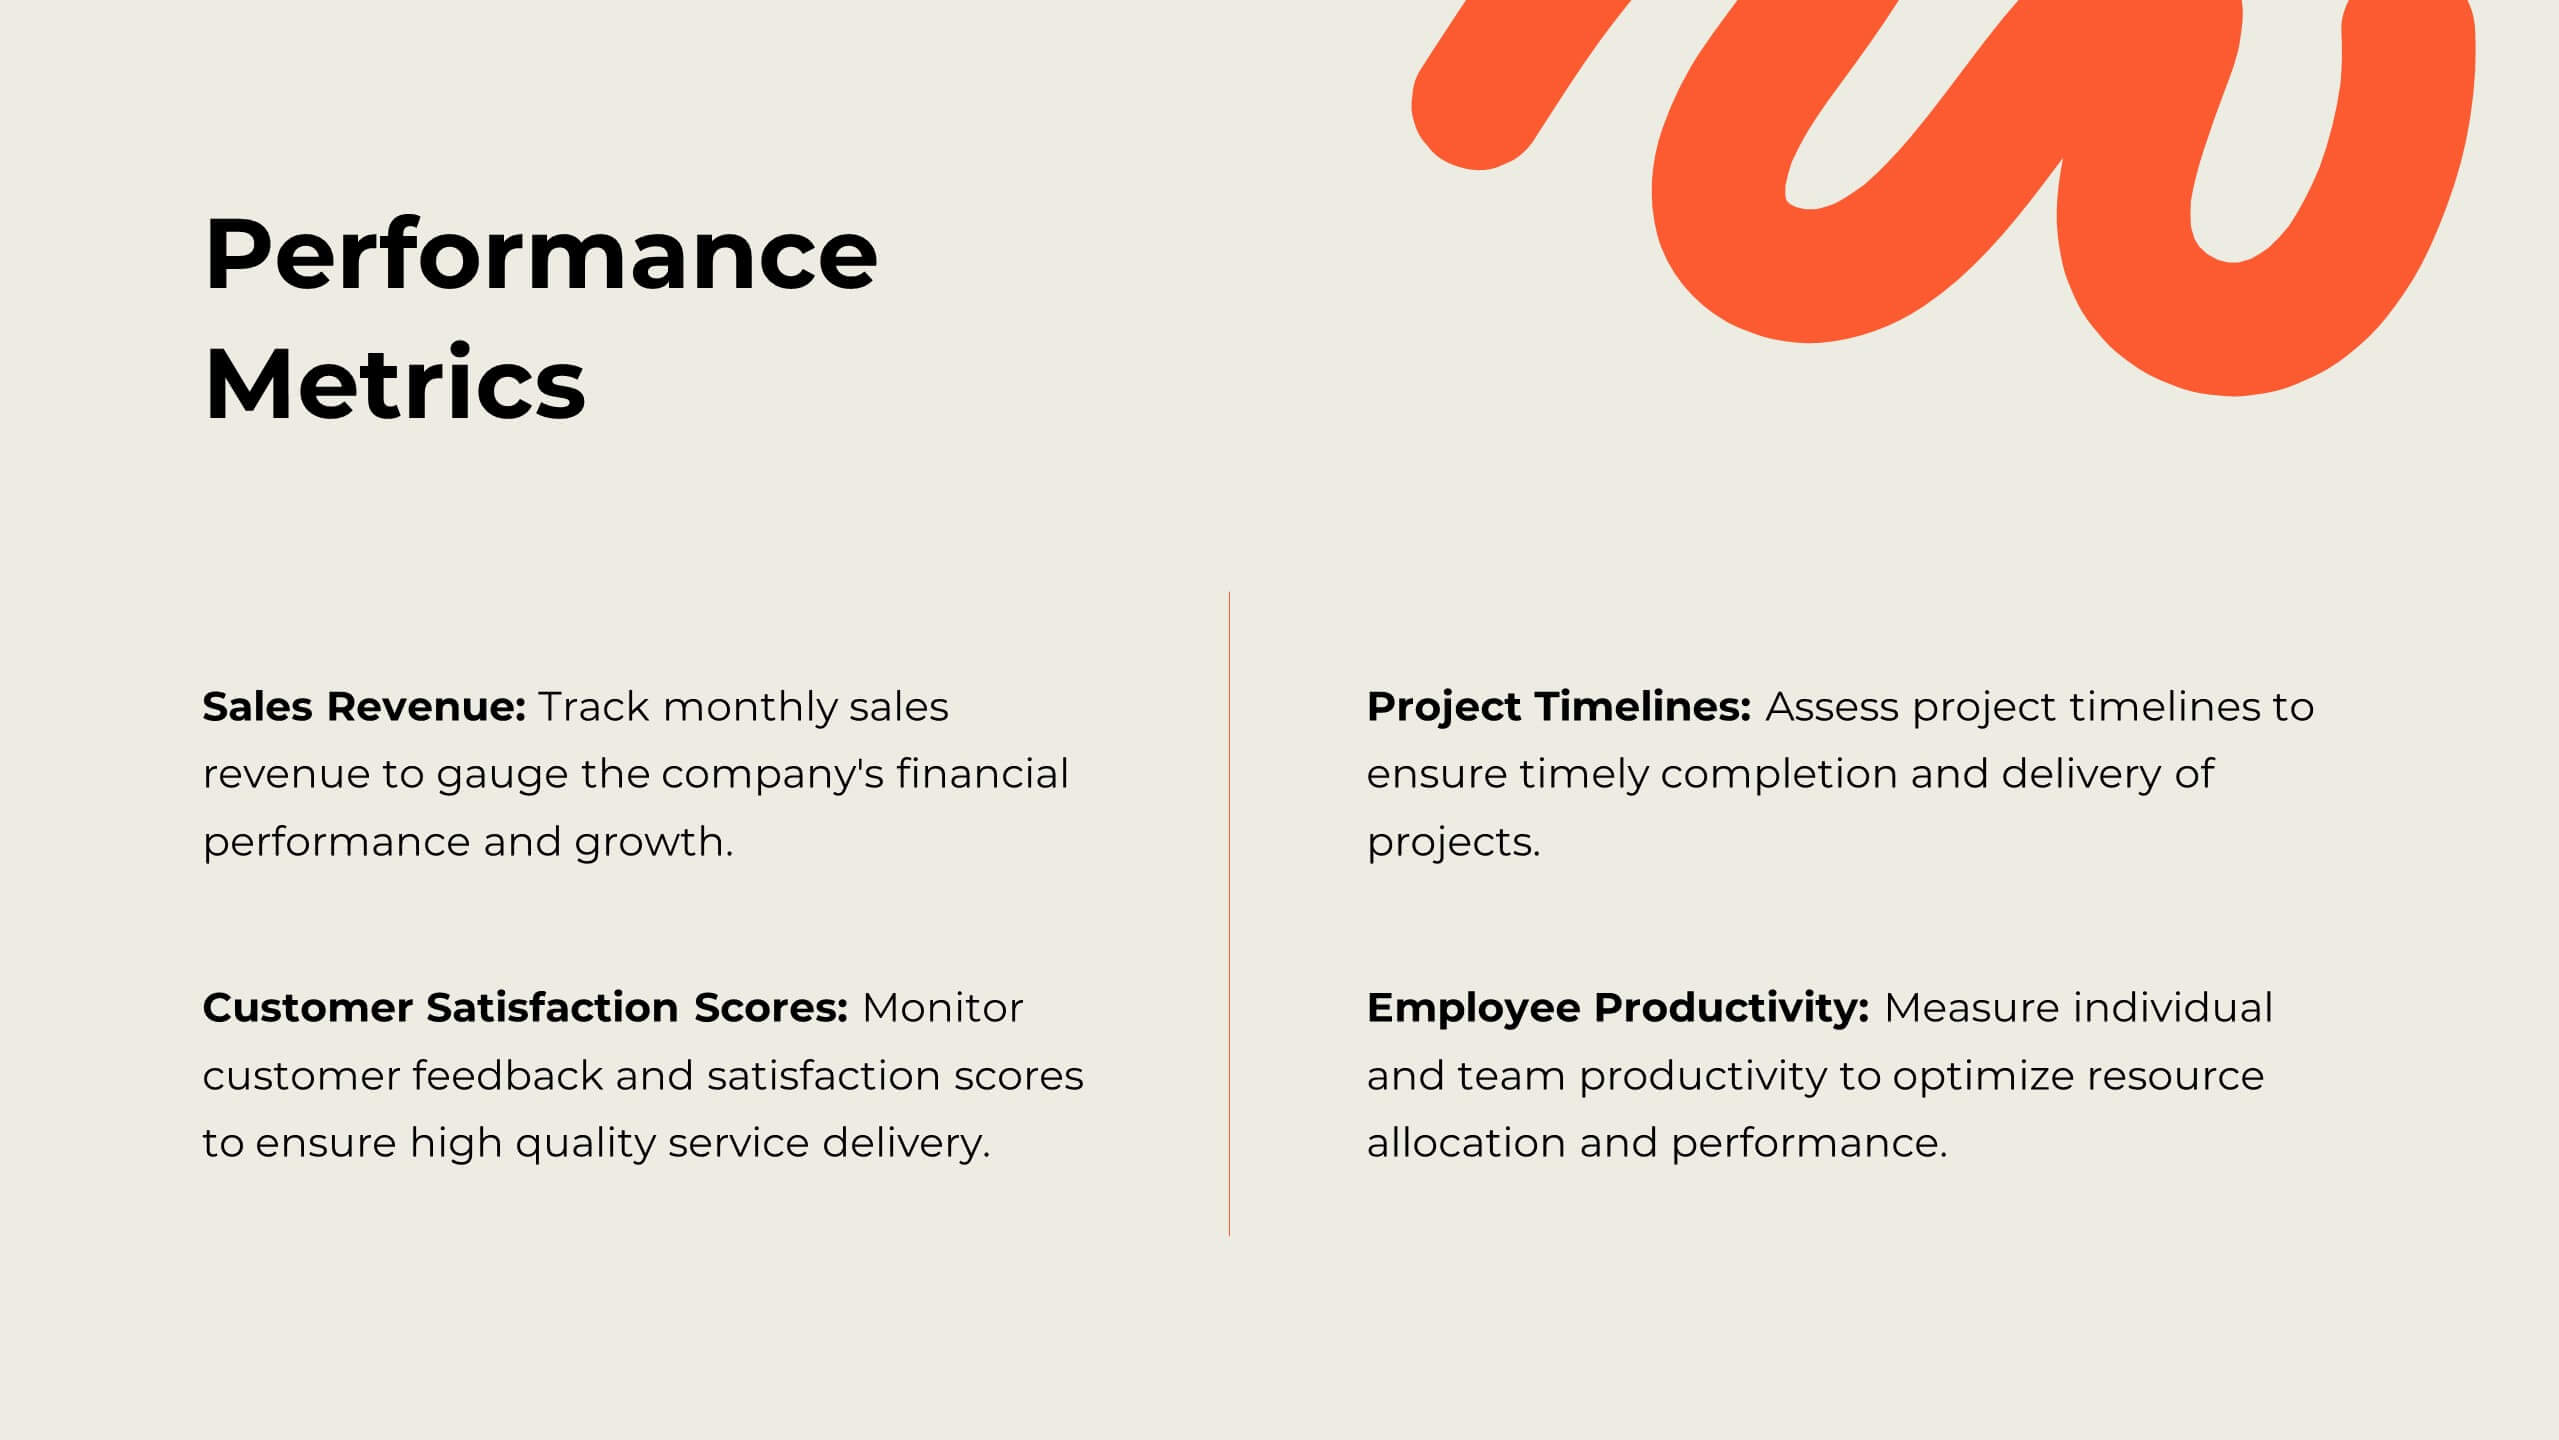
Cosmira Digital Strategy Presentation
This Digital Strategy Presentation provides a comprehensive framework for outlining business objectives, competitive analysis, and growth opportunities. It includes key sections such as SWOT analysis, performance metrics, and implementation plans. Ideal for businesses and marketers, the slides are fully editable and compatible with PowerPoint, Keynote, and Google Slides.


6 diapositivas
Overcoming Market Challenges Strategy Presentation
Tackle industry obstacles with clarity using this dynamic teamwork-themed visual. Featuring illustrated characters passing puzzle pieces along a circular process, this design is perfect for illustrating phased strategies, collaborative efforts, or key milestones. Great for strategic planning or team alignment presentations. Fully editable in PowerPoint, Keynote, and Google Slides.


7 diapositivas
Executive Summary Business Infographic
Elevate your executive insights with our meticulously crafted executive summary infographic. Drenched in the professionalism of blue tones and accented by the prestige of gold, our template encapsulates key findings and top-tier decisions in a comprehensive yet concise manner. Enriched with pinpoint infographics, emblematic icons, and relevant image placeholders, it conveys essential details with precision. Perfectly honed for Powerpoint, Keynote, or Google Slides. An indispensable resource for business leaders, managers, and analysts seeking to distill complex information into actionable insights. Present with authority; let every slide underscore pivotal decisions.


23 diapositivas
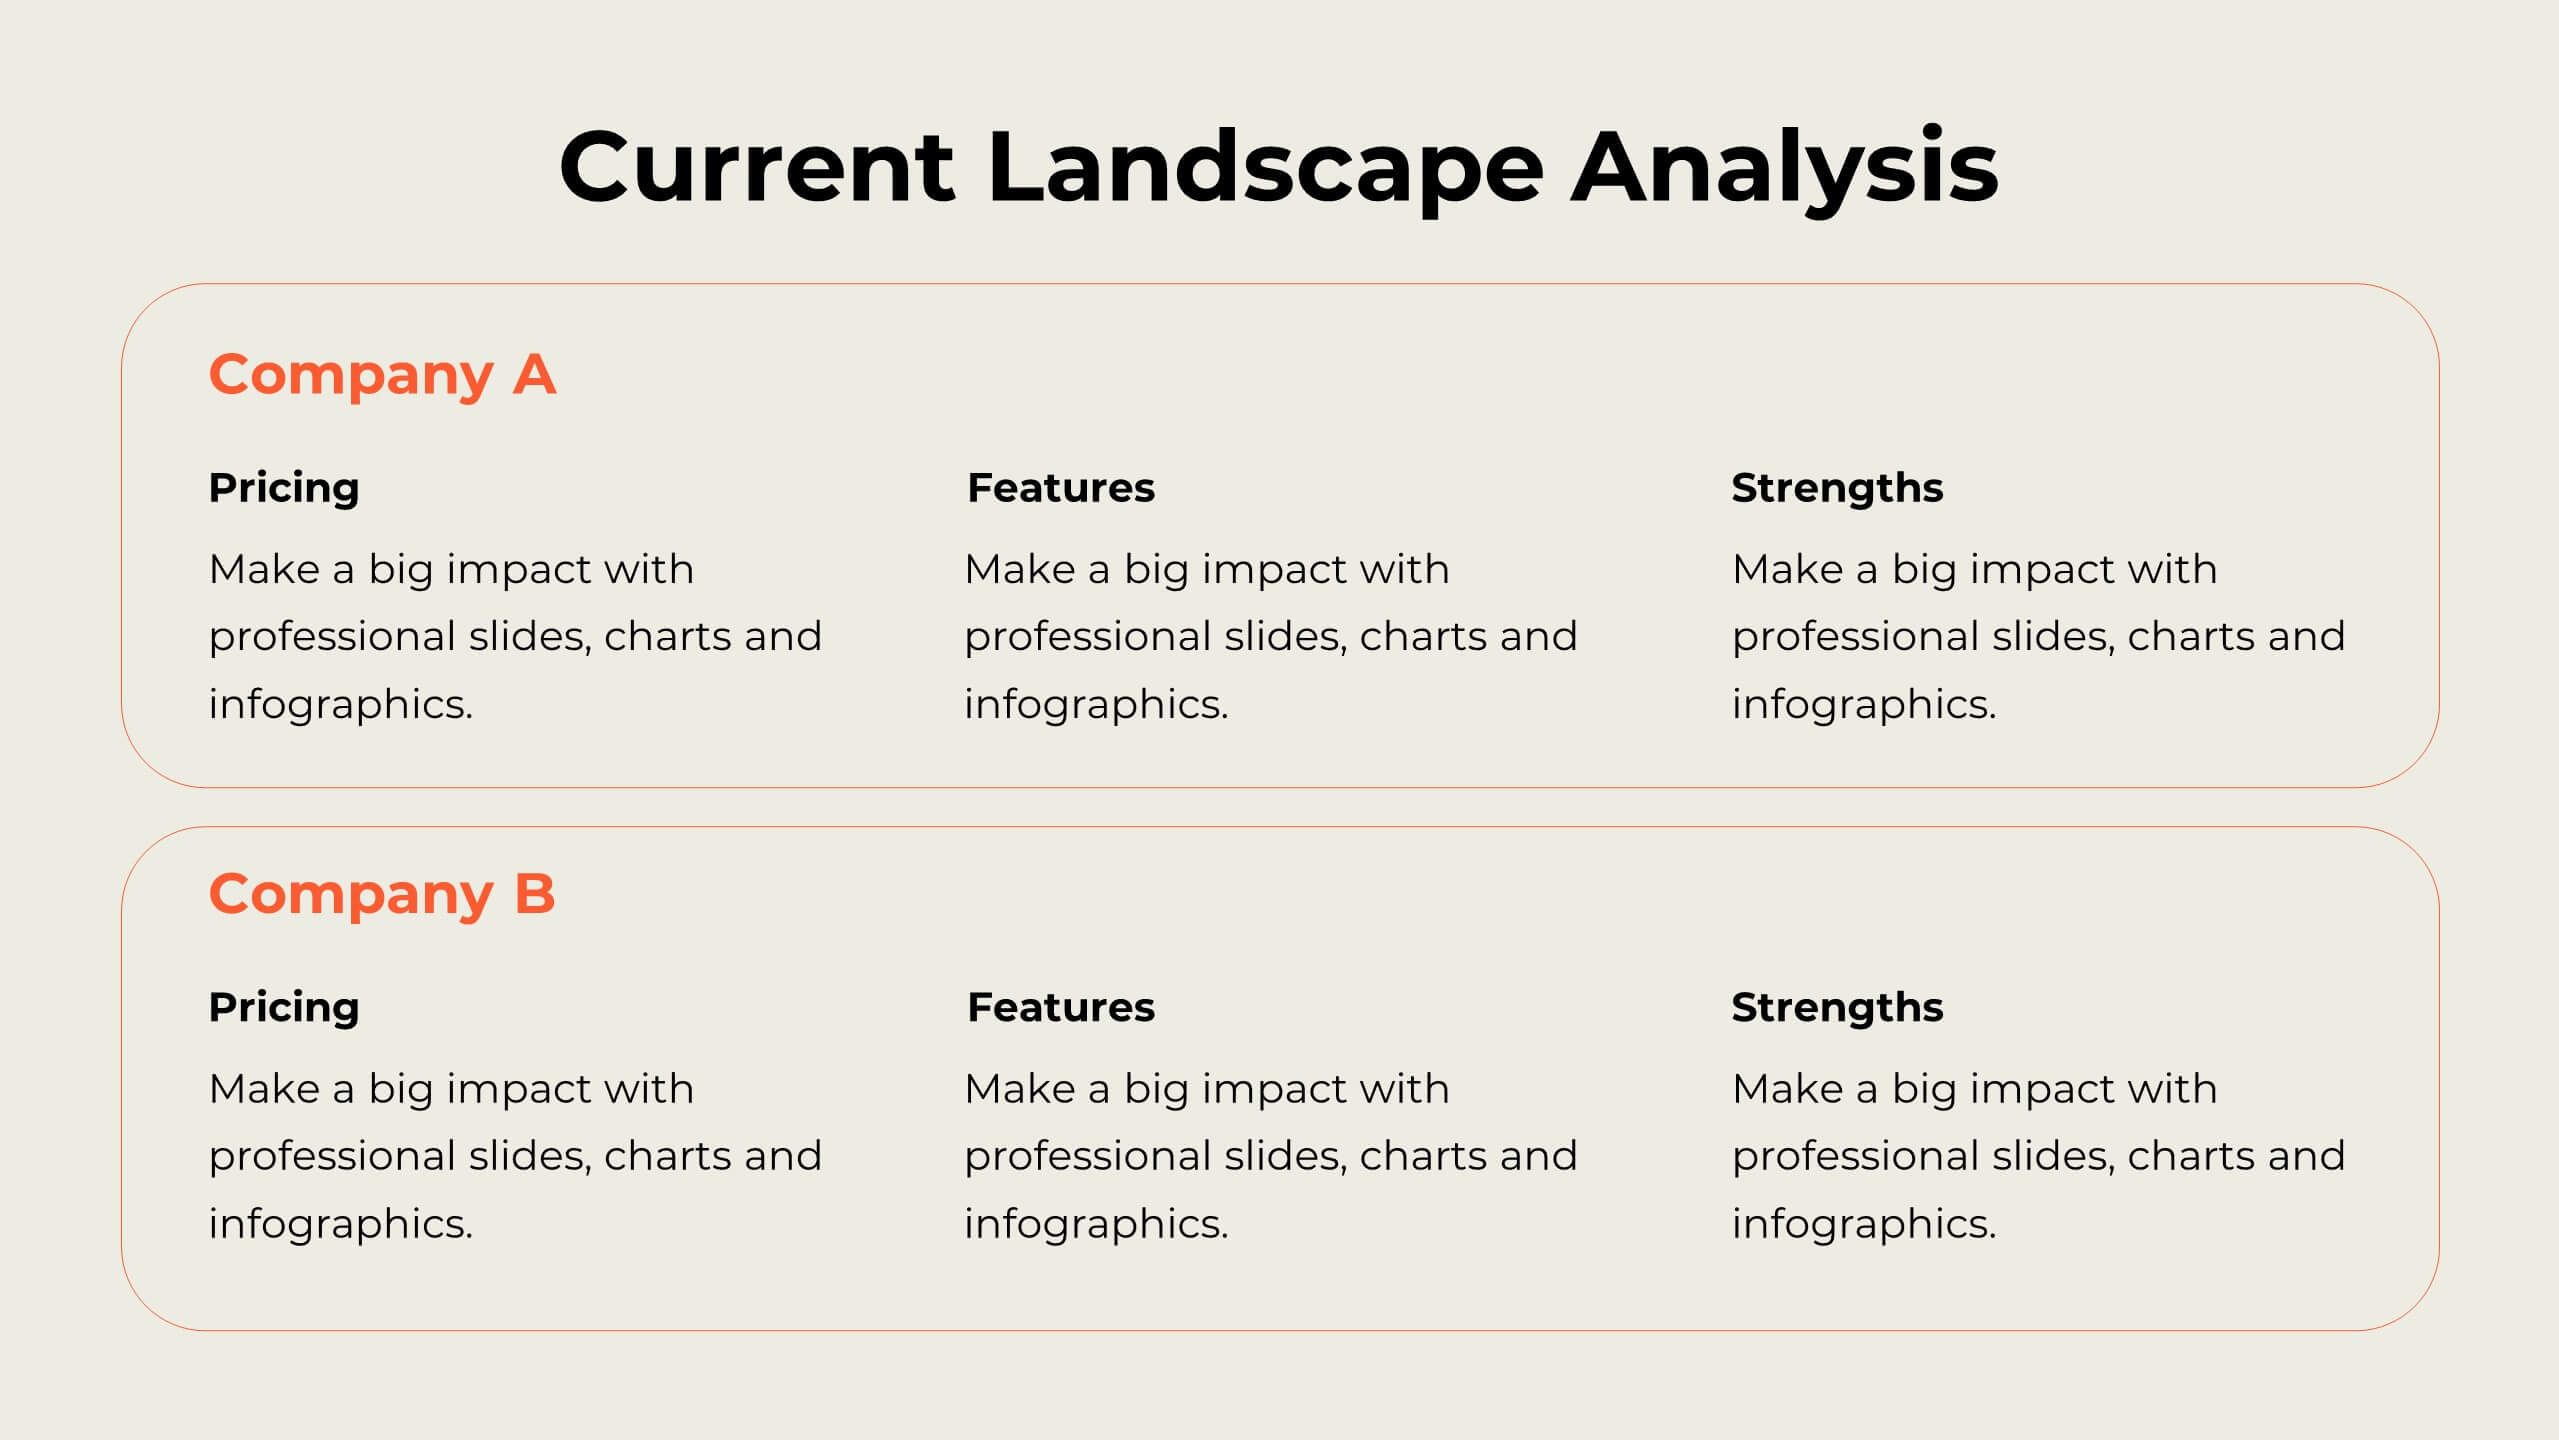
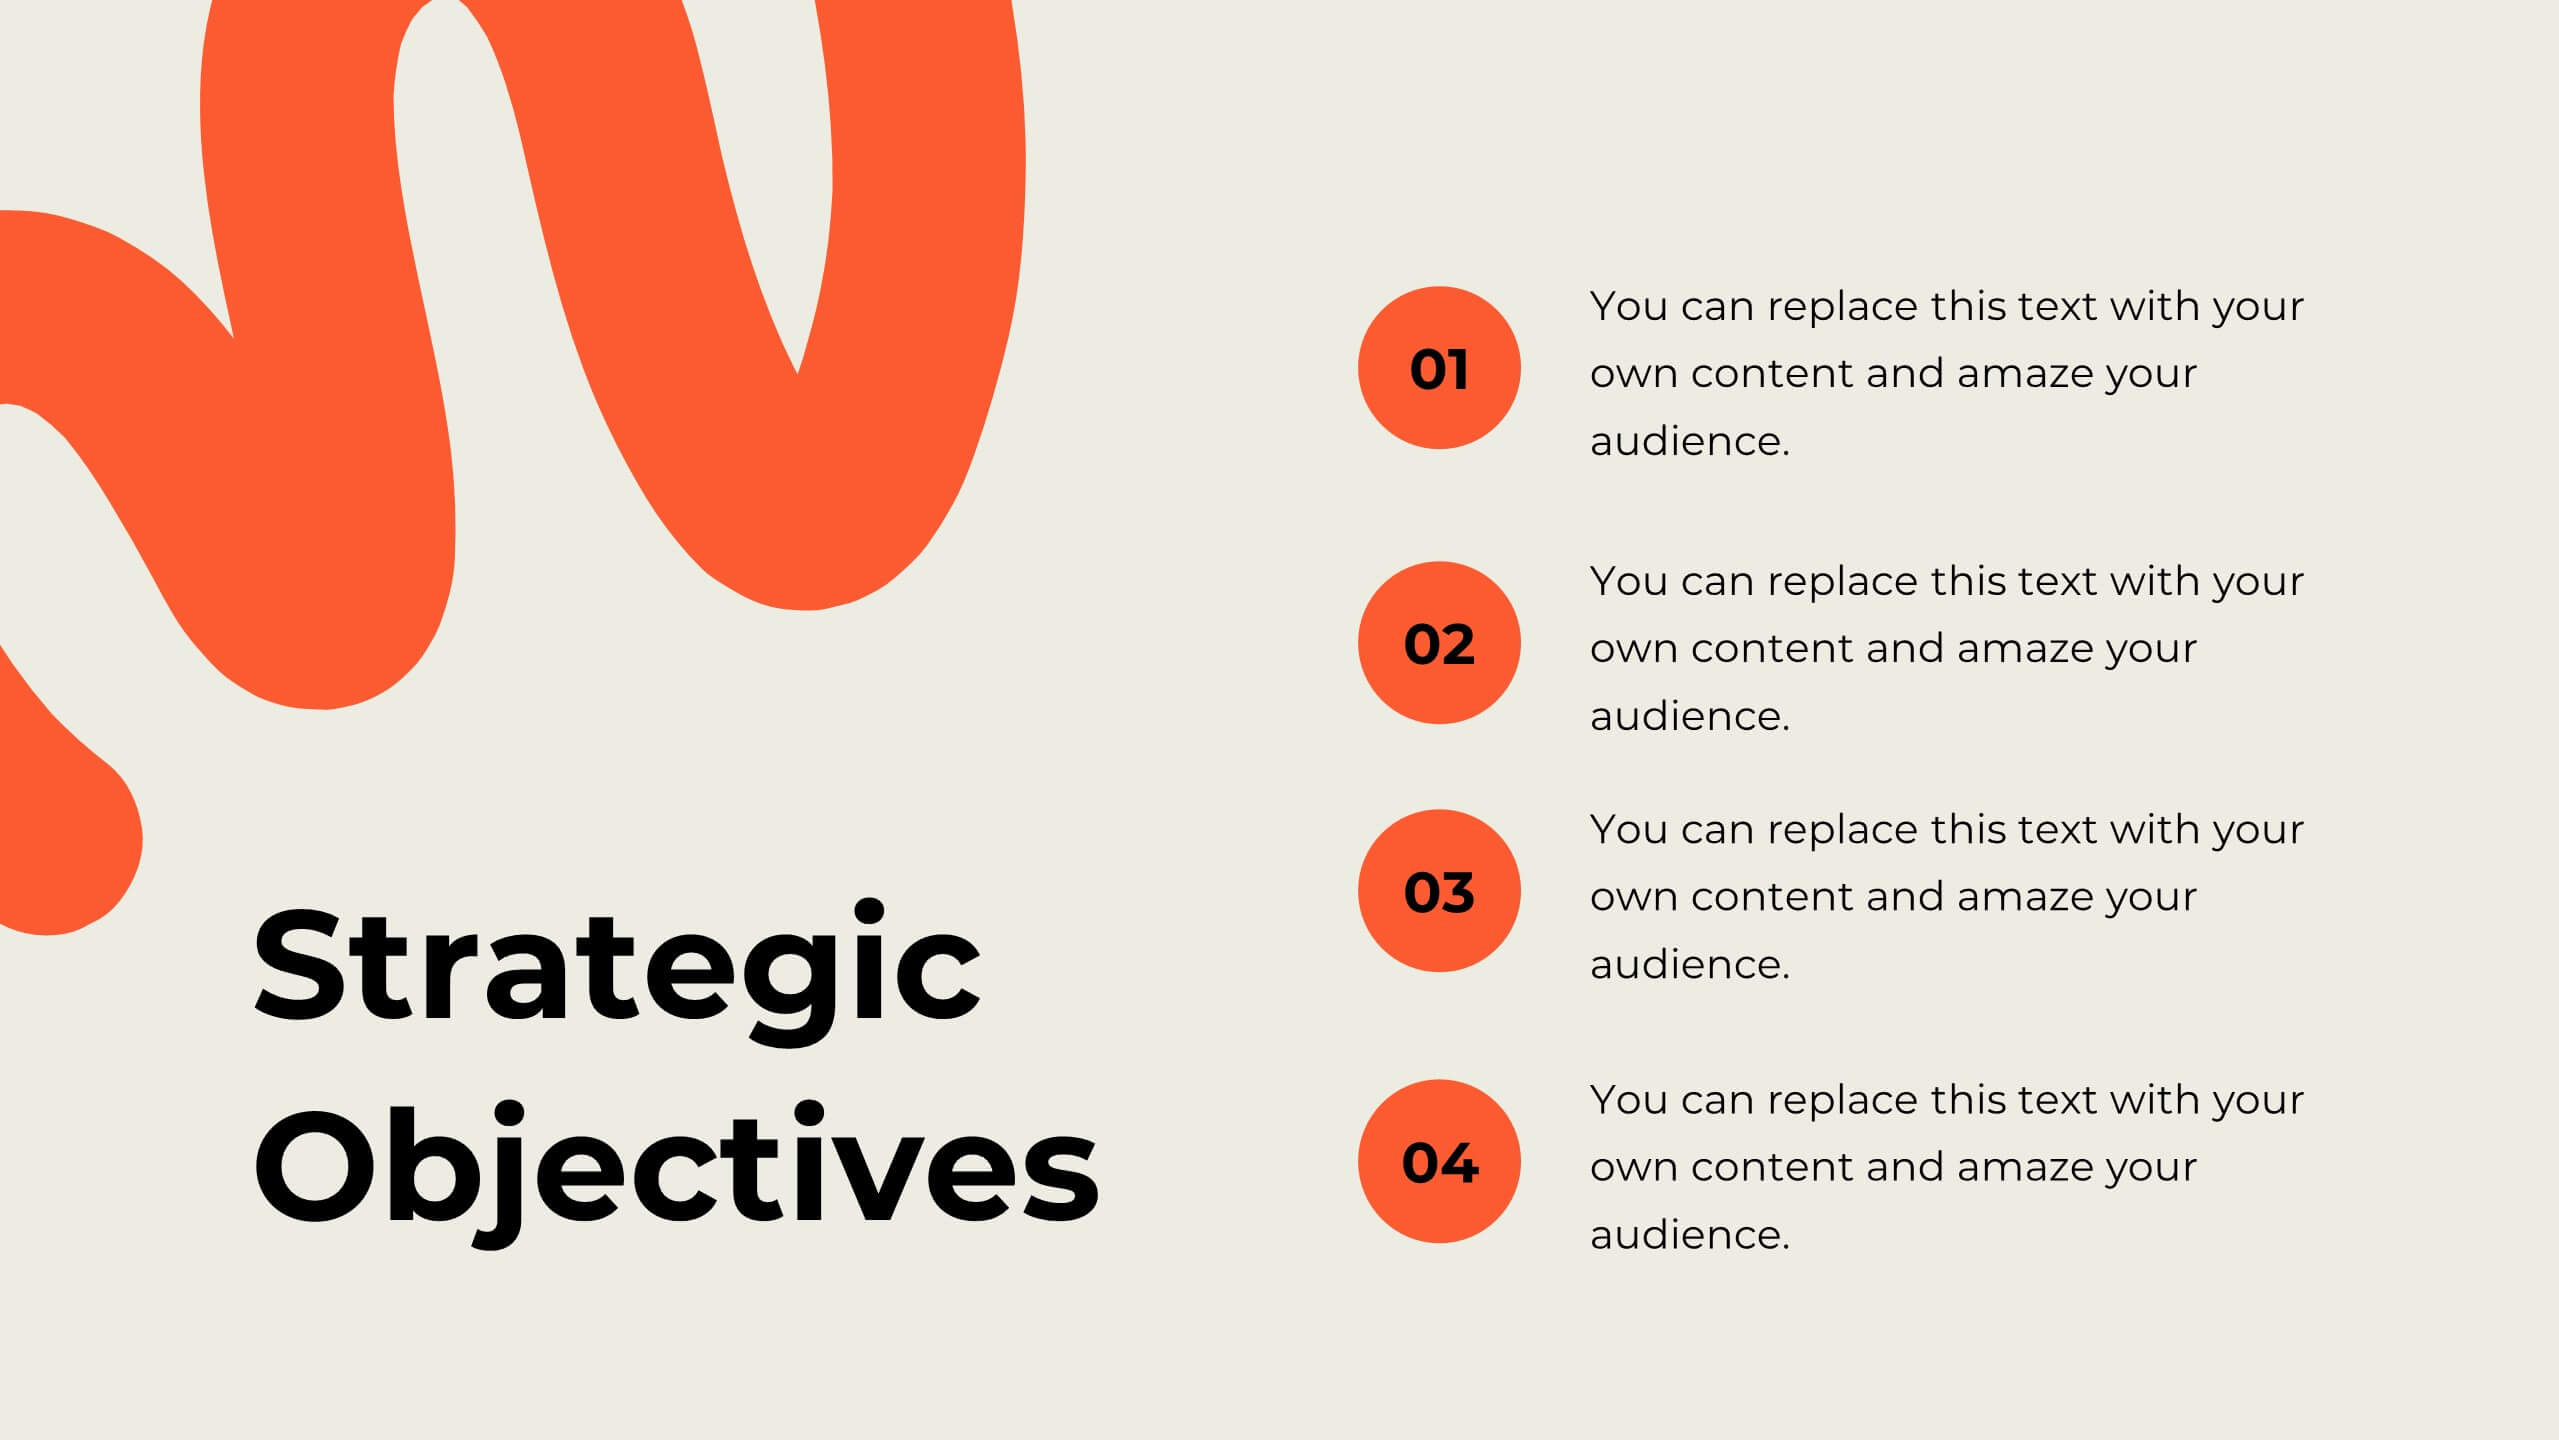
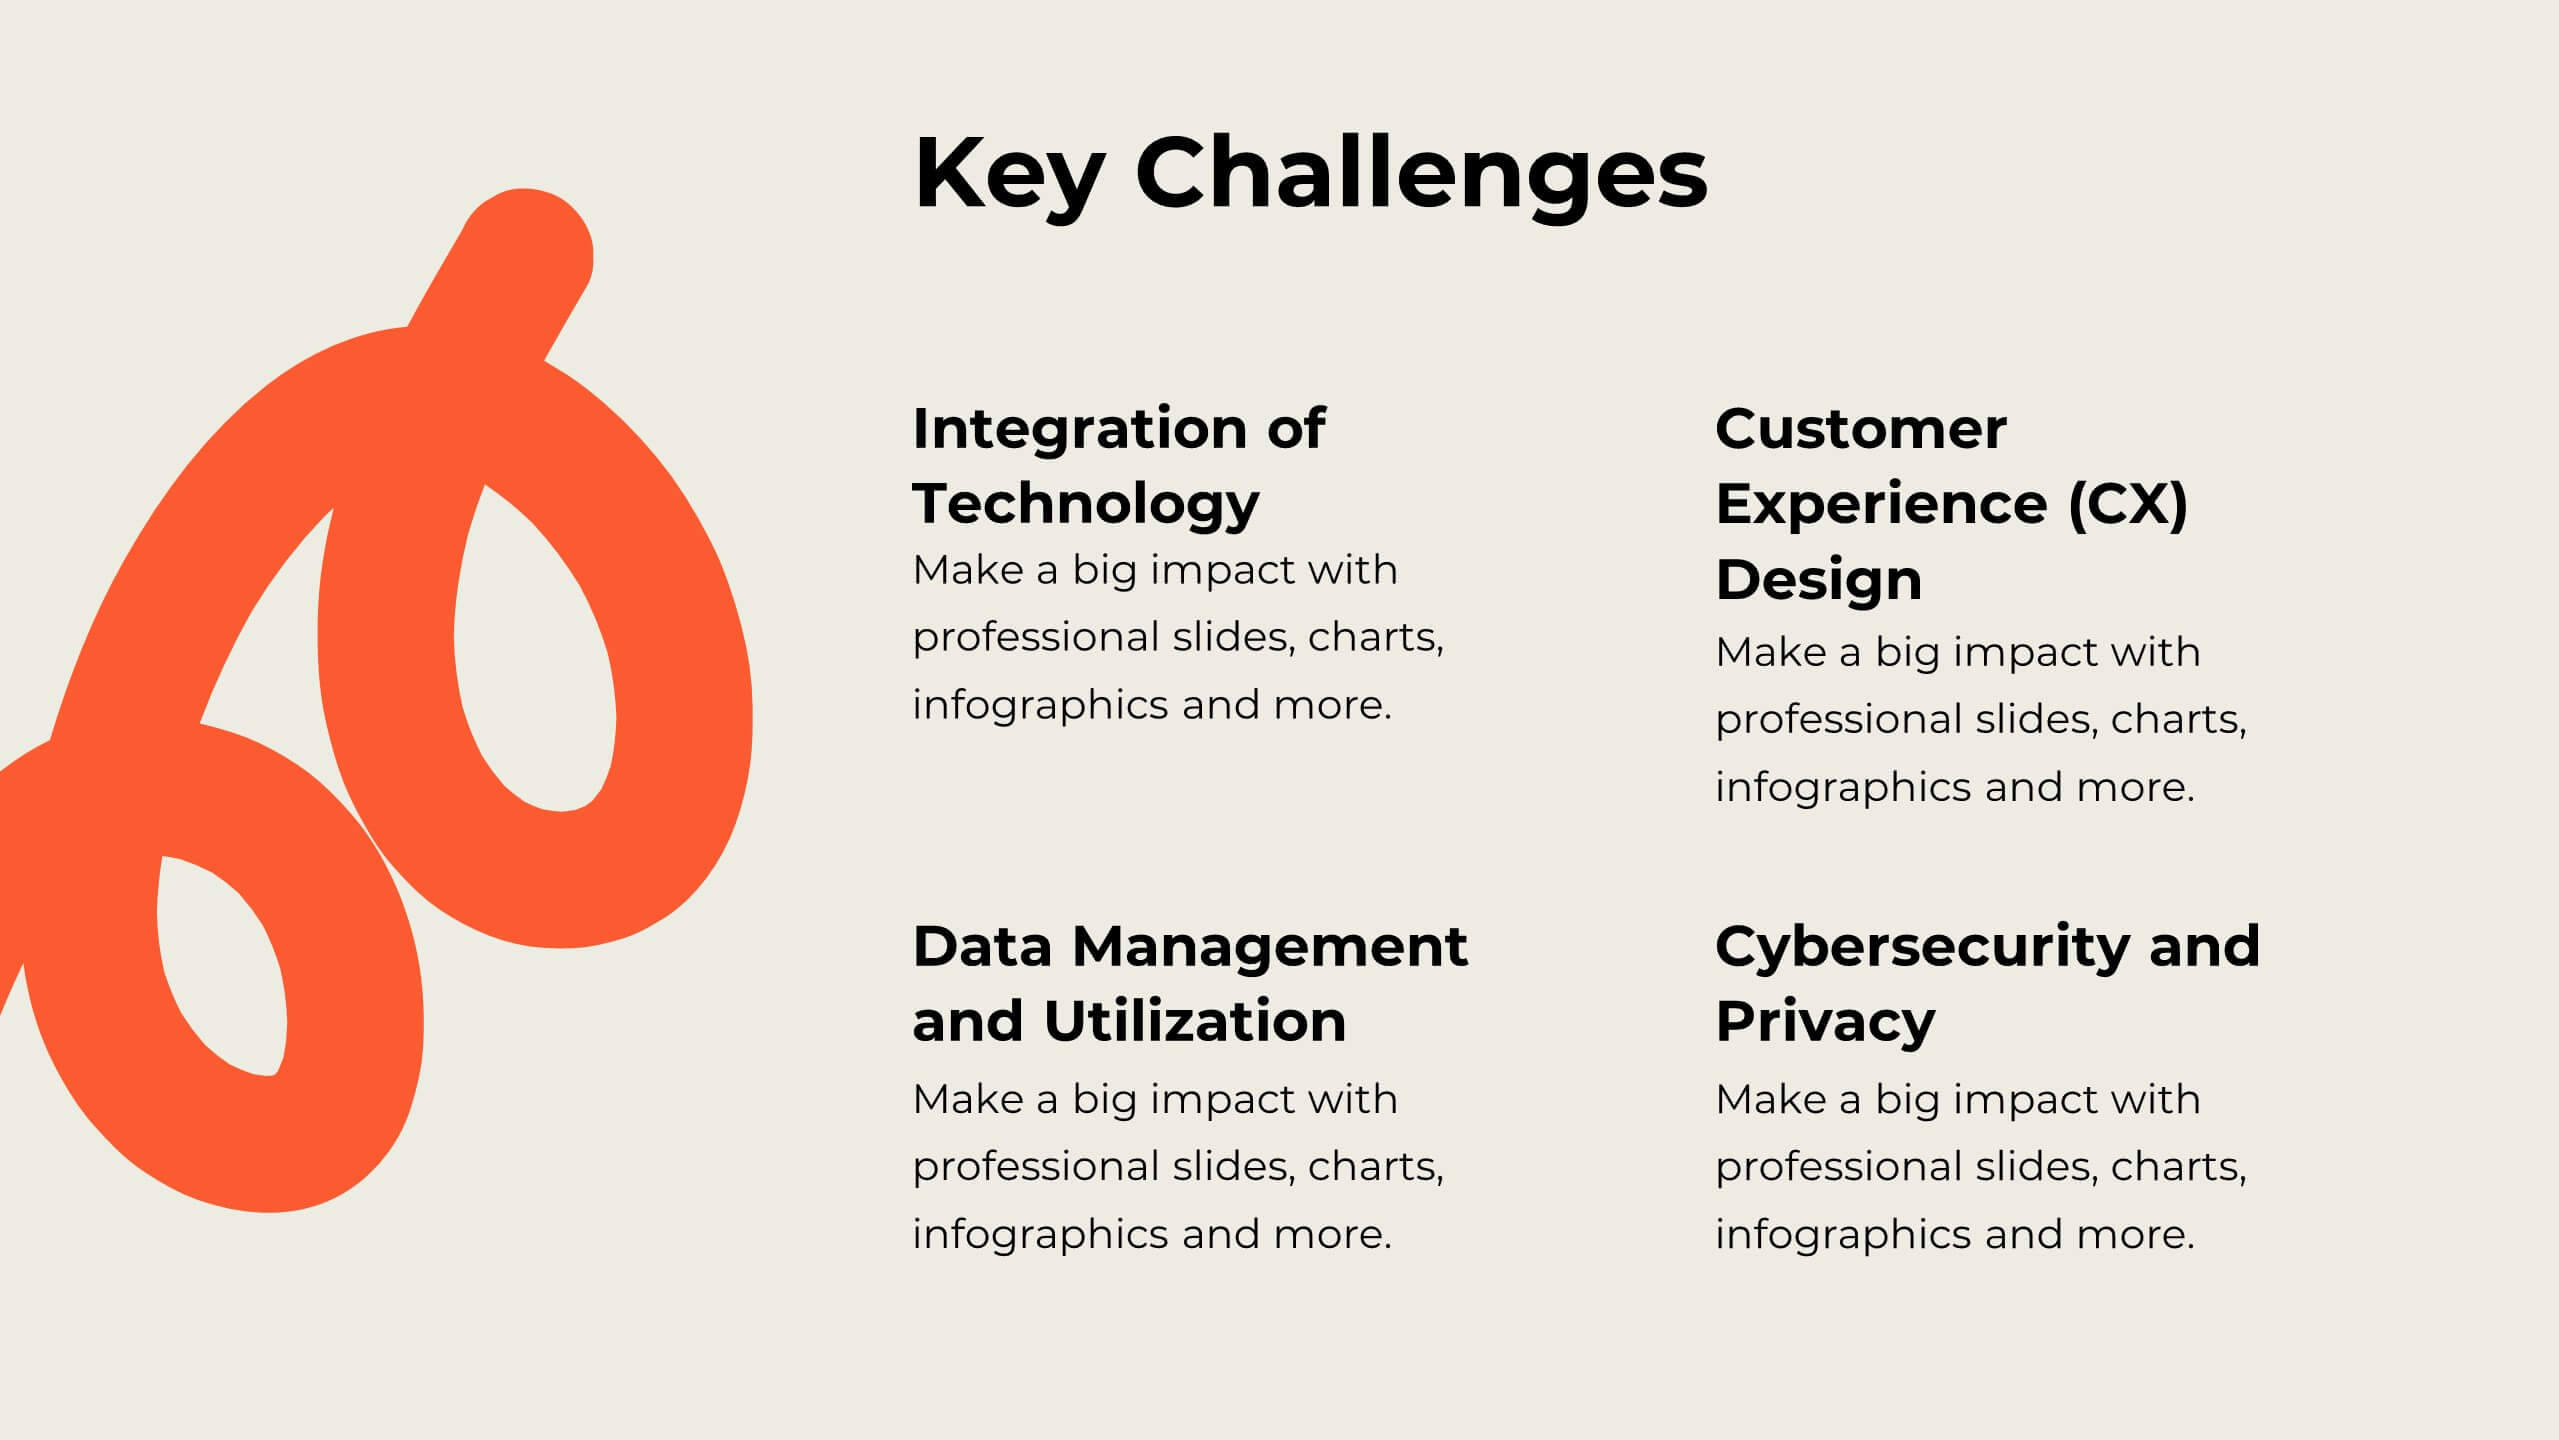
Mirage Digital Strategy Presentation
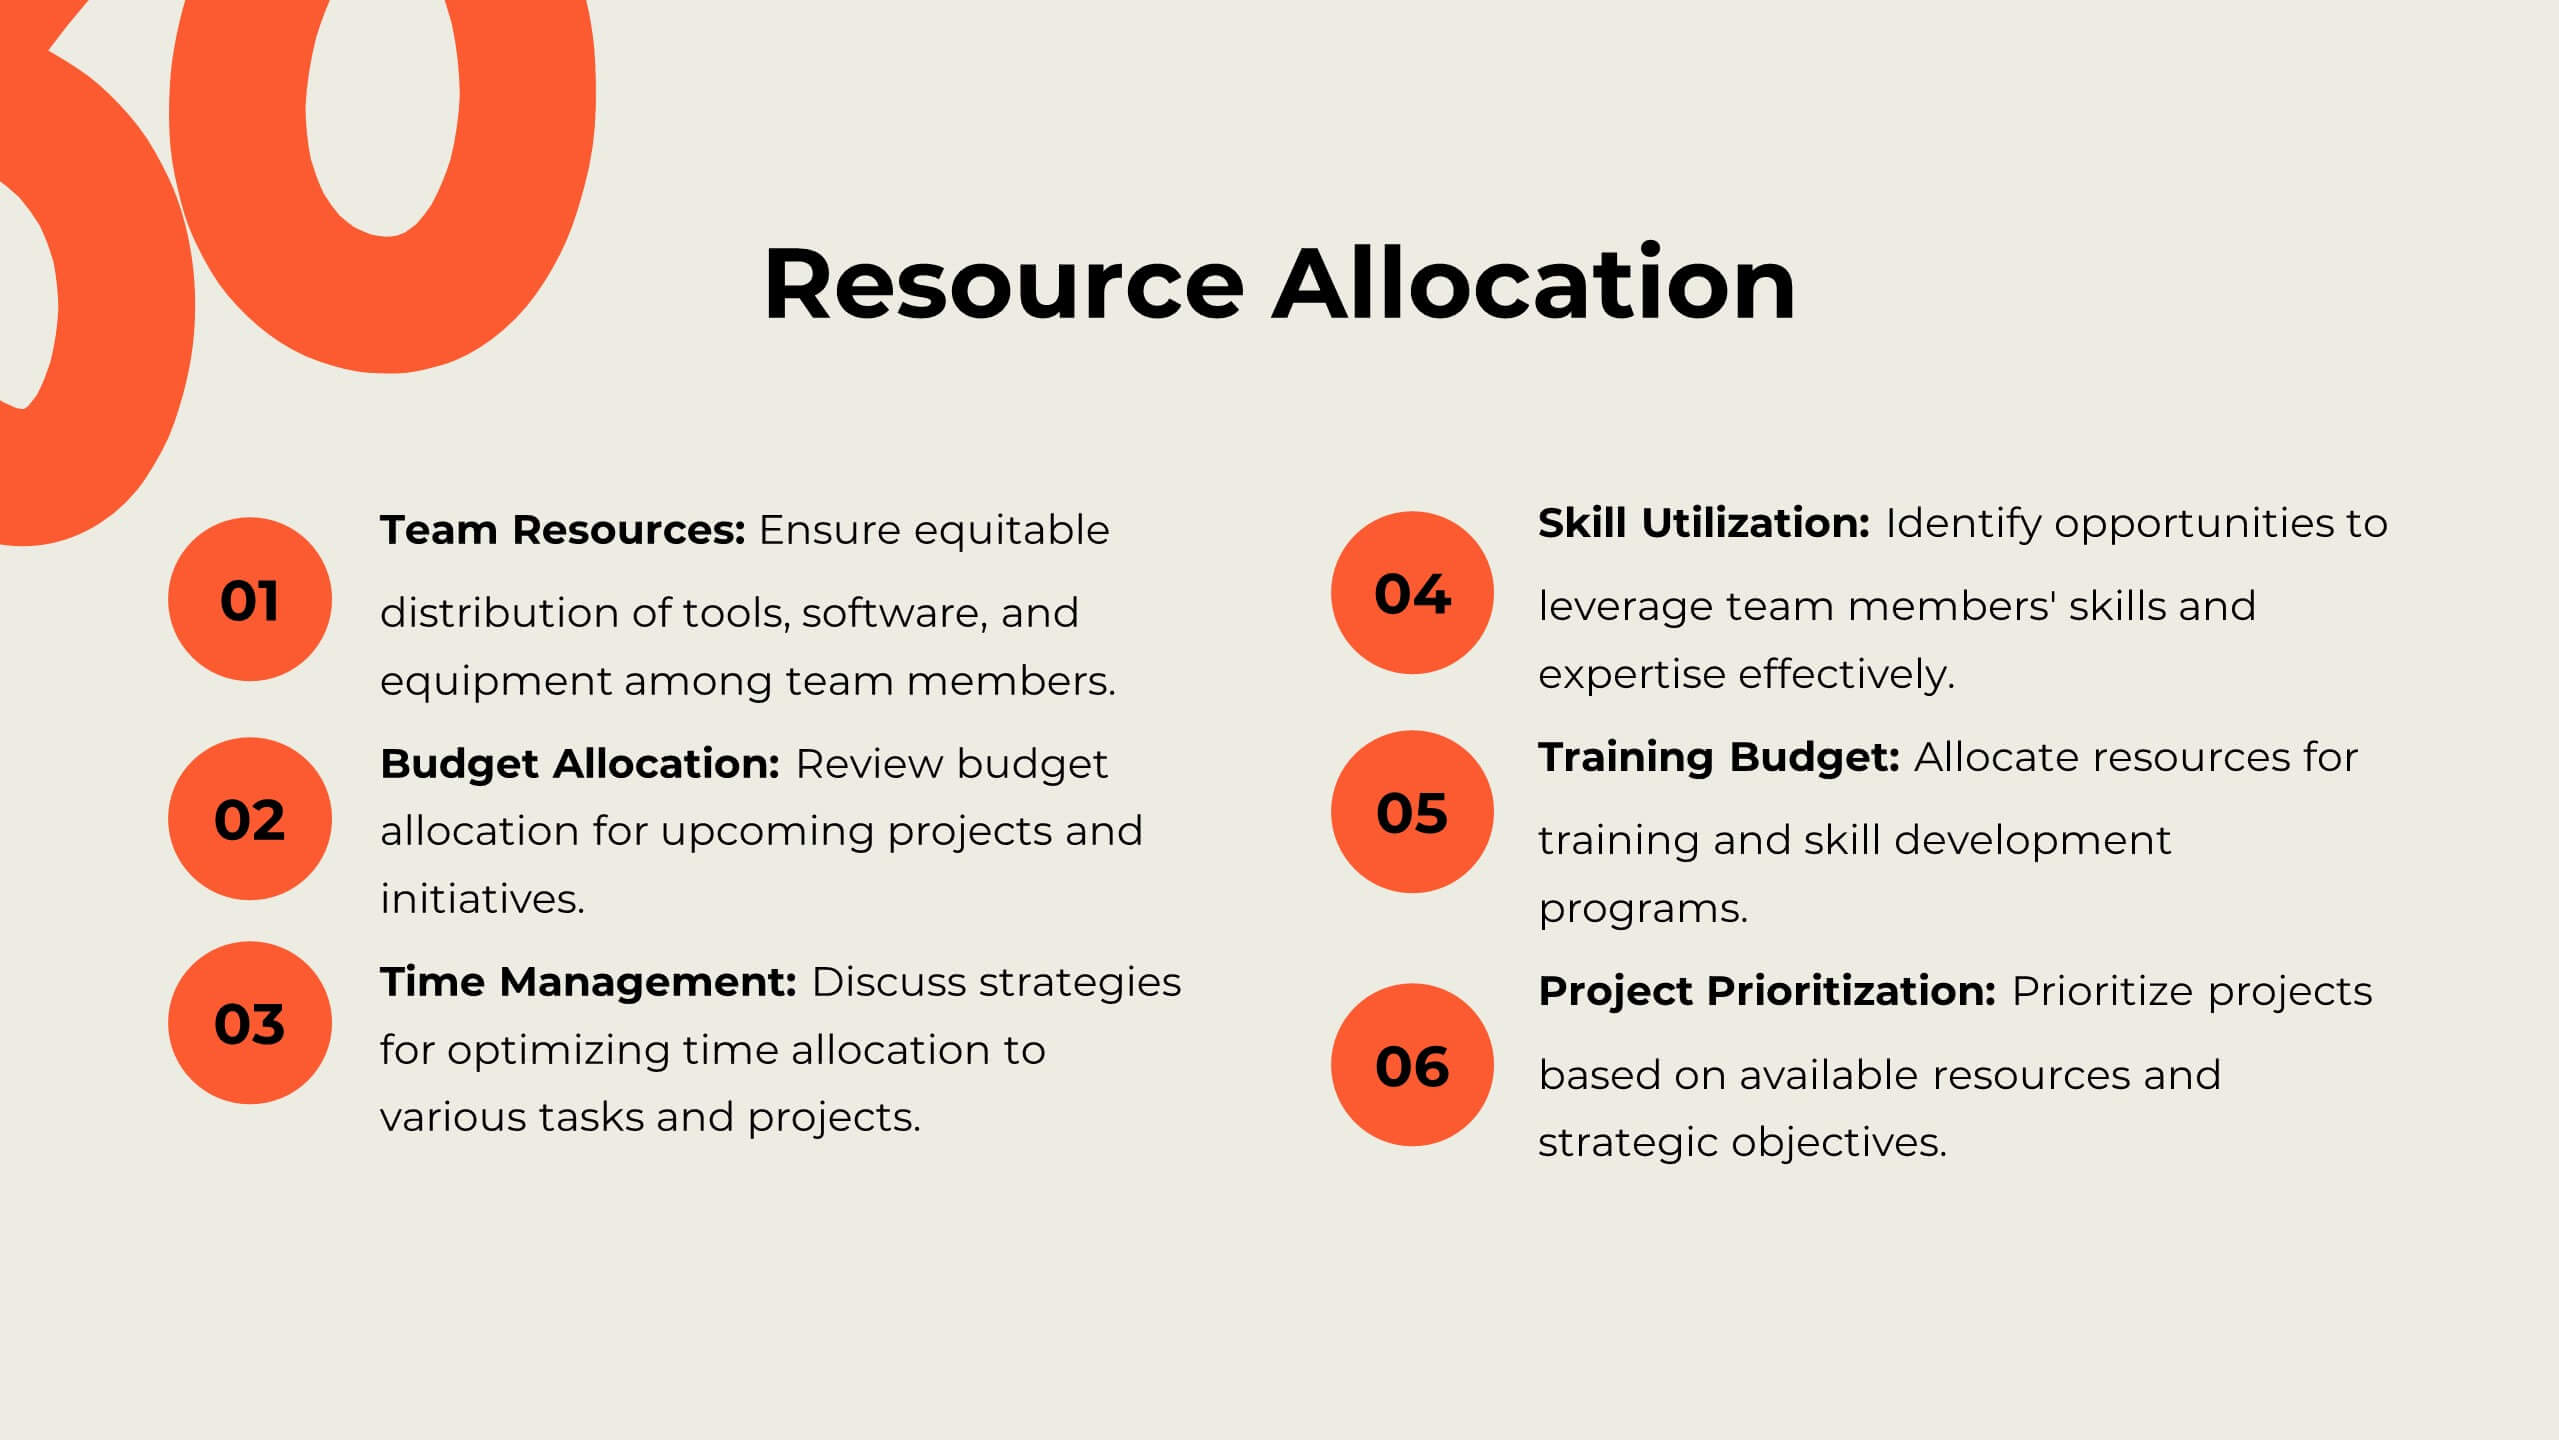
Revitalize your marketing efforts with this dynamic strategy plan template! Perfect for outlining objectives, competitive analysis, and target audience identification, it includes slides for SWOT analysis, resource allocation, and implementation plans. Engage stakeholders with vibrant visuals and comprehensive content. Compatible with PowerPoint, Keynote, and Google Slides for seamless presentations on any platform.


6 diapositivas
International Business Operations Layout Presentation
Showcase your company’s global workflow with this international operations map. Featuring a step-by-step arrow layout and matching location markers, it’s perfect for visualizing supply chains, regional tasks, or expansion strategies. Easily customizable and ideal for executive briefings, logistics updates, and global strategy decks. Compatible with PowerPoint, Keynote, and Google Slides.


4 diapositivas
Omnichannel Marketing Plan Overview Presentation
Visualize your cross-channel marketing strategy with this modern, megaphone-themed slide. Ideal for showcasing campaigns across multiple platforms, this layout helps communicate key marketing touchpoints in a clear and impactful format. Fully editable in PowerPoint, Keynote, and Google Slides—perfect for aligning marketing teams and presenting strategic plans with ease.


5 diapositivas
European Countries Editable Map Presentation
Bring your data to life with a detailed and modern map layout that showcases insights across Europe. Perfect for visualizing country comparisons, regional statistics, or business expansion plans, this clean design ensures clarity and impact. Fully compatible with PowerPoint, Keynote, and Google Slides for easy editing and presentation.