


Características


¿Tienes alguna pregunta?
Recomendar


21 diapositivas
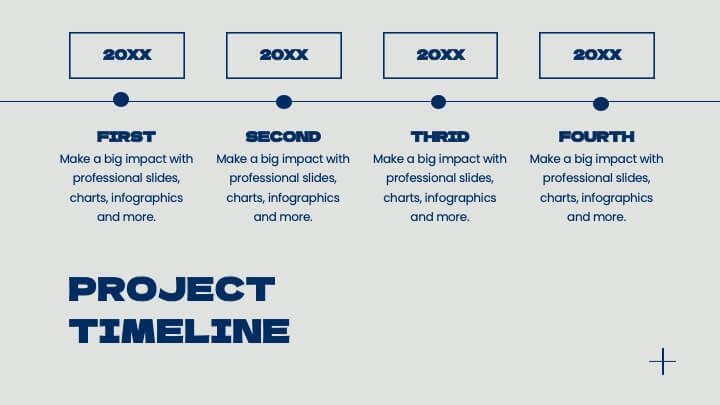
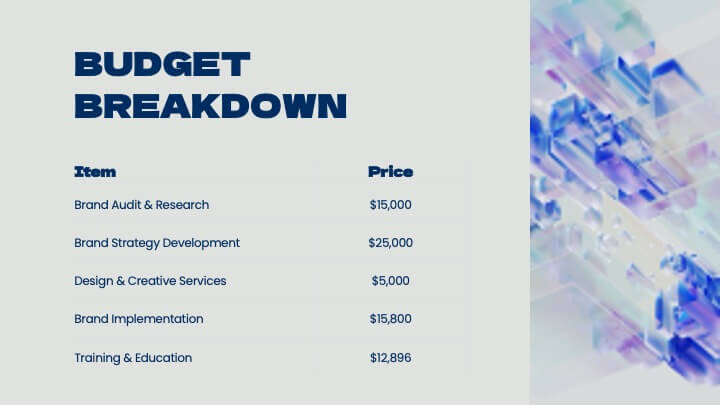
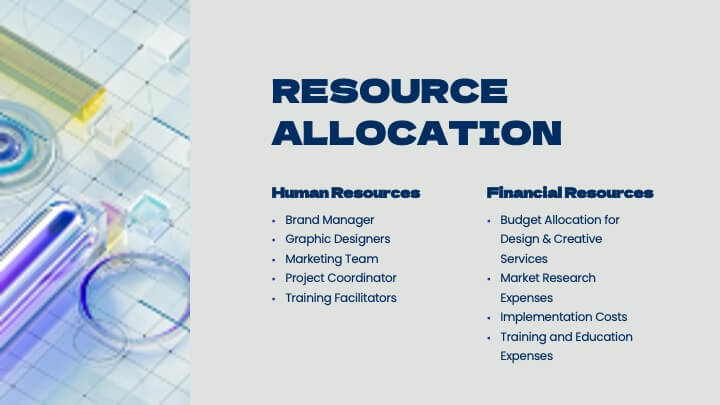
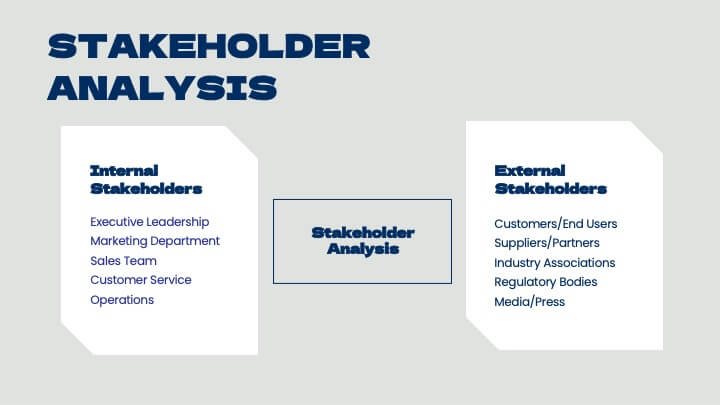
Nucleus Project Timeline Presentation
Plan with precision using this clean and modern Project Timeline Presentation Template. Highlight key phases, milestones, and deliverables with visually organized sections such as Project Overview, Objectives, Budget Breakdown, Resource Allocation, and Risk Management. Perfect for presenting timelines, evaluation criteria, and next steps to stakeholders. Fully customizable and compatible with PowerPoint, Keynote, and Google Slides.


4 diapositivas
IT Network Infrastructure
Simplify the complexity of your digital ecosystem with this IT Network Infrastructure presentation. Designed to visualize connectivity, servers, and system architecture, this layout is perfect for IT teams, consultants, and tech-focused reports. Fully editable in PowerPoint, Keynote, and Google Slides for seamless integration into your workflow.


6 diapositivas
Corporate Training Plan Layout Presentation
Bring structure and clarity to your business training process with this clean and professional layout. Each gear-shaped section highlights a key stage in your program, allowing you to present goals, skills, and milestones with precision. Ideal for planning sessions or executive briefings, this template is fully compatible with PowerPoint, Keynote, and Google Slides.


23 diapositivas
Soundscape Marketing Strategy Plan Presentation
Craft a compelling marketing strategy with a modern and sophisticated presentation template designed for marketers, agencies, and entrepreneurs. Perfectly organized, this template allows you to present strategic objectives, SWOT analysis, and competitive landscape insights in a structured manner. Communicate key challenges, value propositions, and resource allocations with sleek, minimalistic slides. Visualize your timeline, team expertise, and communication strategy using editable graphics and streamlined layouts. Dedicated slides for performance metrics and risk management ensure your plan resonates with stakeholders and decision-makers. Compatible with PowerPoint, Google Slides, and Keynote, this fully customizable template empowers you to deliver your strategy with impact and clarity. Elevate your presentation with professional design elements that captivate your audience and drive actionable results.


5 diapositivas
Attention to Action Model Framework Presentation
This sleek presentation visualizes the four key stages—Attention, Interest, Desire, and Action—in a clear, pyramid-based layout. Ideal for marketing, sales, or behavioral strategy discussions. Each step is color-coded for emphasis, making it easy to follow and present. Fully editable in Canva to fit your brand and messaging needs.


12 diapositivas
Banking Offers and Card Perks Overview Presentation
Showcase financial benefits clearly with this Banking Offers and Card Perks Overview Presentation. Designed with a bold payment terminal and card visual, this layout helps you highlight key rewards, cashback deals, and special cardholder perks. Ideal for banks, fintechs, and retail loyalty programs. Fully editable in PowerPoint, Keynote, and Google Slides.


6 diapositivas
Business Case Study and ROI Breakdown Presentation
Communicate your business impact clearly with the Business Case Study and ROI Breakdown Presentation. Featuring layered building-block visuals, this template is ideal for illustrating return on investment, strategic value, or project outcomes. Perfect for executive briefings and stakeholder presentations. Fully editable in PowerPoint, Keynote, and Google Slides.


26 diapositivas
Haeleigh Presentation Template
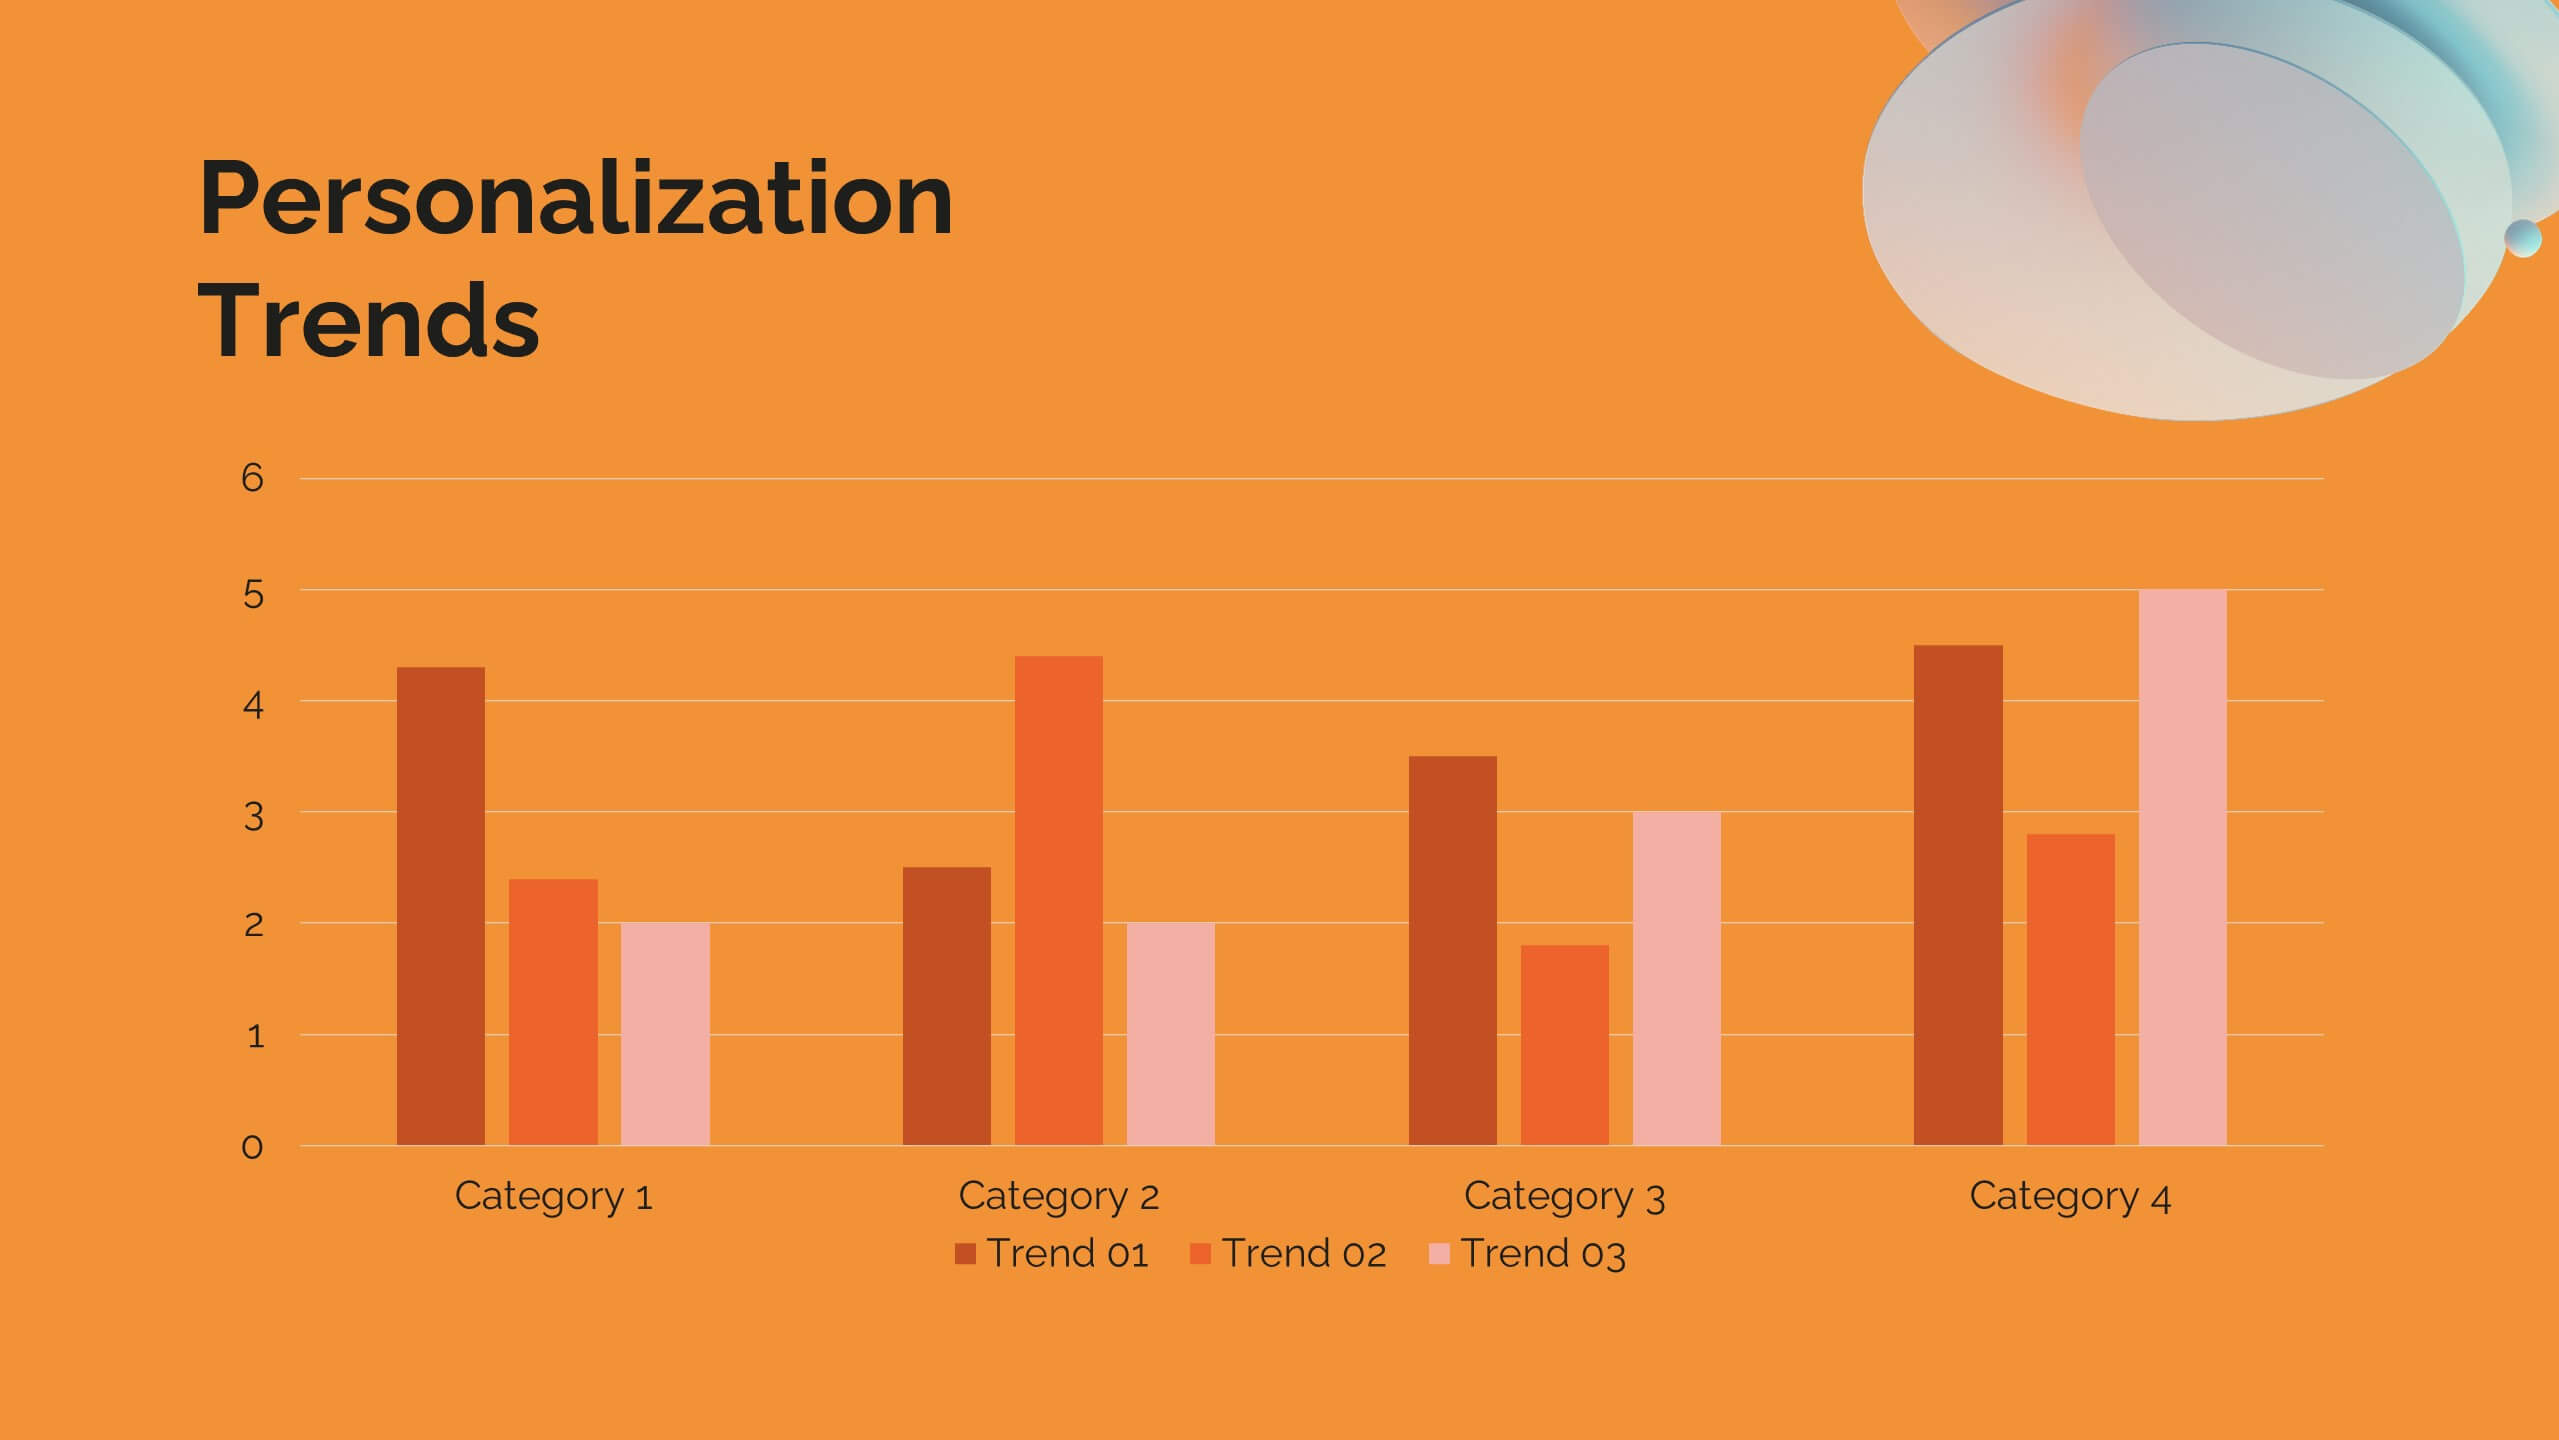
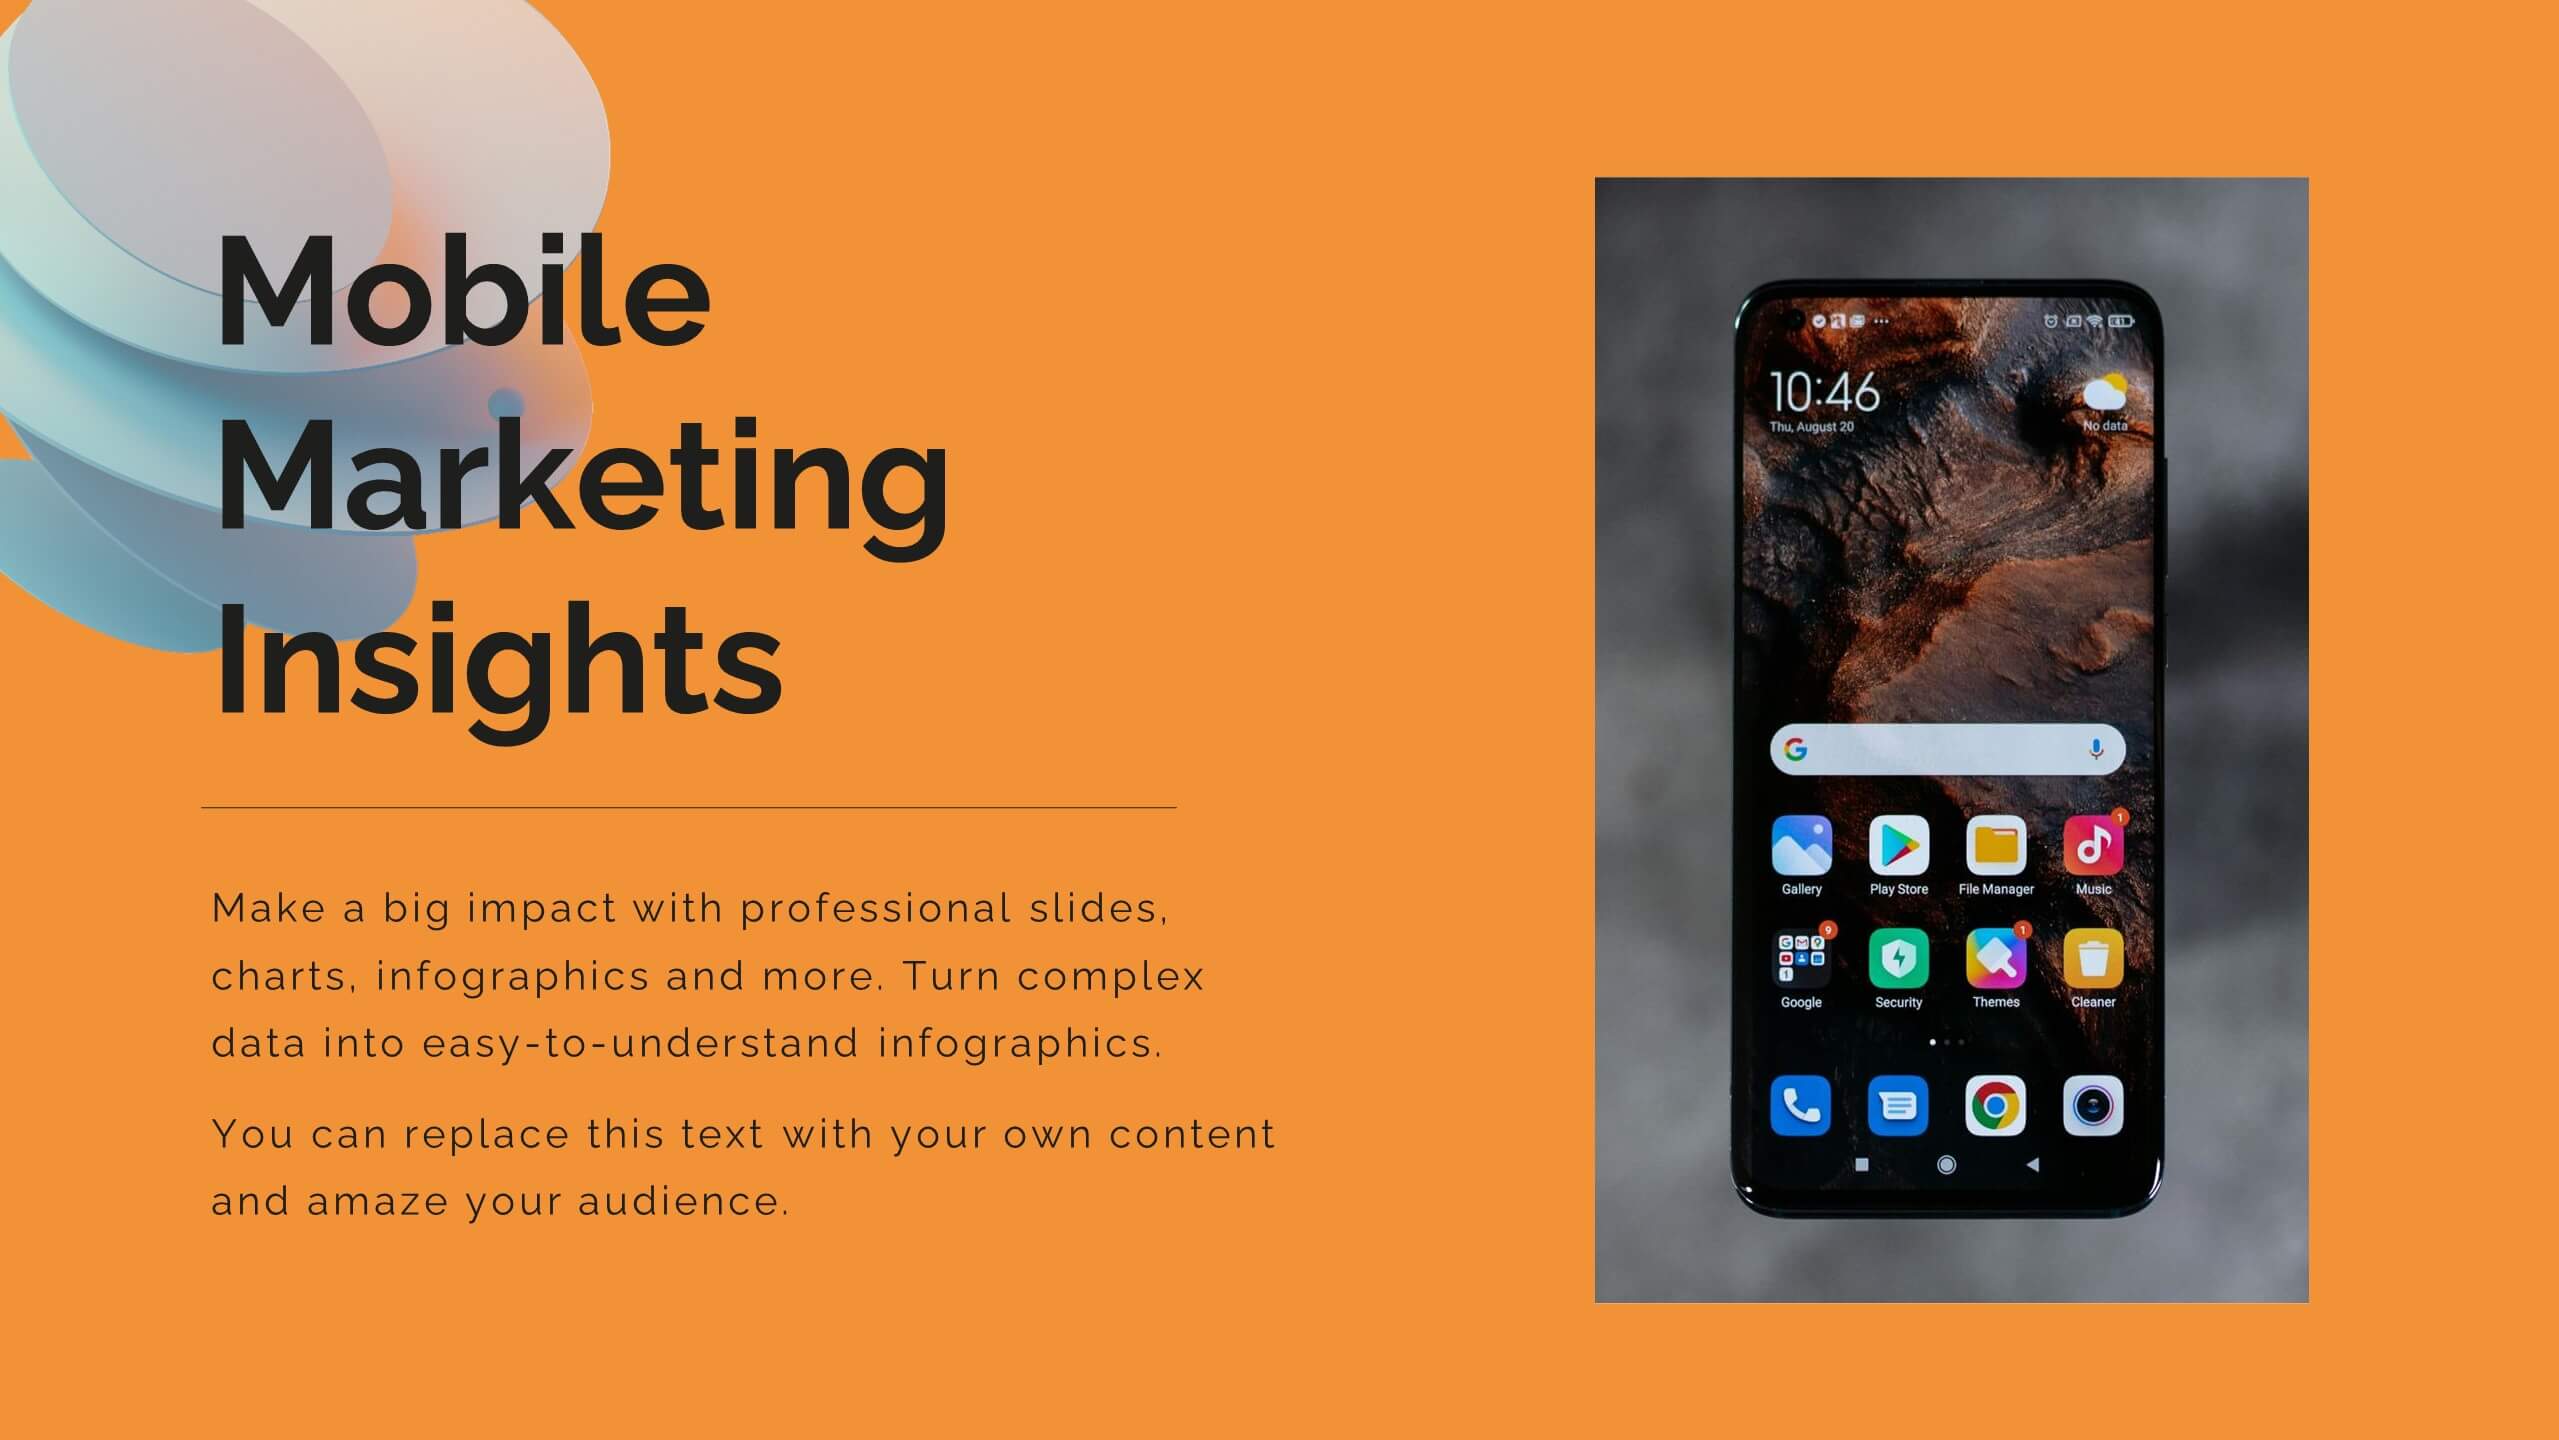
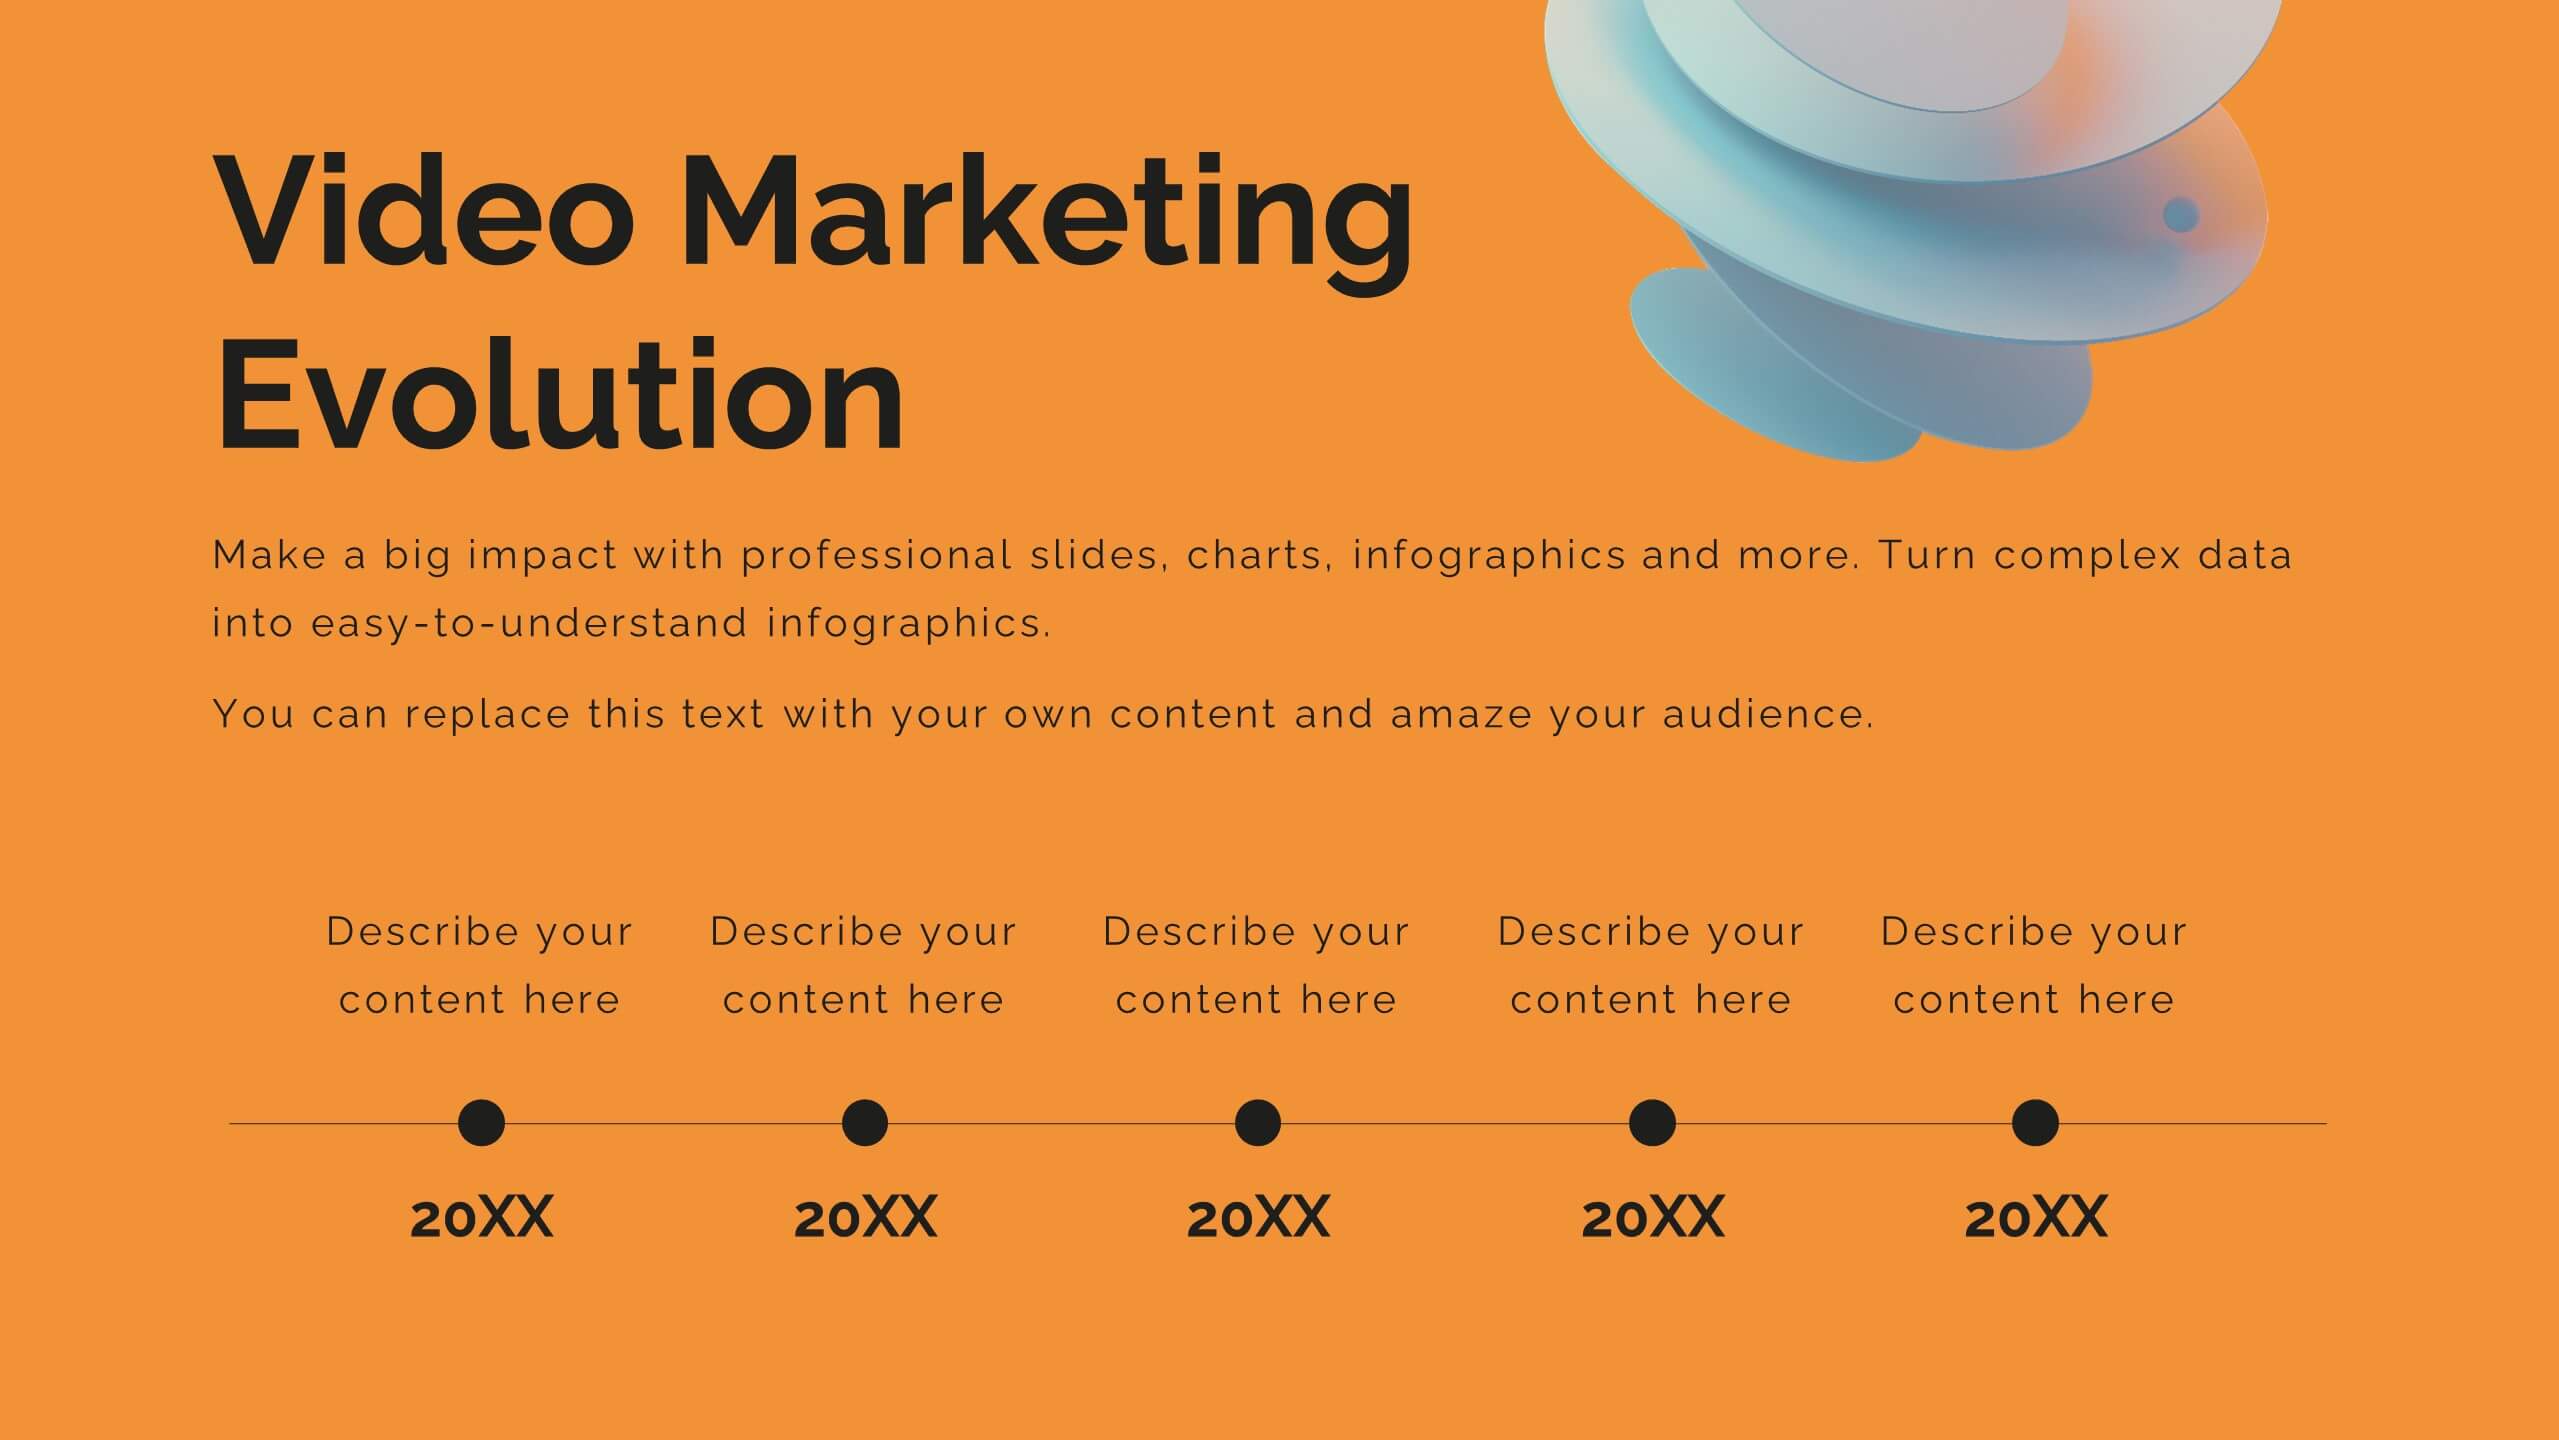
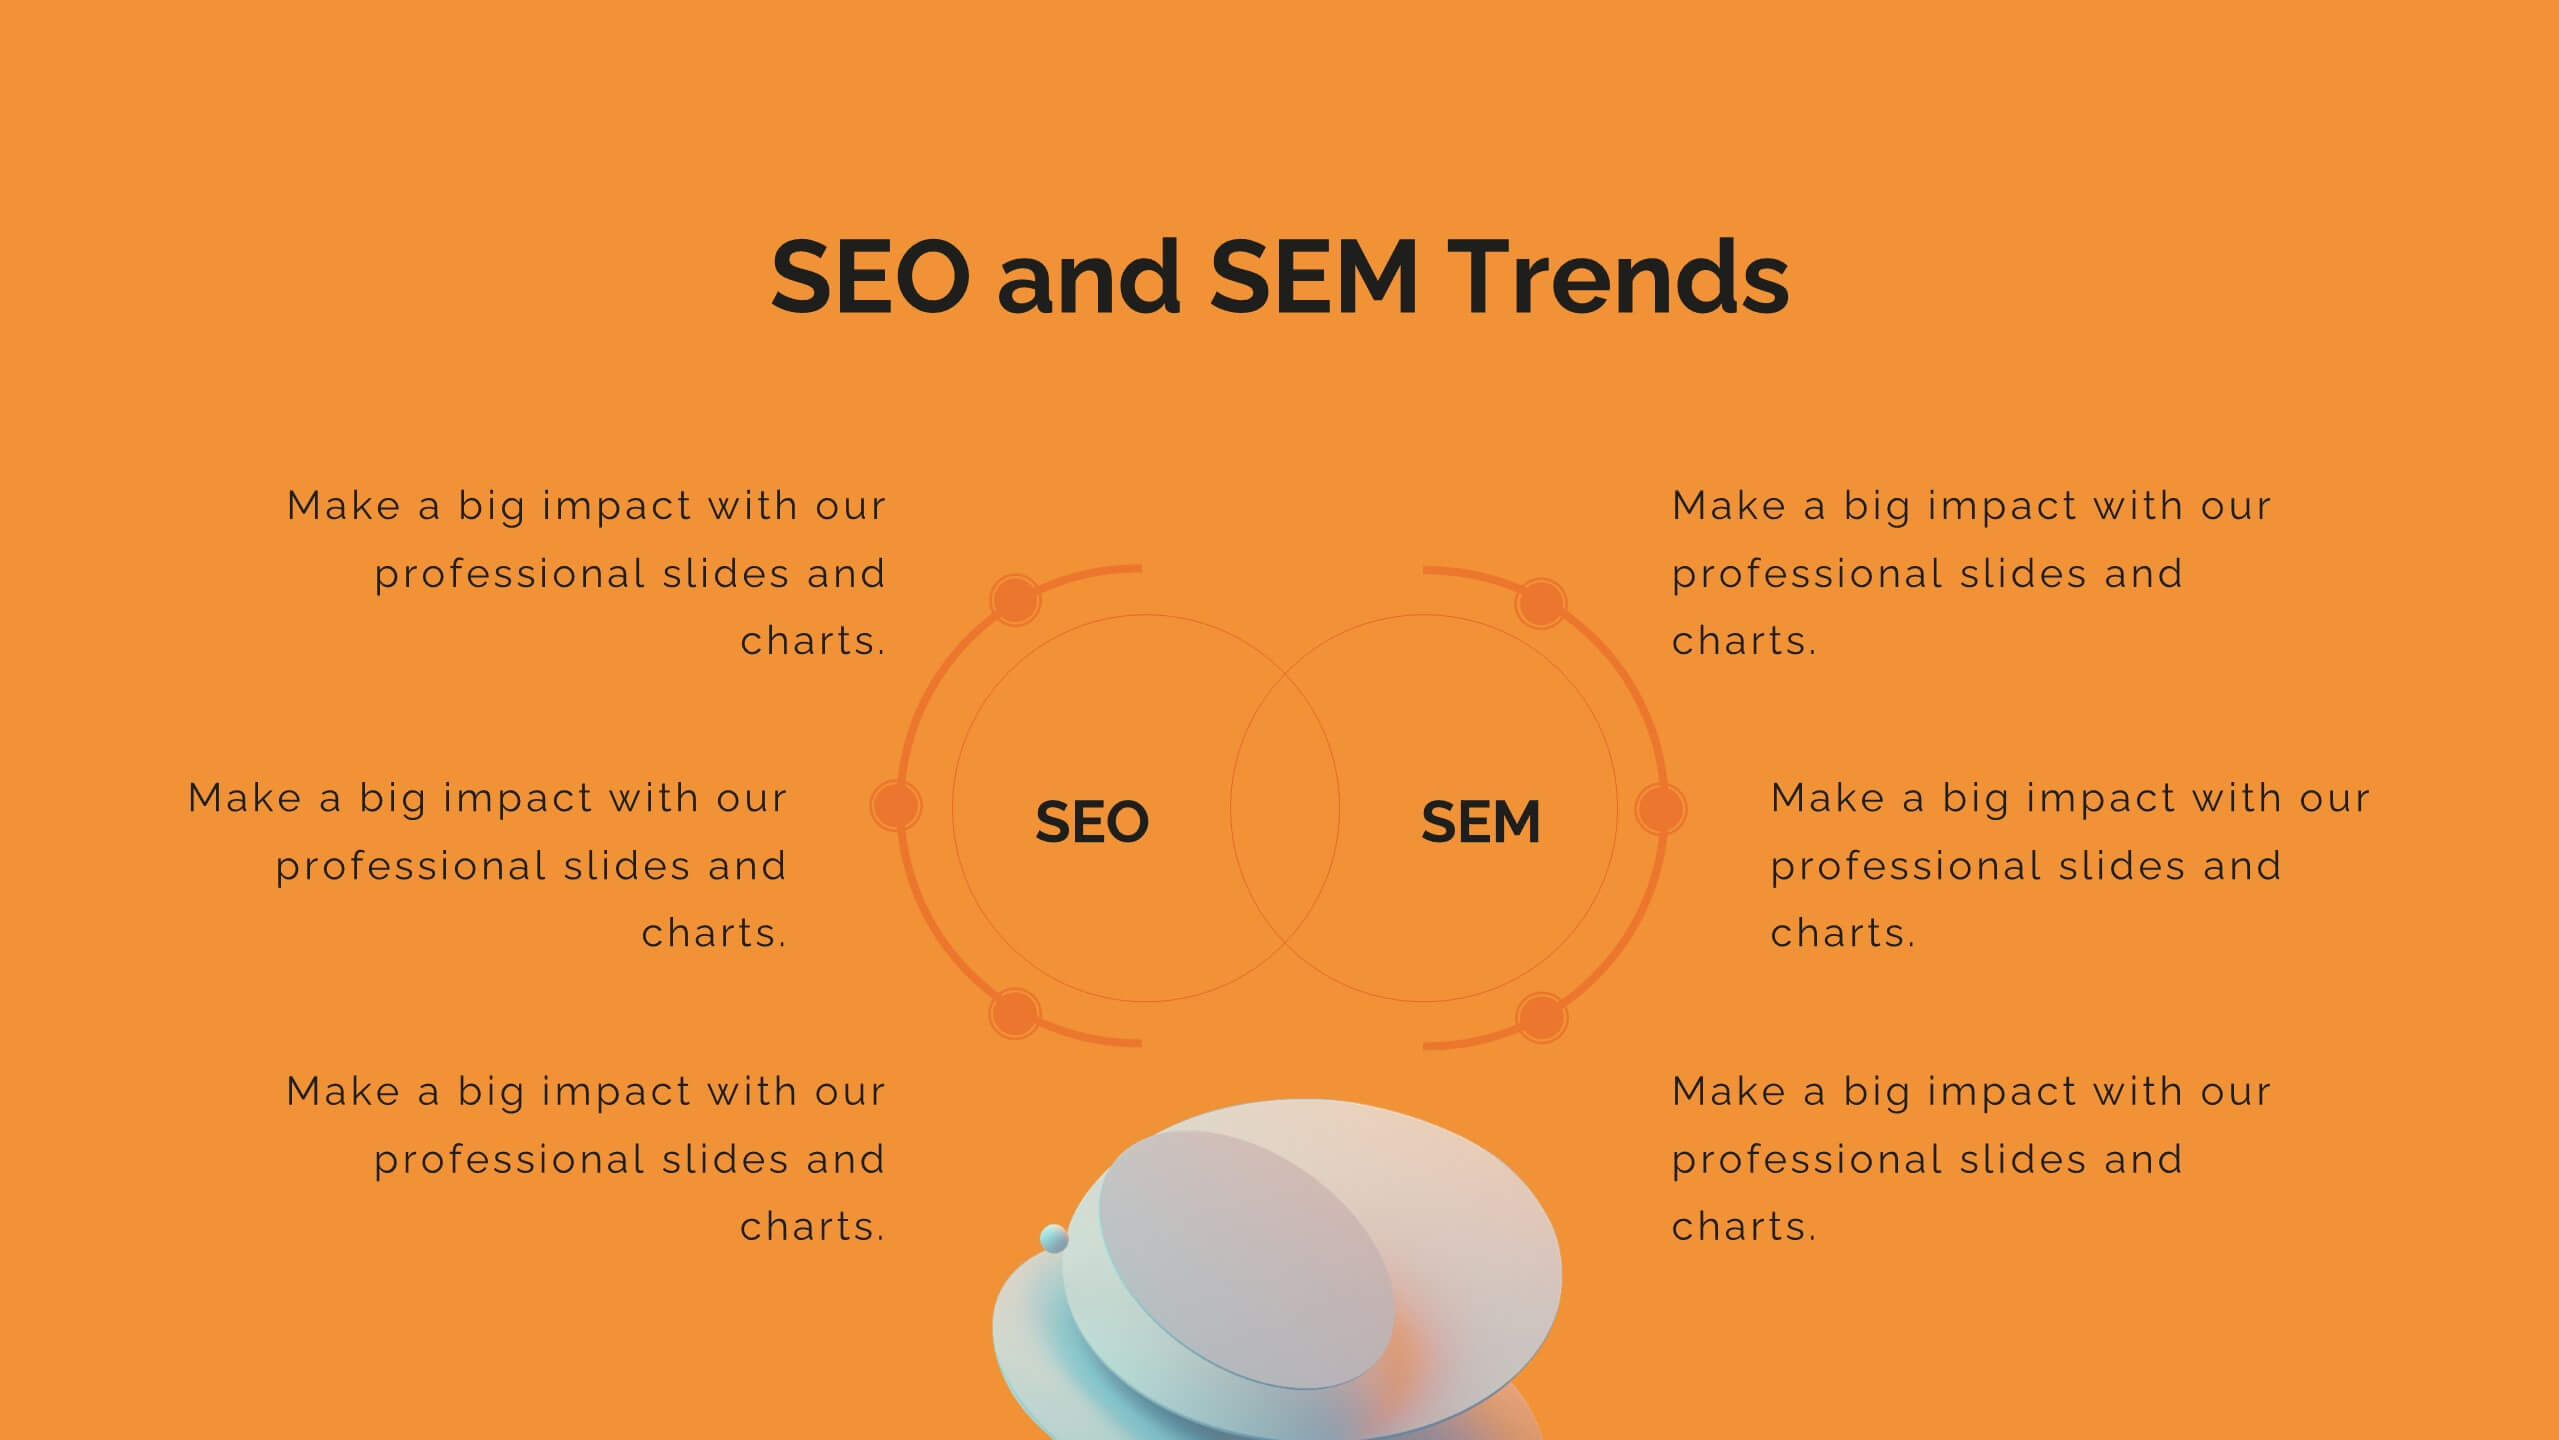
The Haeleigh Powerpoint Template is a 26 modern slide template that is perfect for any presentation. With a clean classy aesthetic and easy to read text, this template is ideal for reading content and looking professional. The use of nude colors helps keep the look clean and easy to read. The theme comes packed with features to target your audience and help you get your message across. The charts, graphics, timelines included are easy to edit. This template is also perfect for businesses seeking to make an impression on their audience. Haeleigh is mobile friendly and easy to navigate.


20 diapositivas
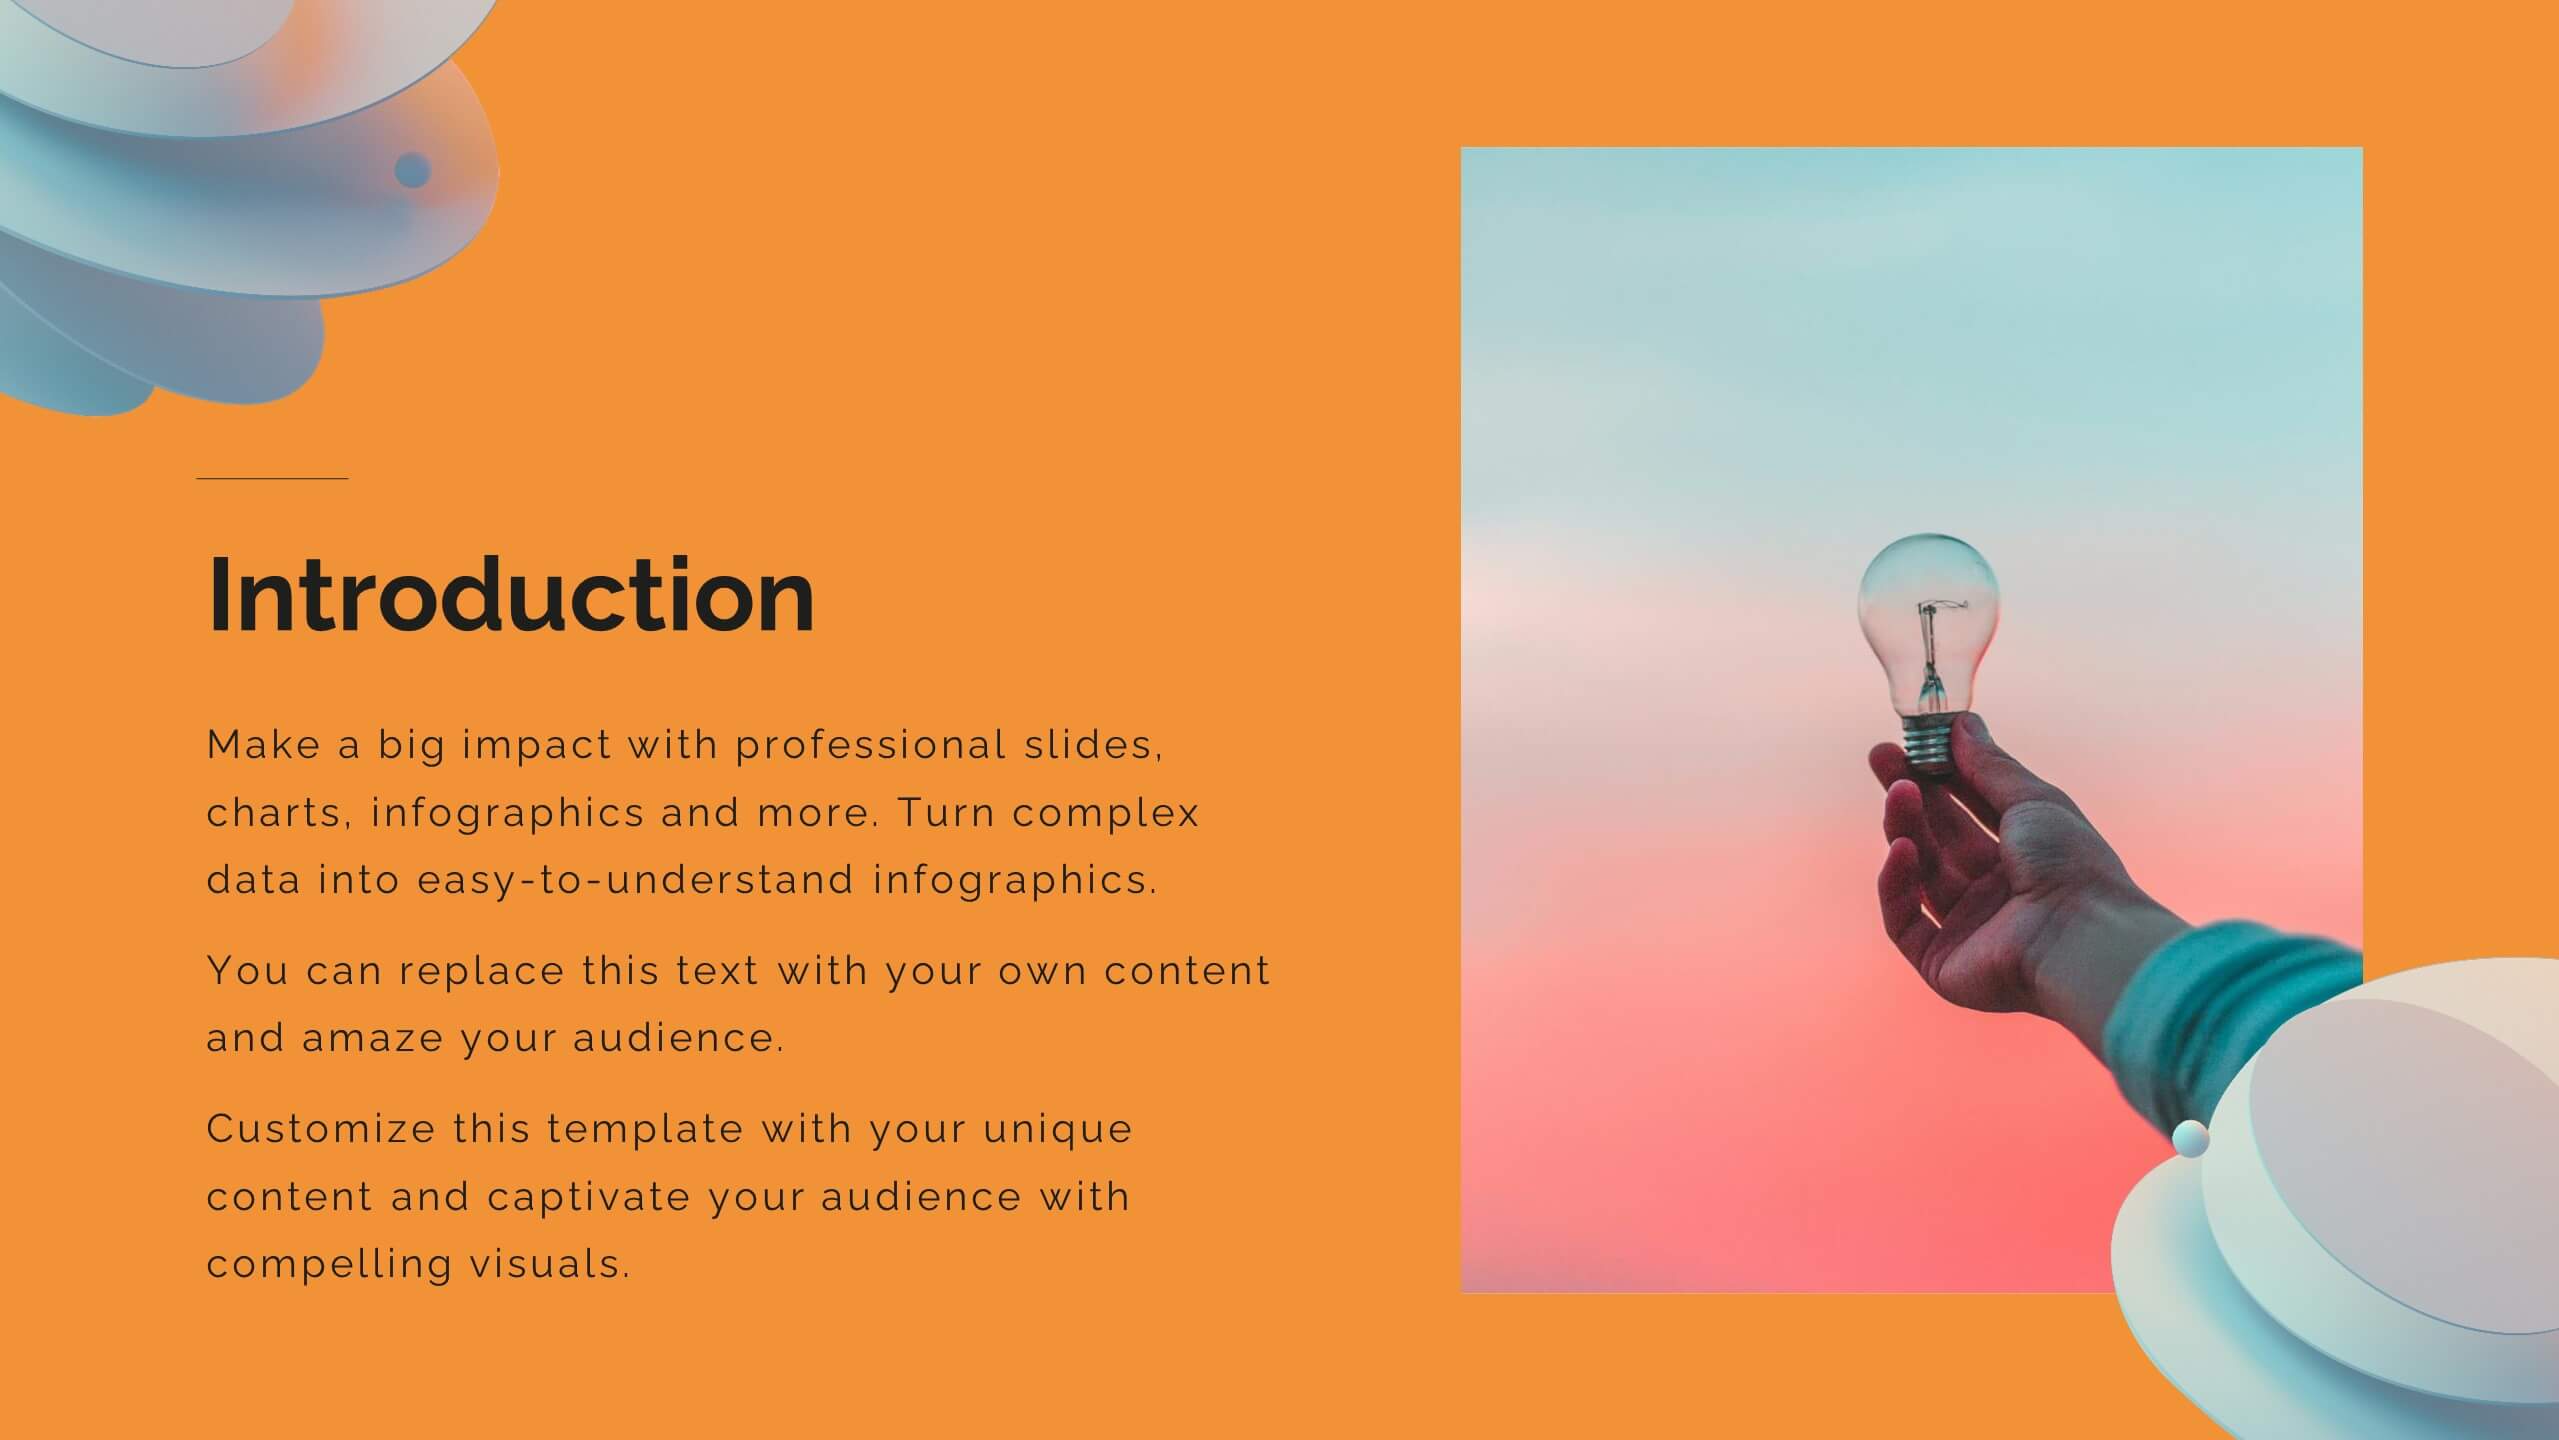
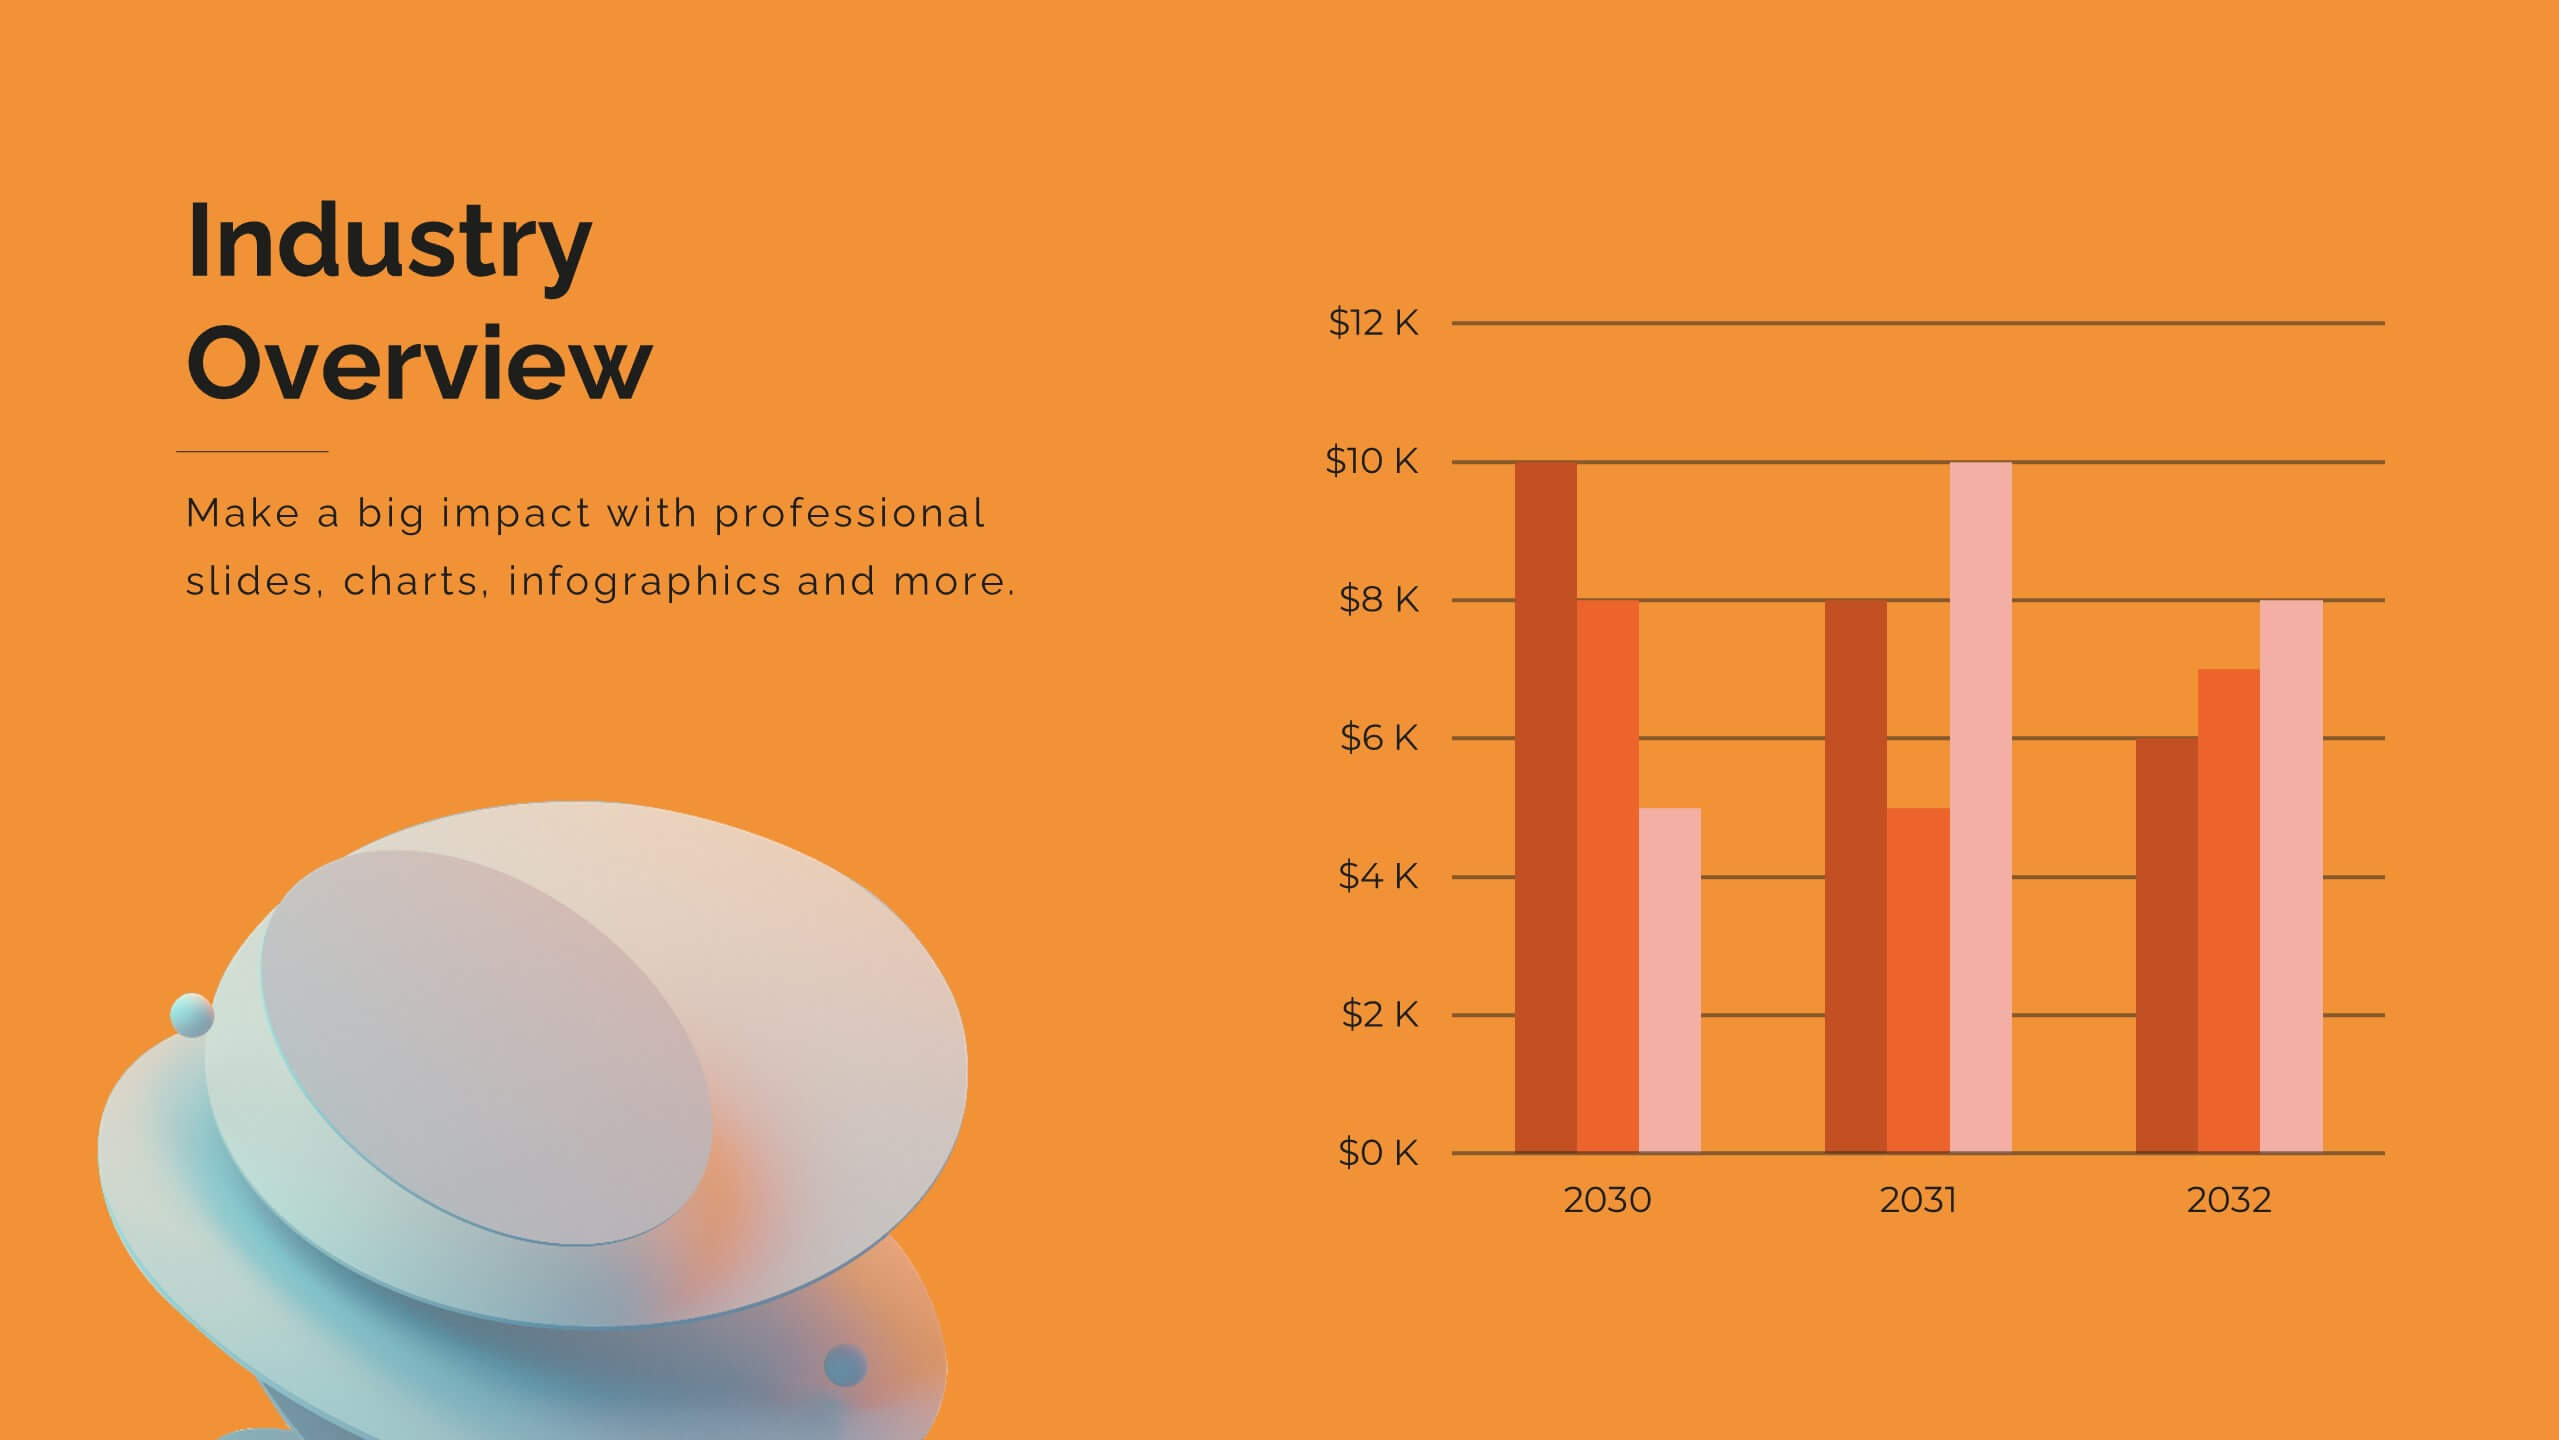
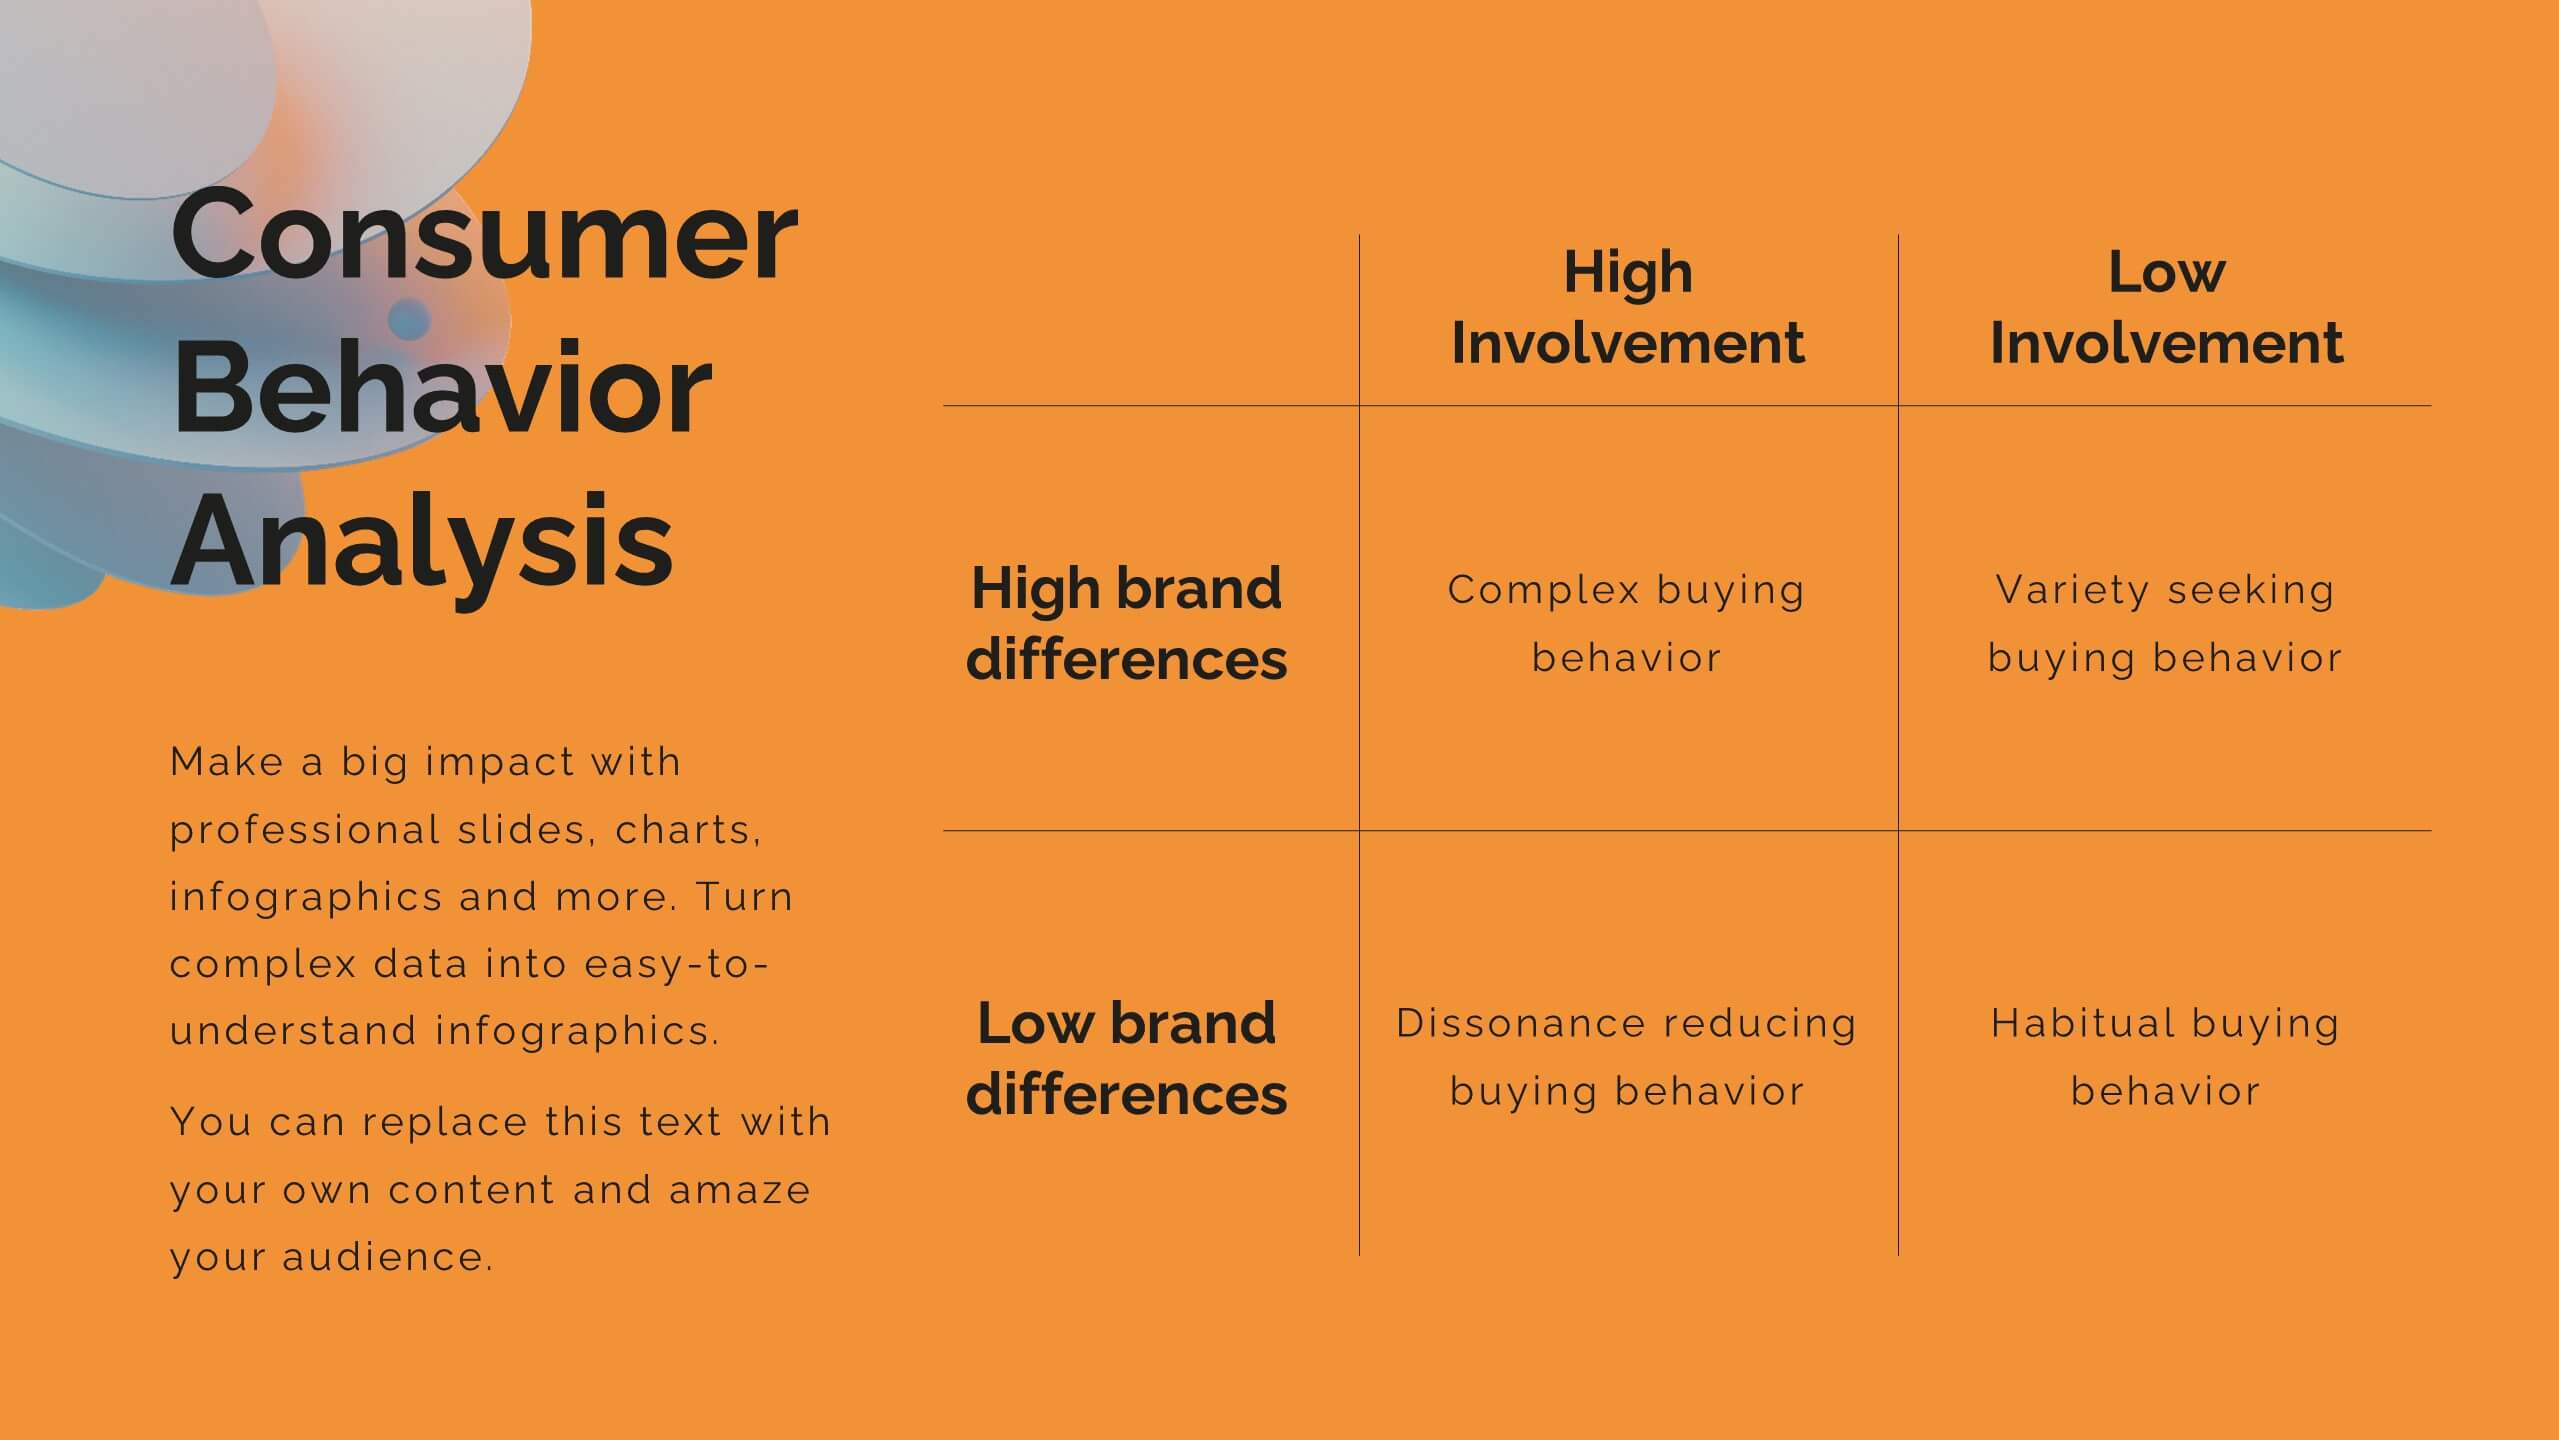
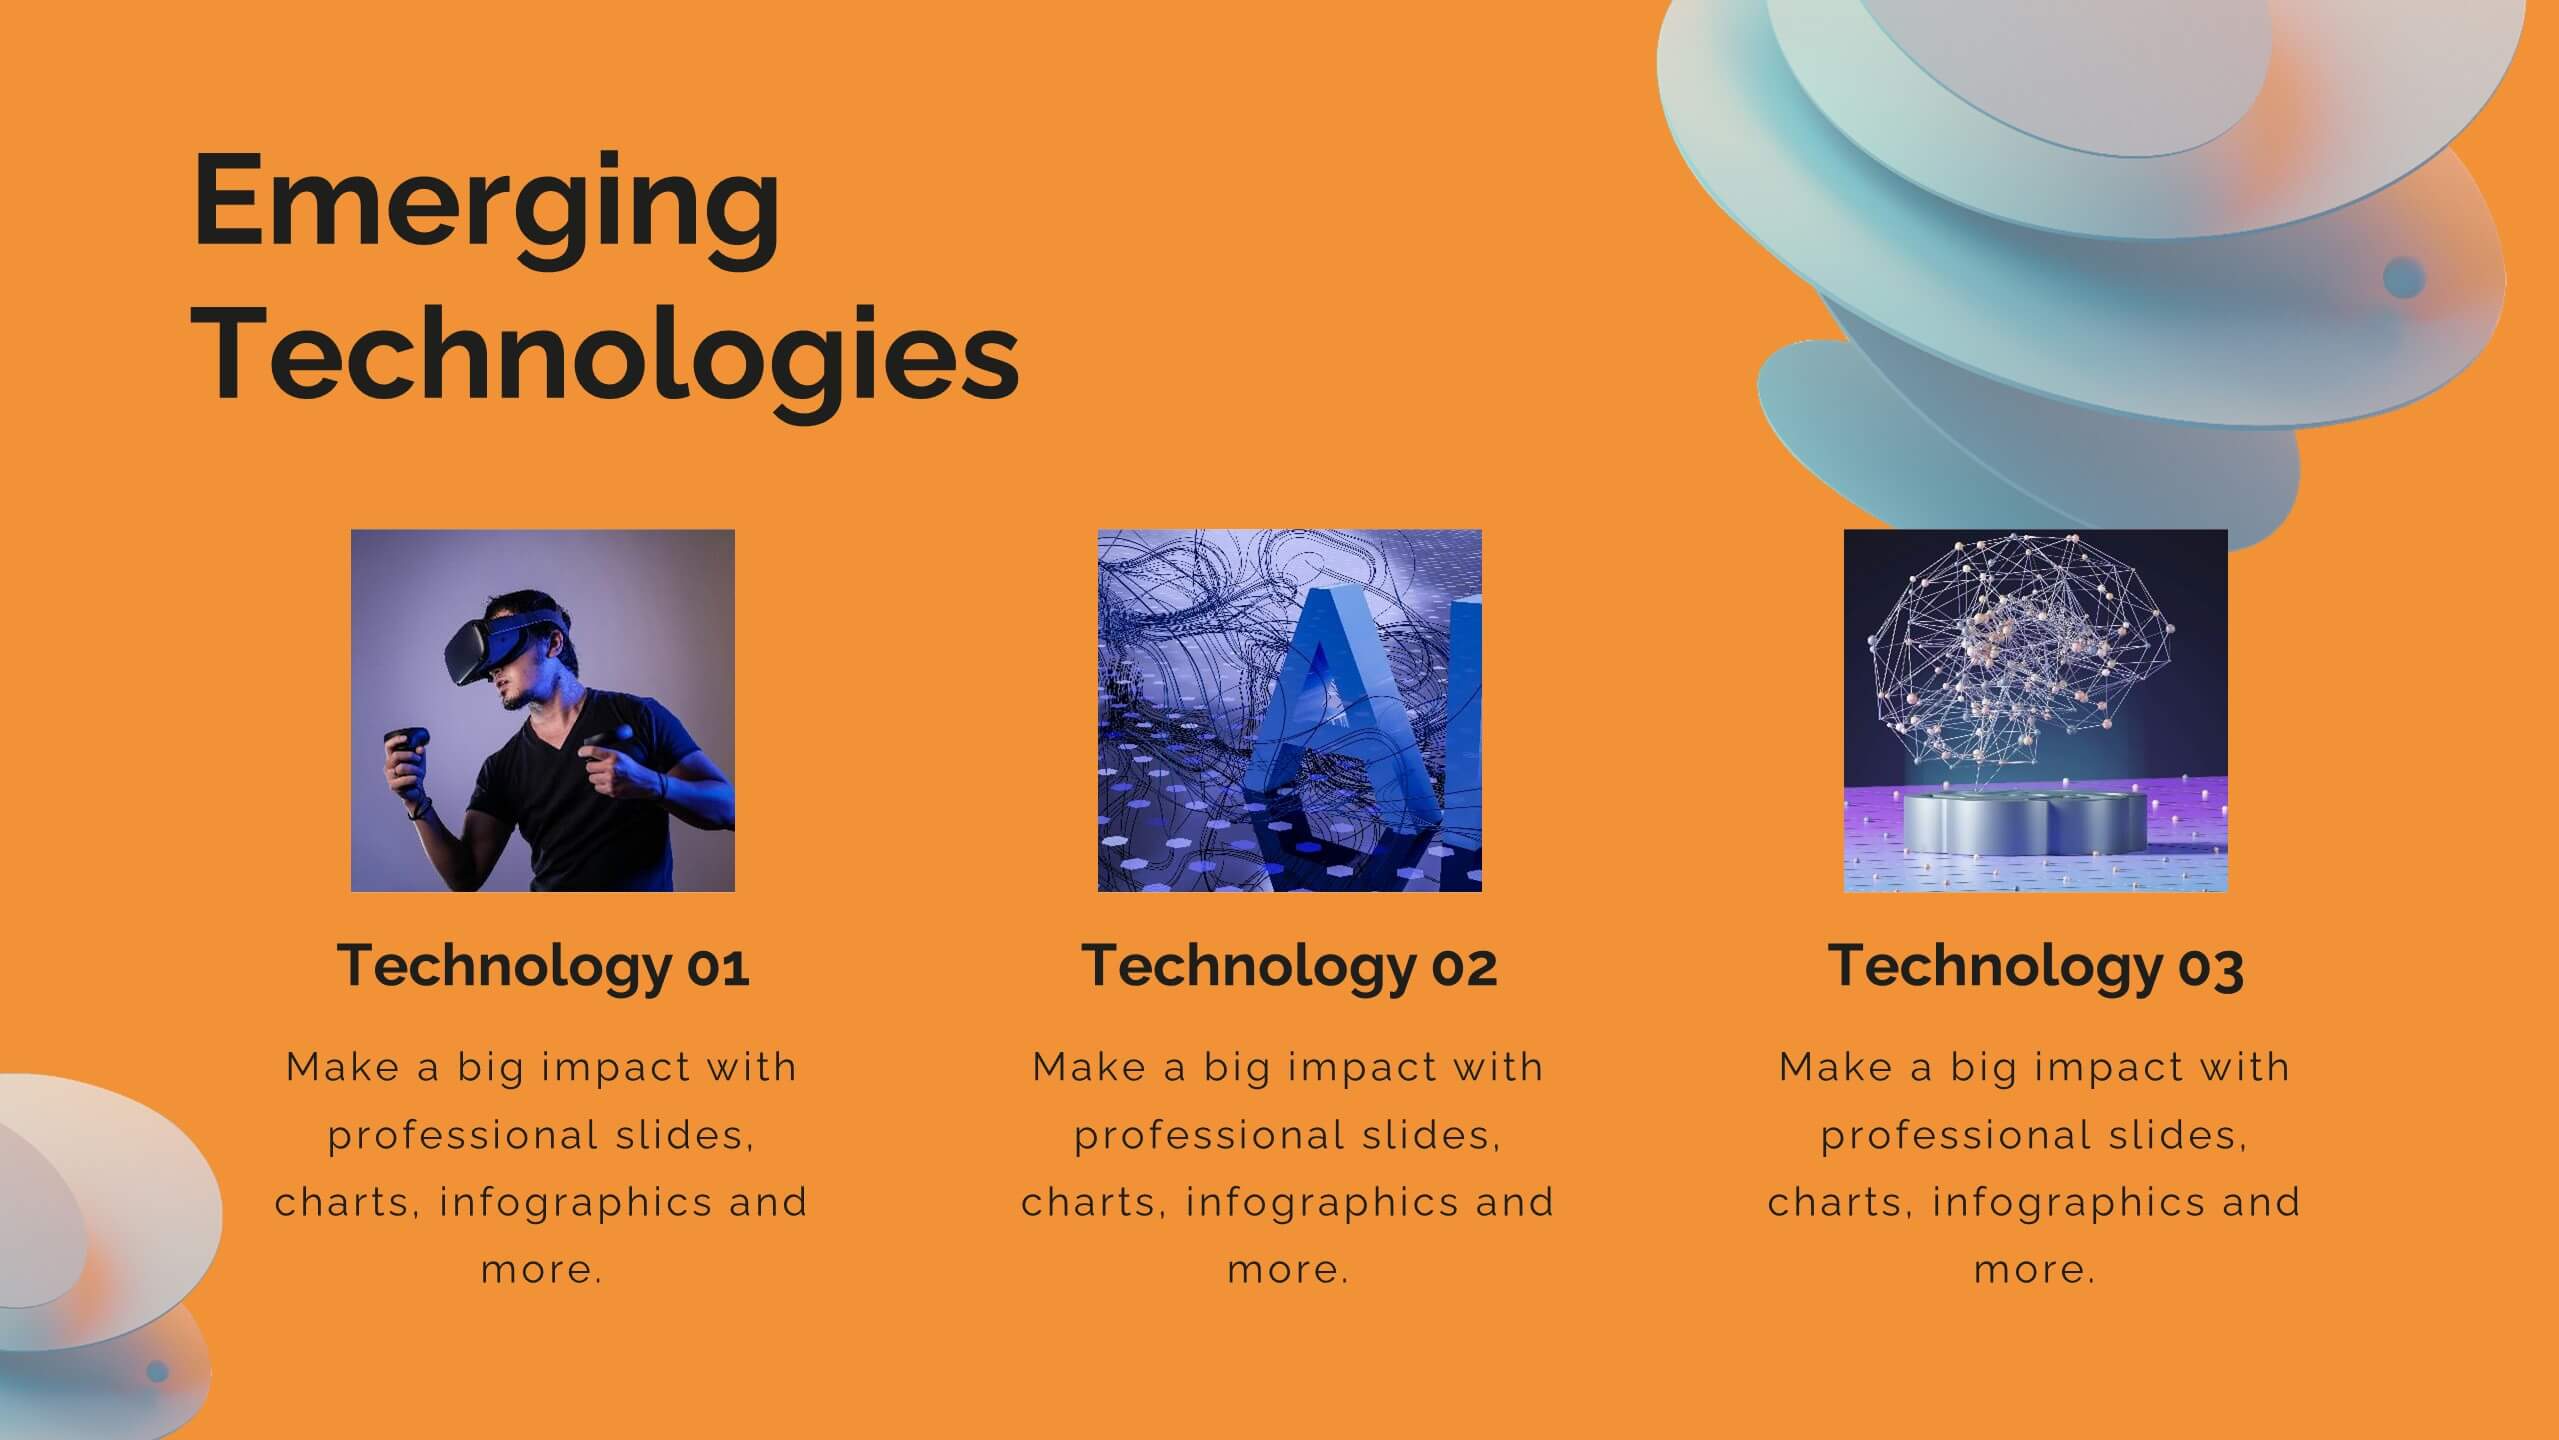
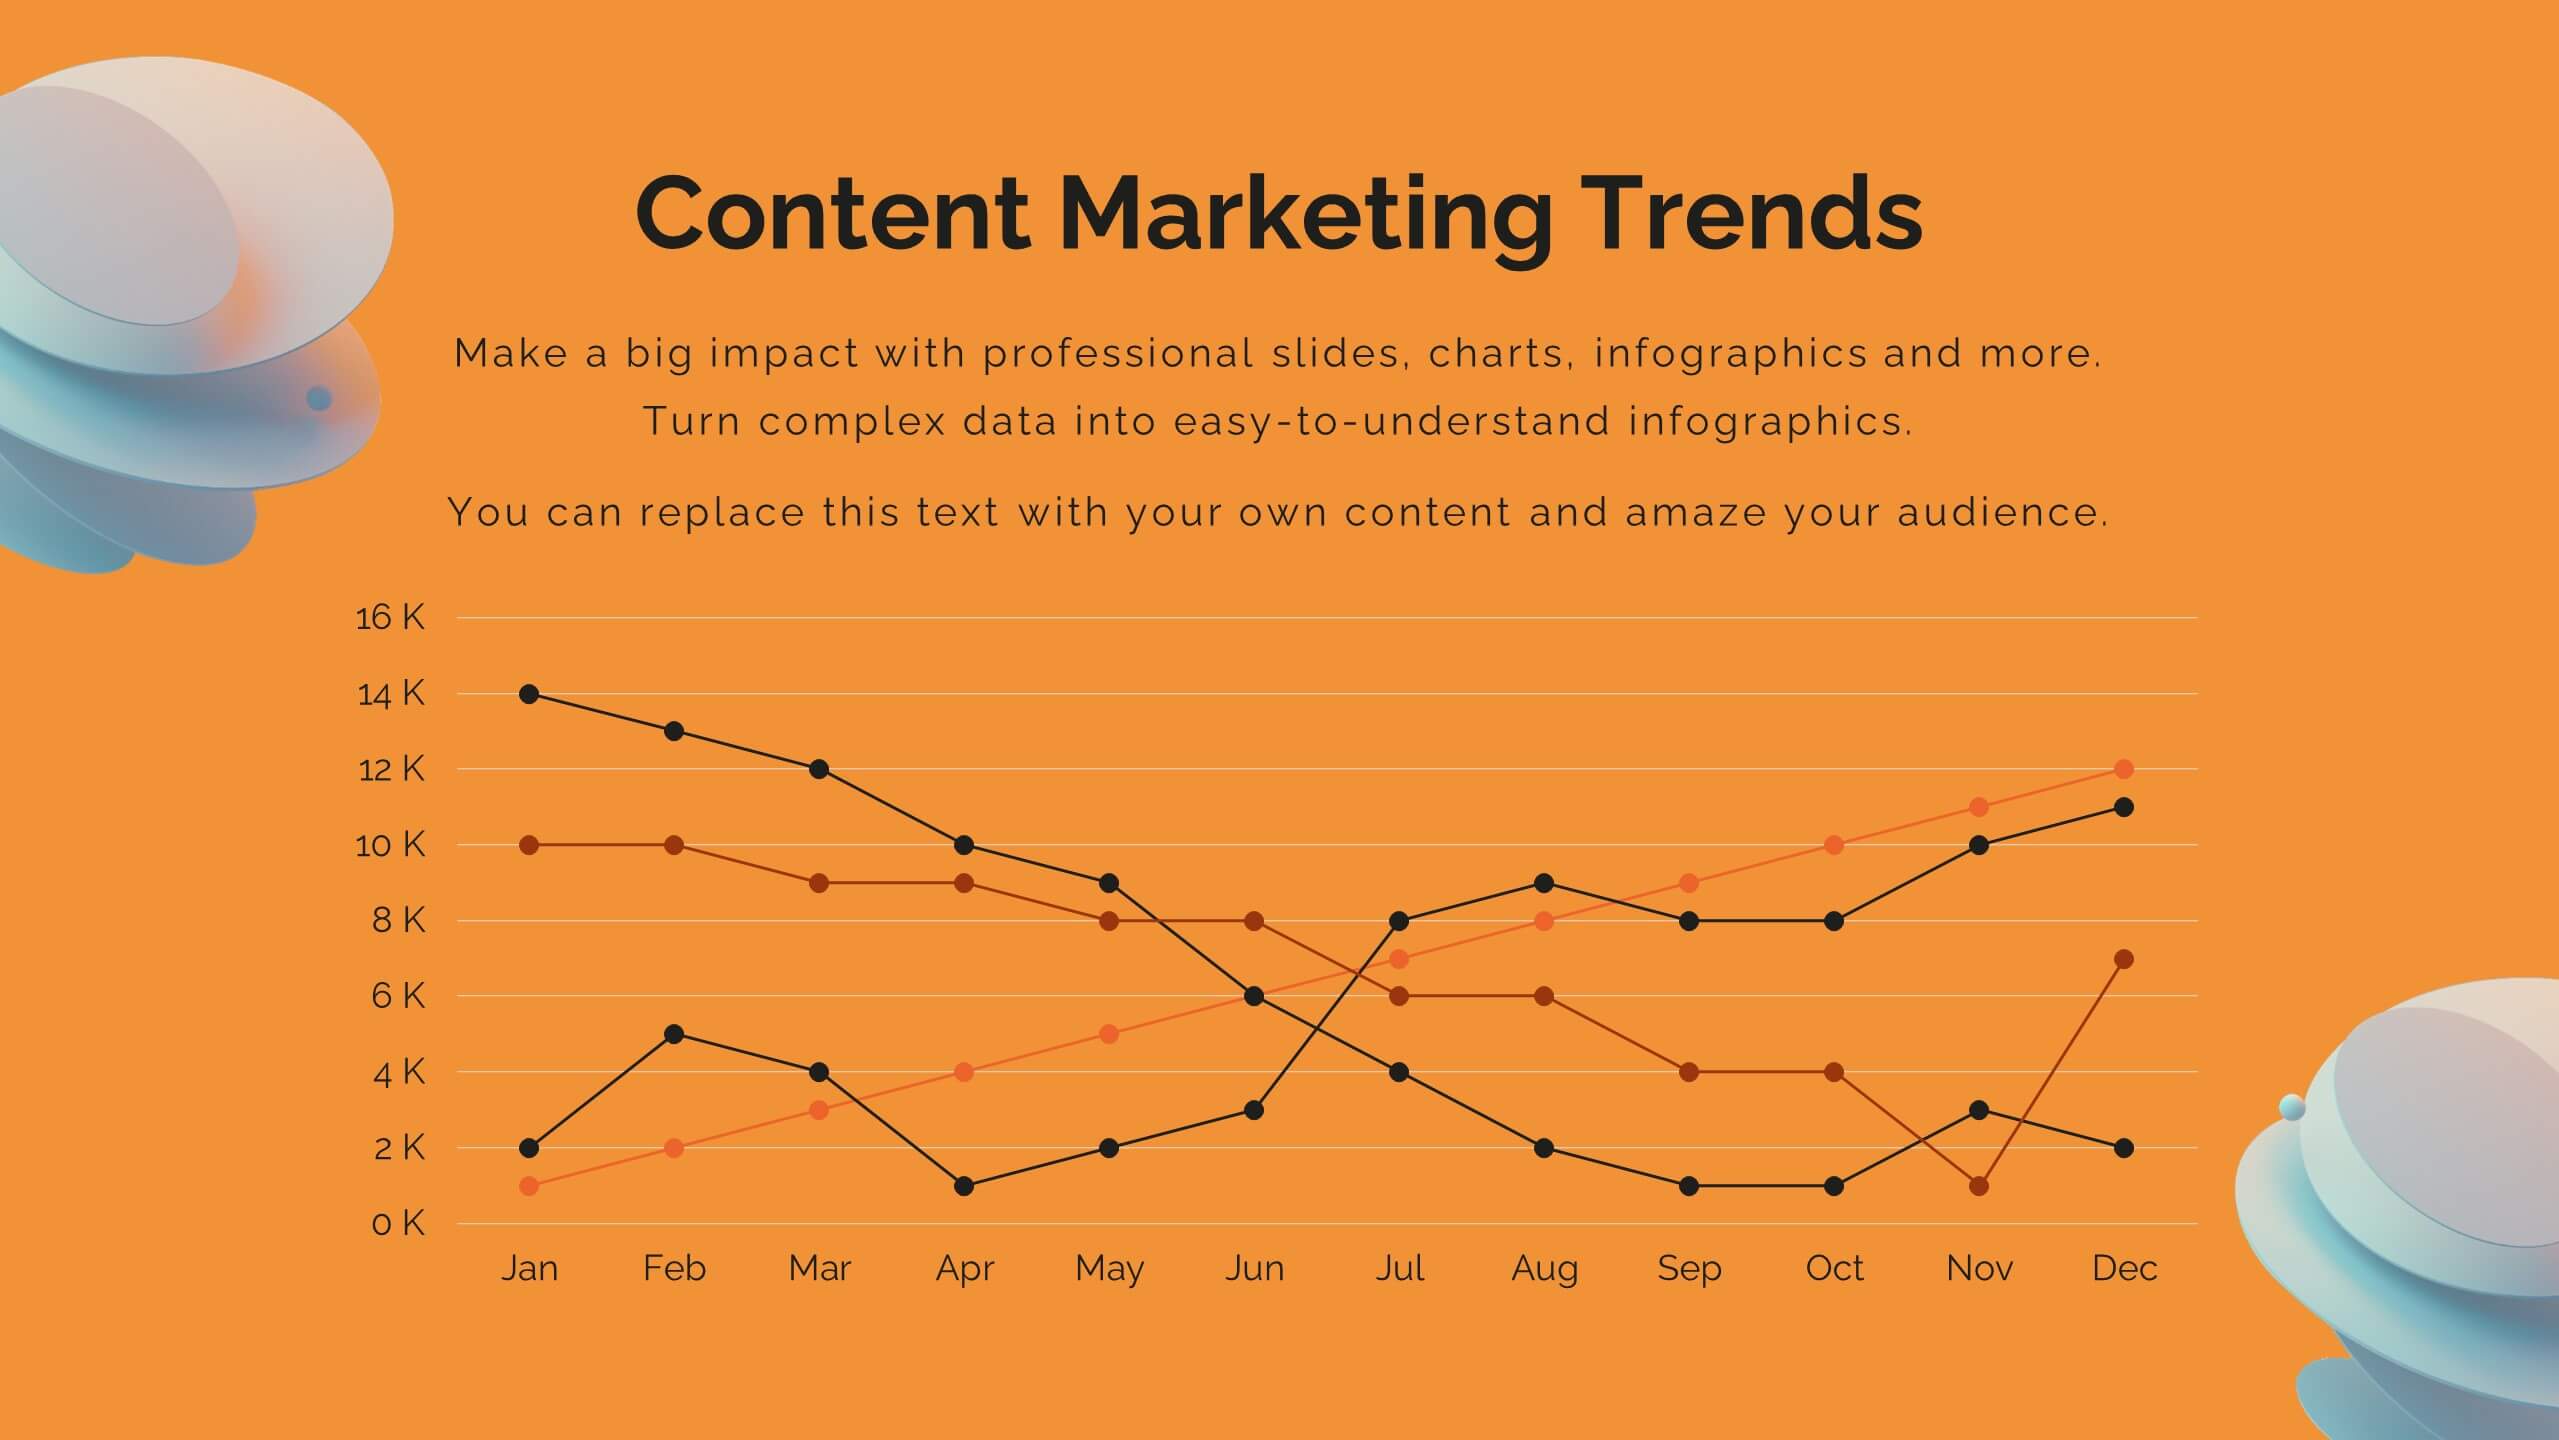
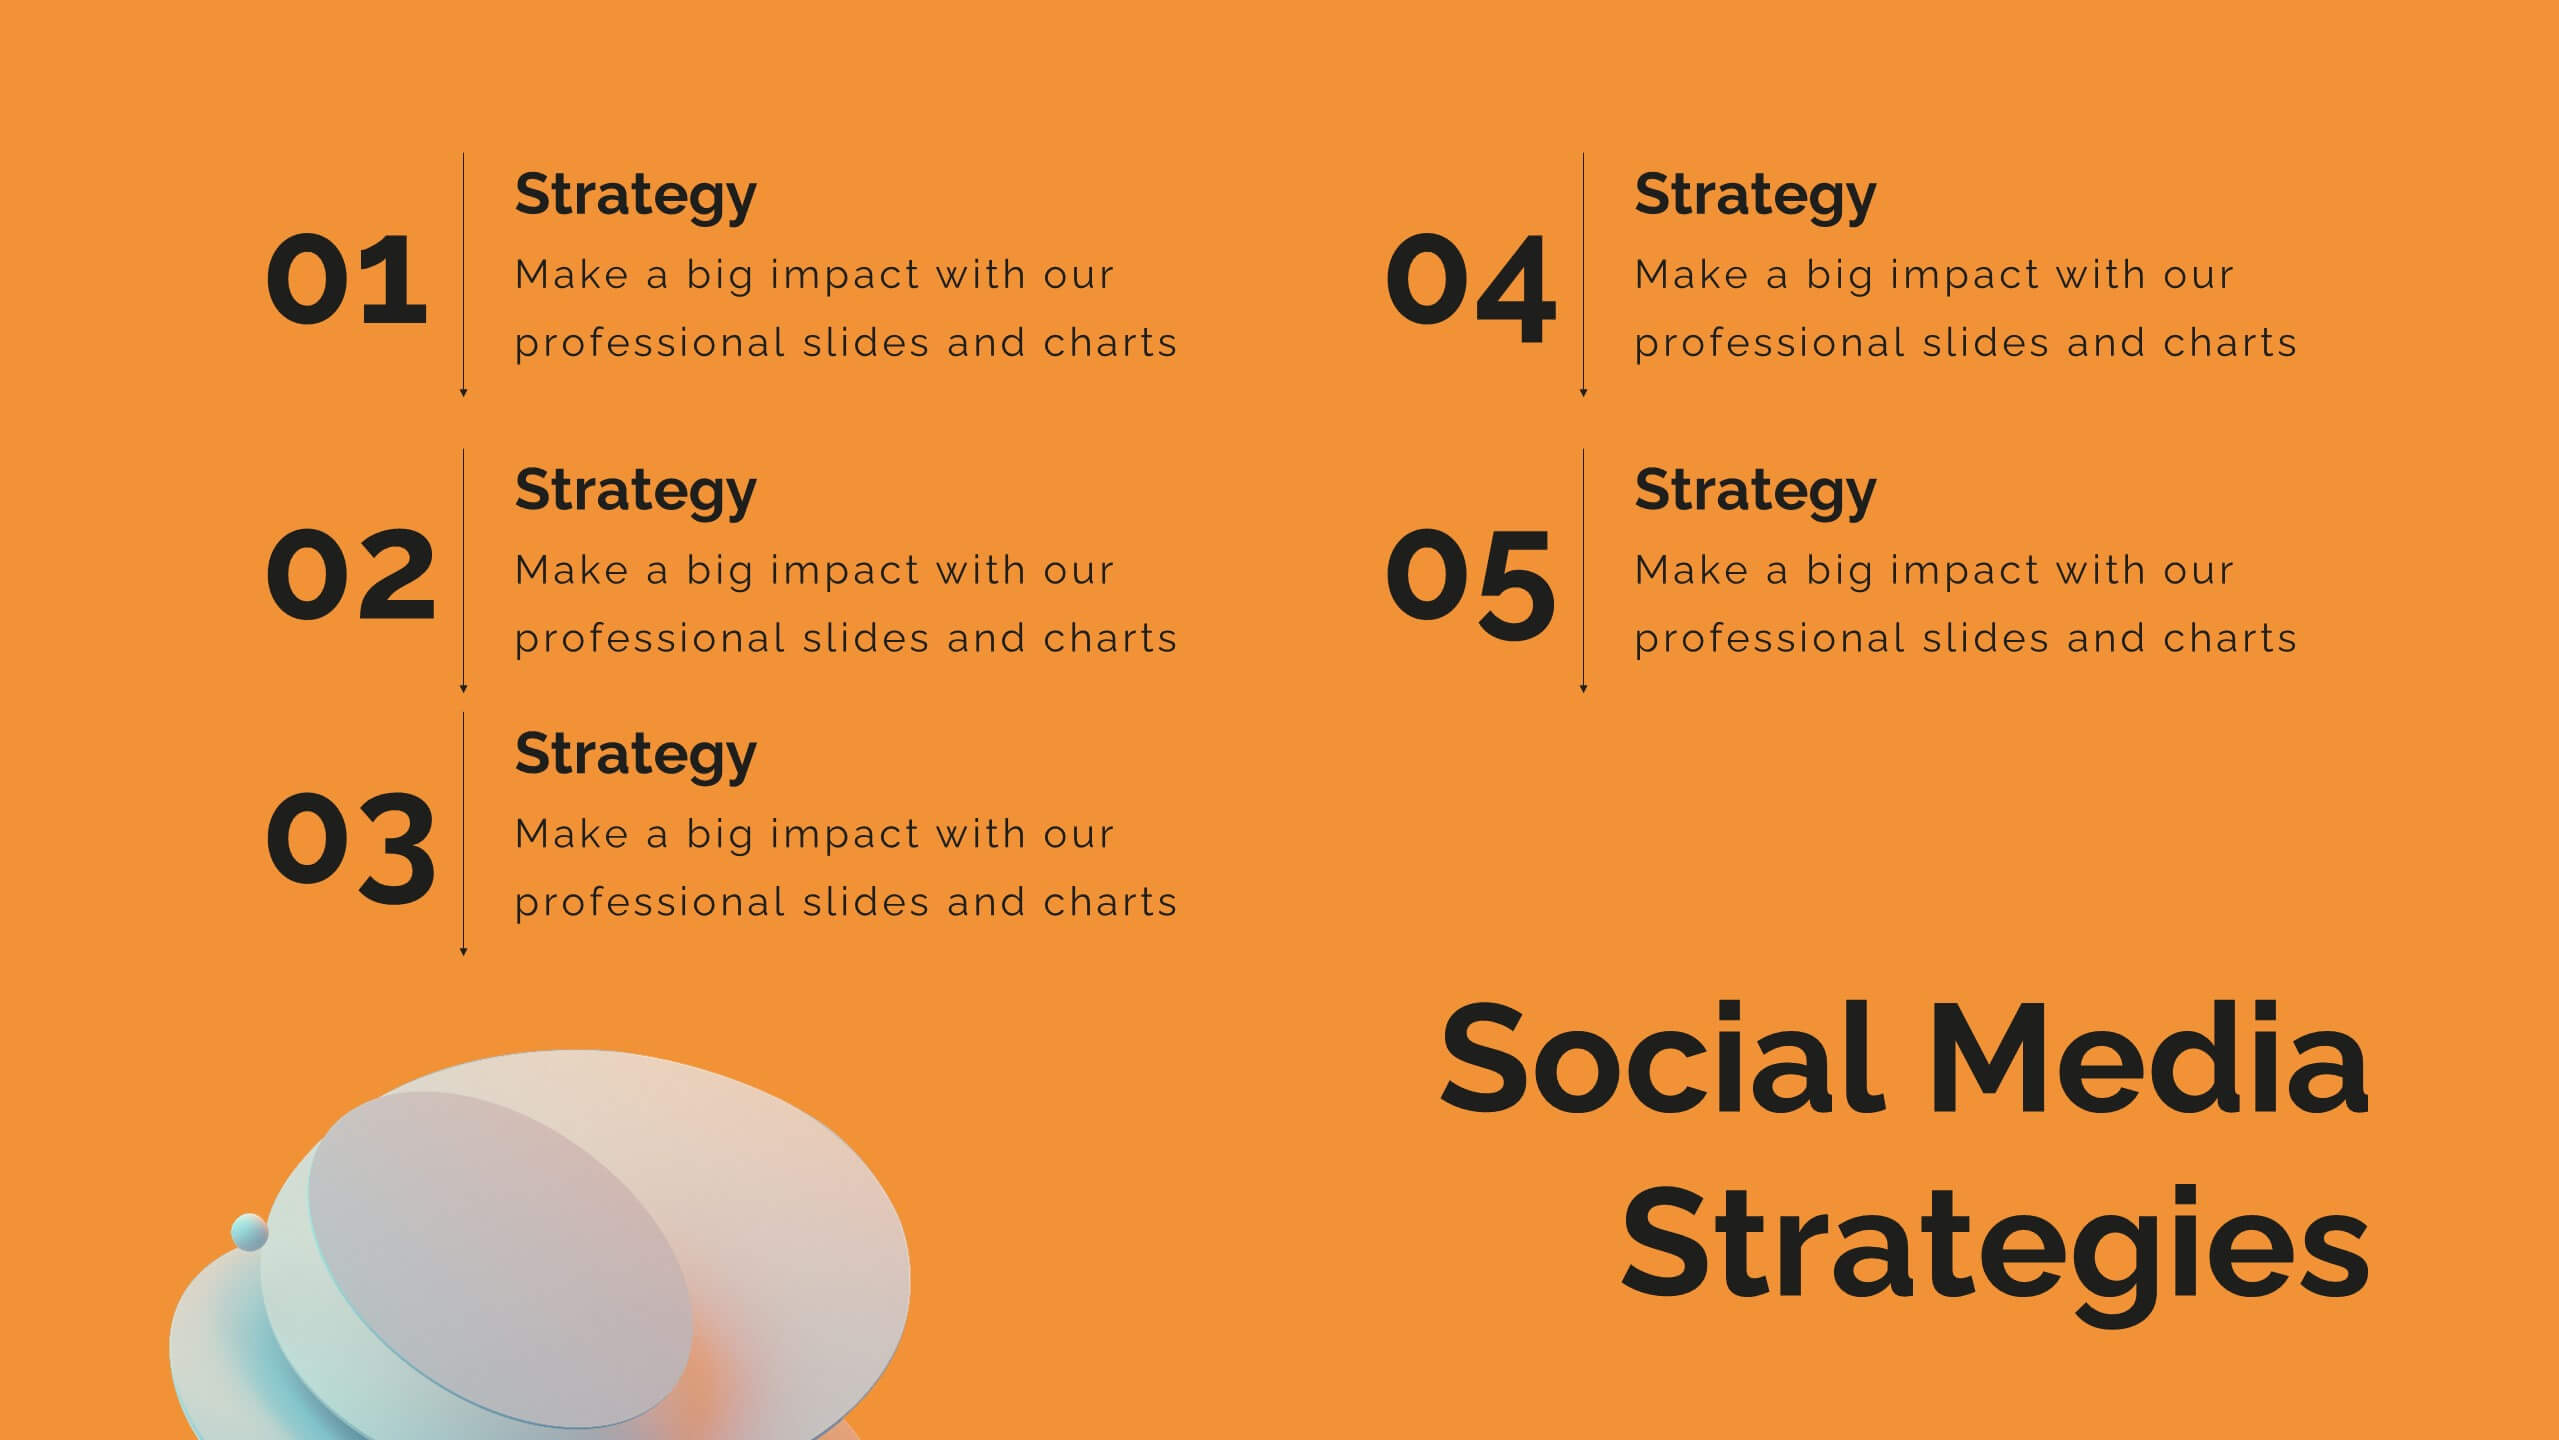
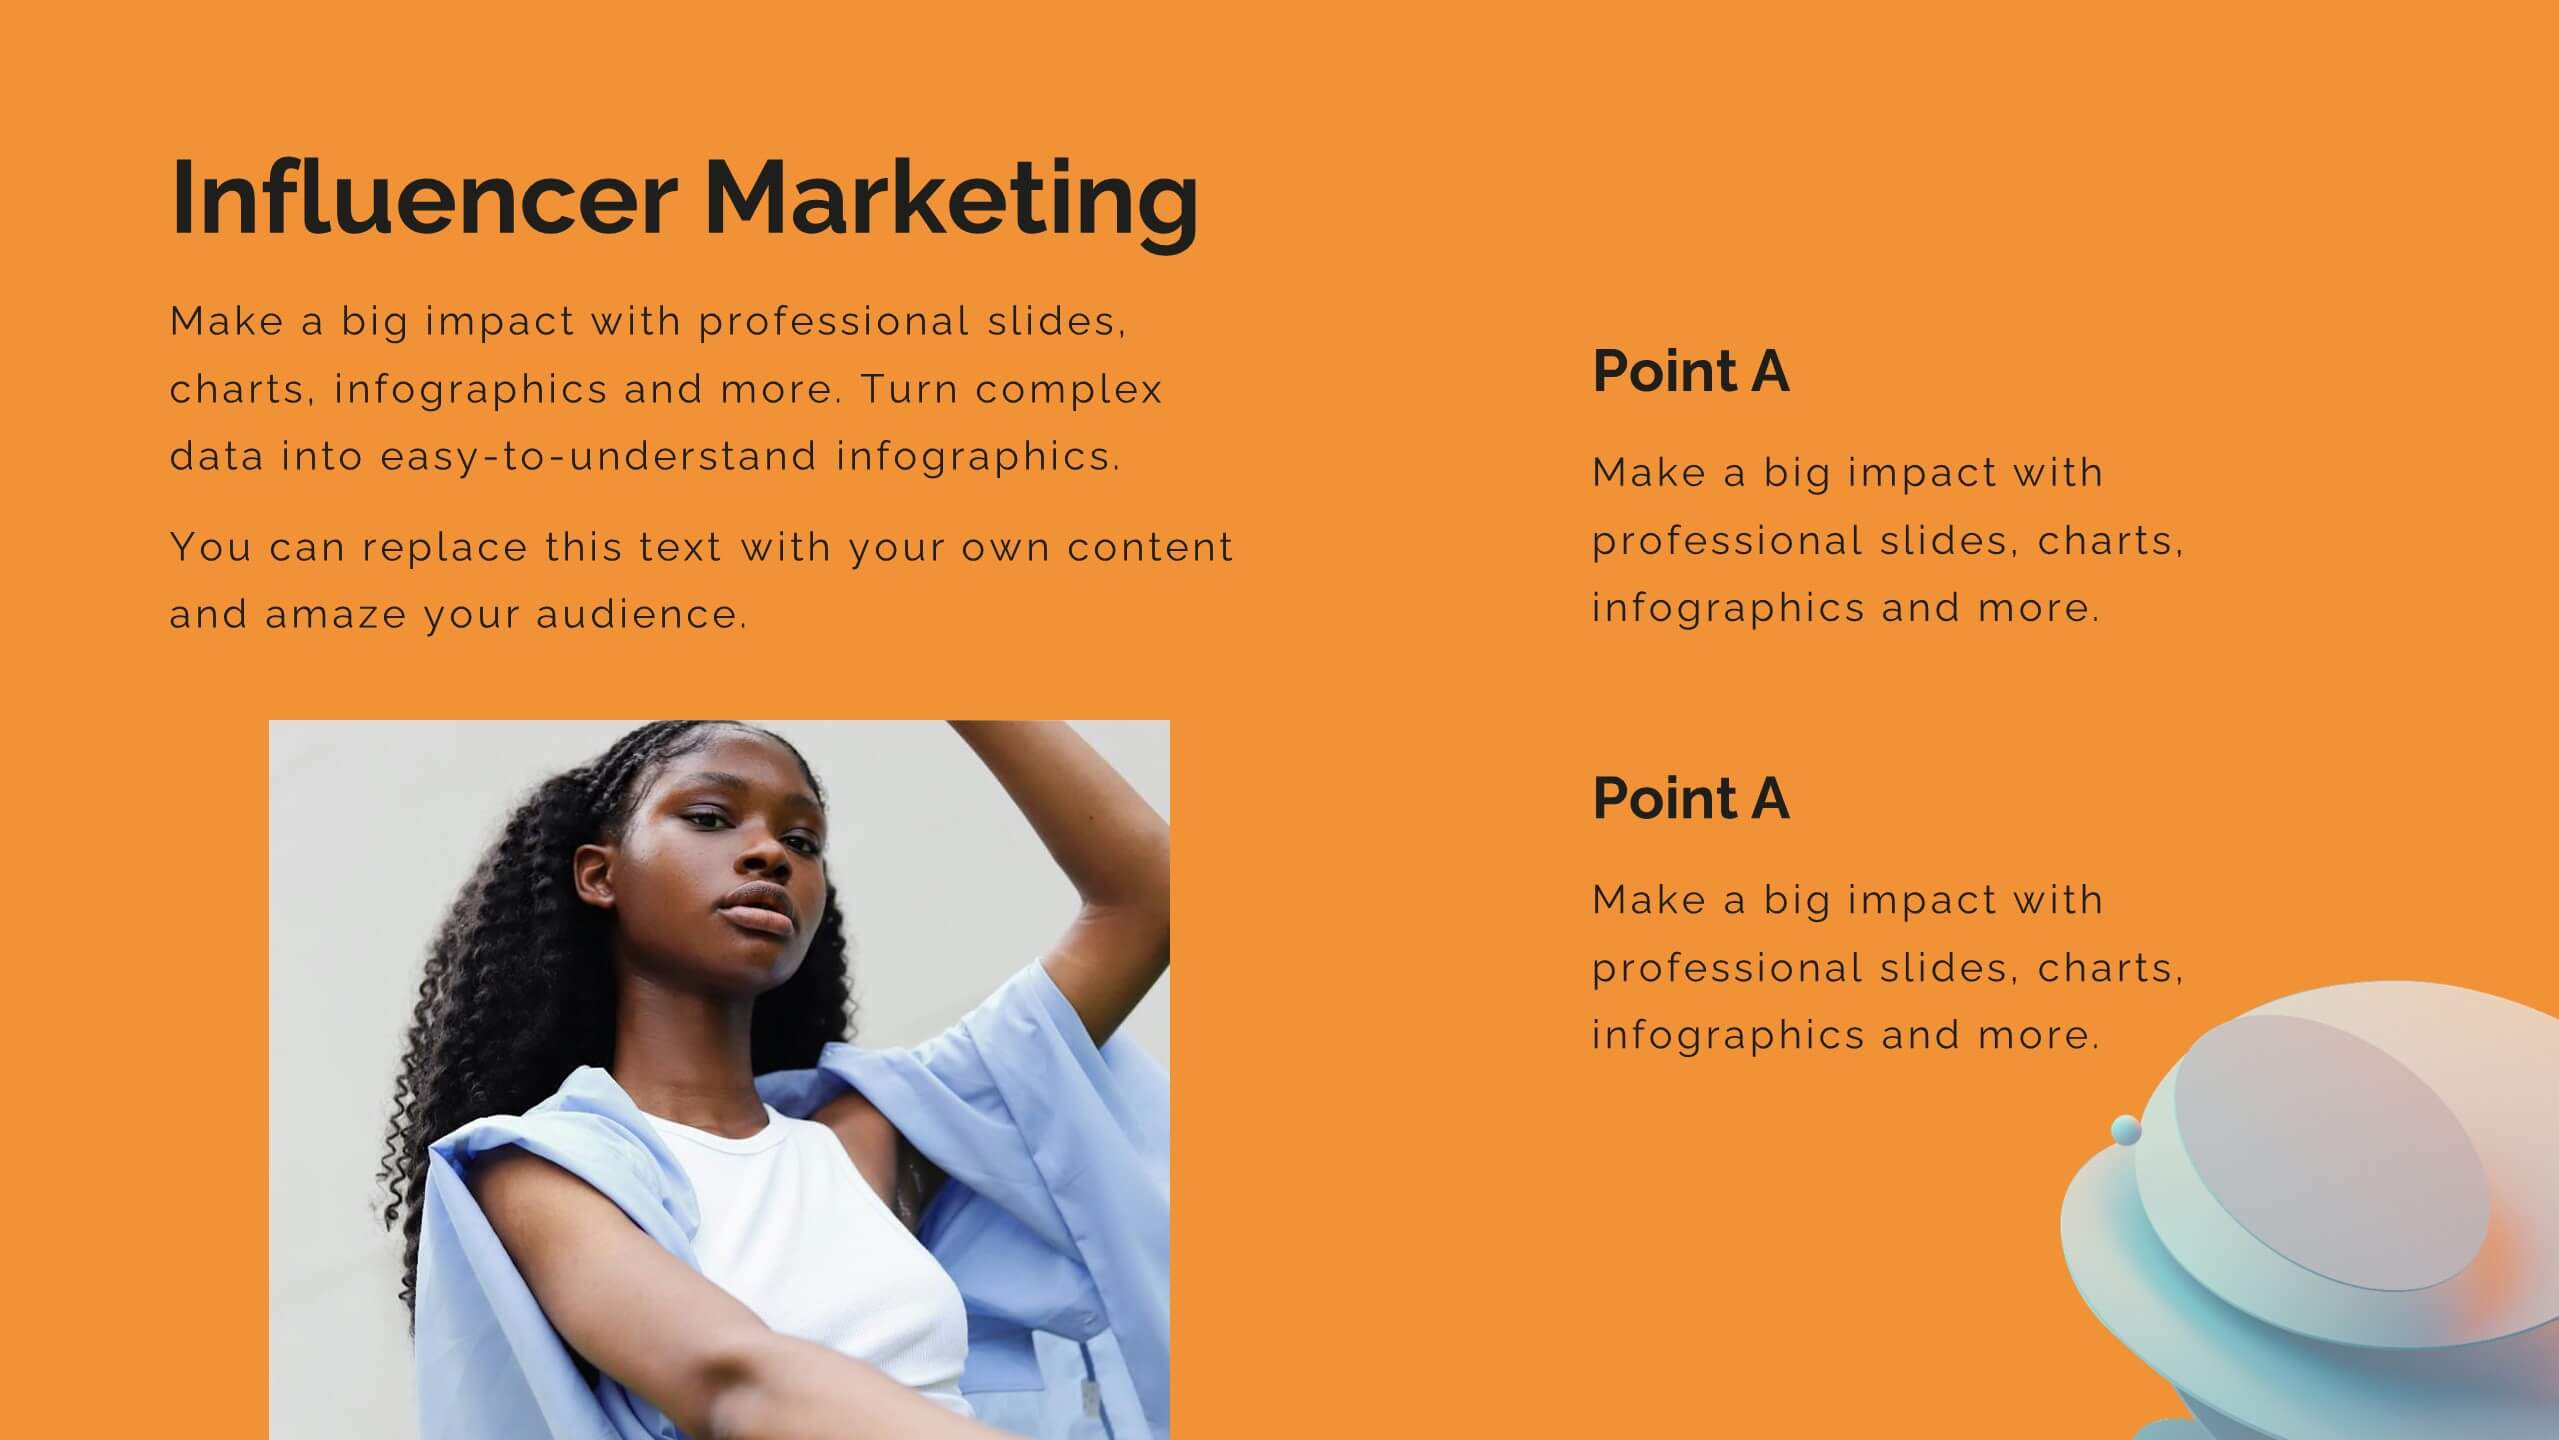
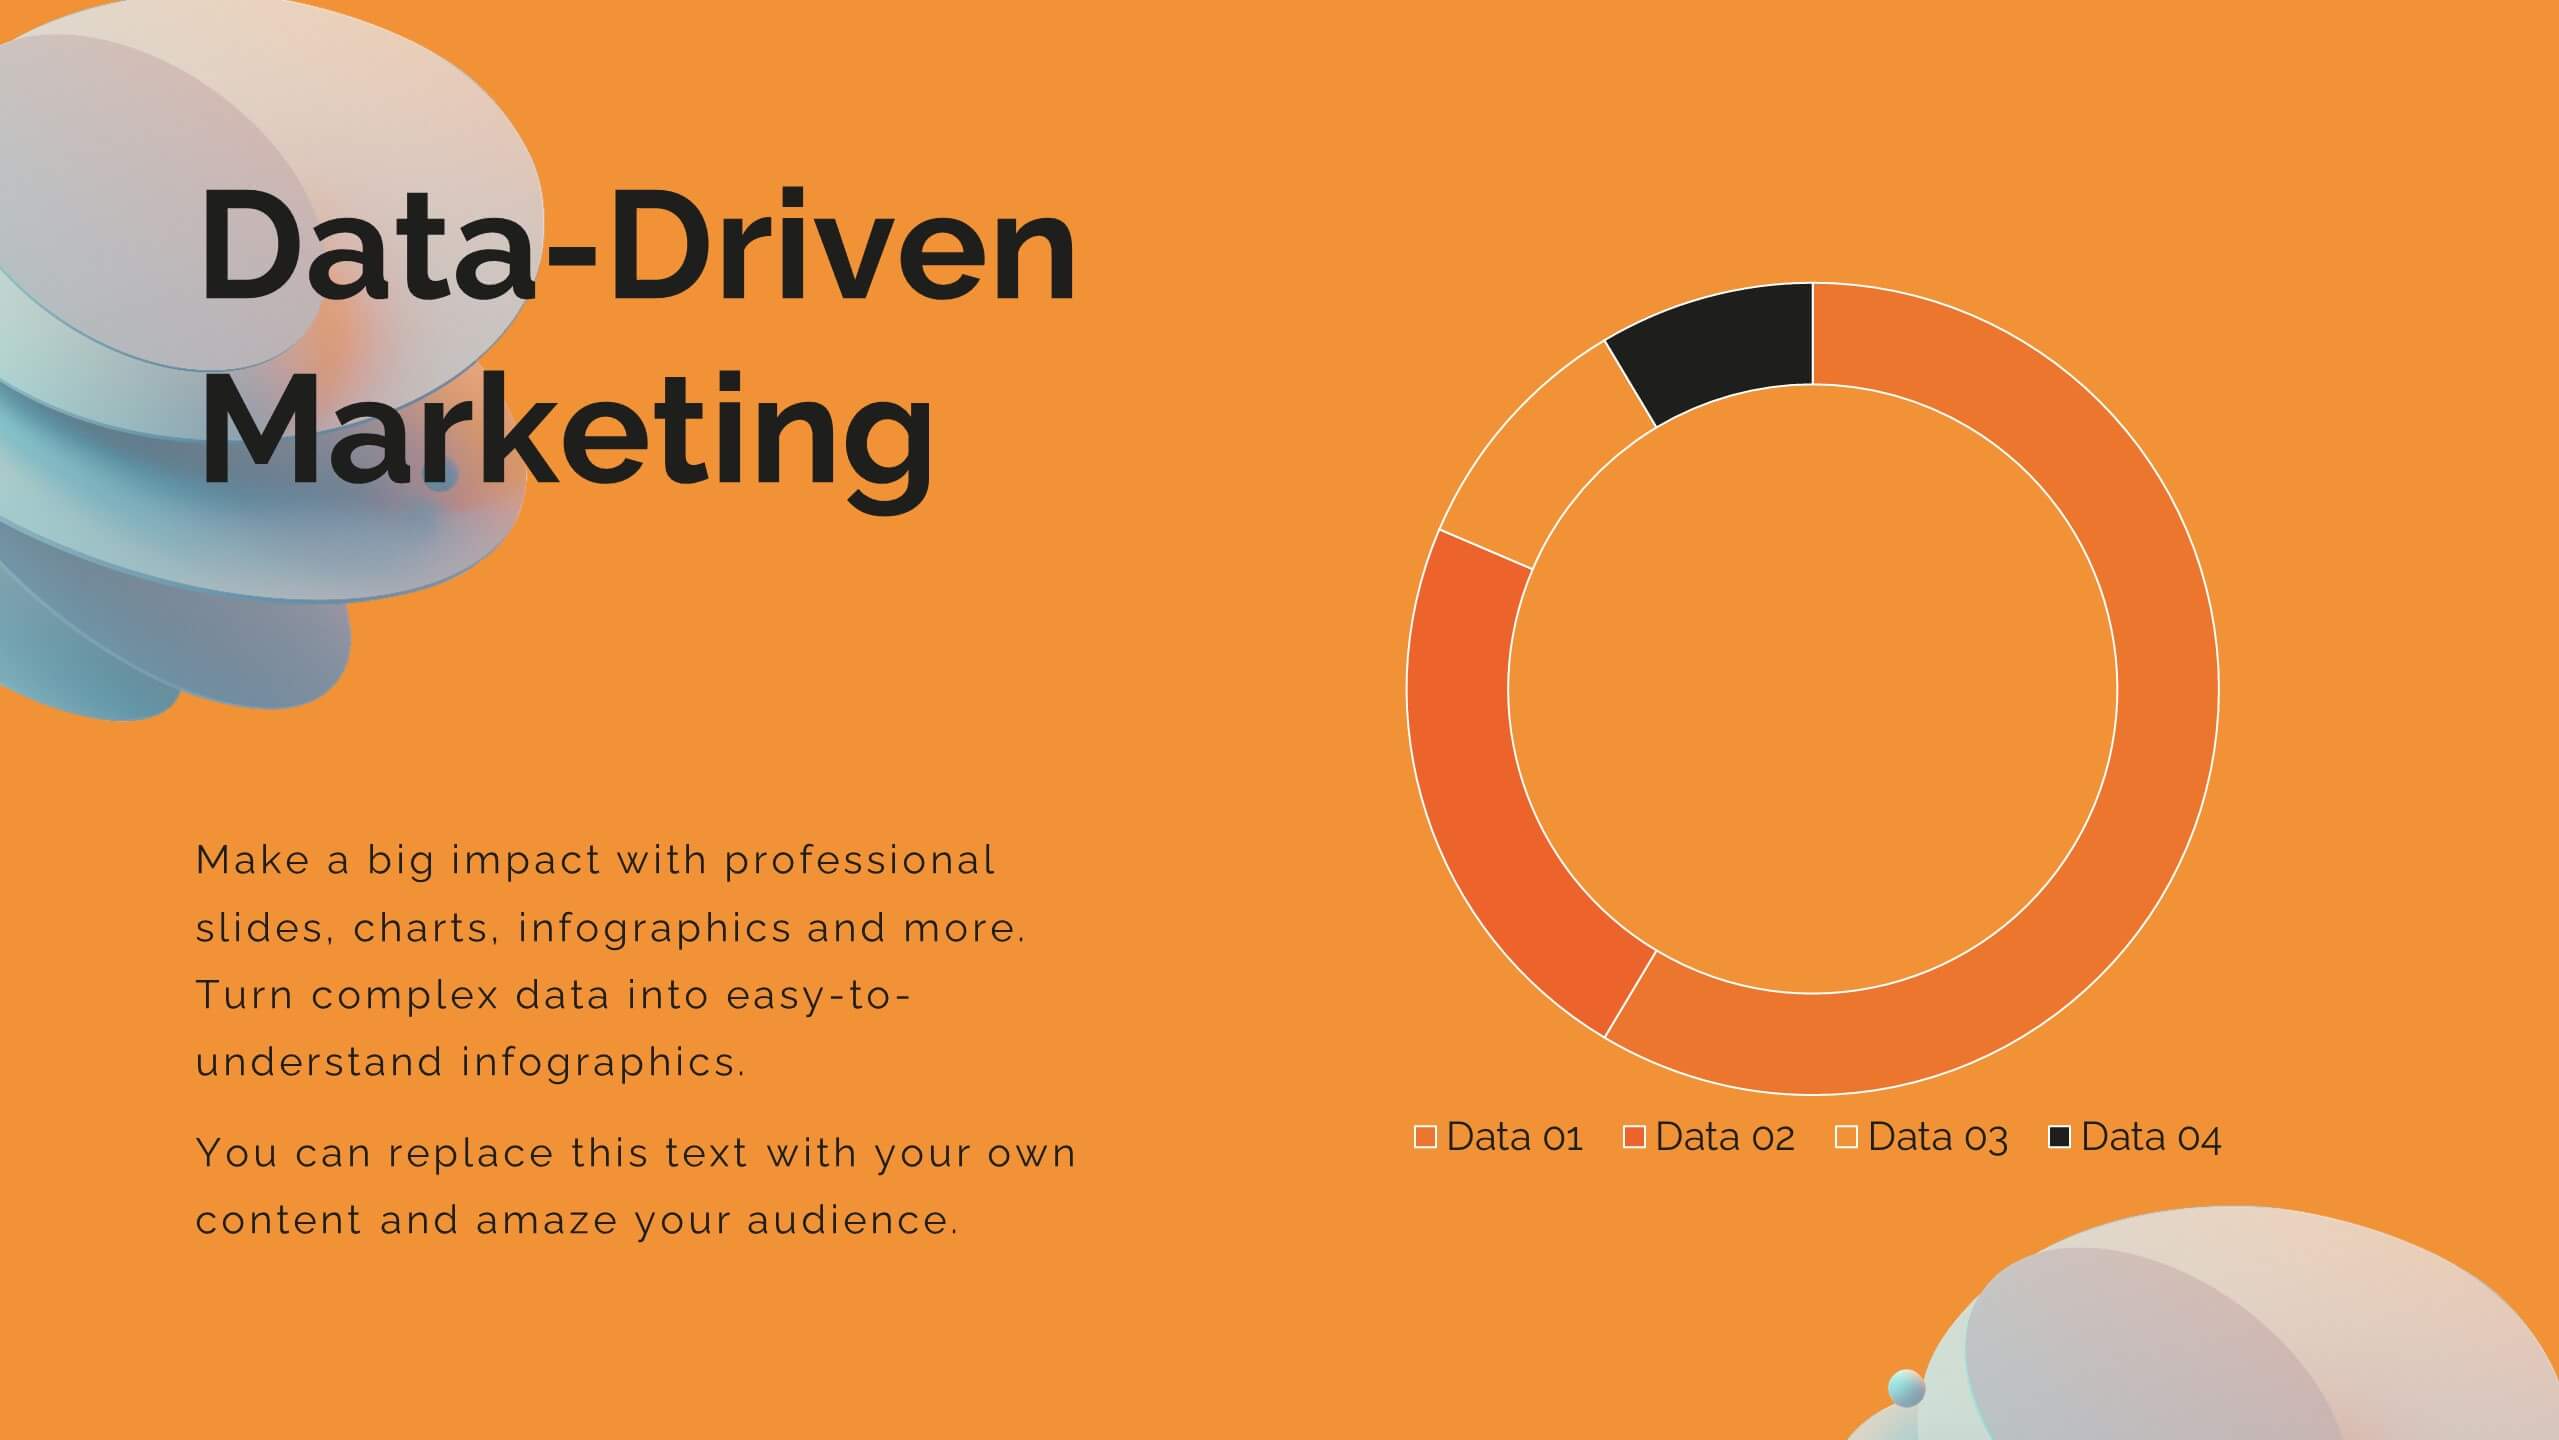
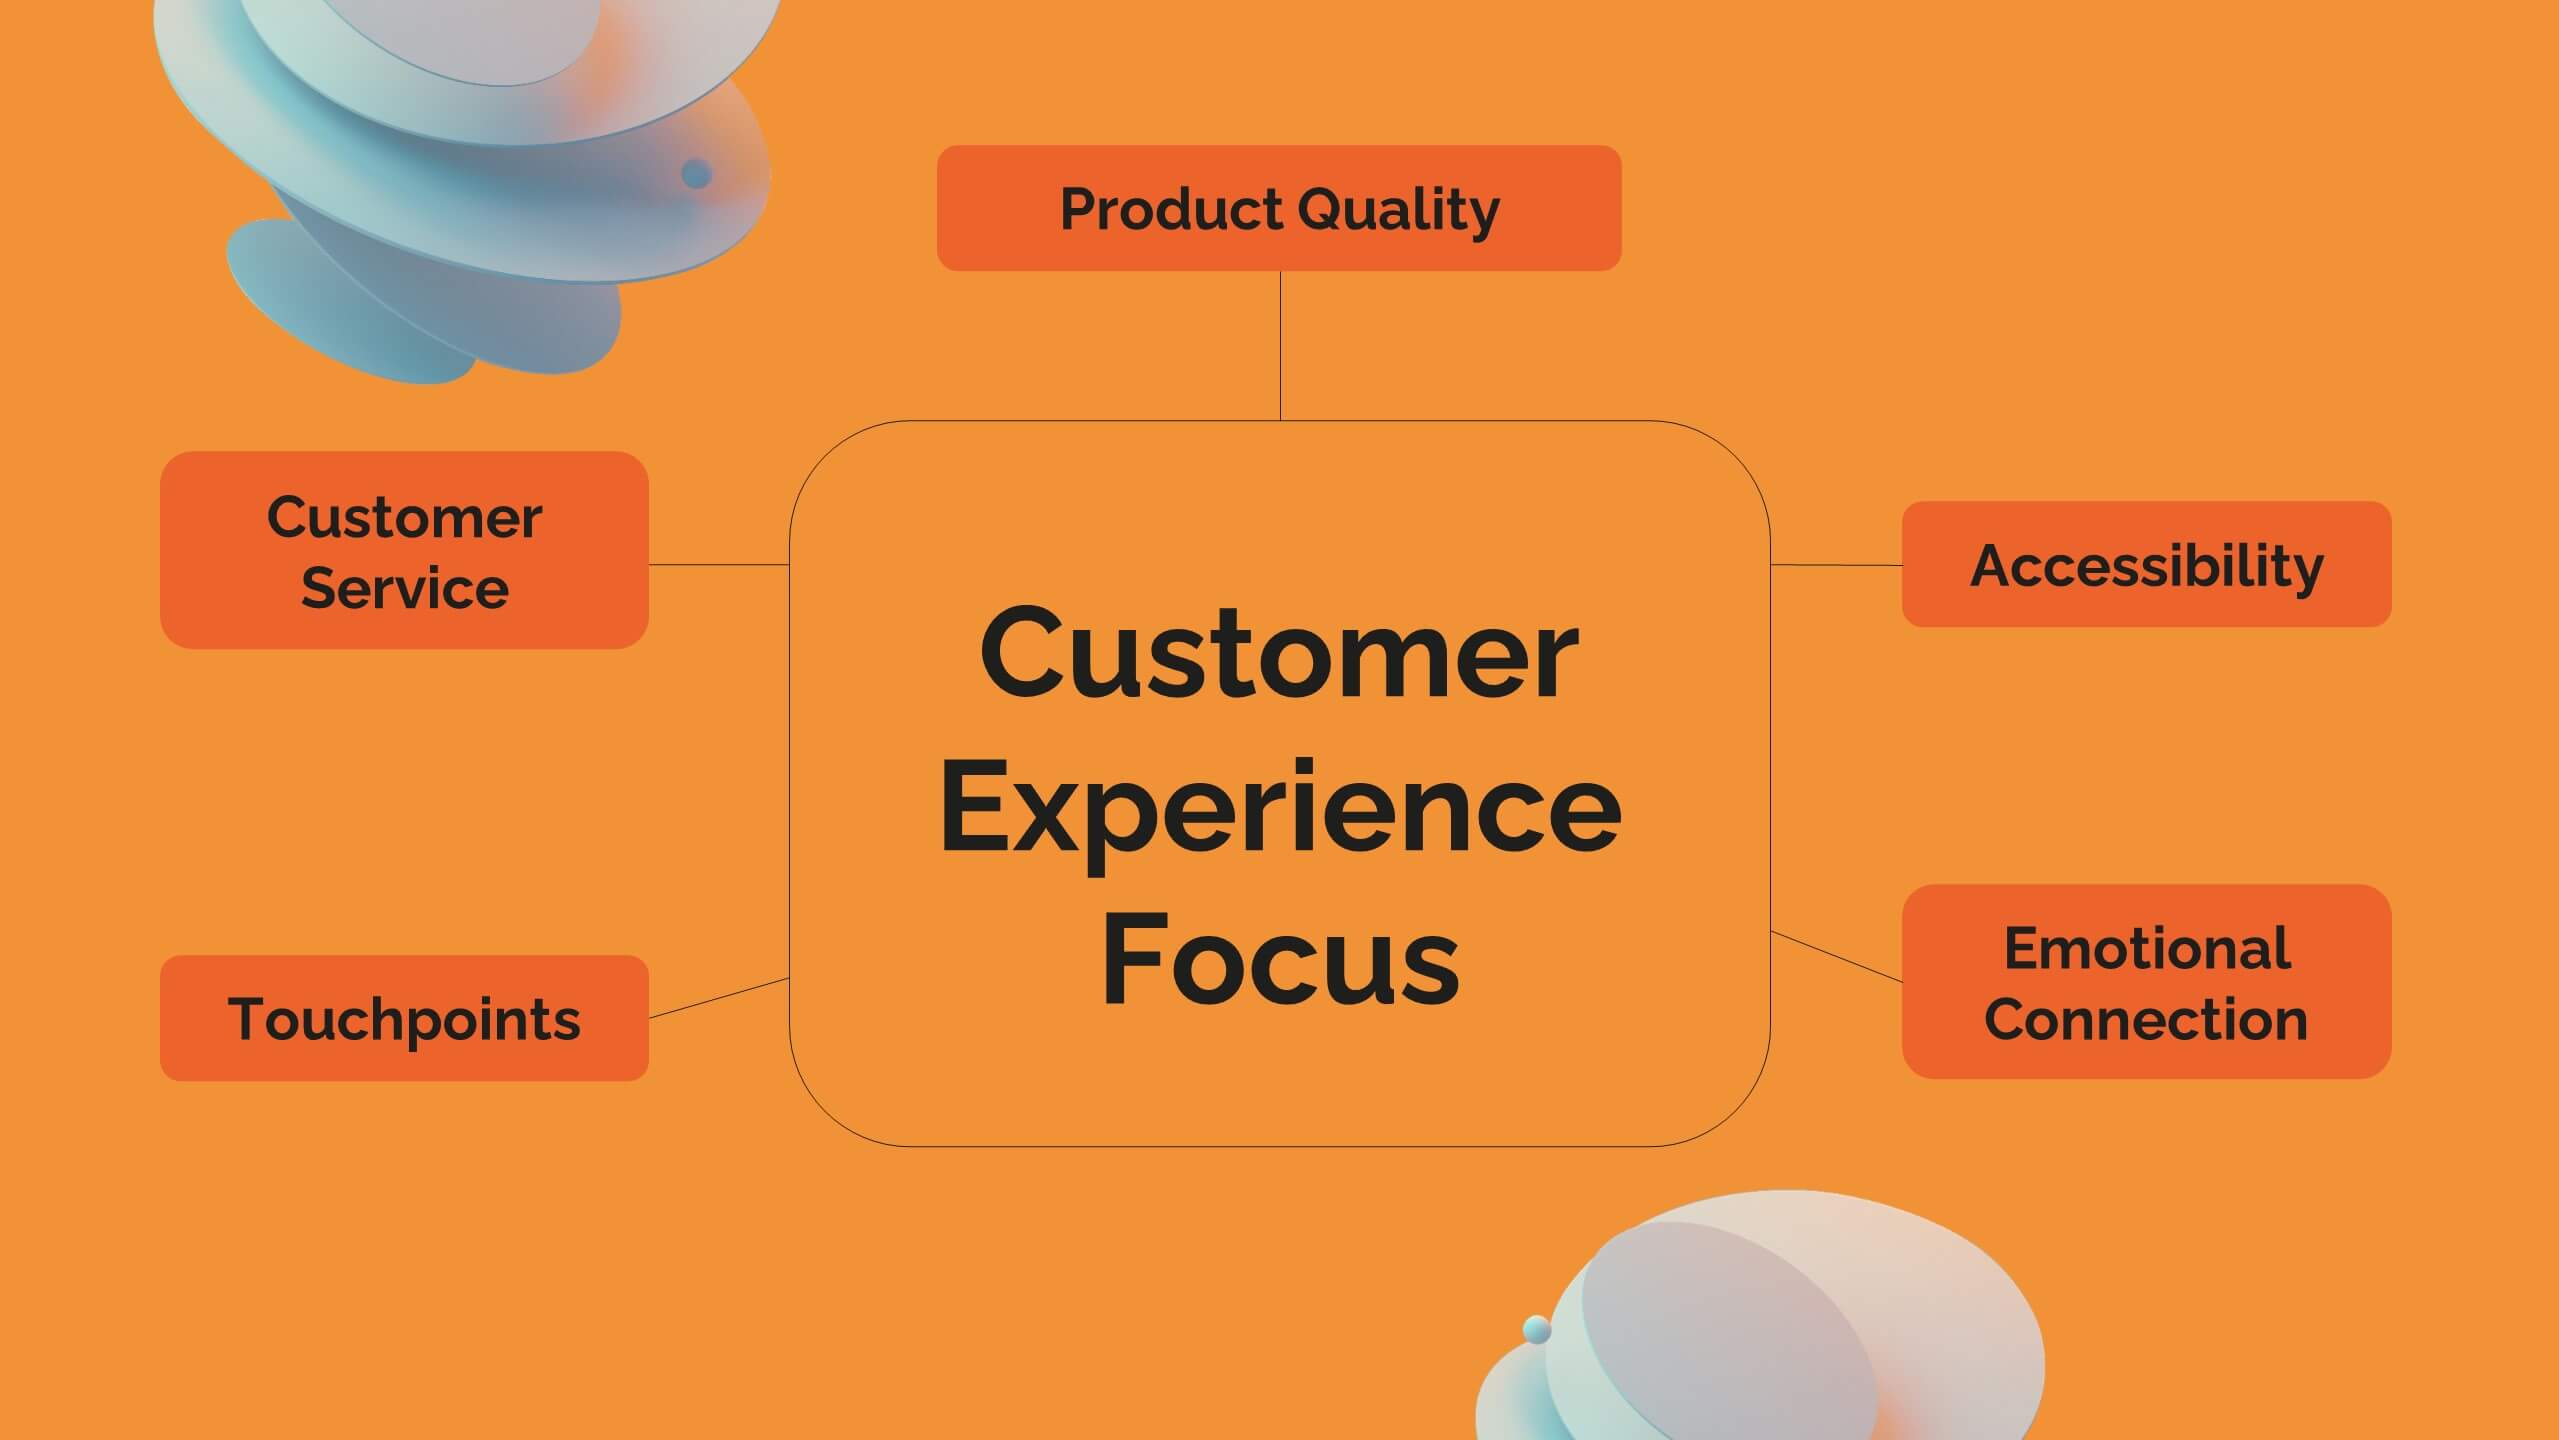
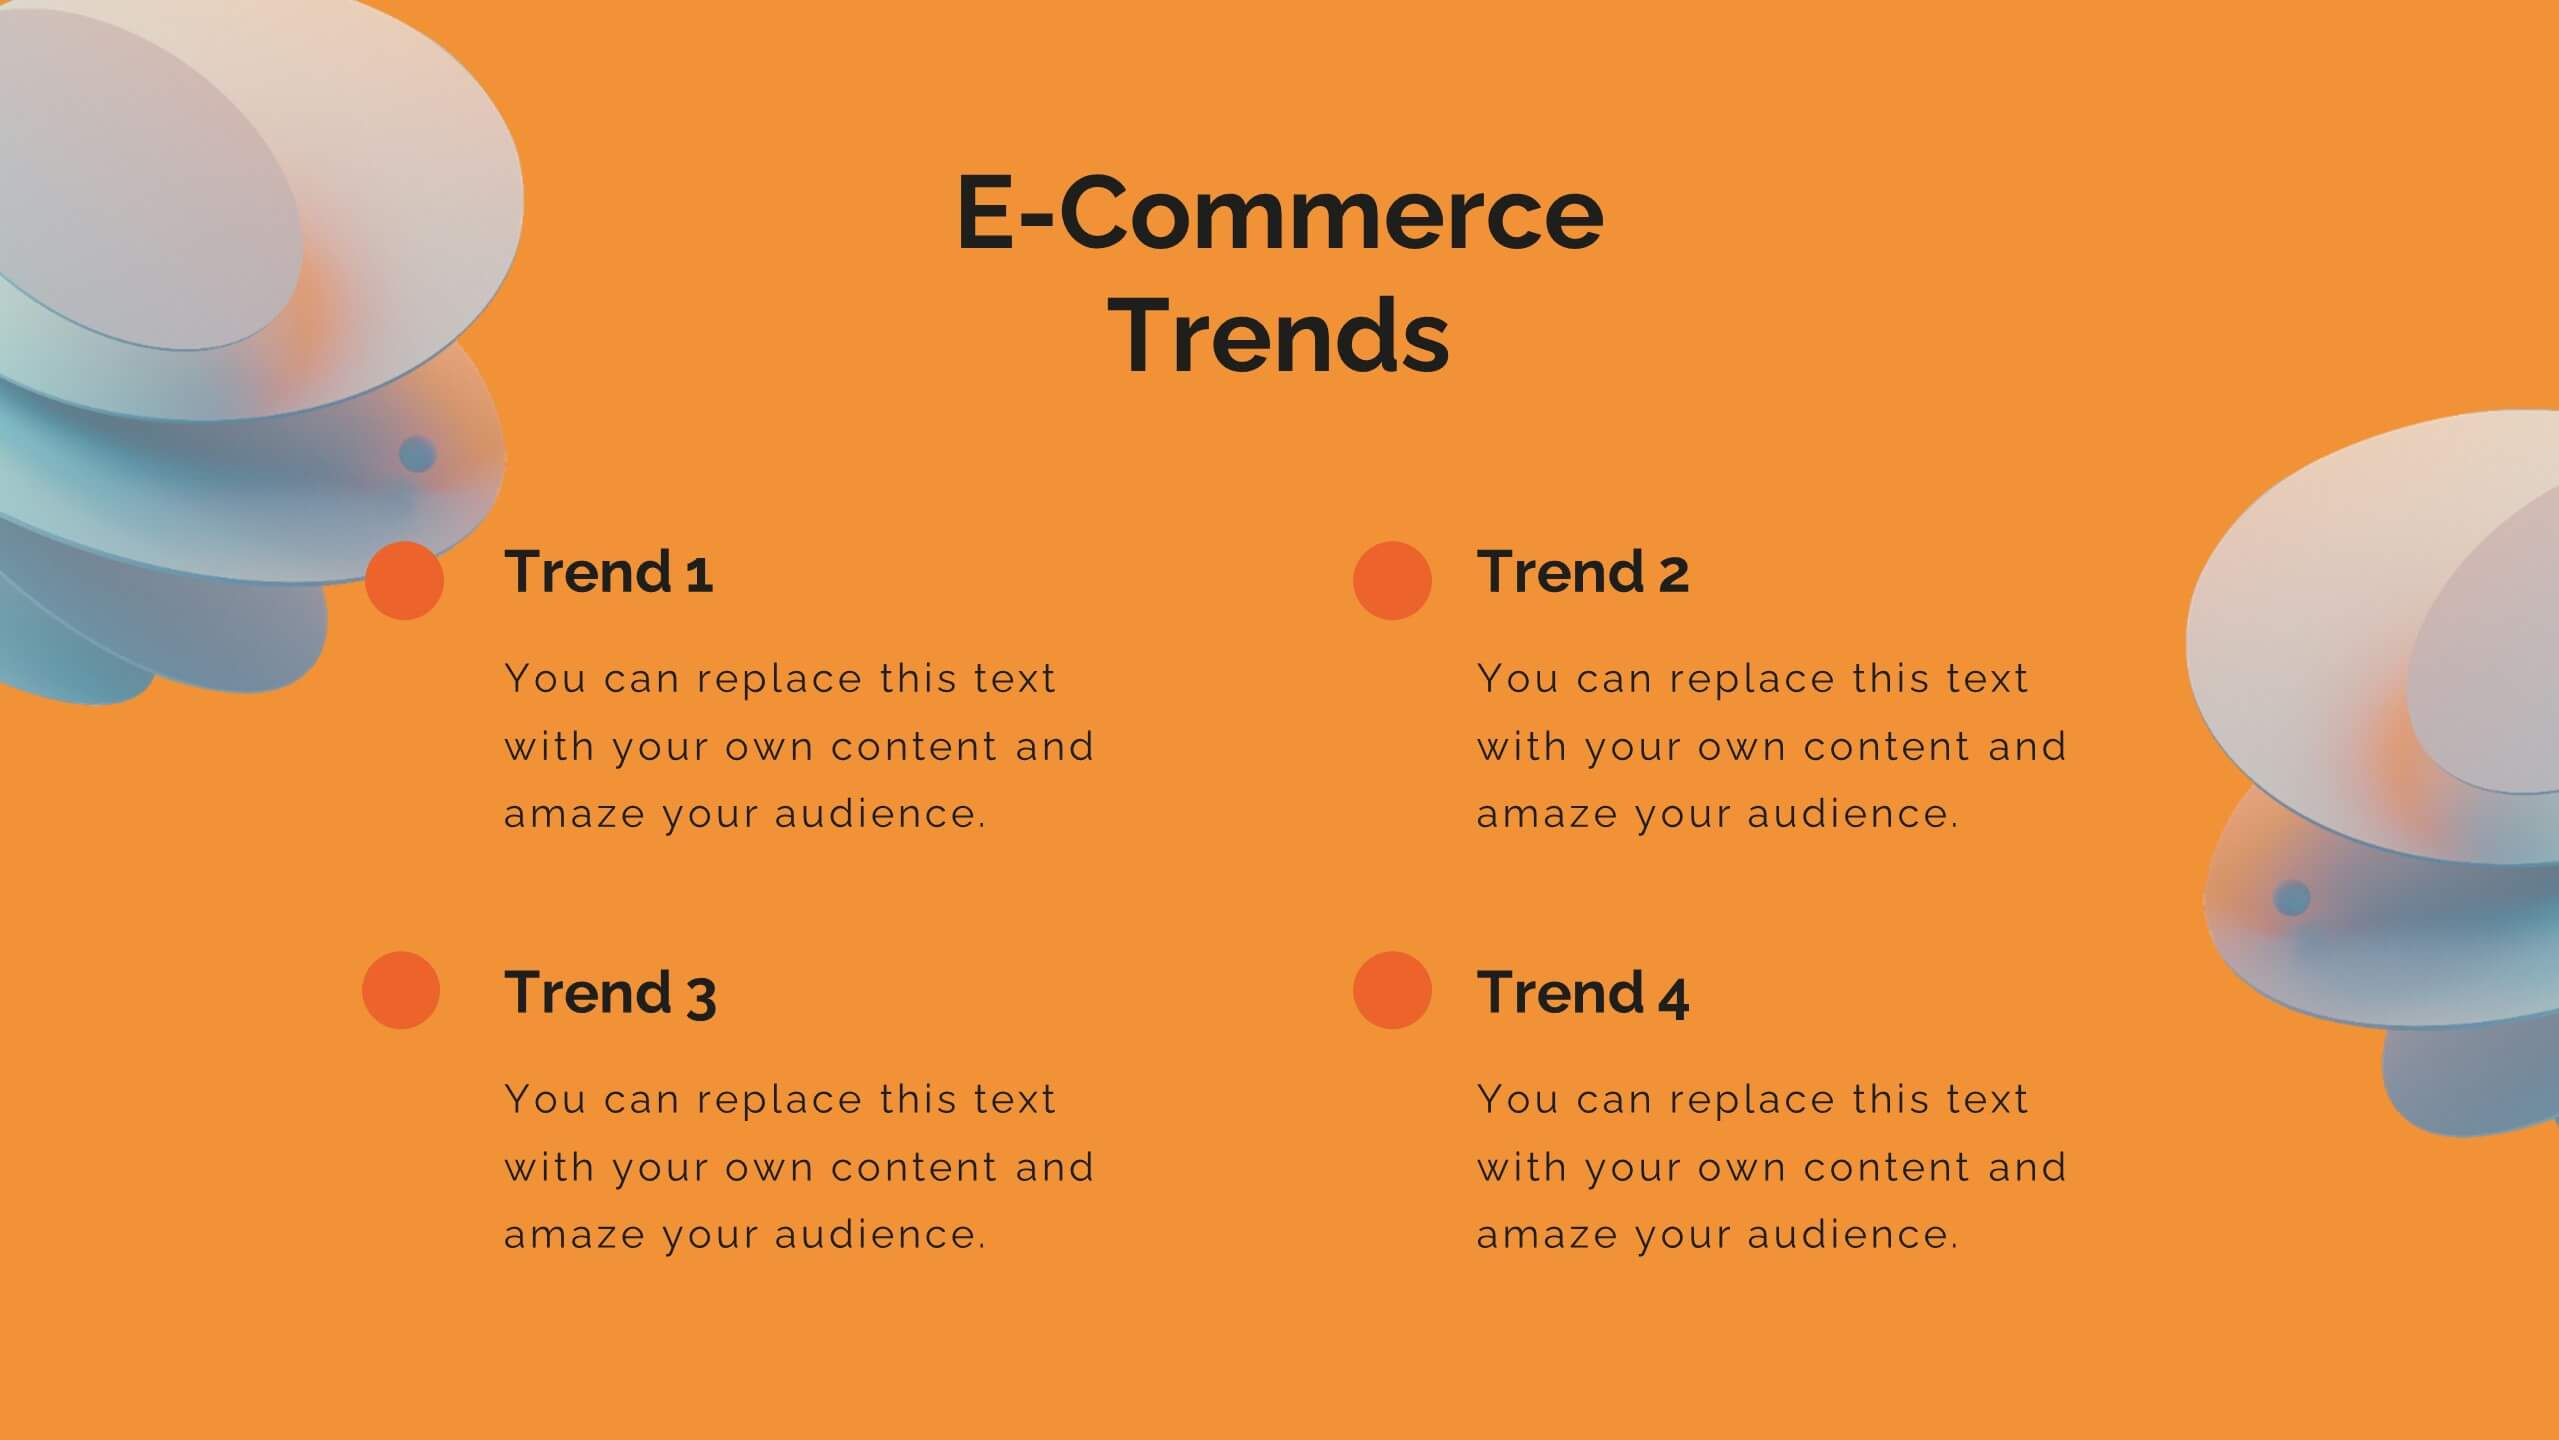
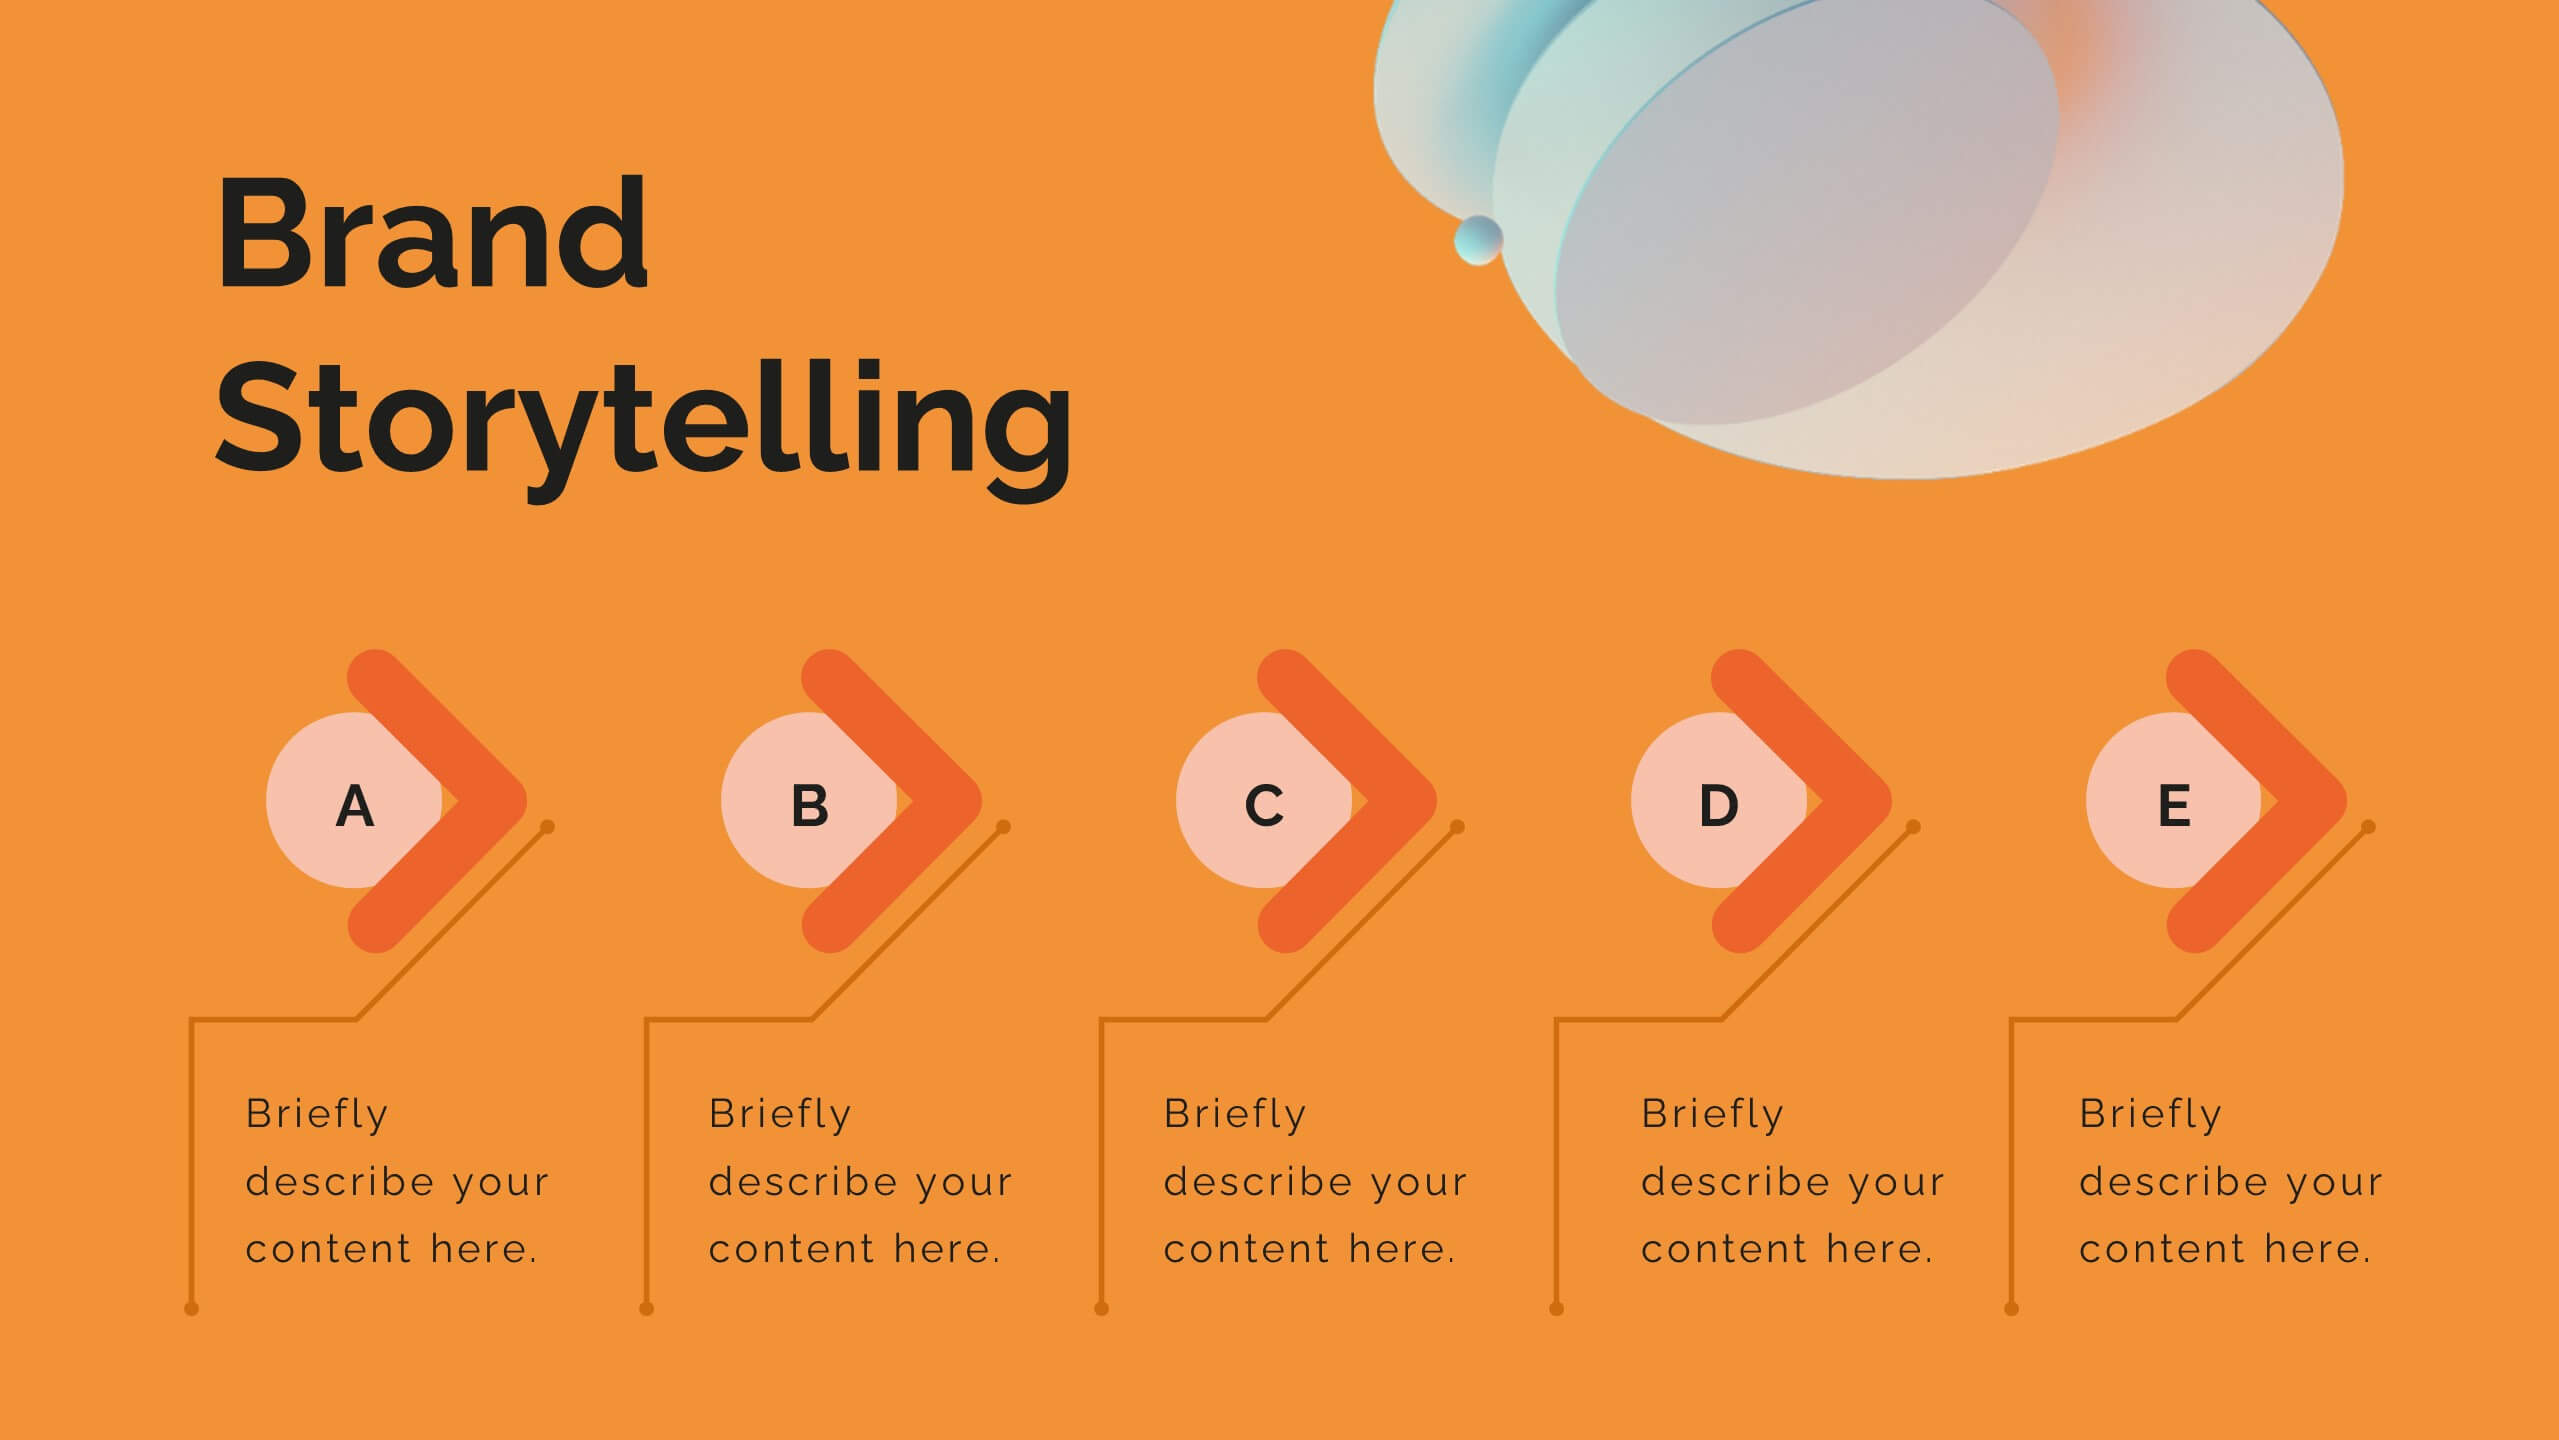
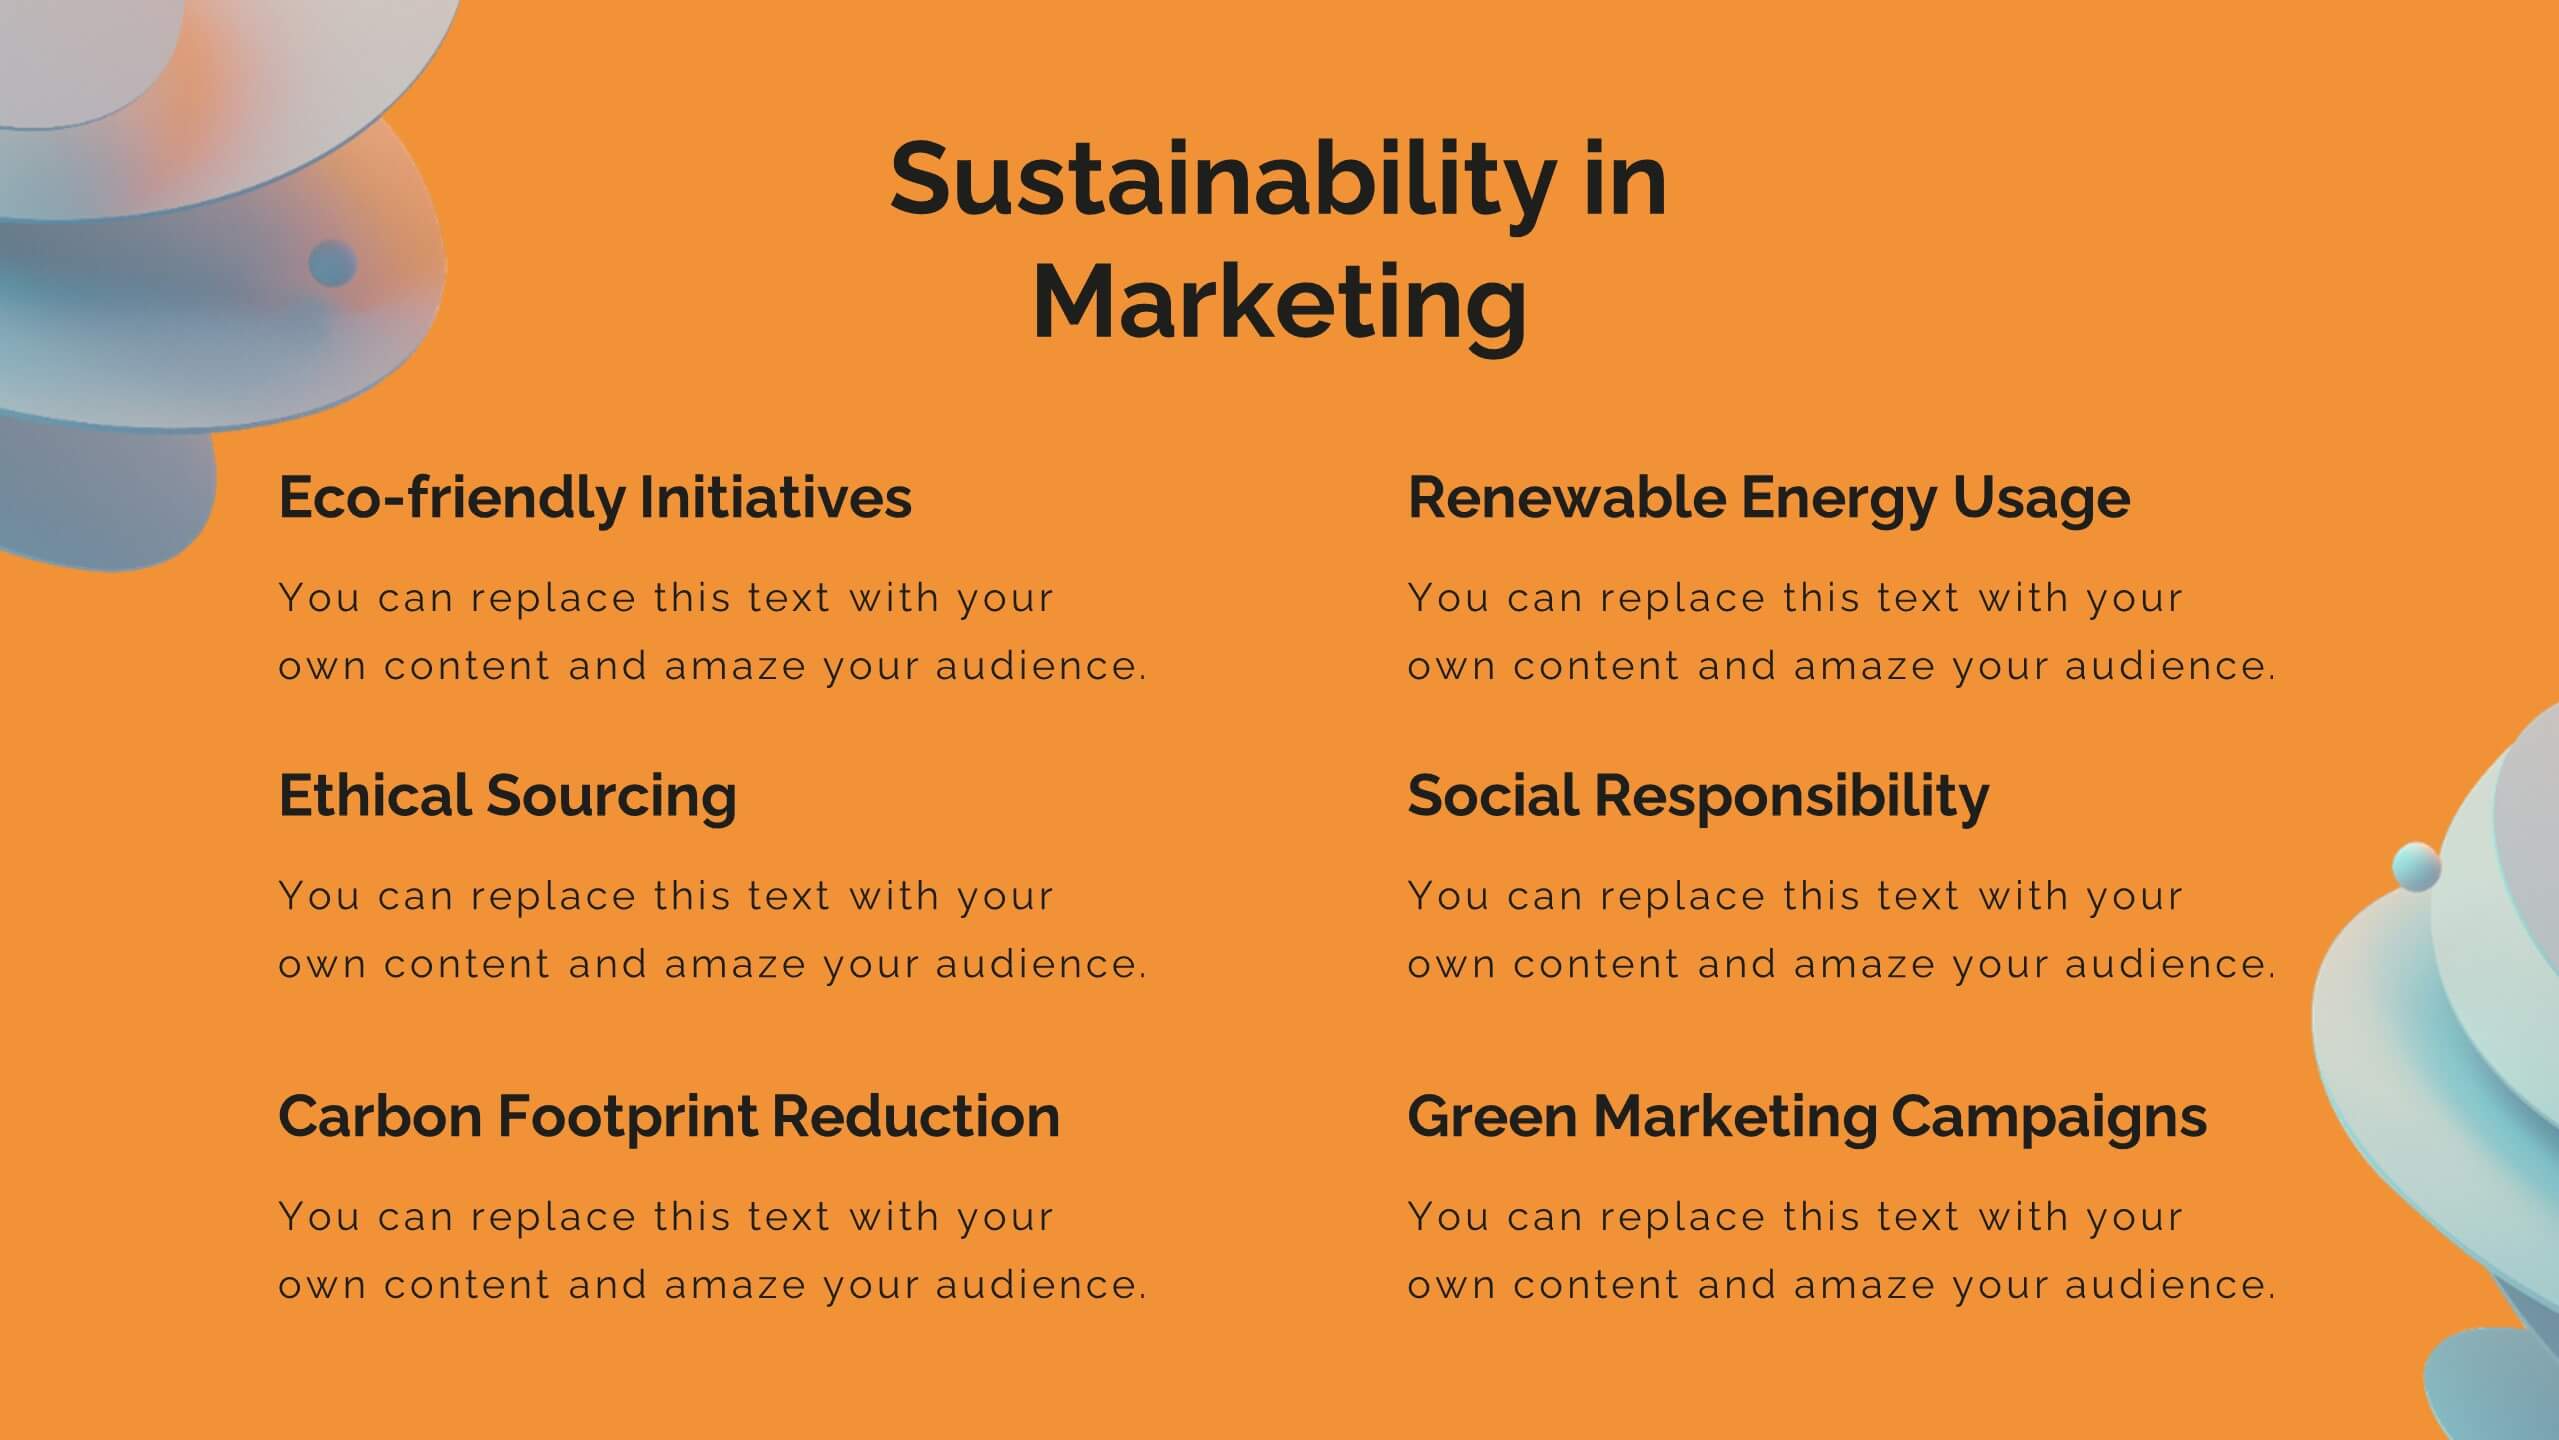
Breeze Content Marketing Pitch Deck Presentation
Elevate your content marketing strategy with this vibrant pitch deck! Perfect for outlining industry trends, consumer behavior, and innovative techniques. Ideal for marketers aiming to impress clients and stakeholders. Compatible with PowerPoint, Keynote, and Google Slides, this template ensures your pitch is engaging, persuasive, and professional. Achieve marketing success today!


6 diapositivas
Editable Weekly Calendar Slide Presentation
Bring your week into focus with a vibrant layout that turns daily planning into something you actually look forward to. This presentation helps you outline tasks, deadlines, and priorities in a clear, color-coded structure perfect for productivity. Fully editable and compatible with PowerPoint, Keynote, and Google Slides.


5 diapositivas
Business Figures and Key Numbers Overview Presentation
Present your data with clarity using this key-themed slide layout. Ideal for outlining five important metrics, business highlights, or strategic figures. The bold numerical format and clean design make your content easy to follow. Fully customizable in Canva, perfect for professional reports, pitches, and data-driven presentations.


10 diapositivas
Leadership and Organizational Vision Presentation
Showcase your company’s path to growth and alignment with this sleek Leadership and Organizational Vision slide. The diamond-shaped infographic flow is perfect for outlining mission pillars, executive strategies, or value-driven goals across five stages. Each section includes icons and editable descriptions for clarity and engagement. Ideal for strategic planning sessions, team briefings, or executive reports. Fully customizable in PowerPoint, Keynote, and Google Slides for seamless integration into your presentation.


21 diapositivas
Minoan Project Timeline Presentation
Step back in time with this beautifully crafted Minoan-inspired presentation, perfect for outlining your project timeline! With an elegant design and clear structure, this template helps you showcase key milestones, deadlines, and deliverables in a visually stunning way. Keep your project on track. Compatible with PowerPoint, Keynote, and Google Slides.


6 diapositivas
Business Idea Presentation for Investors Presentation
Present your business concept with clarity using the Business Idea Presentation for Investors. This unique hexagon-centric layout highlights six key pillars of your idea—perfect for showcasing problem-solving, market fit, innovation, competitive advantage, scalability, and profitability. Each point includes customizable icons and text, allowing you to adapt it to your pitch needs. Clean, visually balanced, and easy to edit in PowerPoint, Keynote, or Google Slides, this slide is ideal for entrepreneurs, founders, and startup teams seeking investment and buy-in.


5 diapositivas
SWOT Analysis Business Presentation
Identify key business factors with the SWOT Analysis Business Infographic. This structured template visually highlights strengths, weaknesses, opportunities, and threats, making it ideal for strategy planning, competitive analysis, and decision-making. Fully customizable with editable colors, text, and icons. Compatible with PowerPoint, Keynote, and Google Slides for effortless presentation use.


6 diapositivas
Industry Analysis with Porter's Forces Presentation
The Industry Analysis with Porter's Forces Presentation offers a clean and strategic layout for visualizing competitive dynamics. This deck illustrates the five forces—Buyers, Suppliers, Competitors, Substitutions, and New Entry—in a semi-circular flow that makes relationships easy to understand. Each force is paired with editable text and icons for clarity. Ideal for market research, business strategy, or consulting work. Fully compatible with PowerPoint, Keynote, and Google Slides.


4 diapositivas
Survey Response Data Visuals Presentation
Present your survey data clearly with this radial icon-based layout. Show response percentages alongside descriptive titles and modern visuals. Ideal for feedback analysis or research summaries. Fully editable in Canva, PowerPoint, or Google Slides, this template offers a clean, professional look to highlight key insights with ease.