


Características


¿Tienes alguna pregunta?
Recomendar


4 diapositivas
Products Comparison Table Presentation
Make your decision-making story instantly clear with a bold visual that balances options in a clean, modern way. This presentation helps you compare features, weigh benefits, and highlight key differences using simple graphics and intuitive labeling. Fully compatible with PowerPoint, Keynote, and Google Slides.


5 diapositivas
Innovation Framework Presentation
Turn bold ideas into structured success with this engaging presentation design. Perfect for mapping creative processes, innovation systems, and project development stages, it helps present ideas clearly and visually. Fully editable and easy to customize, this presentation is compatible with PowerPoint, Keynote, and Google Slides for effortless use.


26 diapositivas
Hypnosia Brand Guidelines Proposal Presentation
This Brand Guidelines Proposal Template provides a sleek, professional layout to showcase key branding elements like vision, values, identity, and strategy. Perfect for businesses and agencies, it ensures brand consistency. Fully customizable and compatible with PowerPoint, Keynote, and Google Slides for seamless adaptation to your brand’s style.


5 diapositivas
Competitor Comparison Infographics
A Comparison Infographic is a type of visual representation that displays the similarities and differences between two or more items, concepts, or ideas. This template is perfect to help viewers easily make informed decisions based on the comparison. These infographics are visual representations of data that are used to compare two or more things. These infographics can be used to highlight the differences or similarities between different products, services, companies, or any other entities that can be compared. Included are charts, graphs, tables, and other visual elements to help present information in a clear manner.


8 diapositivas
Business Purpose and Mission Alignment Presentation
Clarify your organization’s direction with this step-by-step alignment slide. Featuring four sequential stages, each with icons, numbers, and customizable text boxes, this layout helps visually communicate how your business goals align with your mission. Perfect for strategic planning, team alignment workshops, and leadership presentations. Fully editable and compatible with PowerPoint, Keynote, and Google Slides.


4 diapositivas
Regional Business Focus on Asia Presentation
Showcase your company’s strategic footprint with the Regional Business Focus on Asia Presentation. This clean, icon-labeled map layout helps illustrate key markets, logistics routes, or development hubs across Asia. Ideal for business expansion plans, investment updates, or regional performance overviews. Fully editable in PowerPoint, Keynote, Google Slides, and Canva.


2 diapositivas
Closing Slide with Appreciation Note Presentation
Wrap up your presentation with energy using the Closing Slide with Appreciation Note Presentation. This bold, modern design features a “Thanks” message and a standout CTA—perfect for directing your audience to more content. Includes light and dark background options to match your theme. Fully editable in Canva, PowerPoint, Keynote, and Google Slides.


6 diapositivas
Historical Data Timeline Visualization
Showcase historical progression with clarity using the Historical Data Timeline Visualization. Designed for presenting chronological data points, this template combines circle elements with image icons and milestone labels—perfect for educational or historical presentations. Fully editable in Canva, PowerPoint, Keynote, and Google Slides for seamless customization.


6 diapositivas
Safety Department Infographics
Promote safety awareness with our Safety Department infographic template. This template is fully compatible with popular presentation software like PowerPoint, Keynote, and Google Slides, allowing you to easily customize it to illustrate and communicate the role and functions of a safety department within an organization. The Safety Department infographic template offers a visually engaging platform to highlight the responsibilities, goals, and initiatives of a safety department. Whether you're a safety officer, HR professional, business leader, or interested in workplace safety, this template provides a user-friendly canvas to create informative presentations and educational materials. Enhance safety practices and awareness with this SEO-optimized Safety Department infographic template, thoughtfully designed for clarity and ease of use. Customize it to showcase safety protocols, training programs, incident reporting, and the importance of a safety-focused culture, ensuring that your audience understands the critical role of the safety department. Start crafting your personalized infographic today to promote a safer work environment.


14 diapositivas
Business Innovation and Idea Development Presentation
Drive Business Innovation and Idea Development with this dynamic and structured template, perfect for illustrating creative processes, strategic growth, and idea execution. Designed with a lightbulb-themed layout, this presentation helps break down complex concepts into clear, engaging sections. Fully customizable and compatible with PowerPoint, Keynote, and Google Slides, making it an essential tool for entrepreneurs, teams, and business leaders looking to present ideas with impact.


5 diapositivas
4-Phase Product Lifecycle Diagram Presentation
Visualize your product’s evolution with the 4-Phase Product Lifecycle Diagram Presentation. Perfect for marketing, strategy, and product teams, this template maps out introduction, growth, maturity, and decline stages. Fully editable in PowerPoint, Keynote, and Google Slides—ideal for product managers, analysts, and educators presenting strategic roadmaps or lifecycle planning.


7 diapositivas
SEO Strategy and Keyword Plan Presentation
Spark your marketing roadmap with a bold, idea-driven layout that makes every action step clear and memorable. This presentation helps you outline search goals, explore keyword opportunities, and map out strategic priorities in a simple, visual flow. Fully compatible with PowerPoint, Keynote, and Google Slides.


7 diapositivas
McKinsey 7S Management Infographic Presentation
The McKinsey 7S model is designed to help organizations understand the various components that need to be aligned for effective performance. This Infographic is a visually engaging way to describe the 7S framework. Use it to deliver an informative message and get your ideas across clearly using the well designed graphics. This template is fully customizable to portray your company's key points and challenges in your specific business domain. It has all the elements to make a powerful business presentation and can create engaging templates with Powerpoint, Keynote, Google Slides and more.


4 diapositivas
Three-Dimensional Business Model Slide Presentation
Visualize growth and complexity with the Three-Dimensional Business Model Slide Presentation. This template uses sleek 3D chart elements to illustrate layered business concepts across 1D, 2D, and 3D perspectives. Ideal for modeling scalability, market maturity, or performance comparisons. Fully customizable in PowerPoint, Keynote, and Google Slides.
22 diapositivas
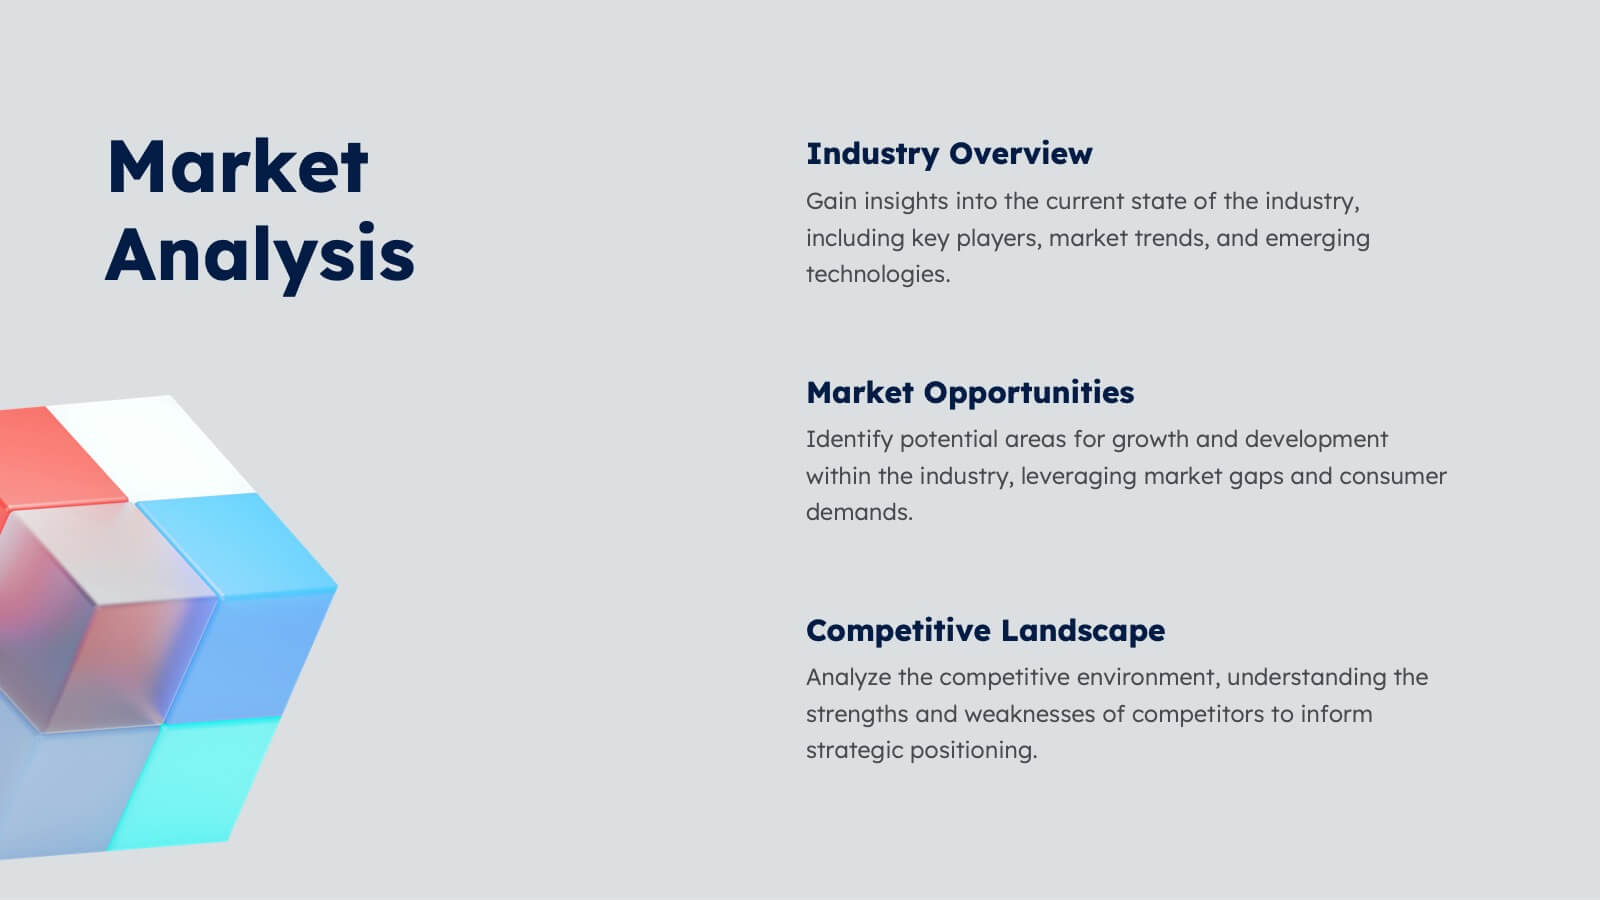
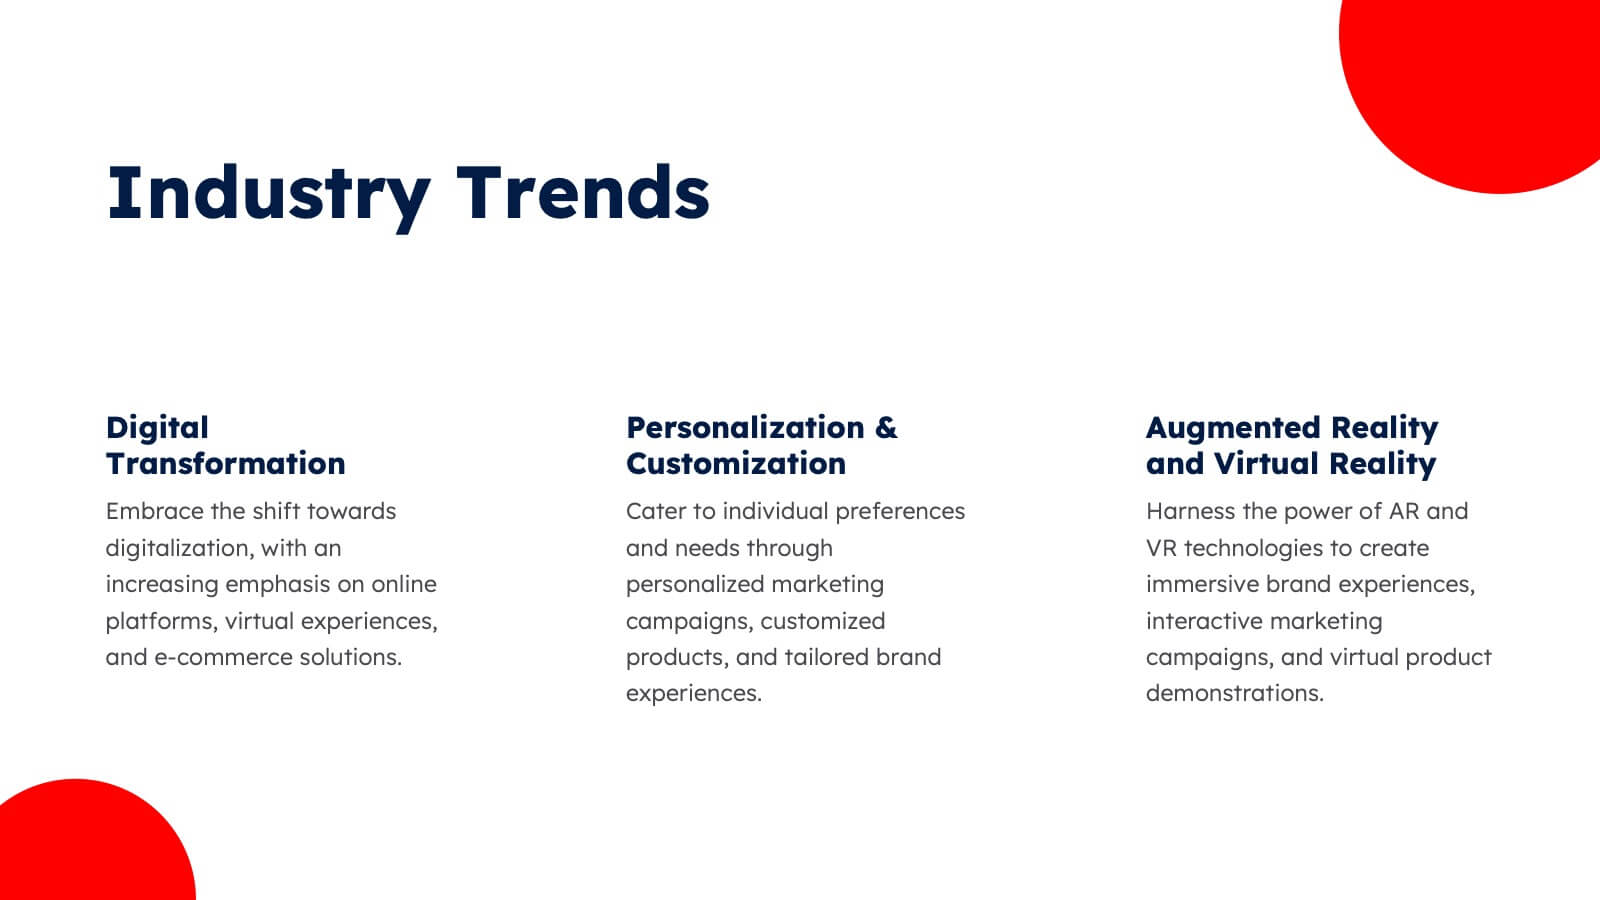
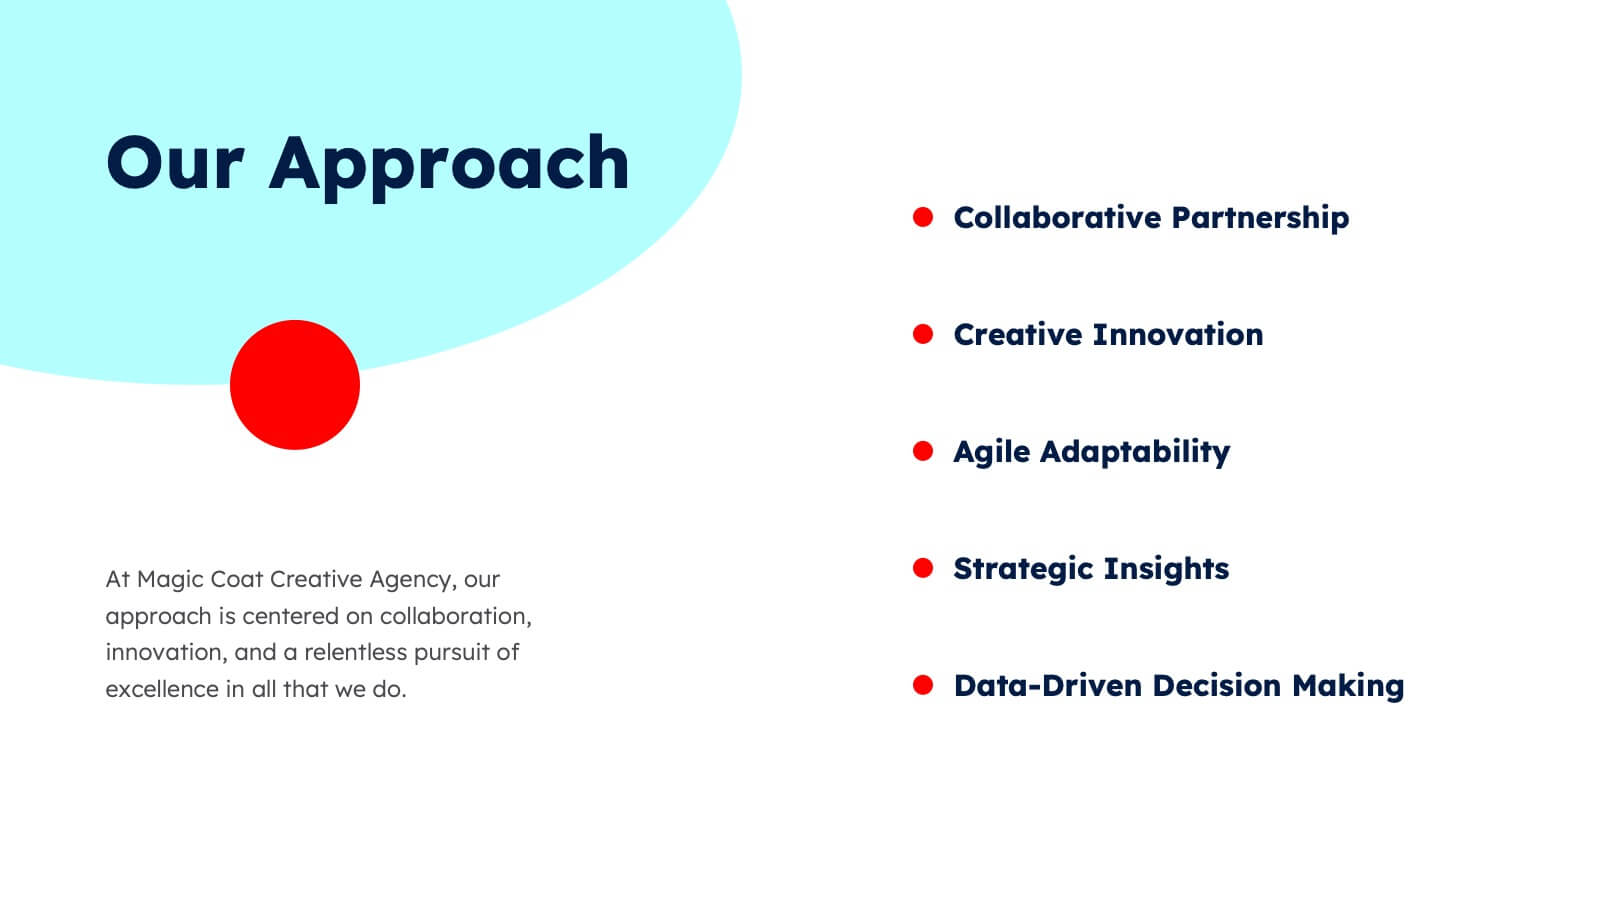
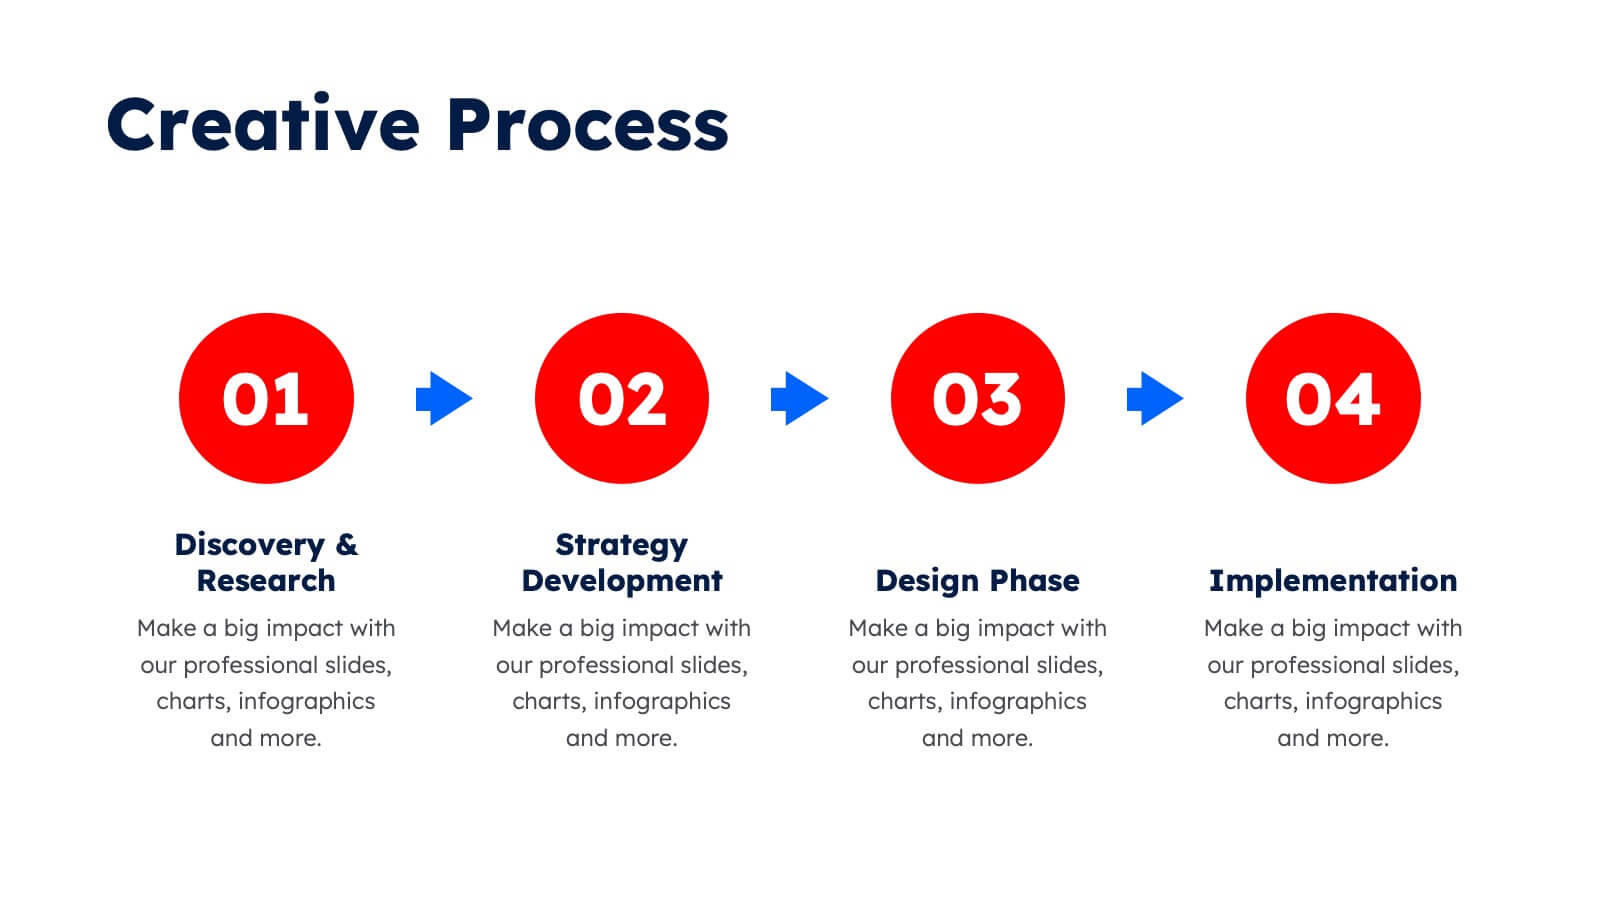
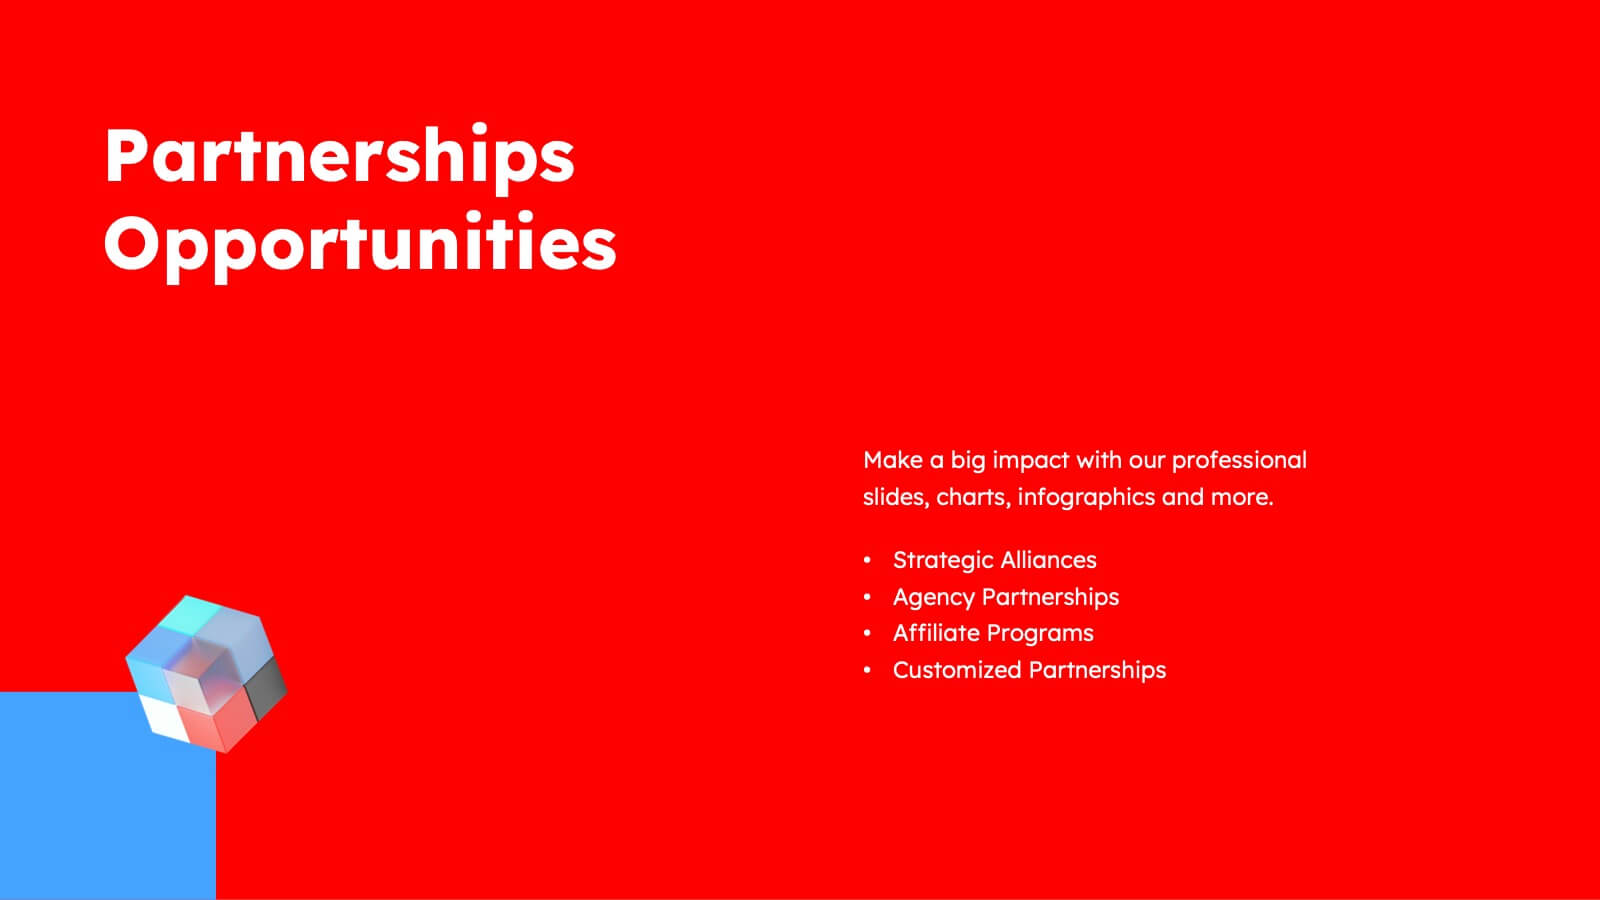
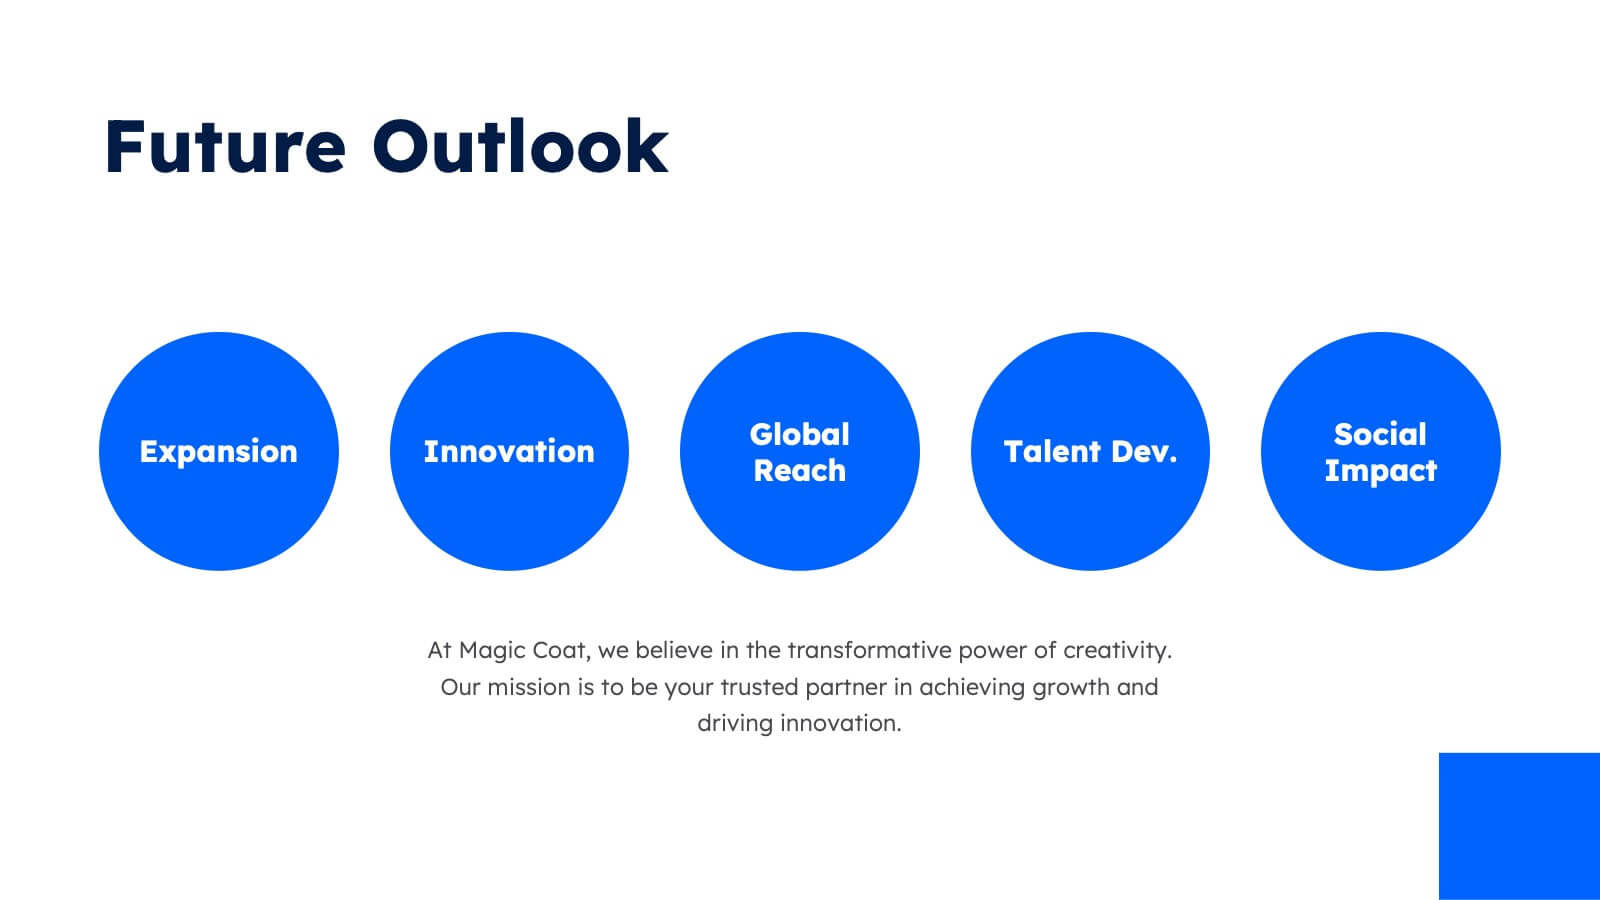
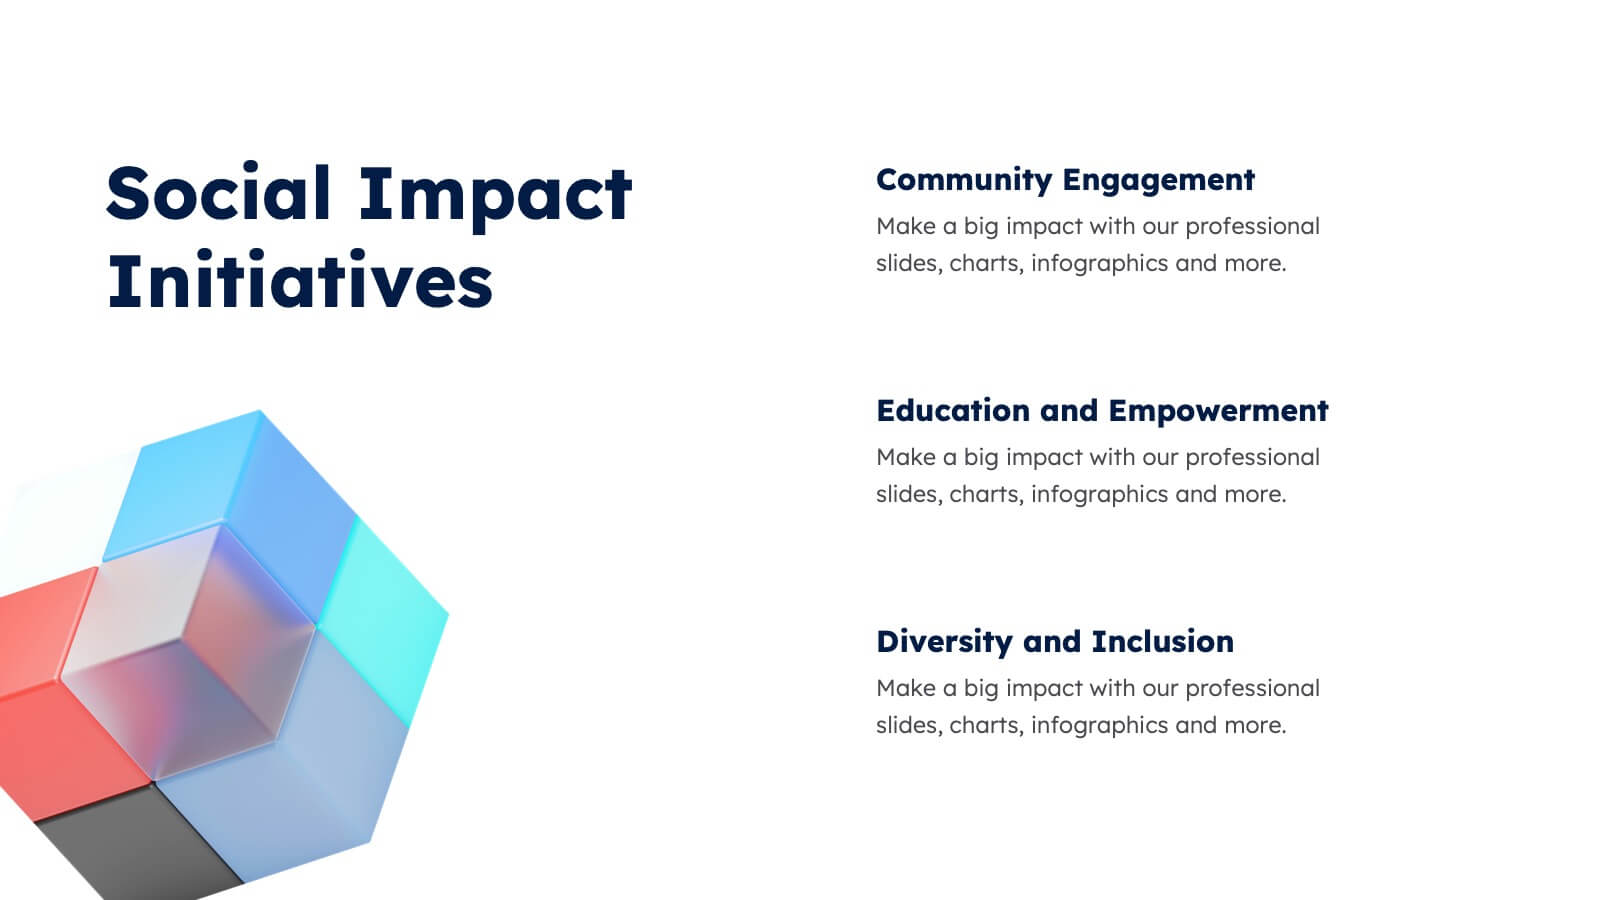
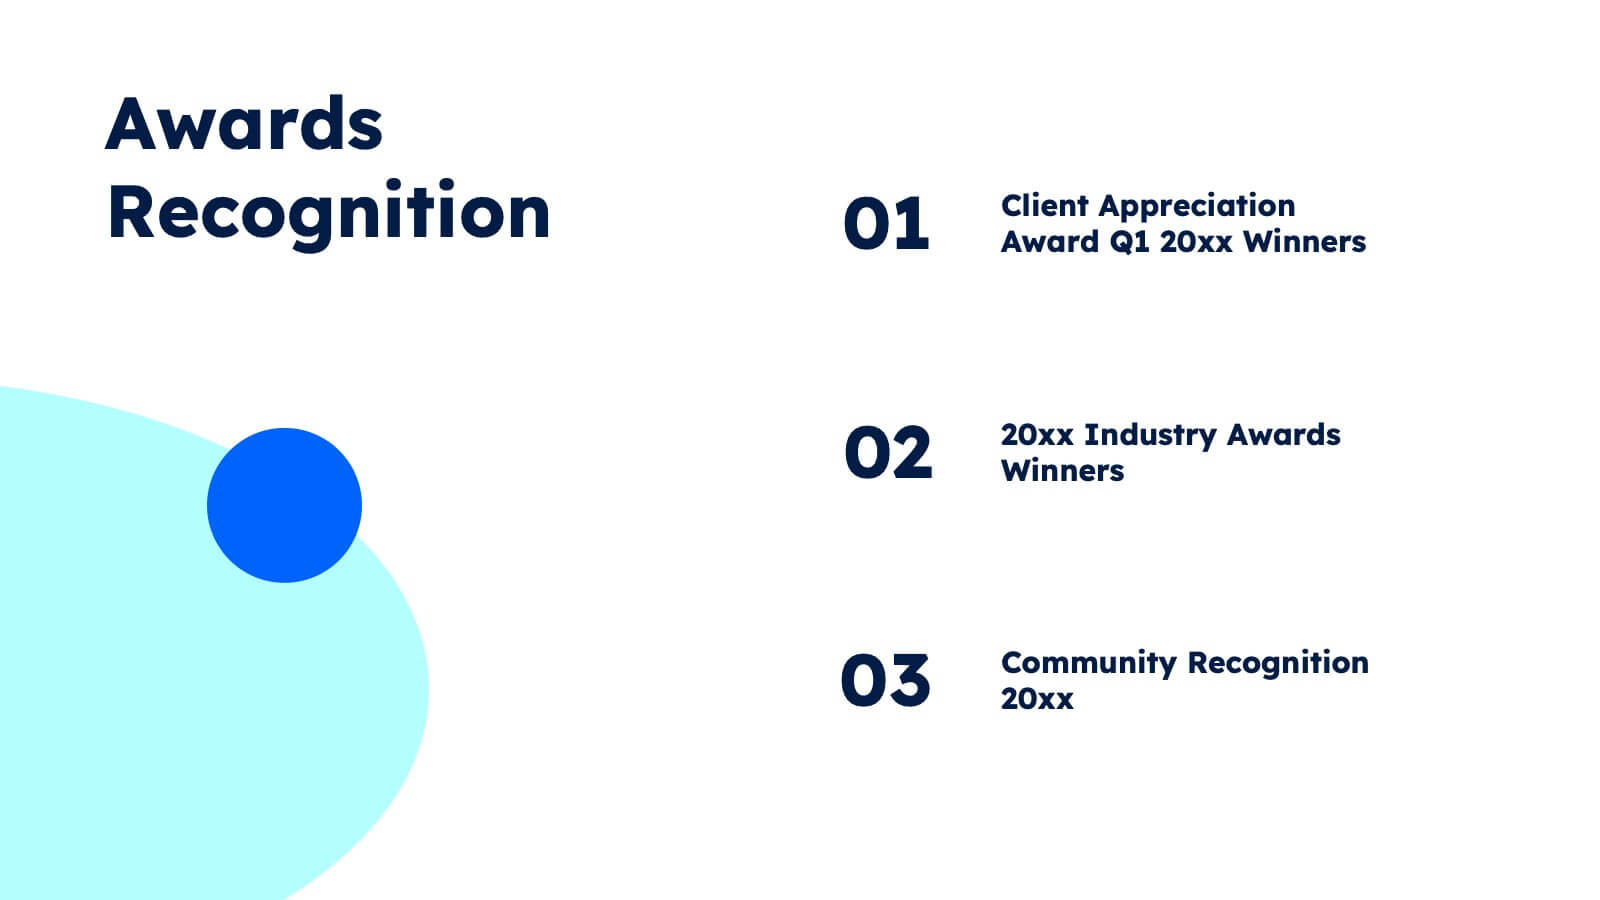
Aura Agency Portfolio Presentation
Showcase your agency's brilliance with this vibrant portfolio presentation template! Ideal for highlighting your mission, vision, case studies, and market analysis, it brings your achievements to life with colorful, engaging slides. Impress clients and partners with a well-structured, visually appealing narrative. Compatible with PowerPoint, Keynote, and Google Slides for easy use on any platform.


6 diapositivas
User Satisfaction Scoring System
Showcase user feedback with this vibrant User Satisfaction Scoring System Presentation. Featuring a semi-circle scale with expressive icons, it's perfect for visualizing survey results or customer experience insights. Fully editable in PowerPoint, Keynote, and Google Slides, this slide helps simplify scoring metrics while keeping your presentation clear, engaging, and professional


7 diapositivas
Innovation Strategy Infographic Presentation
An Innovation Infographic presents information related to innovation, including why it is important, and how it can be managed in different contexts. Innovation is the process of developing new ideas and products that create value and drive progress. This template is designed to help you effectively communicate the importance of innovation and provide tips and strategies for managing it. This template includes seven customizable layouts and charts, and allows you to include your own images. The template also includes editable text boxes and bullet points to present your information.