


Características


¿Tienes alguna pregunta?
Recomendar


10 diapositivas
Remote Work Best Practices Presentation
Streamline your team's productivity with this Remote Work Best Practices presentation. Ideal for hybrid or fully remote businesses, this layout features five key steps illustrated in a connected visual path, helping communicate structure and flow. With a clean, modern design and editable sections, it's perfect for onboarding, policy training, or workflow optimization. Compatible with PowerPoint, Keynote, and Google Slides for easy customization.


10 diapositivas
Modern Healthcare Technology Trends Presentation
Highlight innovations in healthcare with the Modern Healthcare Technology Trends Presentation. This slide features a central device graphic connected to four key icons, perfect for showcasing digital tools, emerging trends, or medical tech strategies. Fully customizable in Canva, PowerPoint, Keynote, and Google Slides—ideal for medical tech briefings and strategic presentations.


2 diapositivas
Presentation Title Design Options Presentation
Make a bold first impression with the Presentation Title Design Options template. This visually striking layout features a futuristic 3D cube graphic framed in a circular cutout, paired with two clean content blocks for highlighting your key messages. Ideal for opening slides or concept overviews, this design is fully editable in PowerPoint, Keynote, and Google Slides.


26 diapositivas
The Impact of 5G Technology Presentation
Step into the future with this insightful presentation on the impact of 5G technology. Covering key areas like faster connectivity, IoT advancements, industry applications, and potential challenges, this template helps you break down complex concepts with clarity. Fully customizable and compatible with PowerPoint, Keynote, and Google Slides for a seamless presentation experience.


5 diapositivas
South America Location Map Slide Presentation
Highlight your business reach or project data across South America with a clean, professional map layout. This design is perfect for showcasing key locations, regional metrics, or market insights in a visually engaging way. Fully compatible with PowerPoint, Keynote, and Google Slides for effortless customization and presentation.


8 diapositivas
Educational Lesson Plan Presentation
The "Educational Lesson Plan Presentation" template offers a vibrant and engaging method to display educational strategies and frameworks. This template uses a stacked blocks design that visually represents the hierarchical structure of lesson components. Each block is color-coded, facilitating easy distinction between different sections such as Title 01, Title 02, Title 03, and Title 04, which can be customized with specific educational goals or key points. This format is ideal for educators planning their lessons or for presentations at educational seminars, workshops, or teacher training sessions, where clarity and visual structure enhance communication and understanding.


5 diapositivas
Annual Overview Report Template Presentation
Bring your yearly achievements to life with this sleek and structured layout designed for clarity and impact. Ideal for summarizing company performance, milestones, and future goals, it organizes data into easy-to-follow visuals. Fully editable and compatible with PowerPoint, Keynote, and Google Slides for a smooth presentation experience.


20 diapositivas
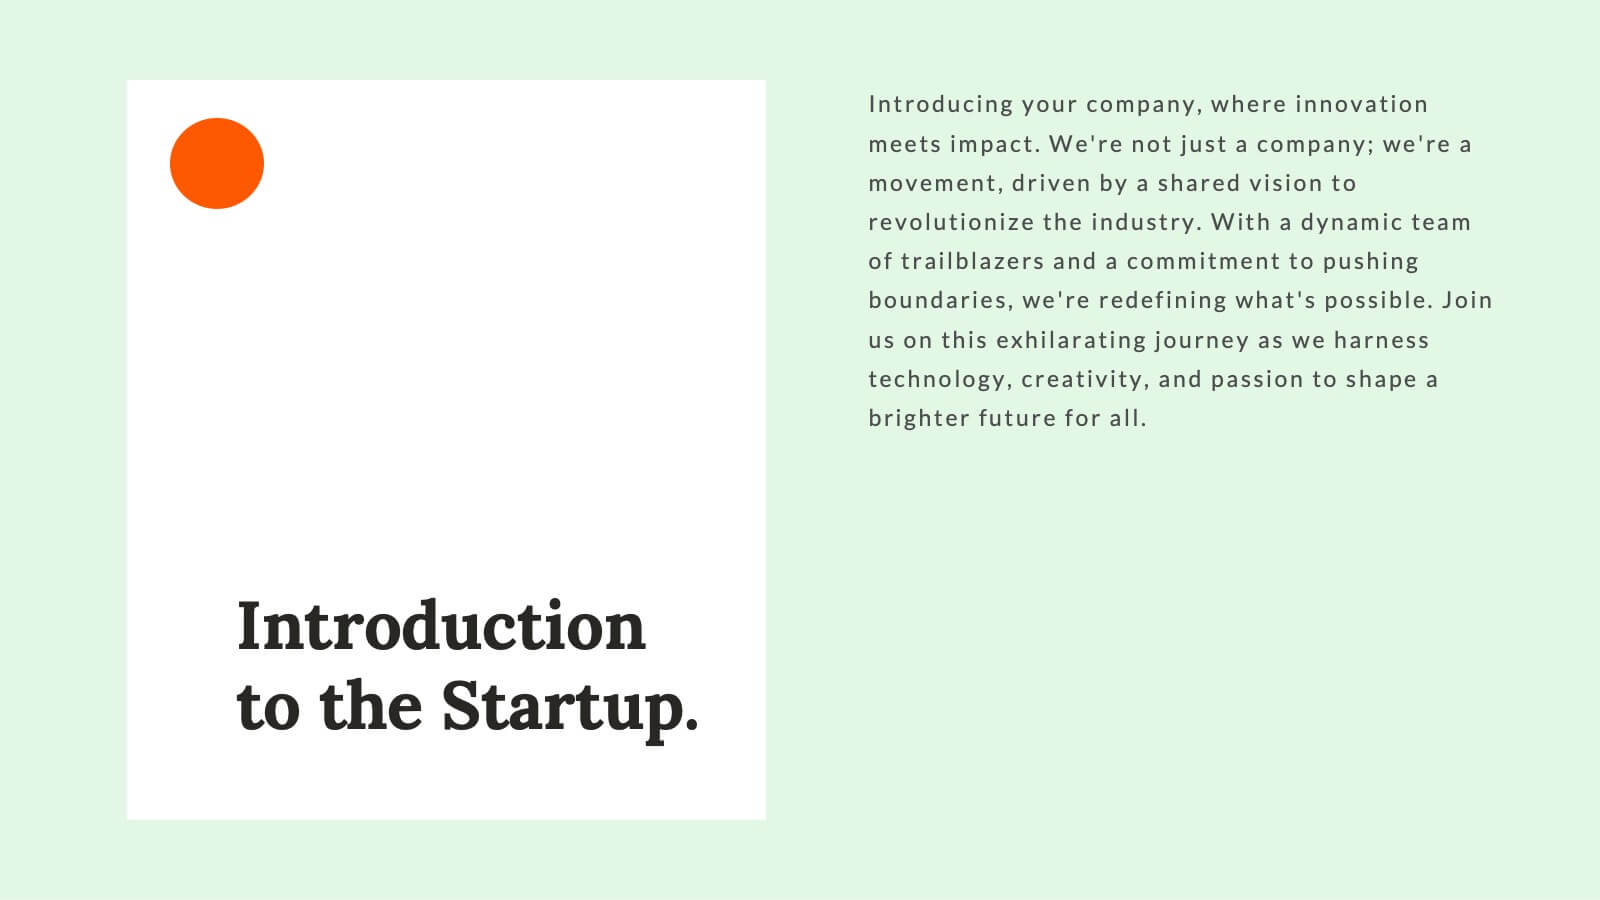
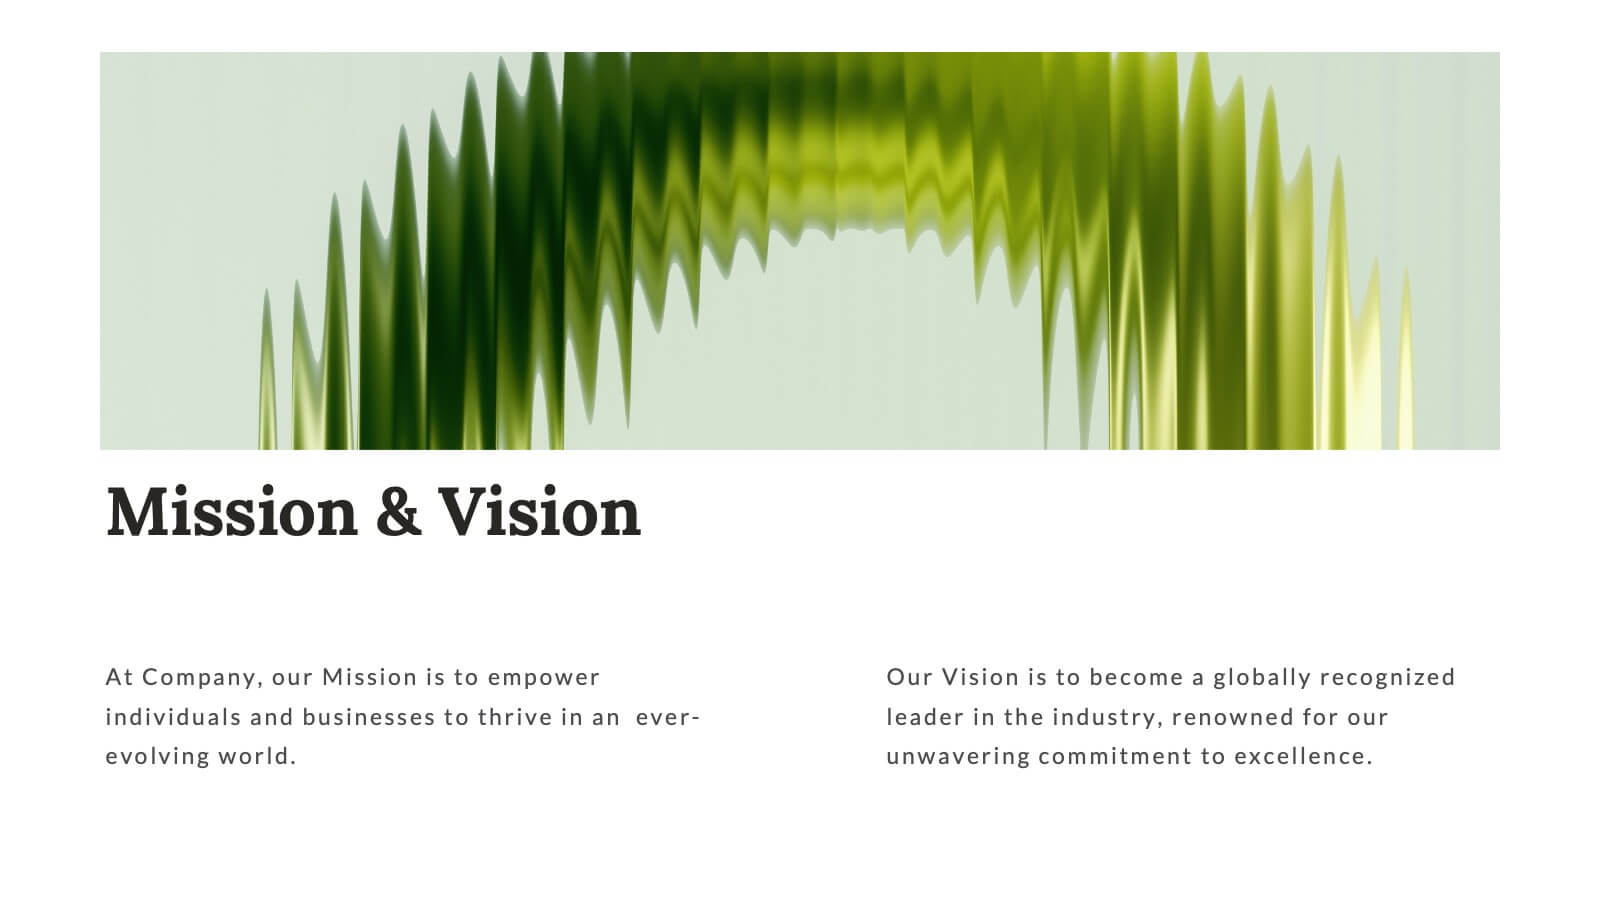
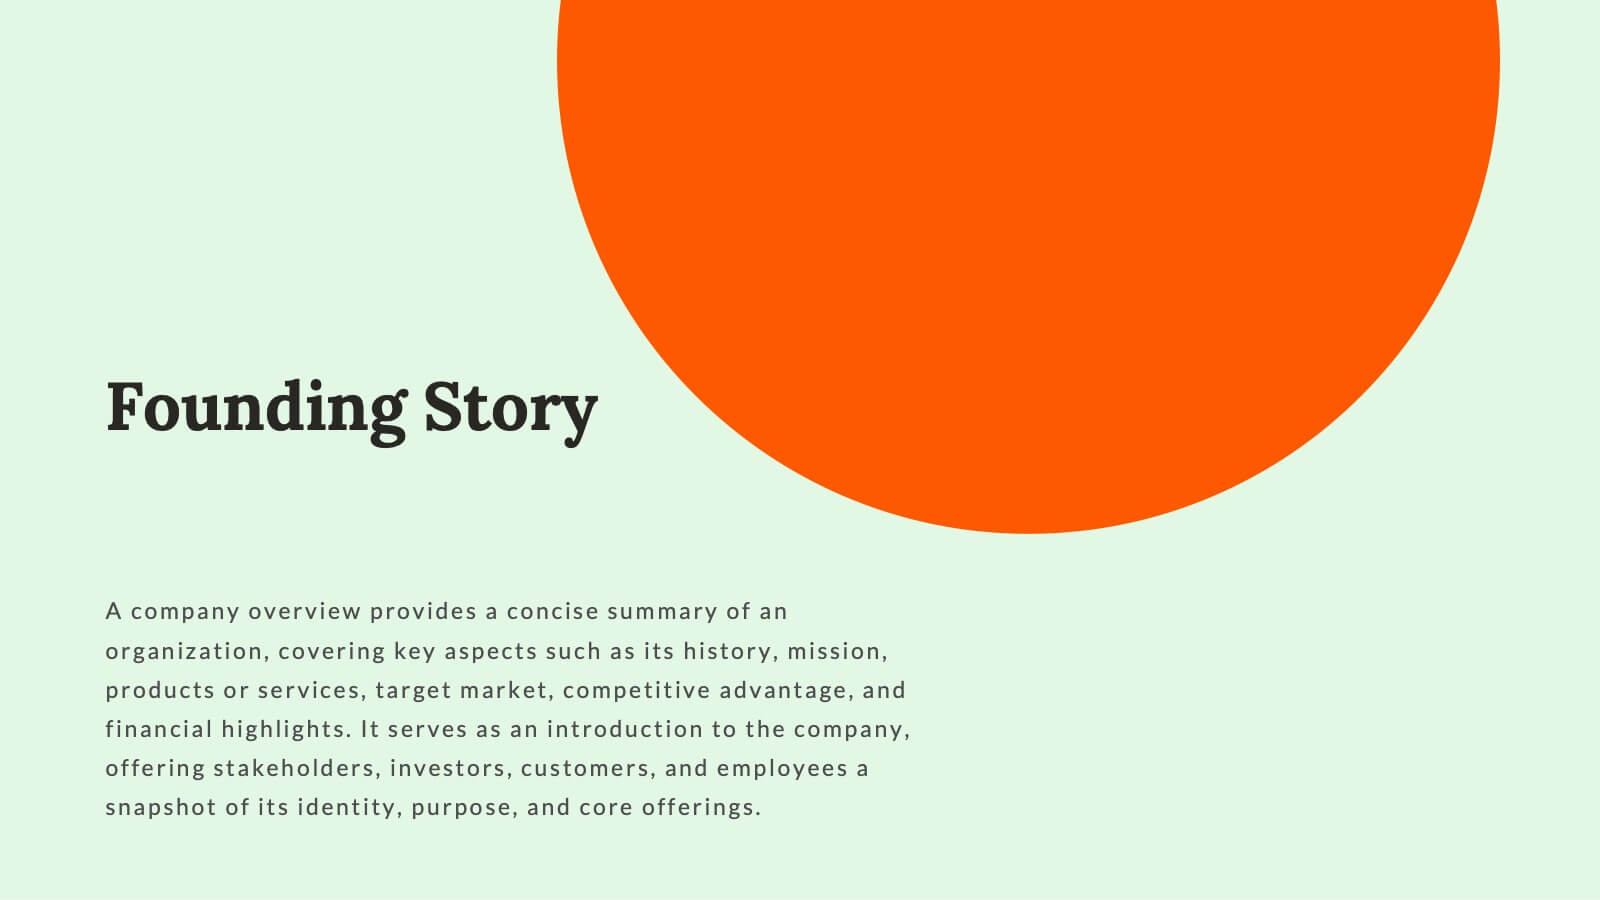
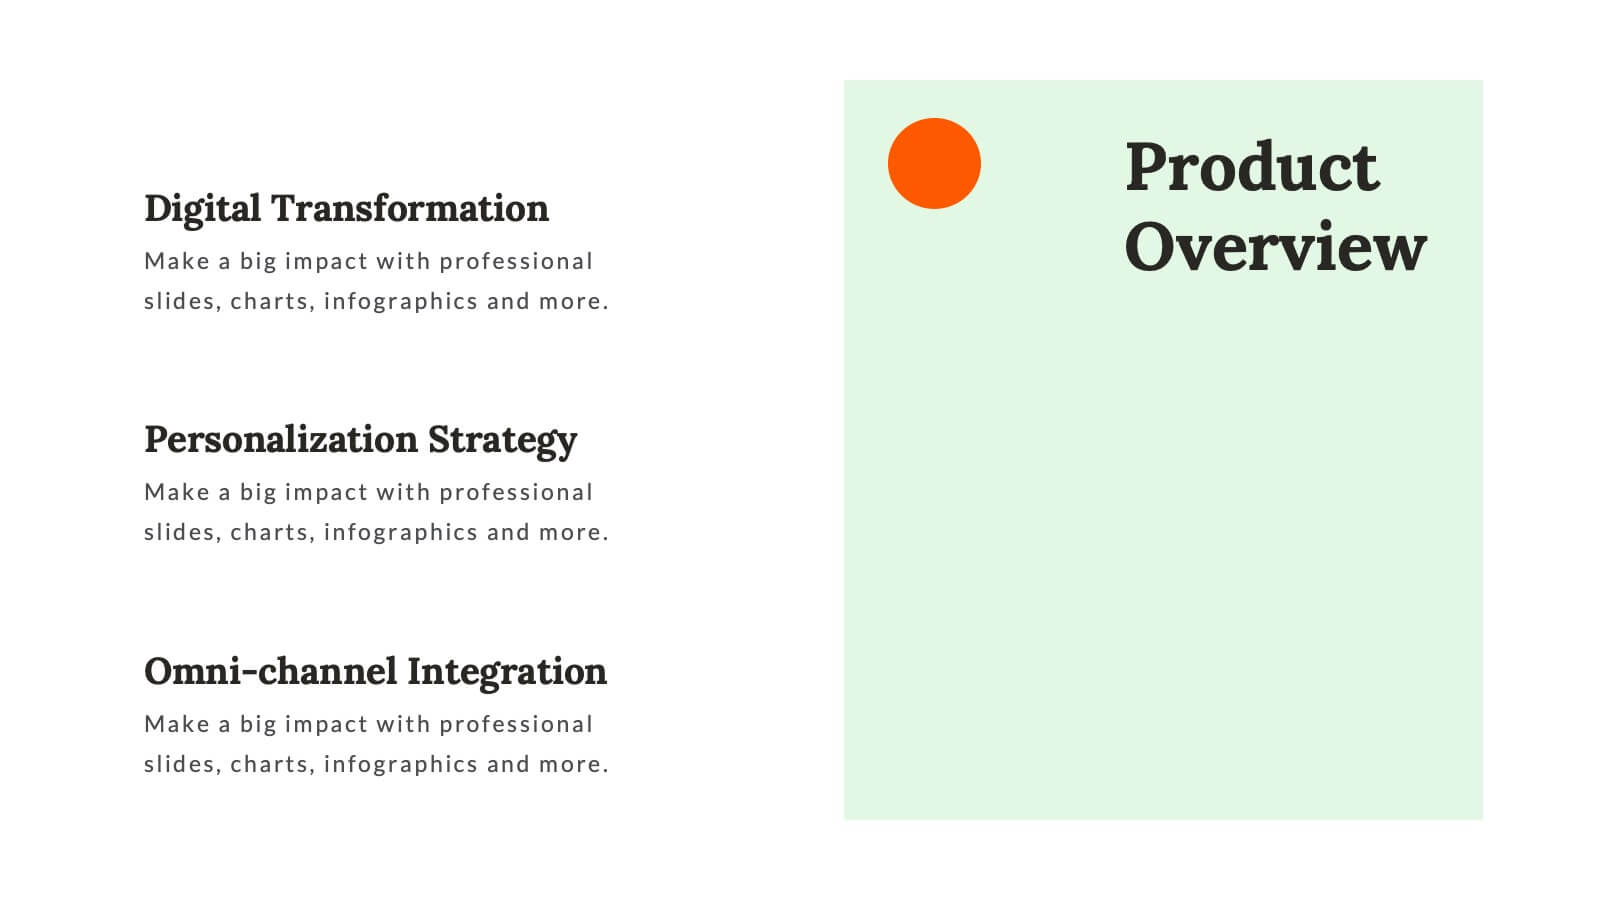
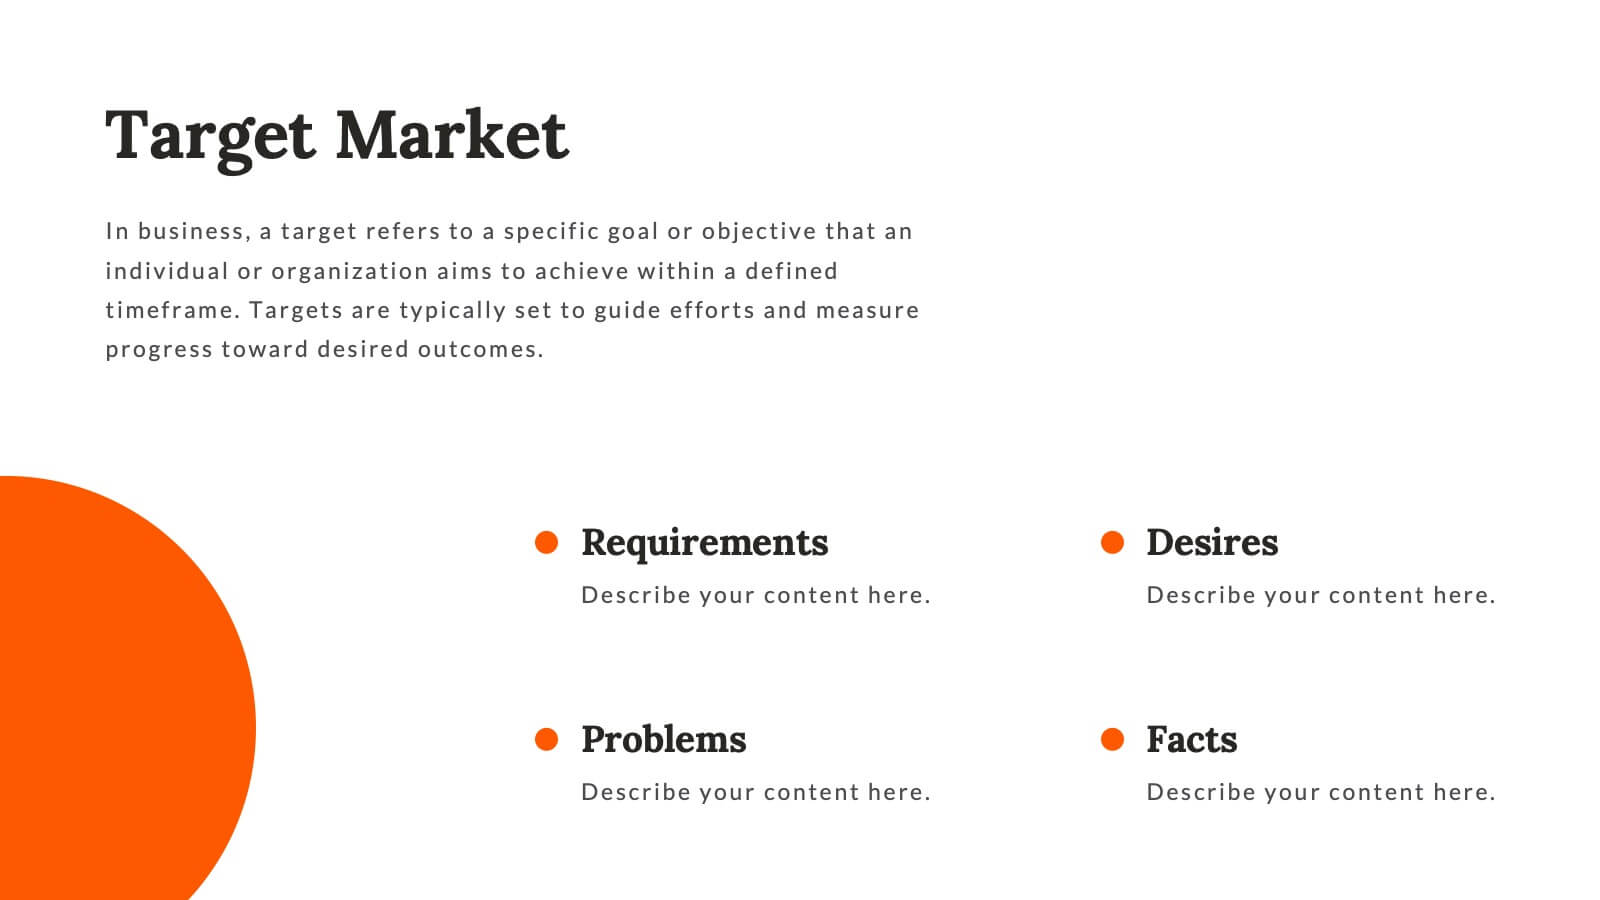
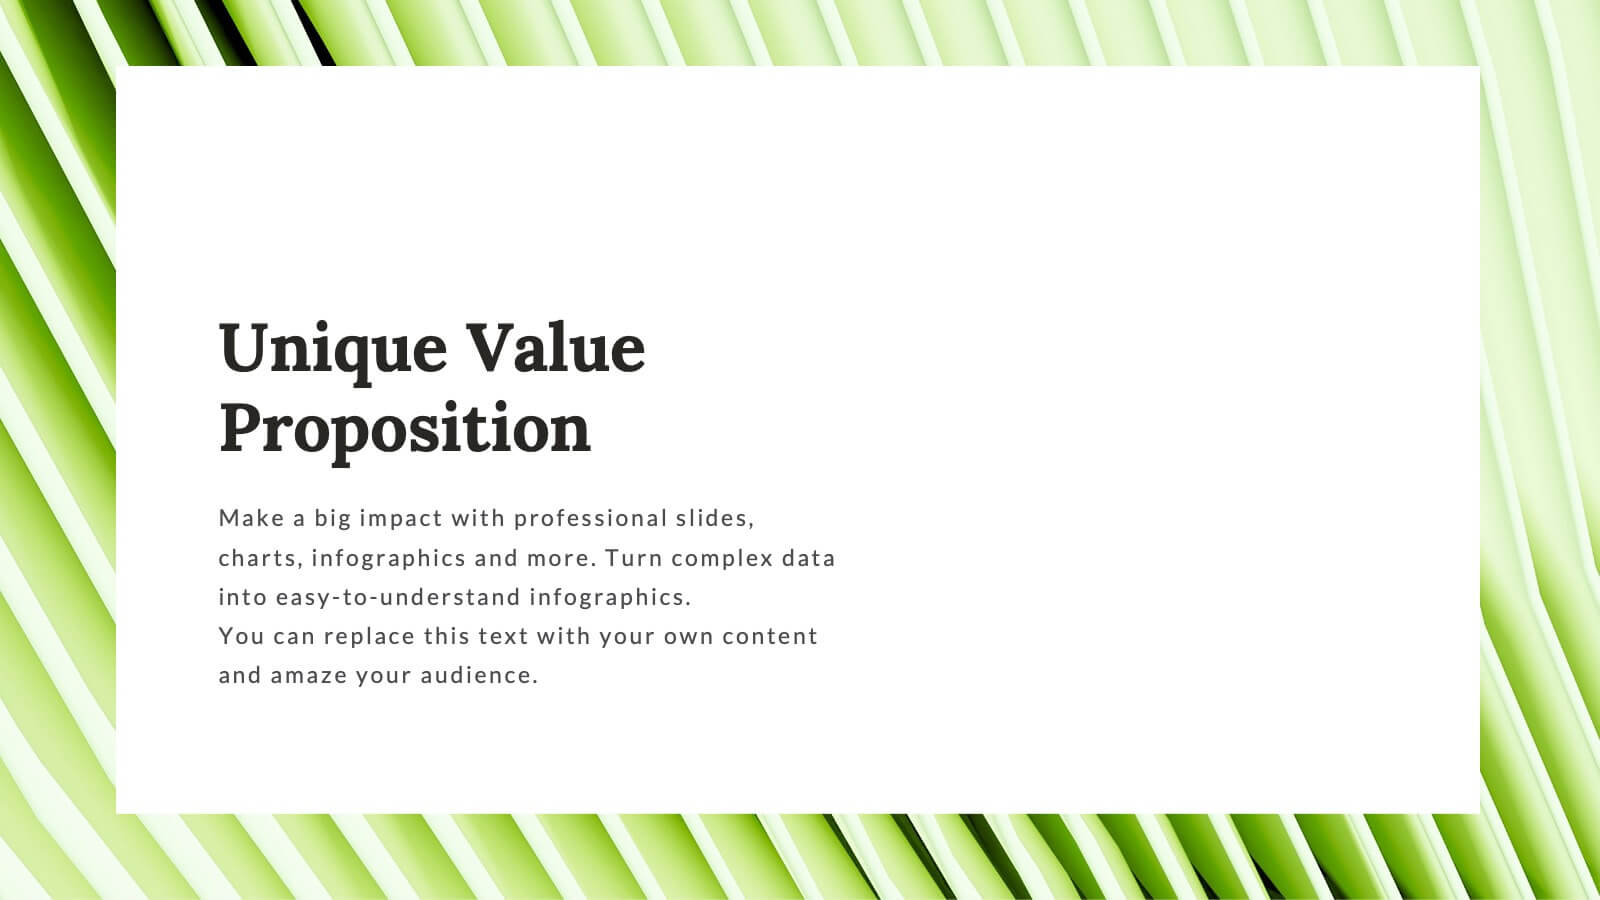
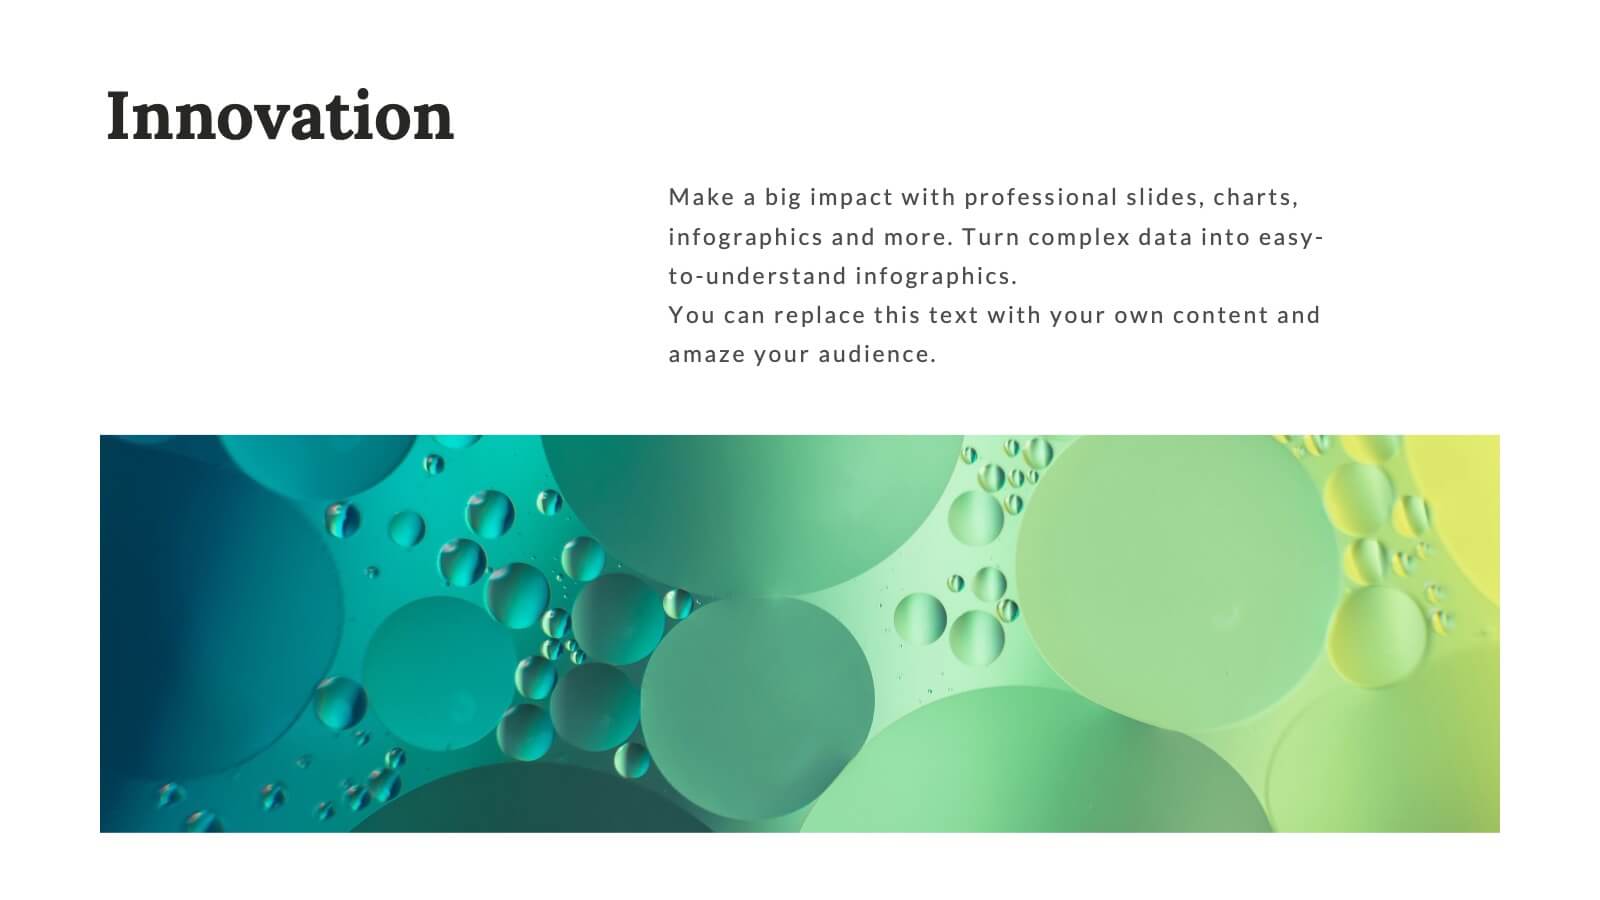
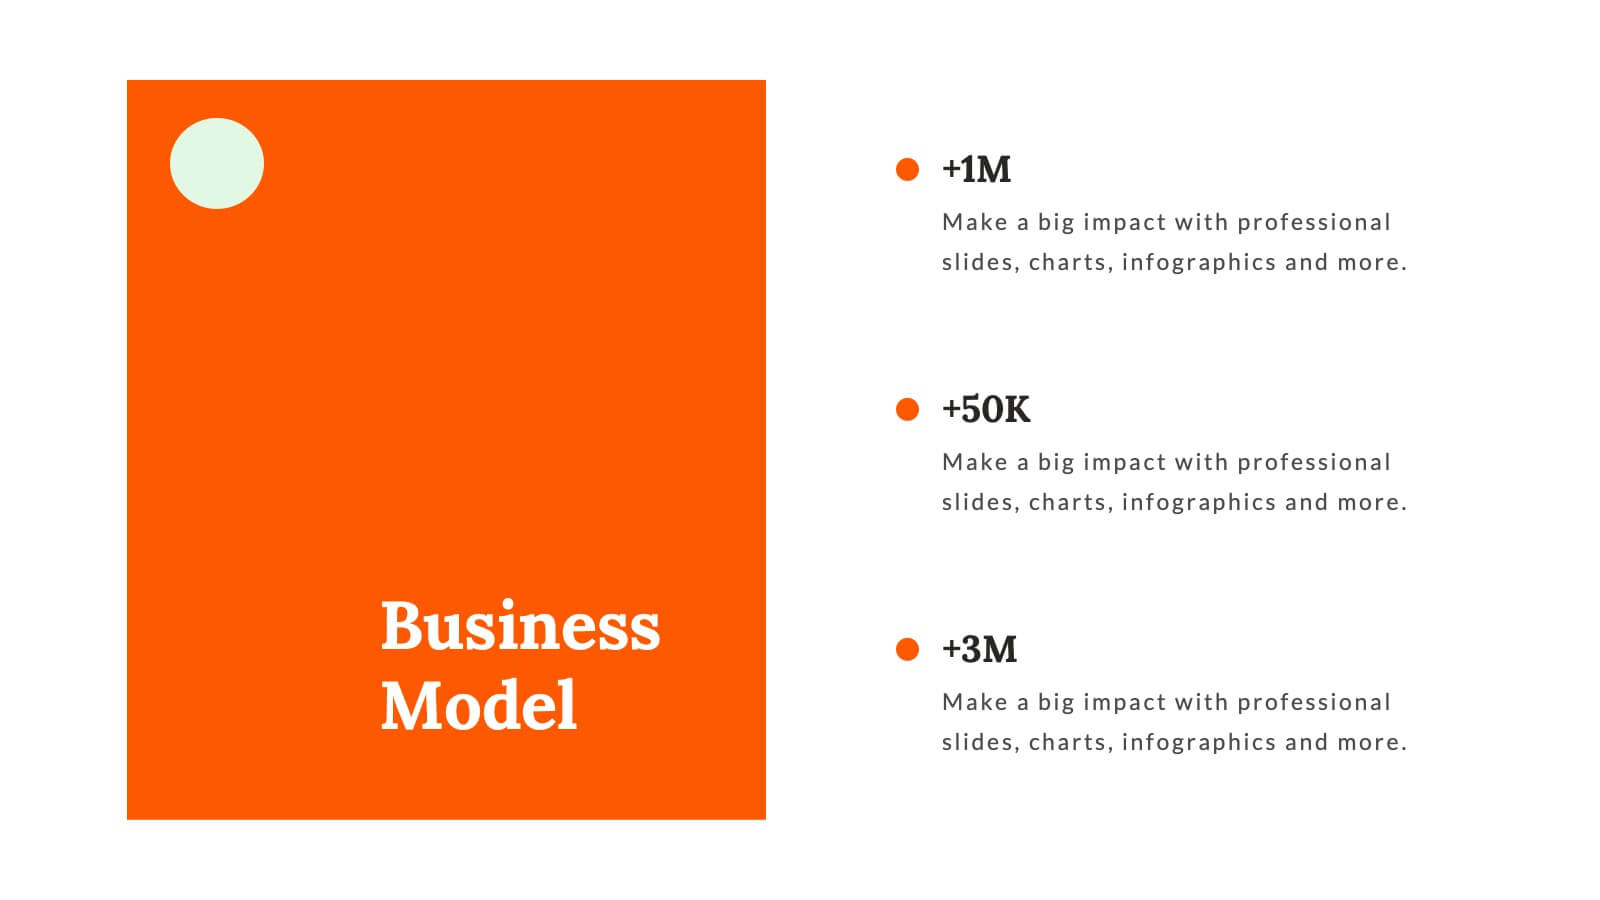
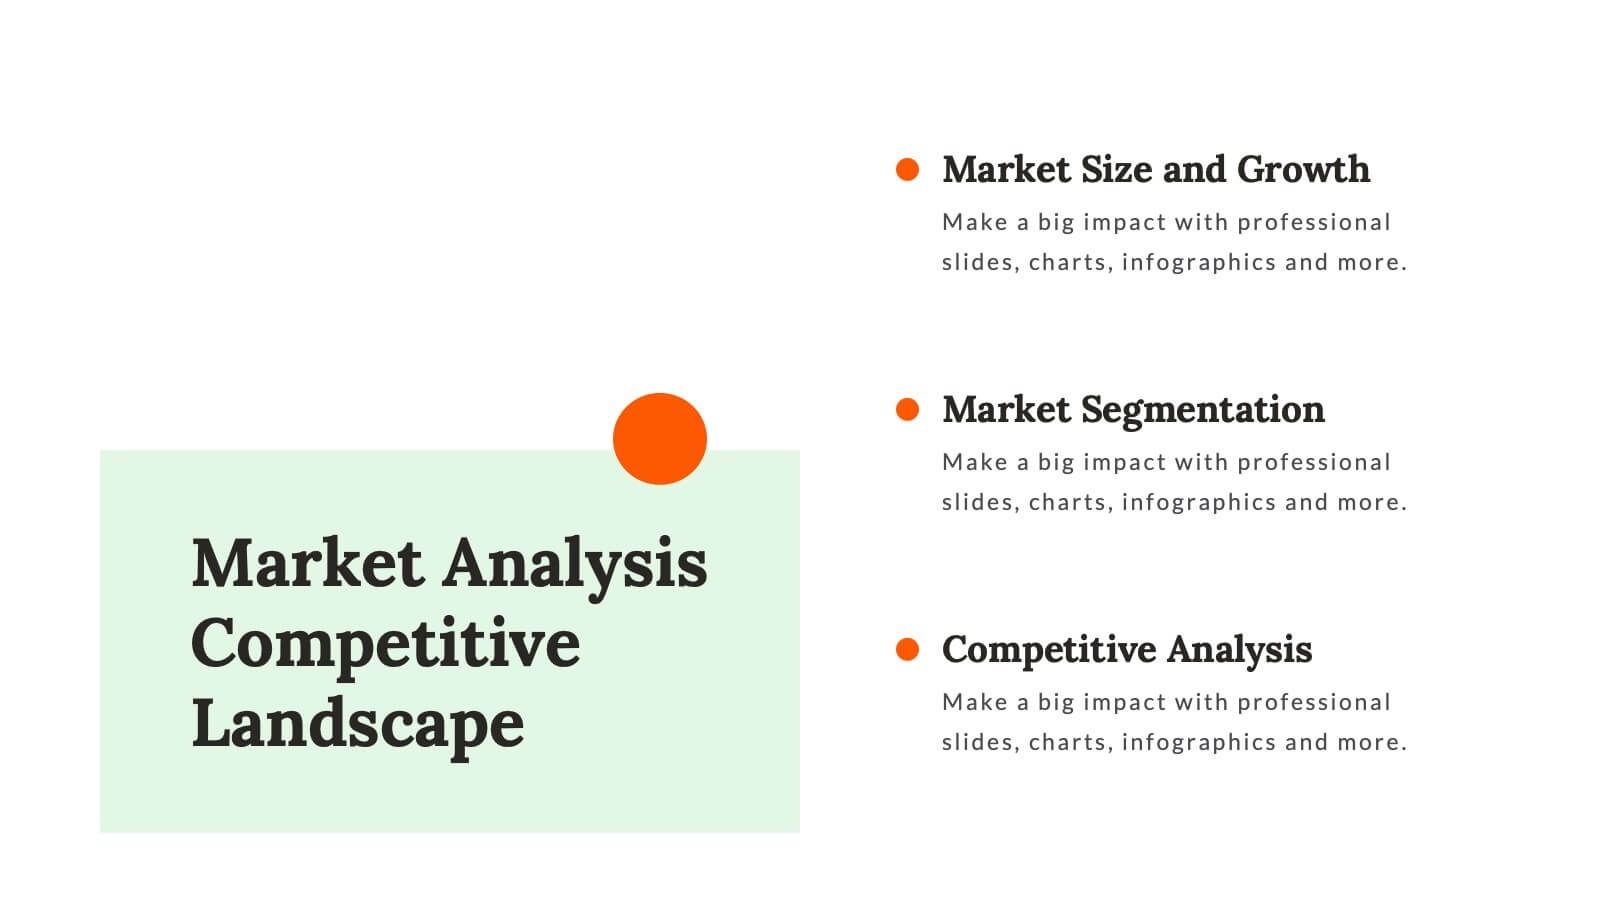
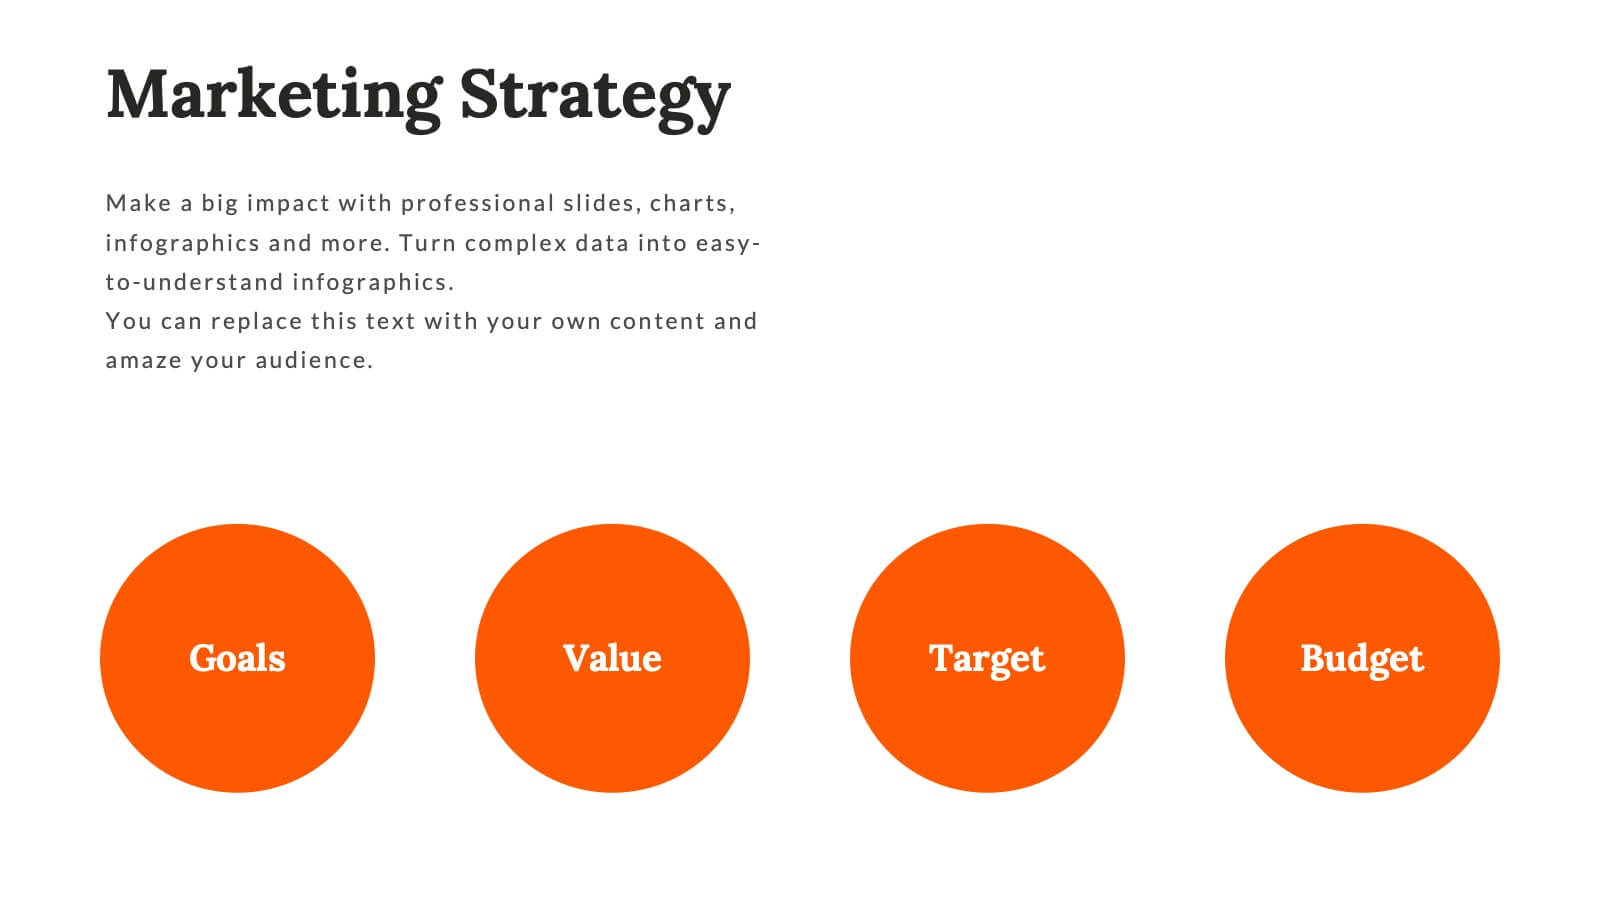
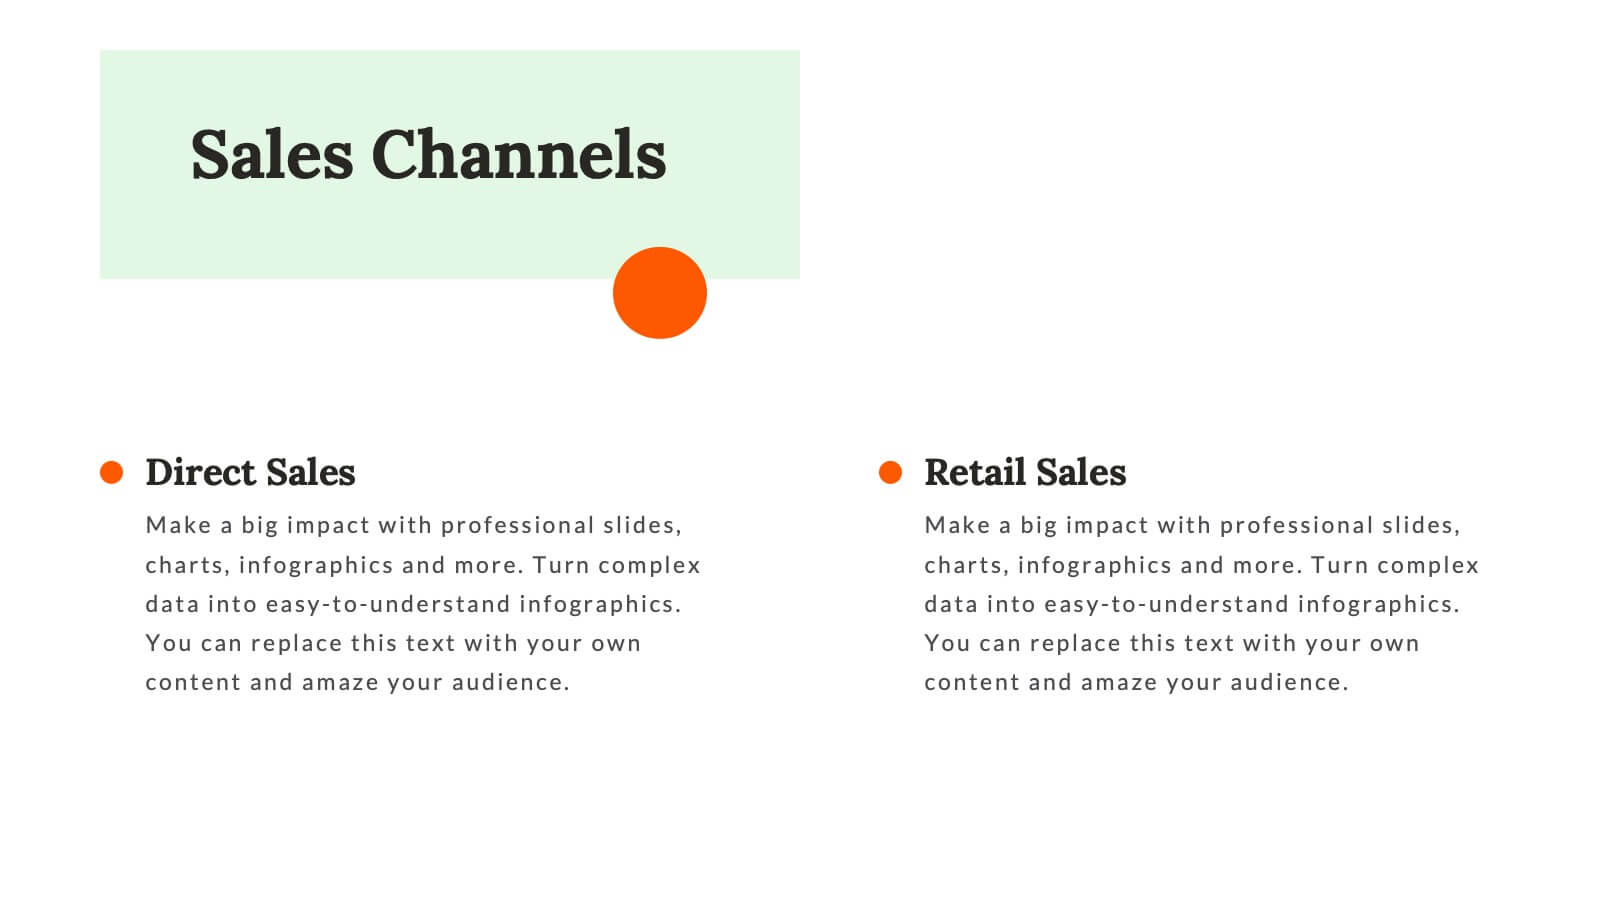
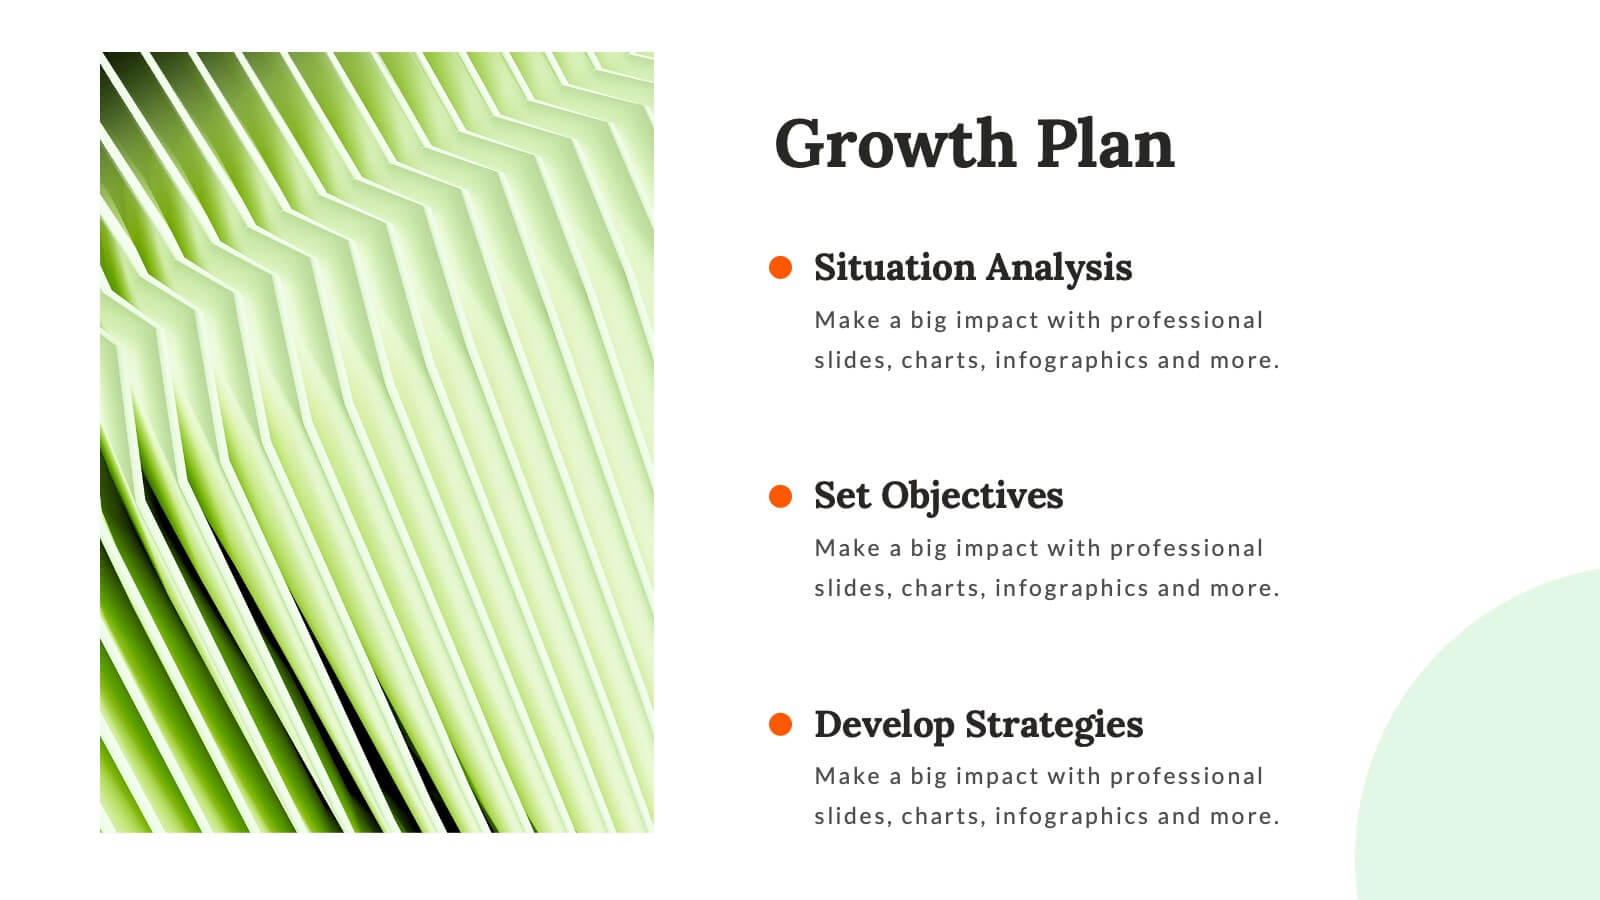
Whirlwind Startup Funding Proposal Presentation
Transform your startup funding proposals with this vibrant and professional template. Designed to impress potential investors, it features sections for mission & vision, founding story, market analysis, and financial overview. Highlight your unique value proposition and business model with clarity and style. This template is compatible with PowerPoint, Keynote, and Google Slides, ensuring seamless presentations on any platform. Perfect for conveying your innovative ideas and growth plans effectively.


7 diapositivas
Asia Map Infographic Presentation Template
Asia is the largest, most populous, and most culturally diverse continent. Asia constitutes of nearly one-third of Earth's landmass and is lying entirely north of the equator. The continent is home to a variety of cultures, ethnic groups, and religions. This Asian map template includes the different labeled countries, and graphs with statistics. This can be used to show your audience the geographical layout of Asia, or as an example of what a modern, professional presentation should look like. This template is a great resource for students, teachers and people who want to learn more about Asia.


4 diapositivas
Daily Plan and Talking Points Agenda Presentation
Stay aligned and focused with this Daily Plan and Talking Points Agenda presentation. Perfect for team standups or morning meetings, this layout organizes discussion into three clear sections: Yesterday, Today, and Blockers. Fully editable in Canva, PowerPoint, and Google Slides—customize effortlessly to keep your team in sync


23 diapositivas
Phantasia Sales Pitch Deck Presentation
Impress stakeholders and close deals effectively with this sleek and dynamic pitch deck template. With structured slides for company overview, problem statements, and market opportunities, you can present your solutions with clarity and impact. Showcase your business model, revenue streams, and unique selling propositions to stand out in a competitive landscape. This template also includes slides for financial projections, growth strategies, and funding requirements, making it an excellent choice for entrepreneurs, sales teams, and business leaders. The modern design ensures your data is engaging and easy to follow, keeping your audience focused on your message. Fully editable and compatible with PowerPoint, Google Slides, and Keynote, this template provides the customization options you need to align with your branding and goals. Perfect for delivering professional and persuasive presentations.


5 diapositivas
Social Media Strategies Presentation
Bring your online vision to life with a clean, modern layout that makes planning campaigns feel effortless. This presentation helps you map out goals, content pillars, audience insights, and platform tactics with clarity and impact. Fully editable and compatible with PowerPoint, Keynote, and Google Slides.


6 diapositivas
Business Strategy Wheel Model Presentation
Present your key strategic components in a clear, circular layout with this wheel model template. Ideal for outlining interconnected steps, departments, or initiatives, this design allows you to visualize all six elements of your strategy at once. Fully customizable in PowerPoint, Keynote, and Google Slides.


23 diapositivas
Fantara Product Launch Pitch Deck Presentation
Launch your product with confidence using this bold and engaging pitch deck presentation template. Featuring key slides such as problem statement, market opportunity, revenue model, and growth projections, it helps you effectively present your business idea. Ideal for startups and entrepreneurs. Compatible with PowerPoint, Keynote, and Google Slides for easy customization.


7 diapositivas
Breast Cancer Signs Infographic
Step into the crucial arena of breast cancer awareness, where every statistic informs, every story inspires, and every shade carries significance. Swathed in the emblematic hue of pink, accented by the purity of white and the depth of blue, our infographic template conveys the urgency and importance of this cause. Featuring detailed infographics, intuitive icons, and poignant image placeholders, it serves as a comprehensive guide on the subject. Expertly designed for Powerpoint, Keynote, or Google Slides. An indispensable resource for medical professionals, awareness campaigners, or anyone invested in the fight against breast cancer. Engage, educate, empower.


5 diapositivas
User Insights Based on Demographics Presentation
Showcase key demographic segments with this visually engaging user insights slide. Featuring icon-based representations with circular percentage indicators, it’s ideal for displaying gender, age, behavior, or regional breakdowns. Perfect for marketing reports, audience research, or strategic planning presentations, it clearly highlights trends and helps guide data-driven decisions.


7 diapositivas
Empathy Map Infographic Presentation Template
An Empathy Map is a collaborative tool organizations can use to gain a deeper insight into their customers. Similar to a user persona, an empathy map can represent a group of users, such as a customer segment. An empathy map helps to map what a design team knows about the potential audience. Use this template to gain a deeper understanding of your target audience. This template comes with many empathy maps you can use to discover how to empathize with your customers. The empathy maps available in this template are designed to give you an avenue into the mind of your target audience.