


Características


¿Tienes alguna pregunta?
Recomendar


21 diapositivas
Luminary Annual Report Presentation
Create stunning annual reports with this sleek template! Highlight key achievements, financial summaries, and performance metrics. Perfect for showcasing operational updates, strategic initiatives, and market trends. Designed for business professionals and analysts. Compatible with PowerPoint, Keynote, and Google Slides.


23 diapositivas
Drift UX Case Study Presentation
Ready to wow your audience with a stunning showcase of your UX and UI design brilliance? This UX Case Study template is your secret weapon to turn heads and leave a lasting impression! Bursting with sleek, modern designs, it’s tailored to guide your audience through every thrilling step of your design process—from initial research and user personas to wireframes, prototypes, and polished final products. Highlight your innovative thinking, showcase your creative problem-solving, and bring your design stories to life in a way that's not just informative, but truly inspiring. Whether you’re pitching to a client, presenting to stakeholders, or sharing your vision with the world, this template ensures your ideas shine bright. Fully compatible with PowerPoint, Keynote, and Google Slides, it's the perfect tool to captivate, engage, and inspire your audience at every slide!


7 diapositivas
Office Scenes Infographic Presentation Template
An Office Scene Infographic is a visualization of the most common types of office spaces, along with their pros and cons. This infographic template is great for a school presentation, office projects, employee onboarding programs, or planning a workplace makeover. Within this infographic, you will be able to display absolutely everything that needs to be shown within a corporate setting. This office scene template is a fully layered and customizable infographic that allows you to create your own design. Use it as an infographic, as a presentation, or even a website/app background.


7 diapositivas
SEO Strategy and Keyword Plan Presentation
Spark your marketing roadmap with a bold, idea-driven layout that makes every action step clear and memorable. This presentation helps you outline search goals, explore keyword opportunities, and map out strategic priorities in a simple, visual flow. Fully compatible with PowerPoint, Keynote, and Google Slides.


5 diapositivas
Scaling Operations and Team Expansion Presentation
Illustrate your company’s growth journey with the Scaling Operations and Team Expansion Presentation. This dynamic layout uses a circular sequence to showcase five key phases of business scaling, from small teams to full-scale departments. Perfect for strategy sessions, investor updates, and team meetings. Fully editable in Canva, PowerPoint, Keynote, and Google Slides.


5 diapositivas
Operational Workflow Process Chart Presentation
Streamline your operations with the Operational Workflow Process Chart Presentation. This template provides a clear visual layout to map out step-by-step processes, helping teams align on roles, timelines, and dependencies. Perfect for training, reporting, or system audits—fully customizable in PowerPoint, Canva, and Google Slides.


7 diapositivas
Innovation Technology Infographics
Innovation technology refers to the application of technology or the use of innovative approaches to create new products, services, processes, or business models. This infographic template is designed to showcase the cutting-edge technologies shaping our future. Let the vibrant visuals and insightful content guide you through the exciting realm of innovation and technology. Compatible with Powerpoint, Keynote, and Google Slides. Fully customizable, explore this infographic and step into the future. The visuals are designed to ignite your imagination and enlighten your audience about the limitless potential of innovation and technology.
22 diapositivas
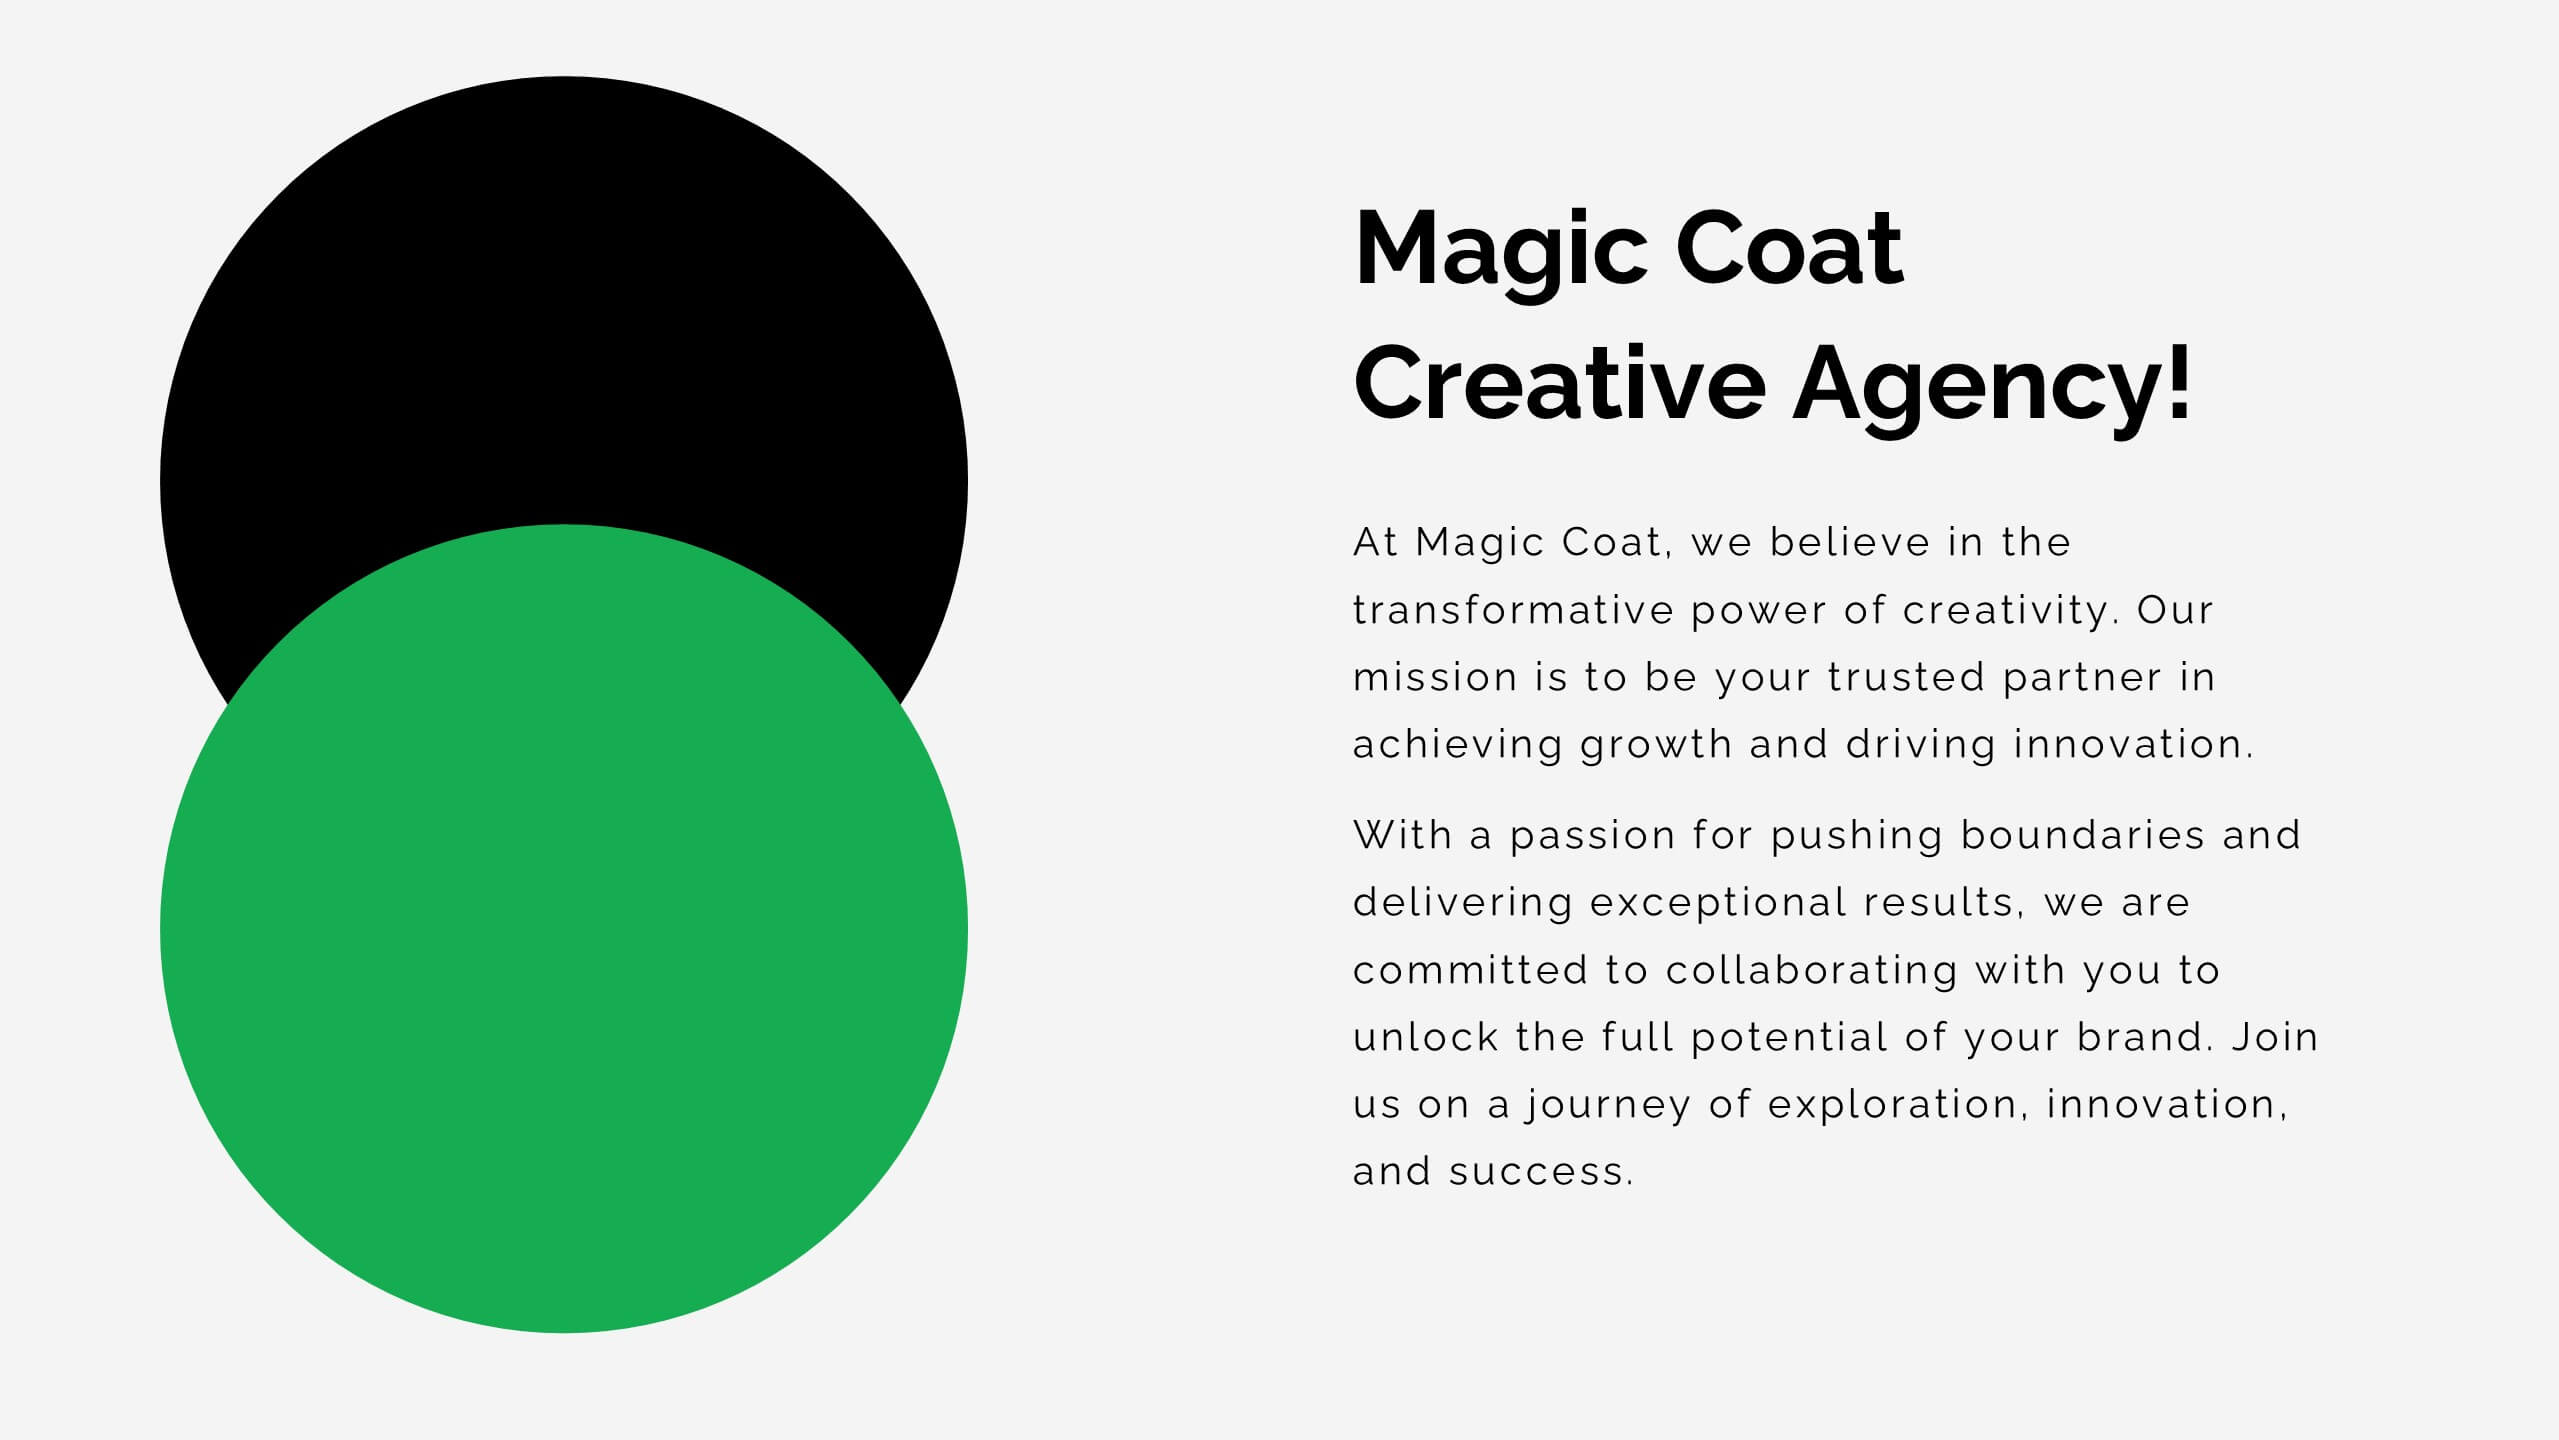
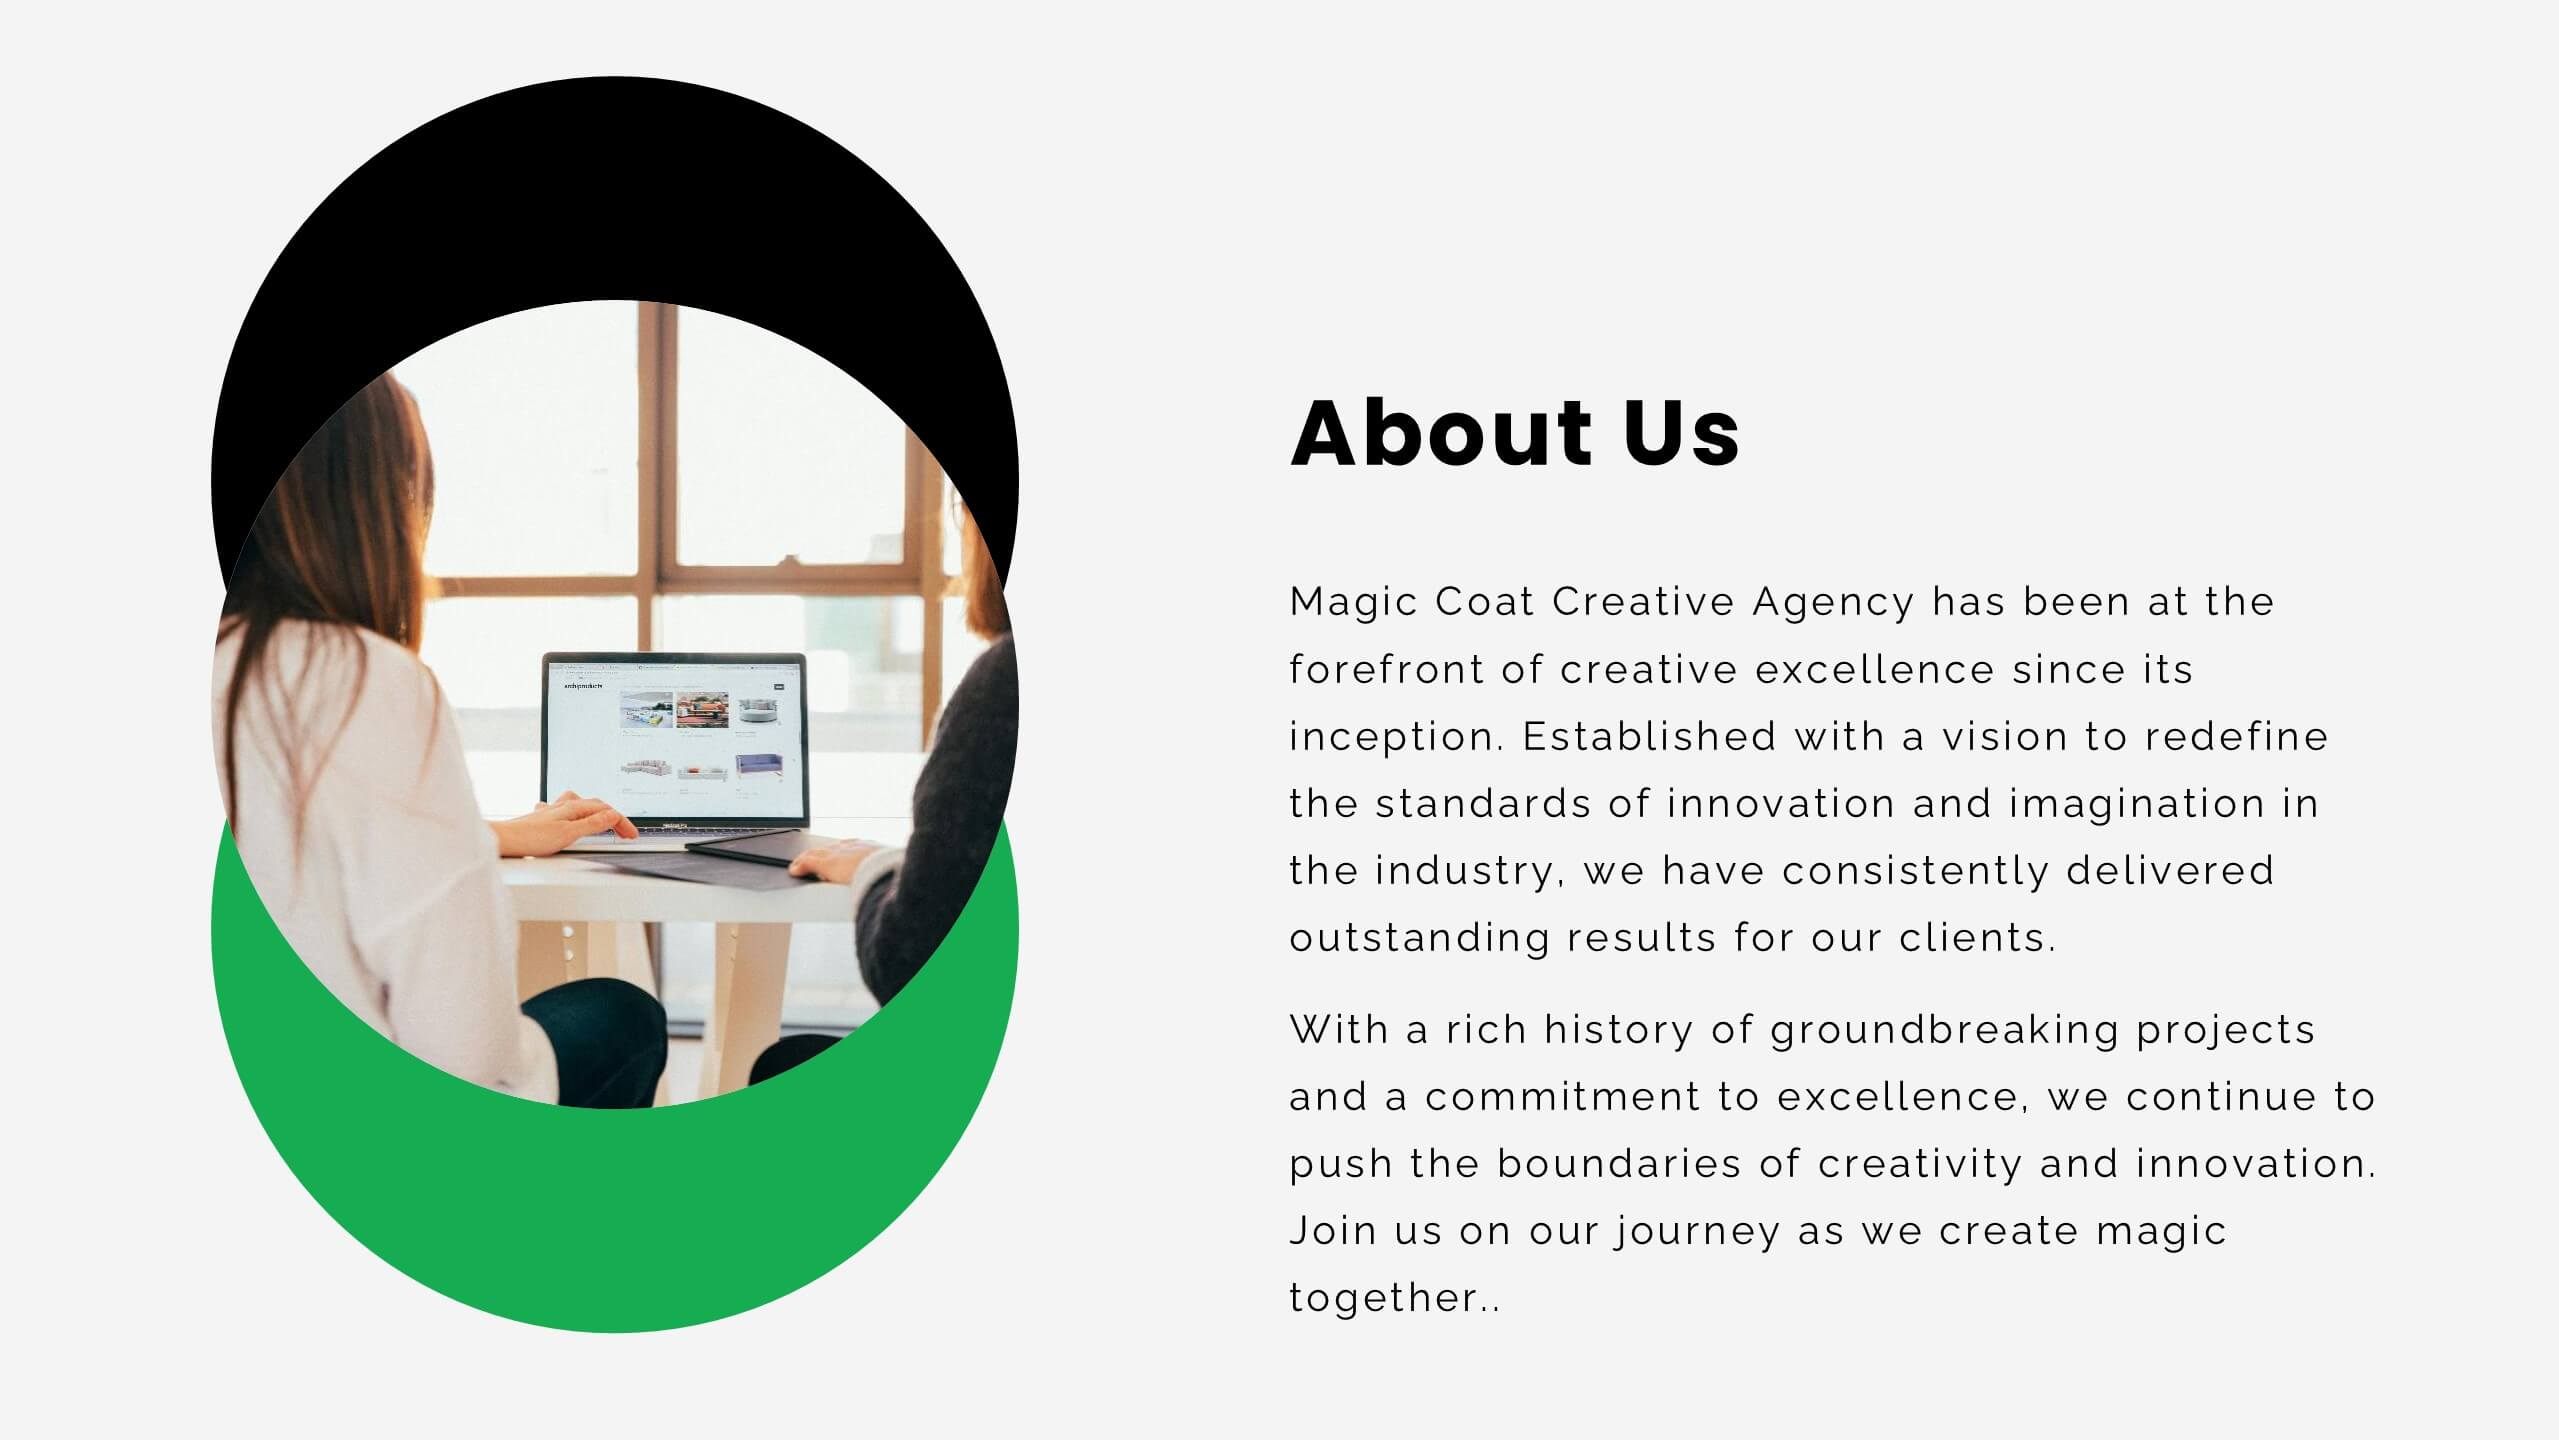
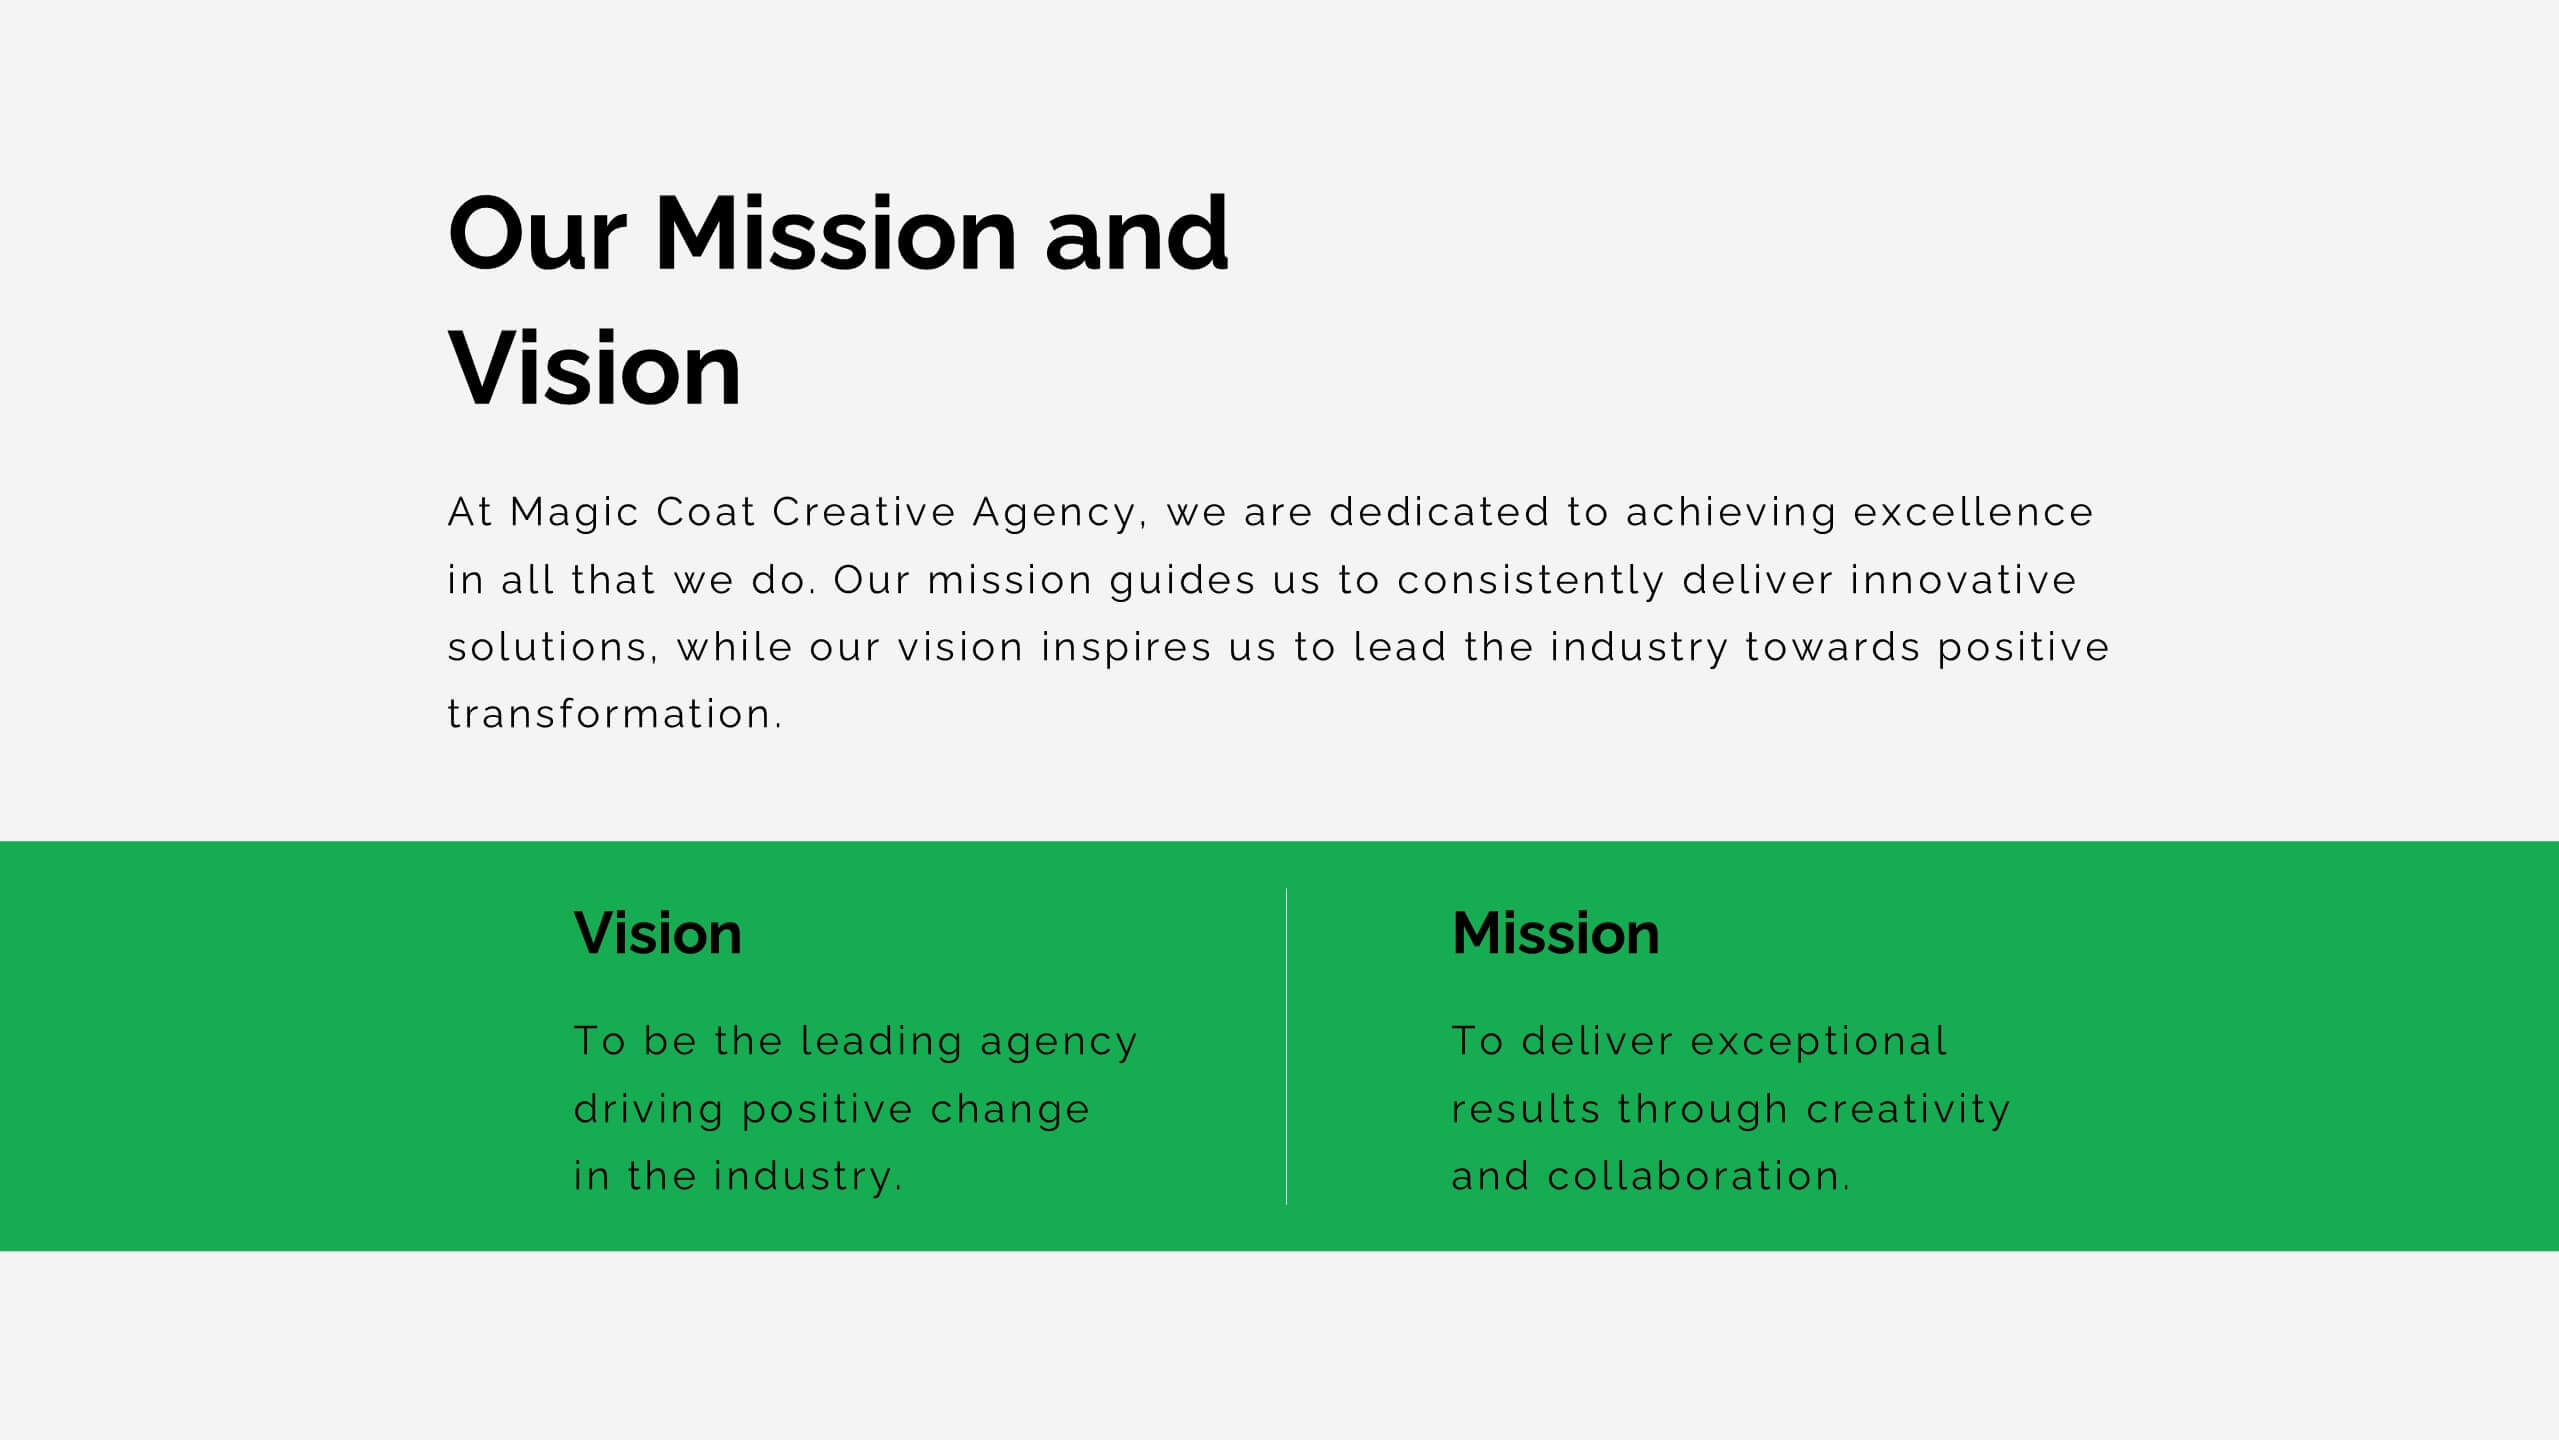
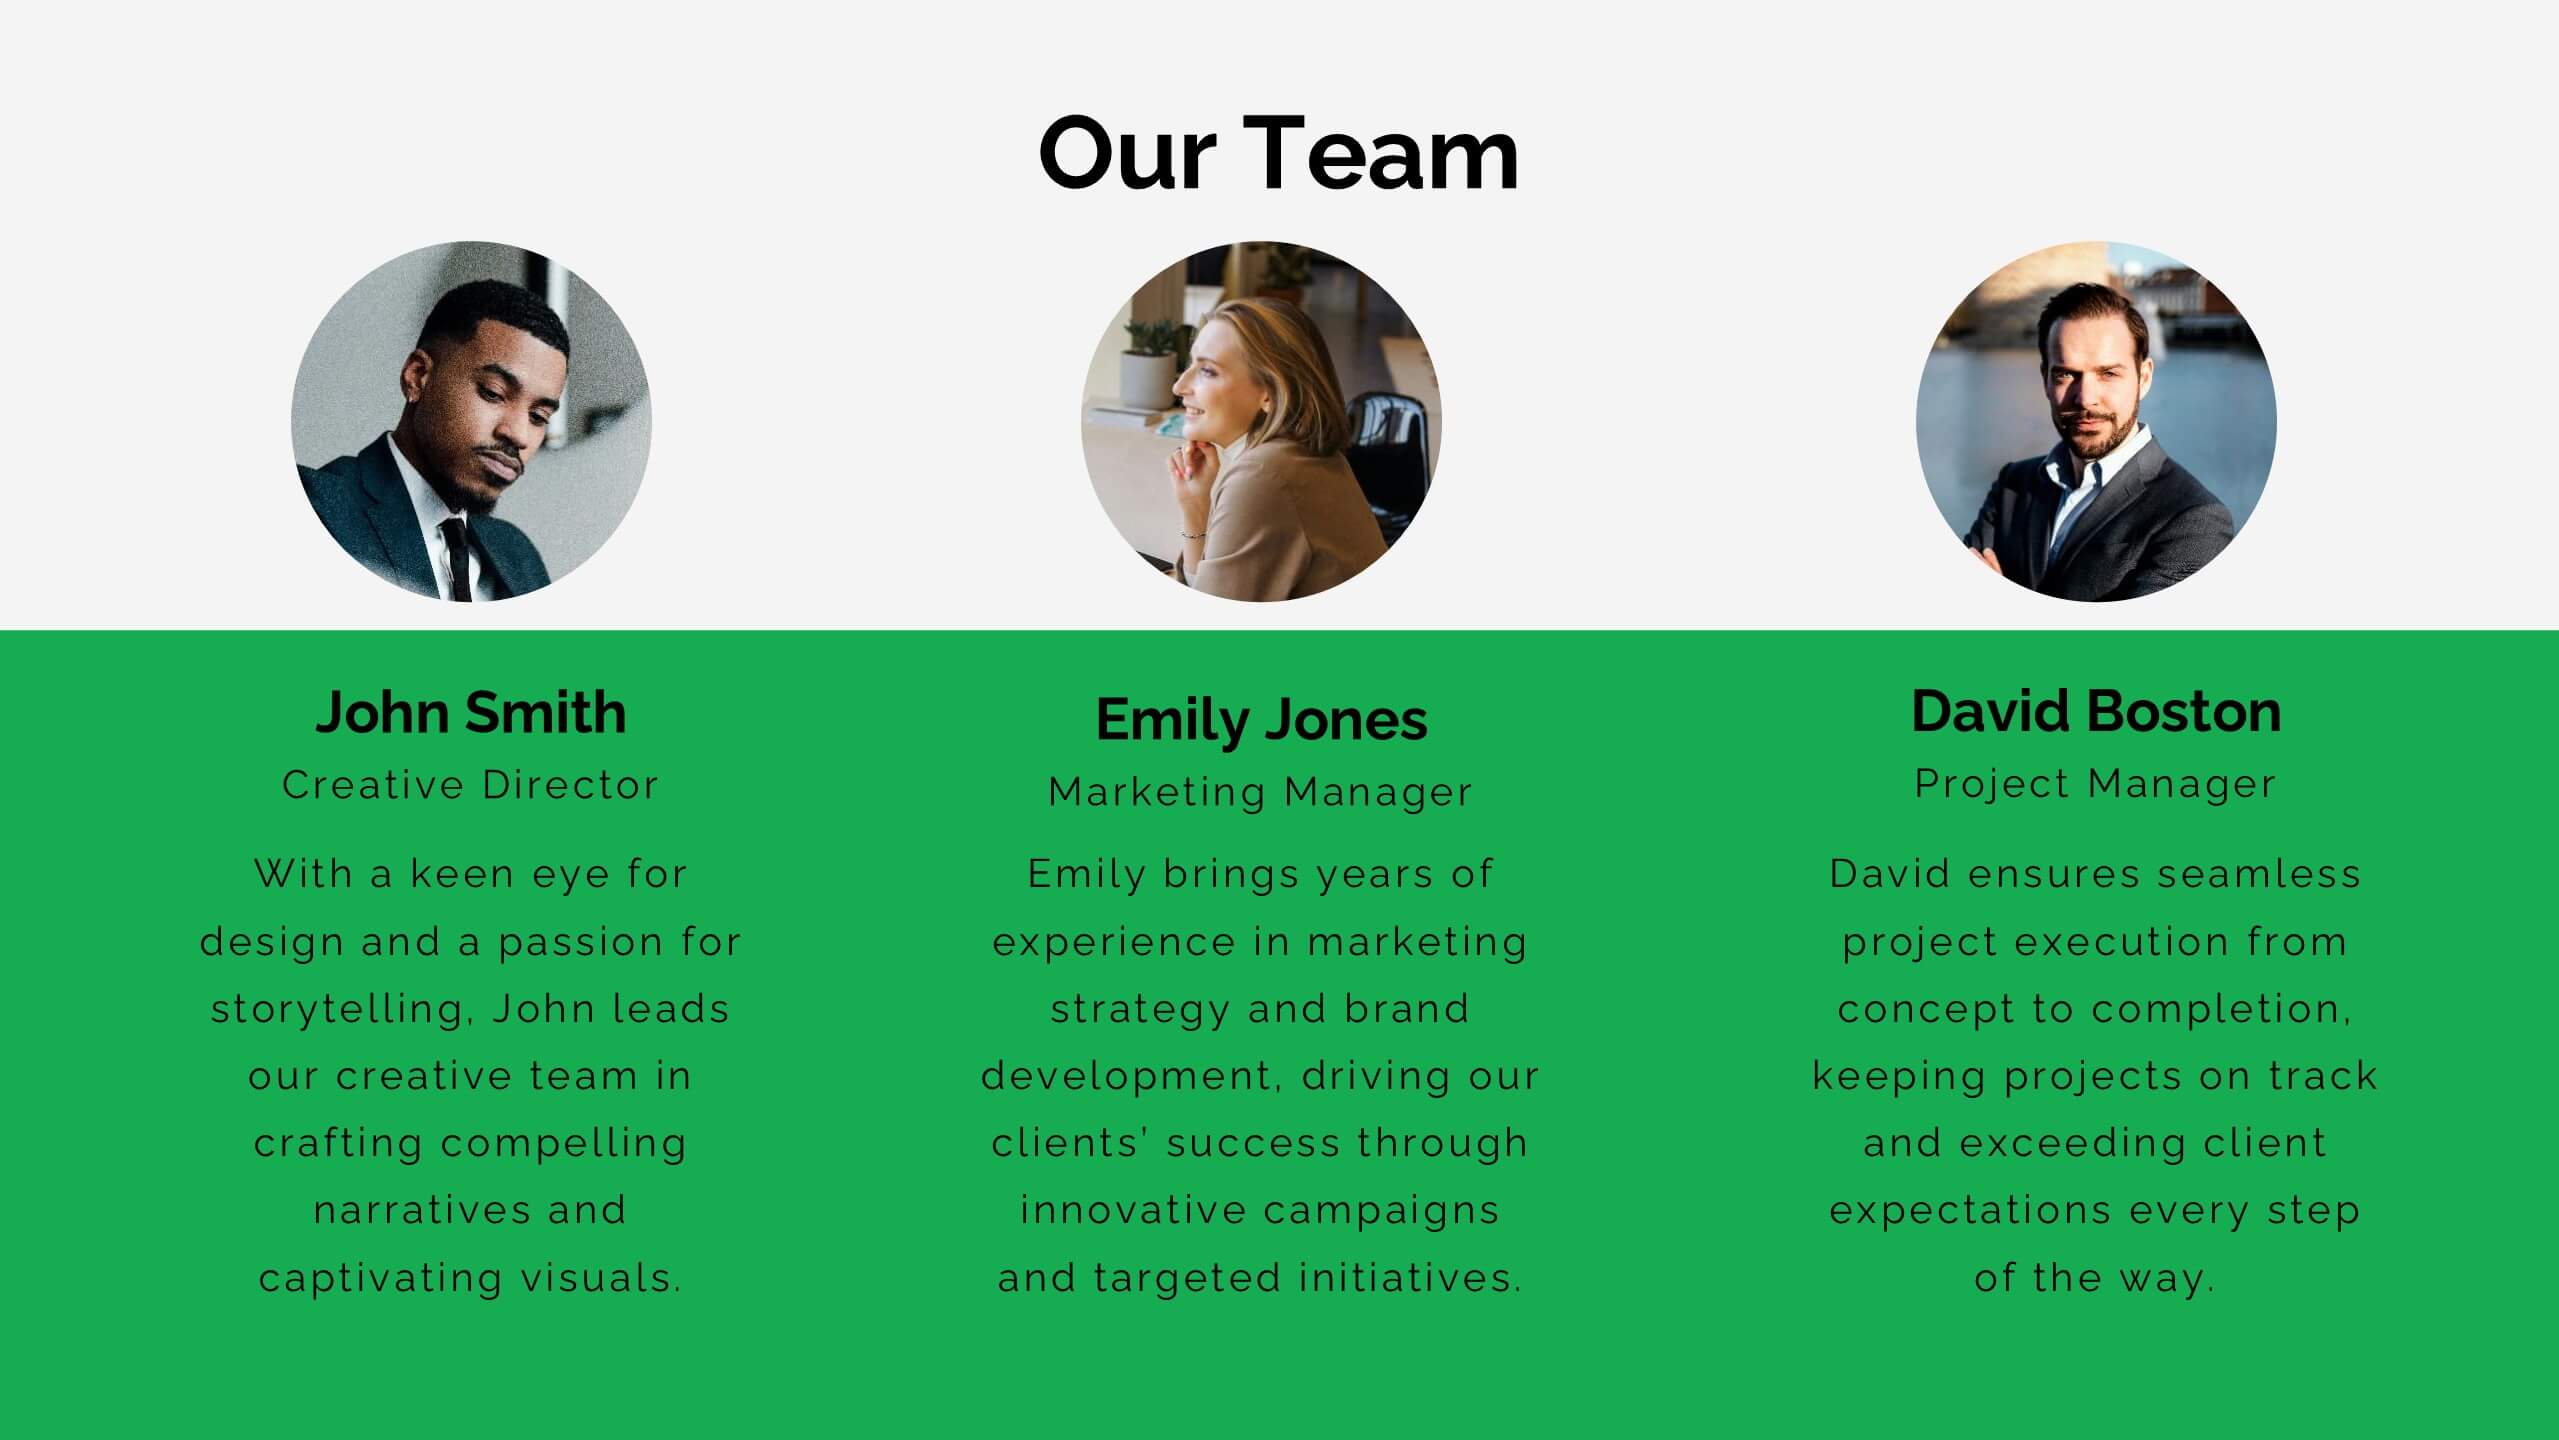
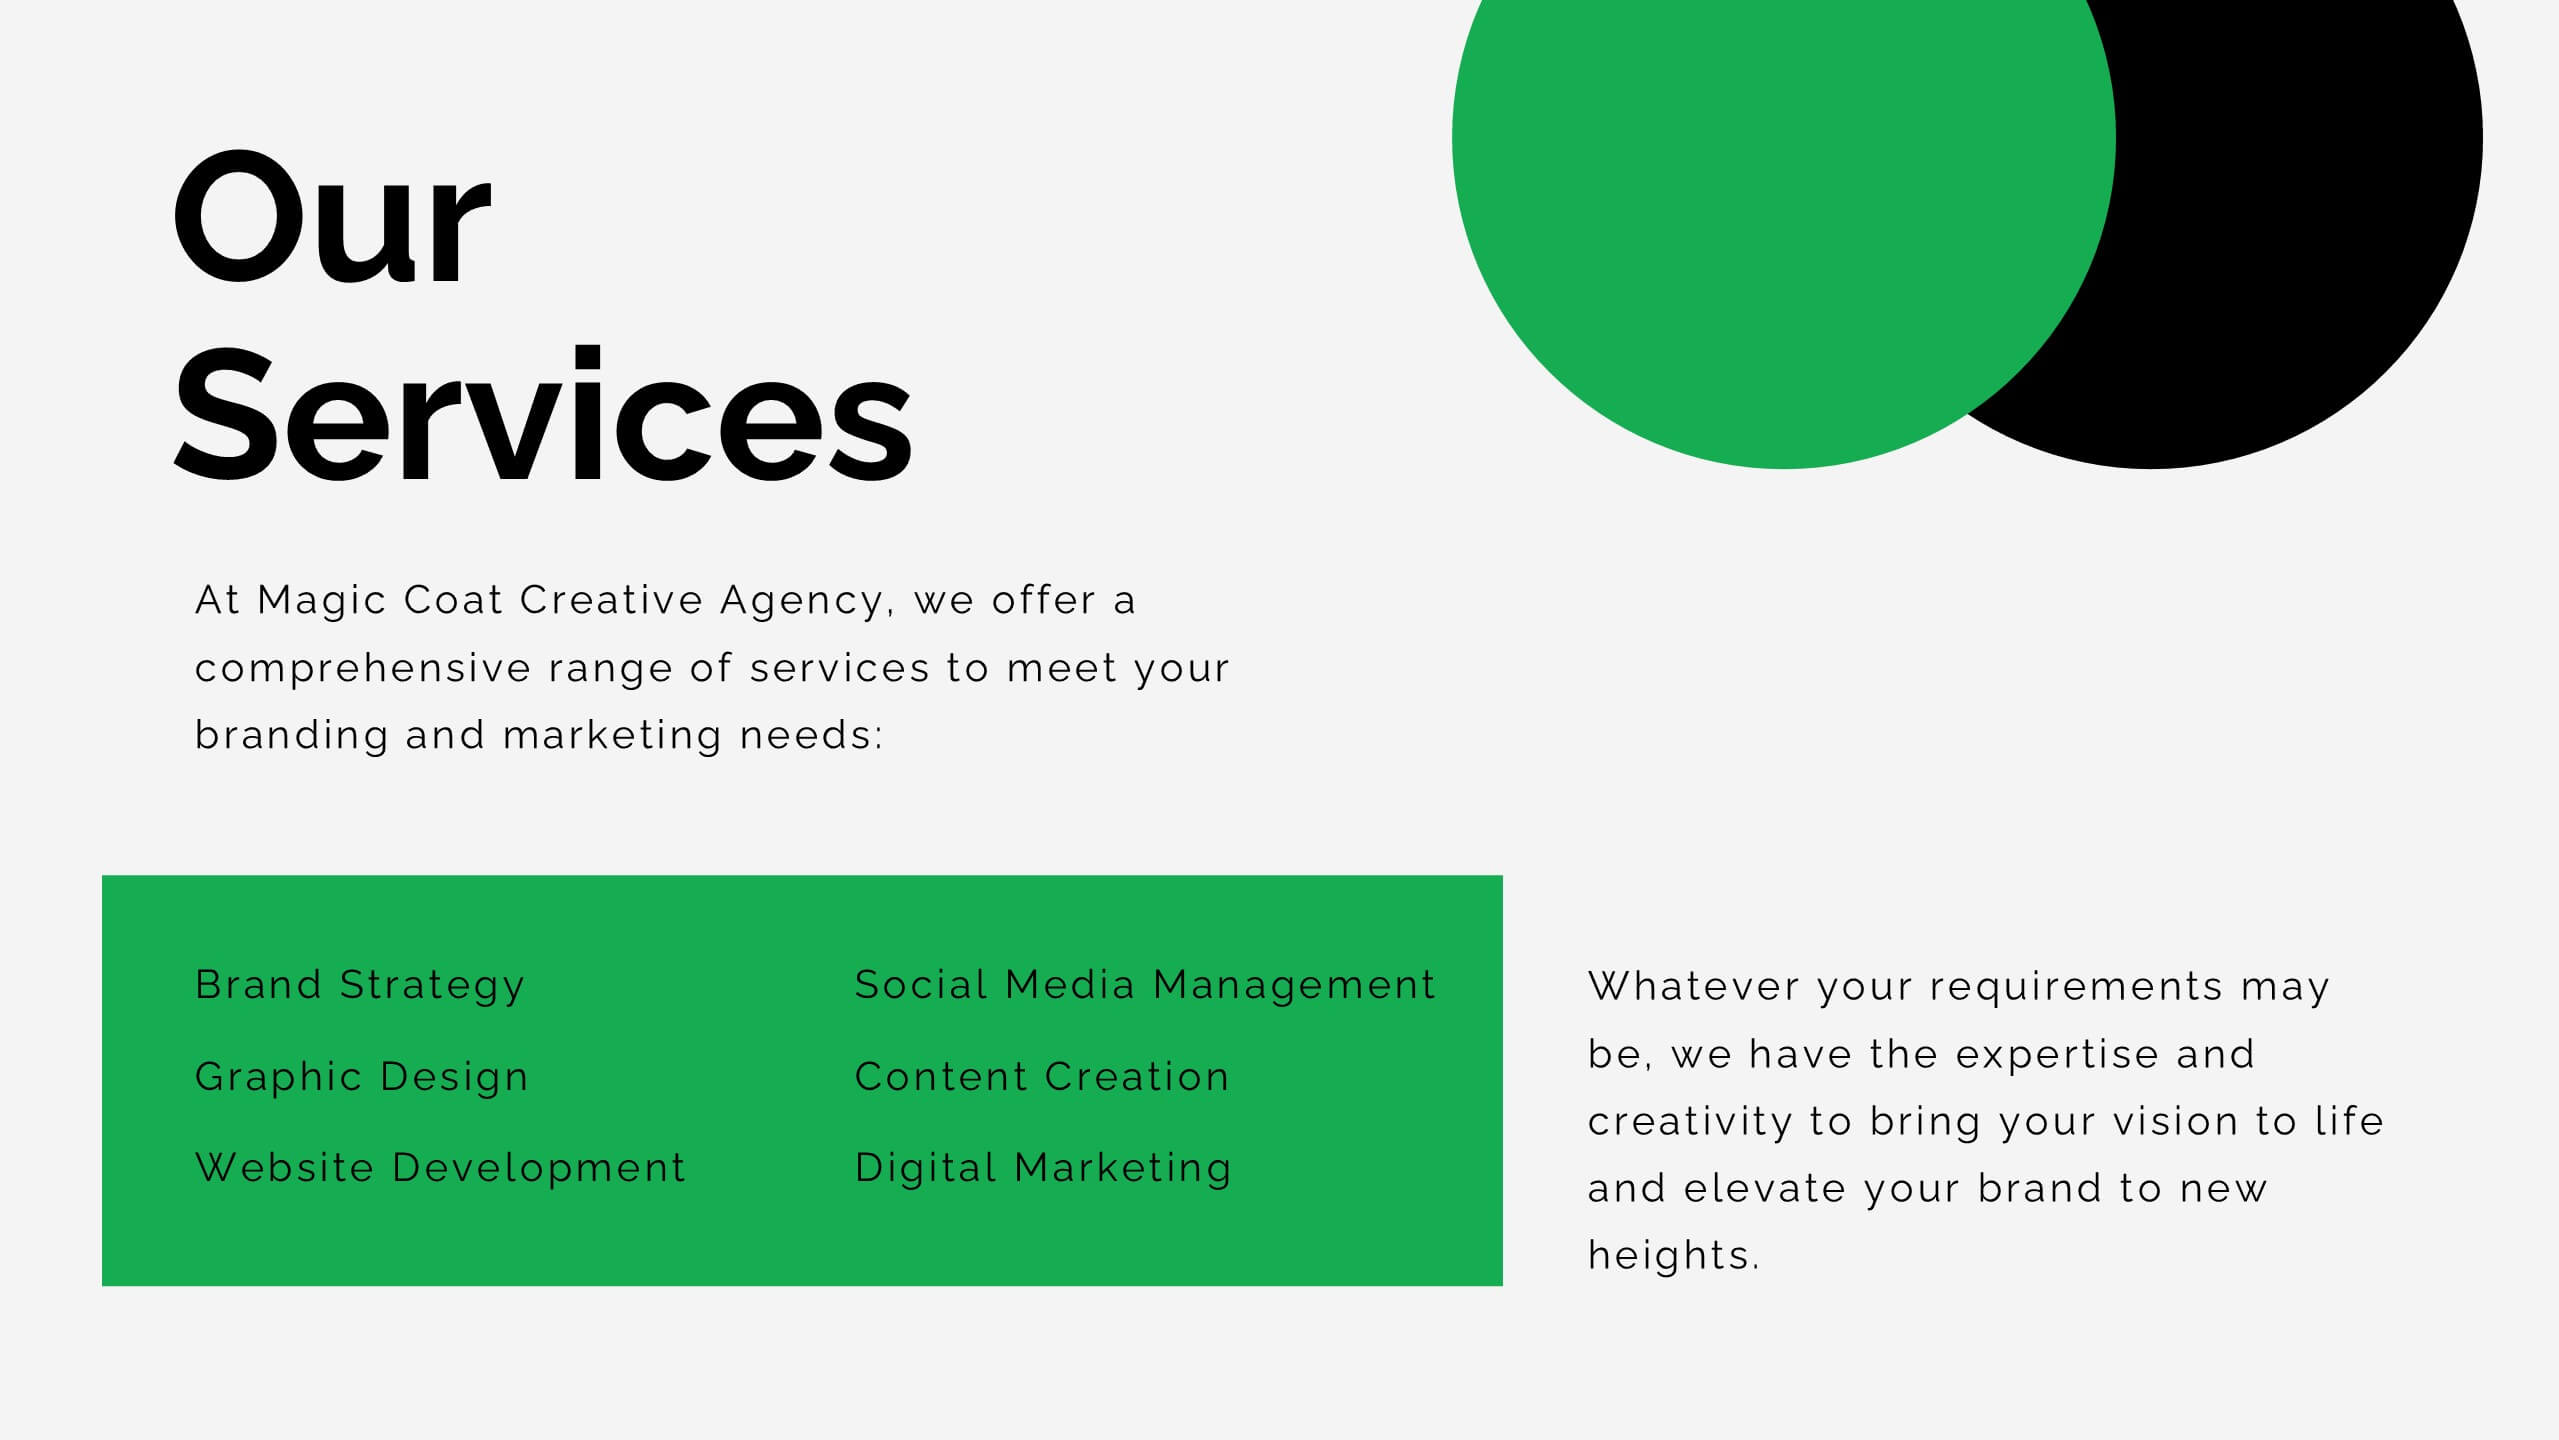
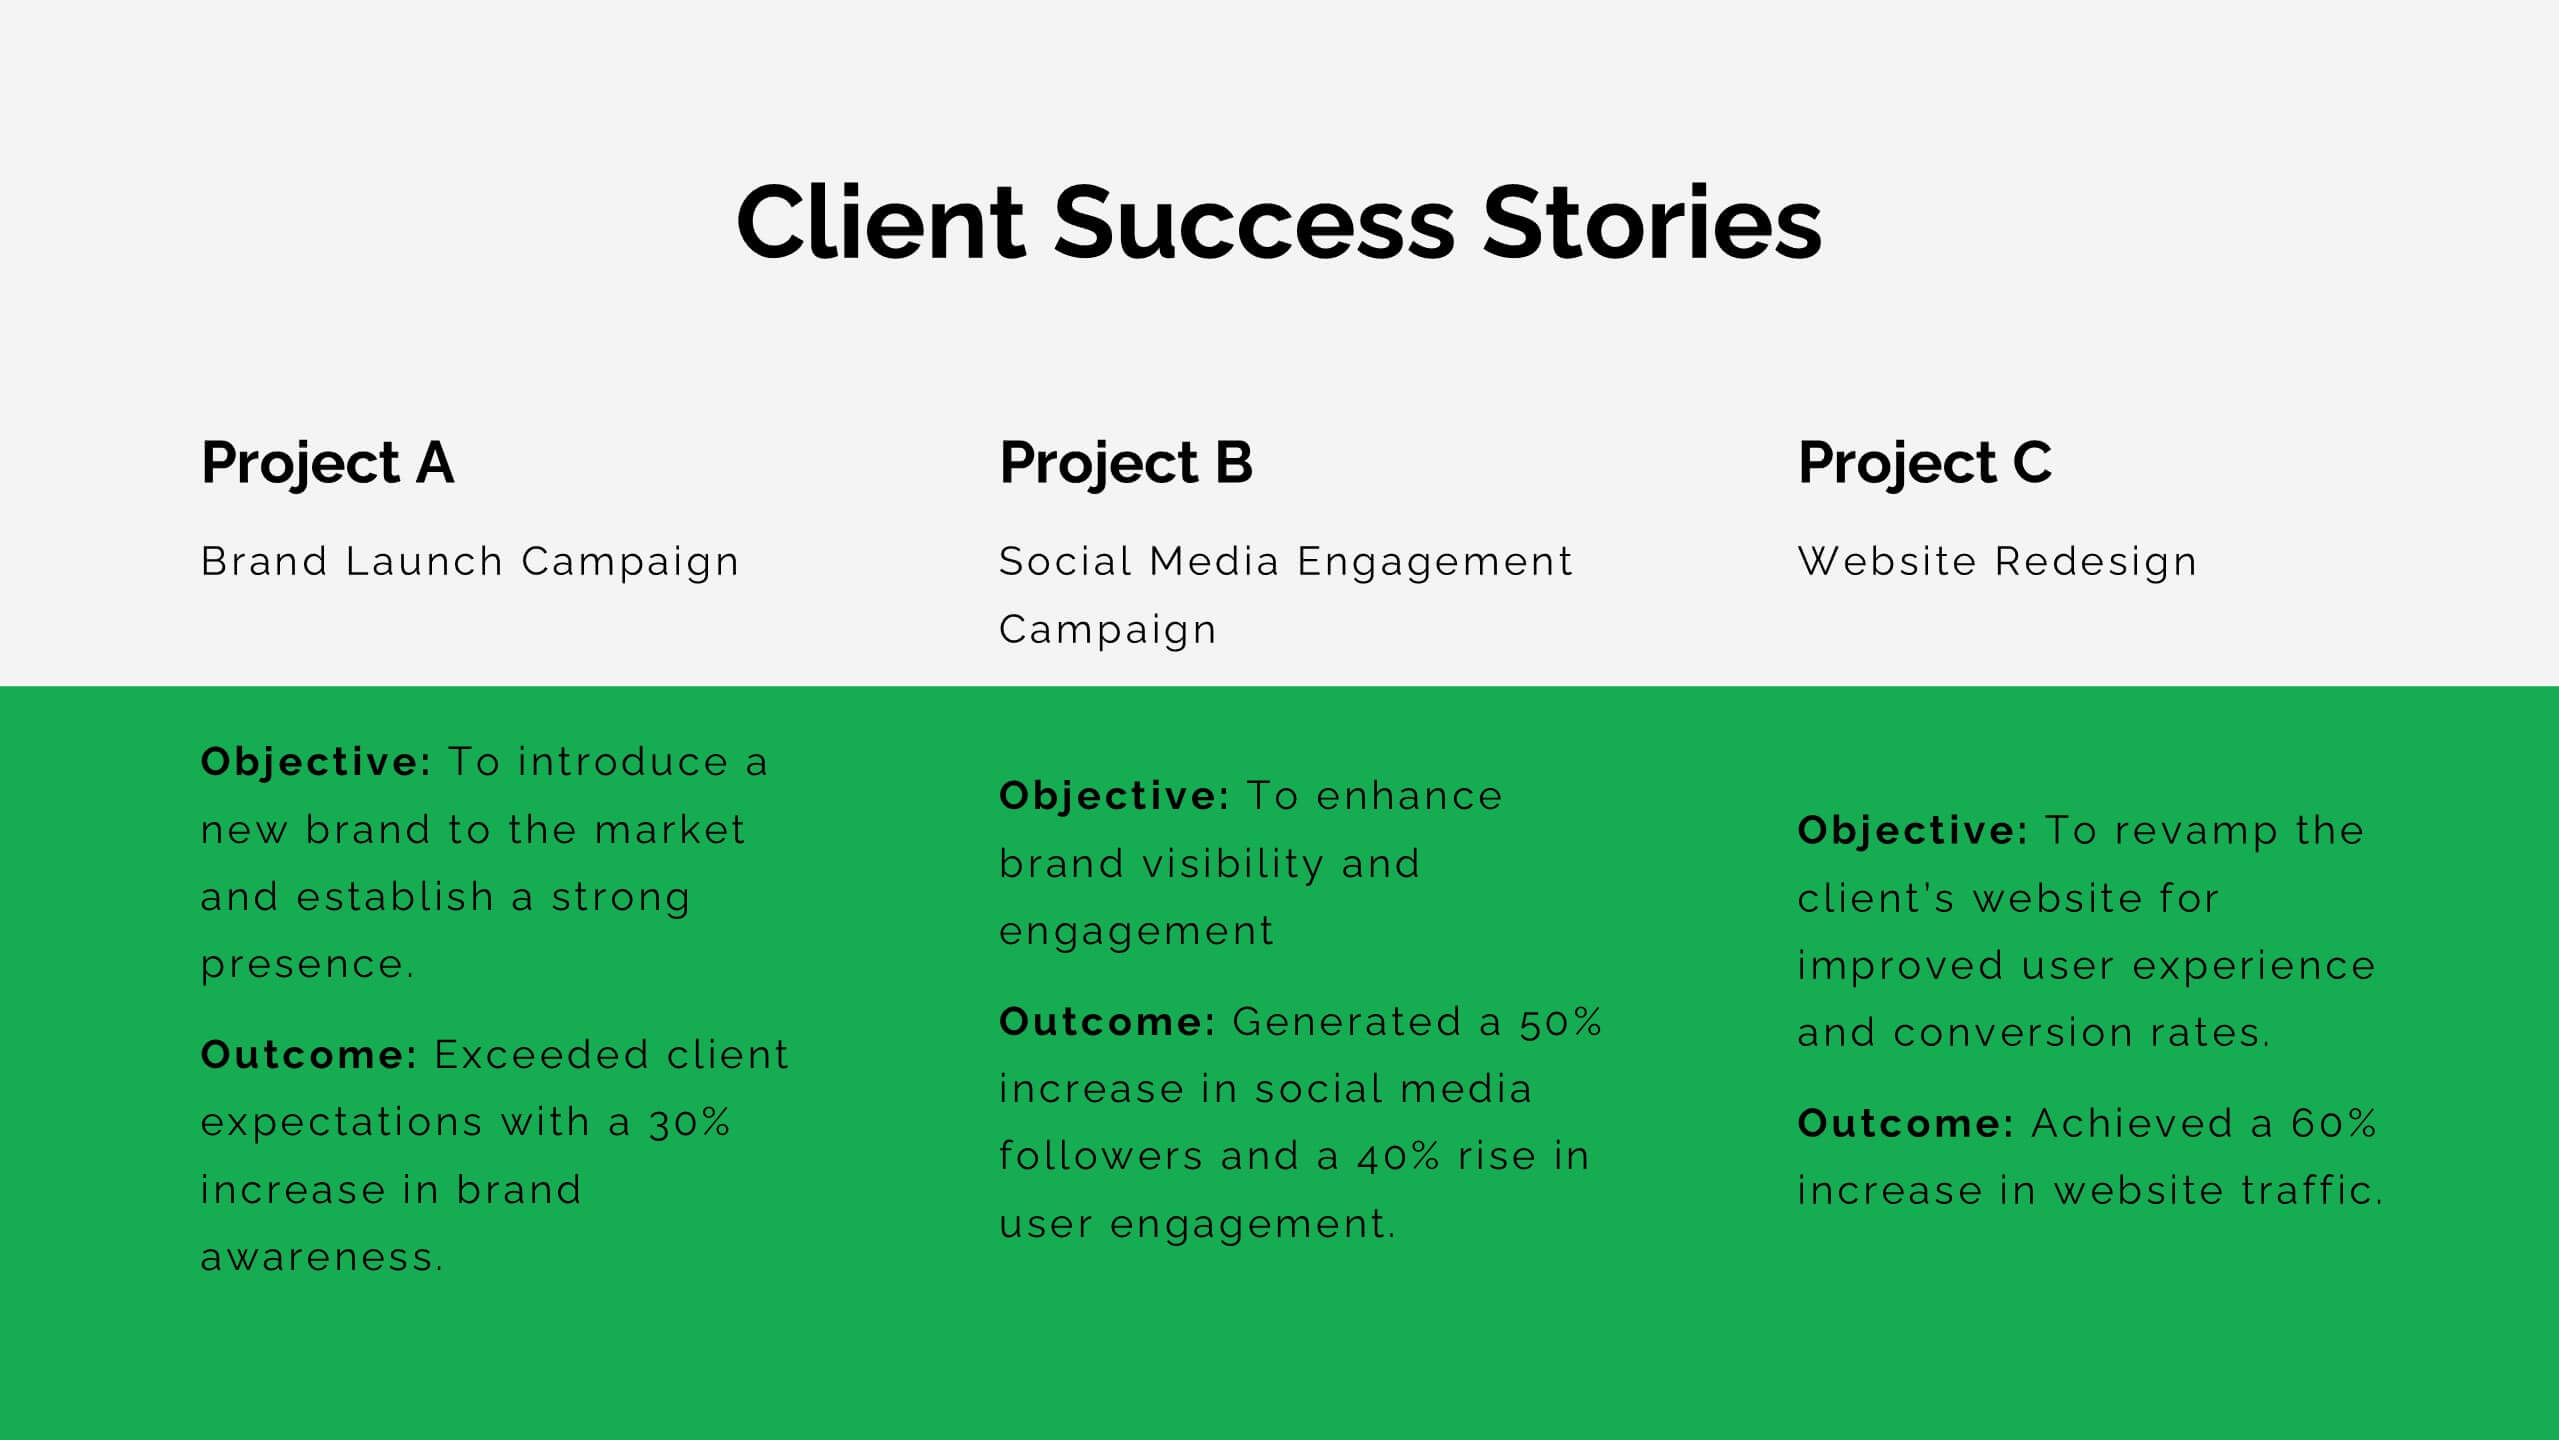
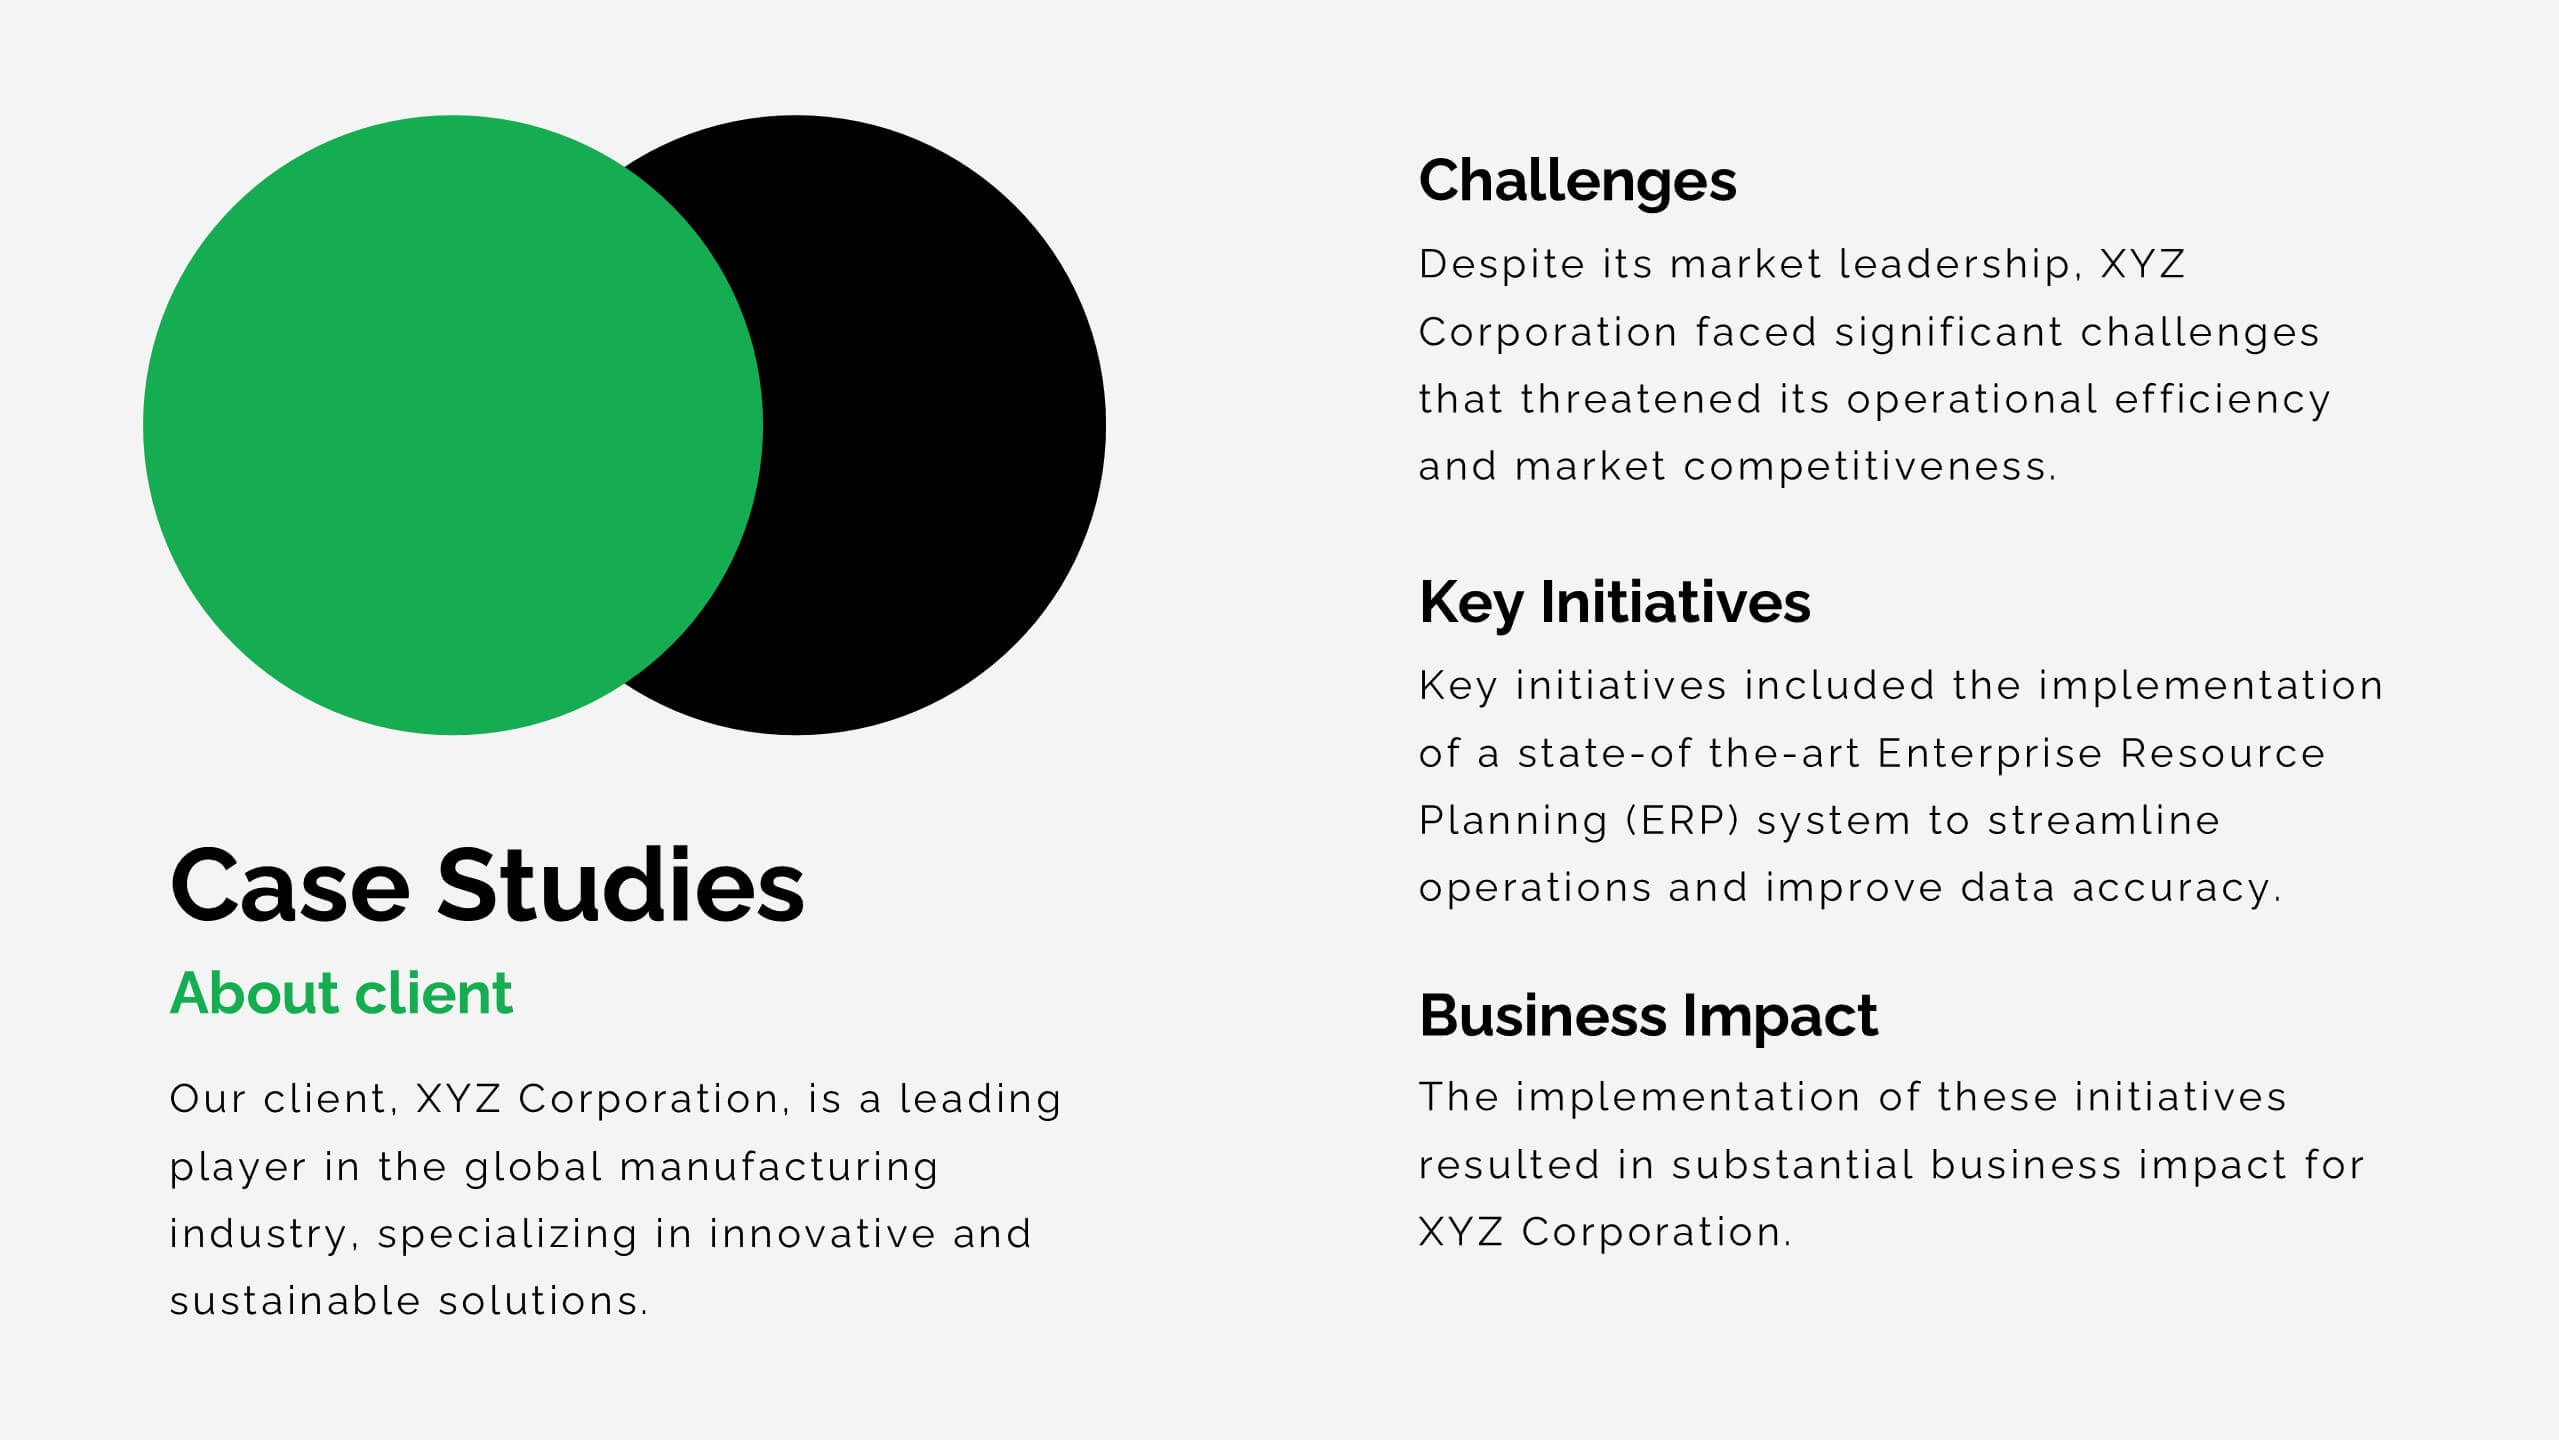
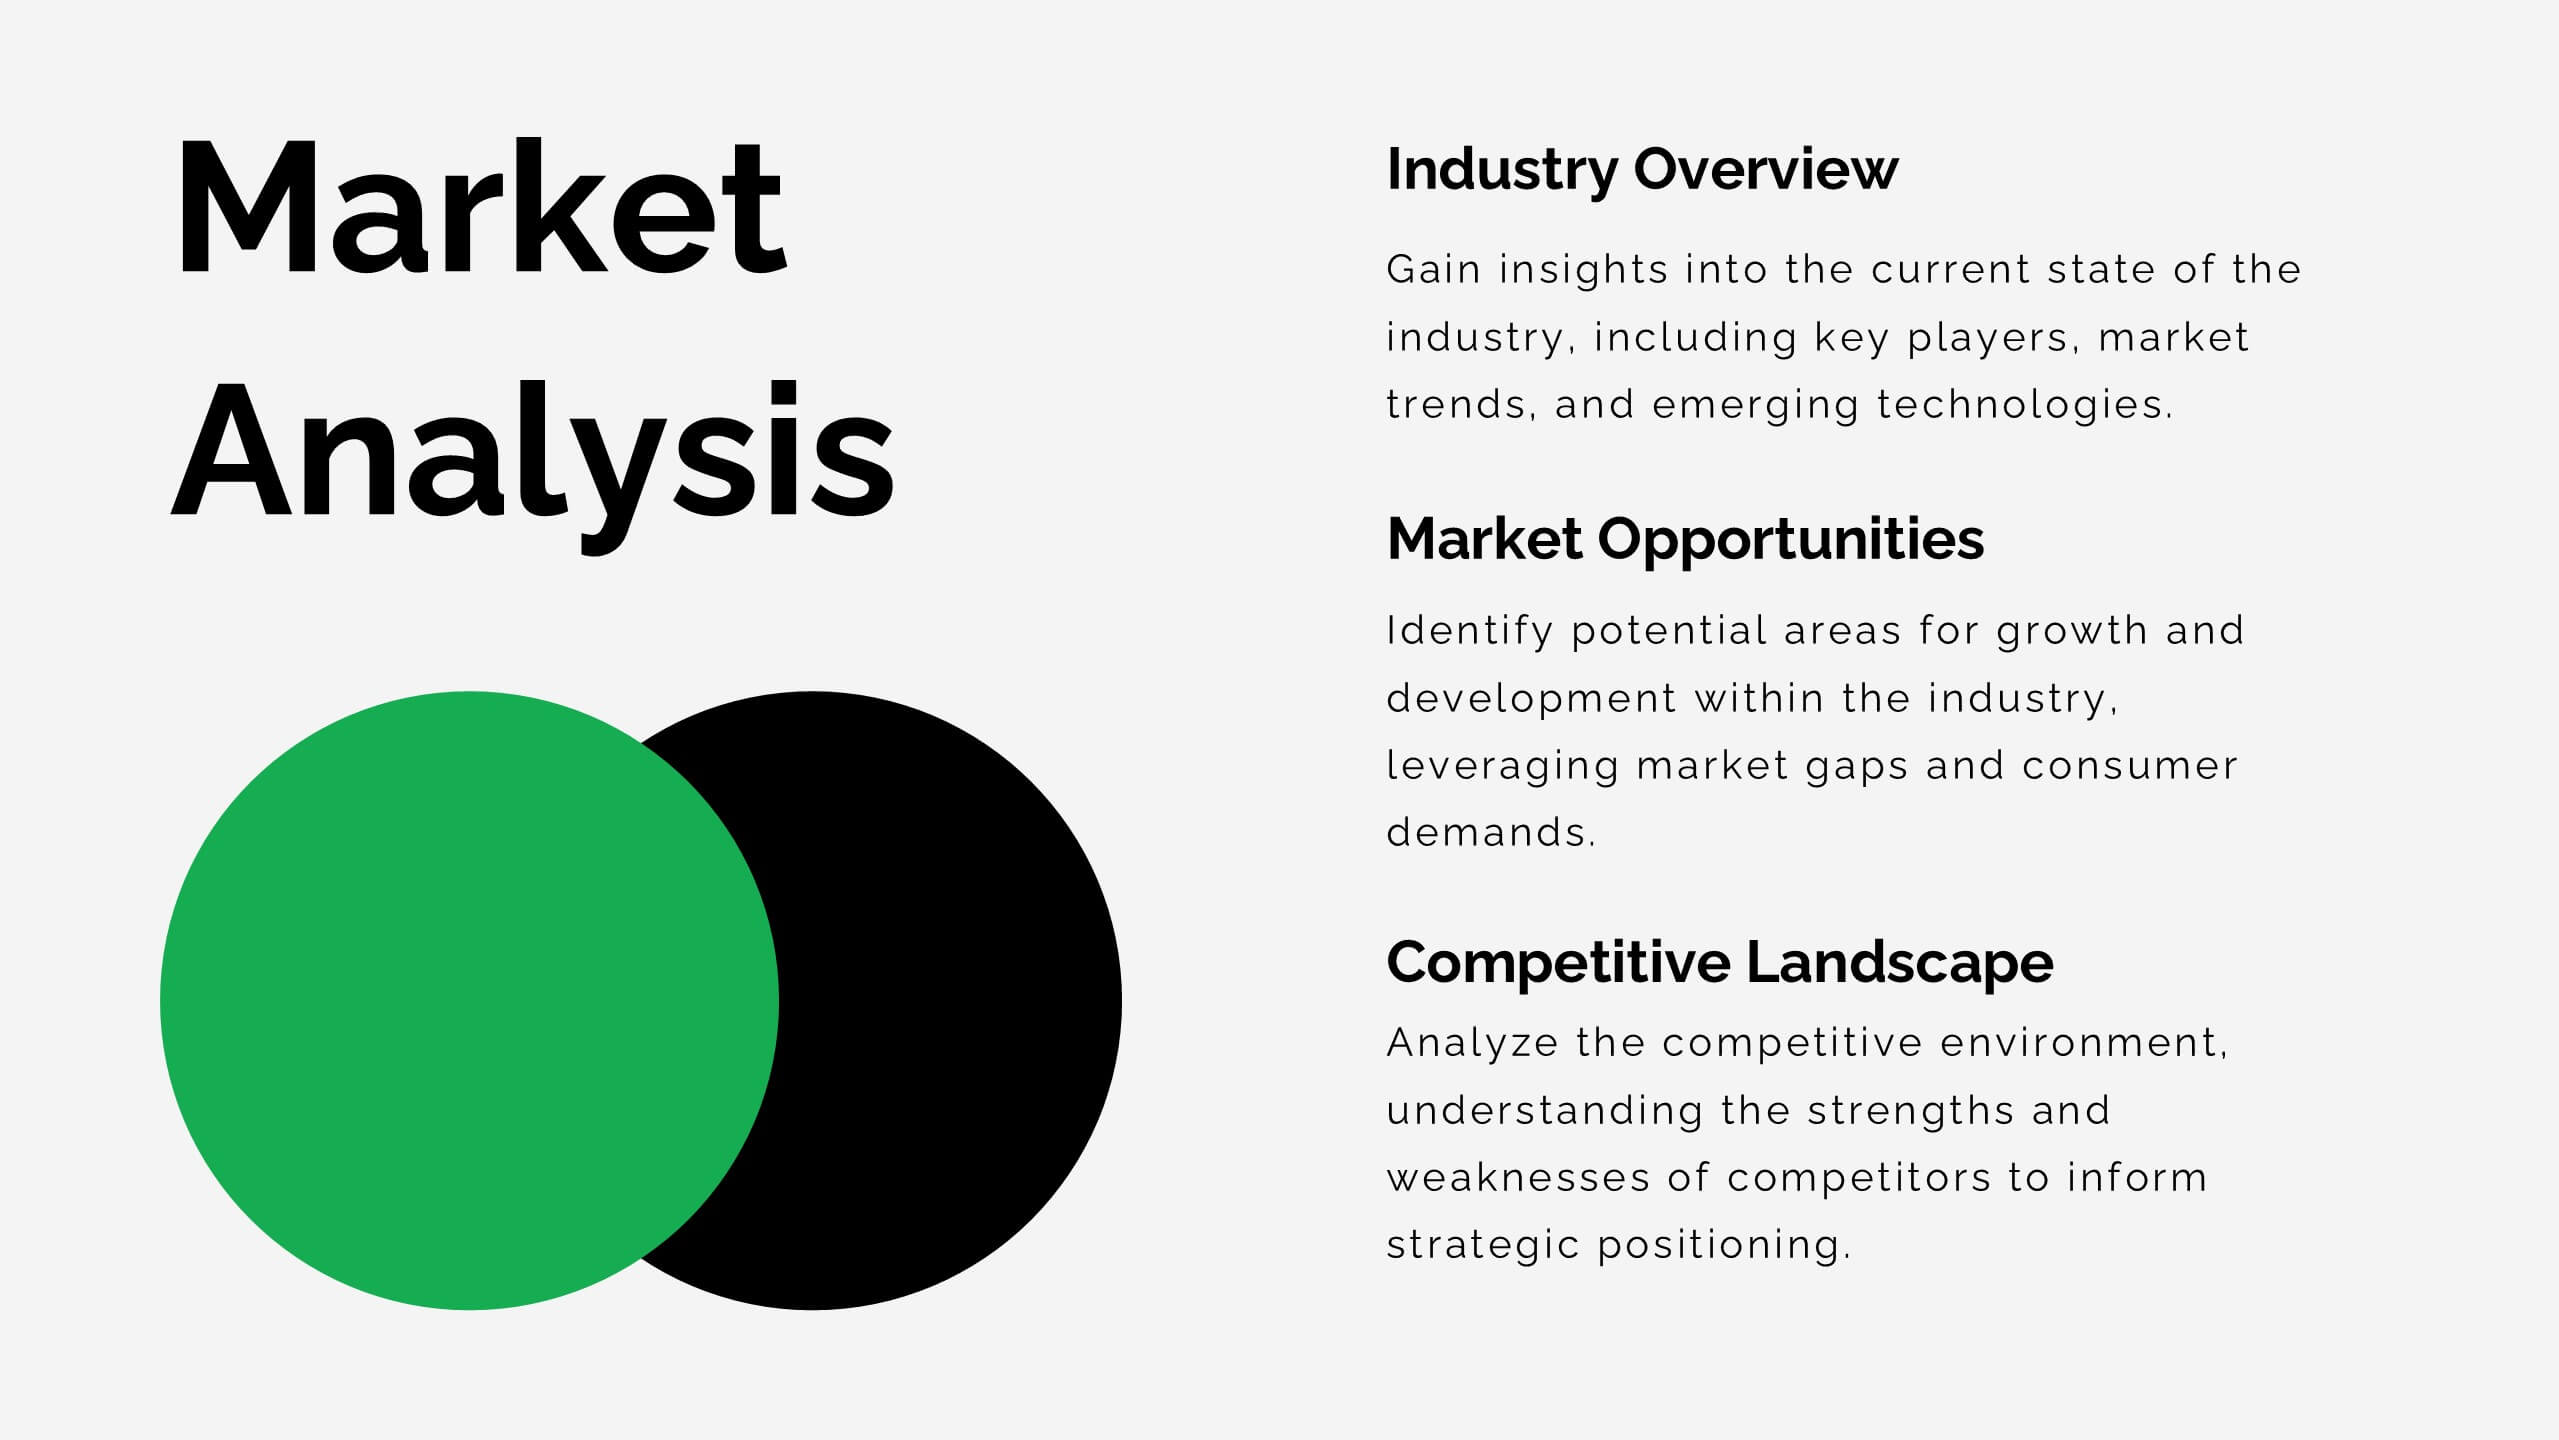
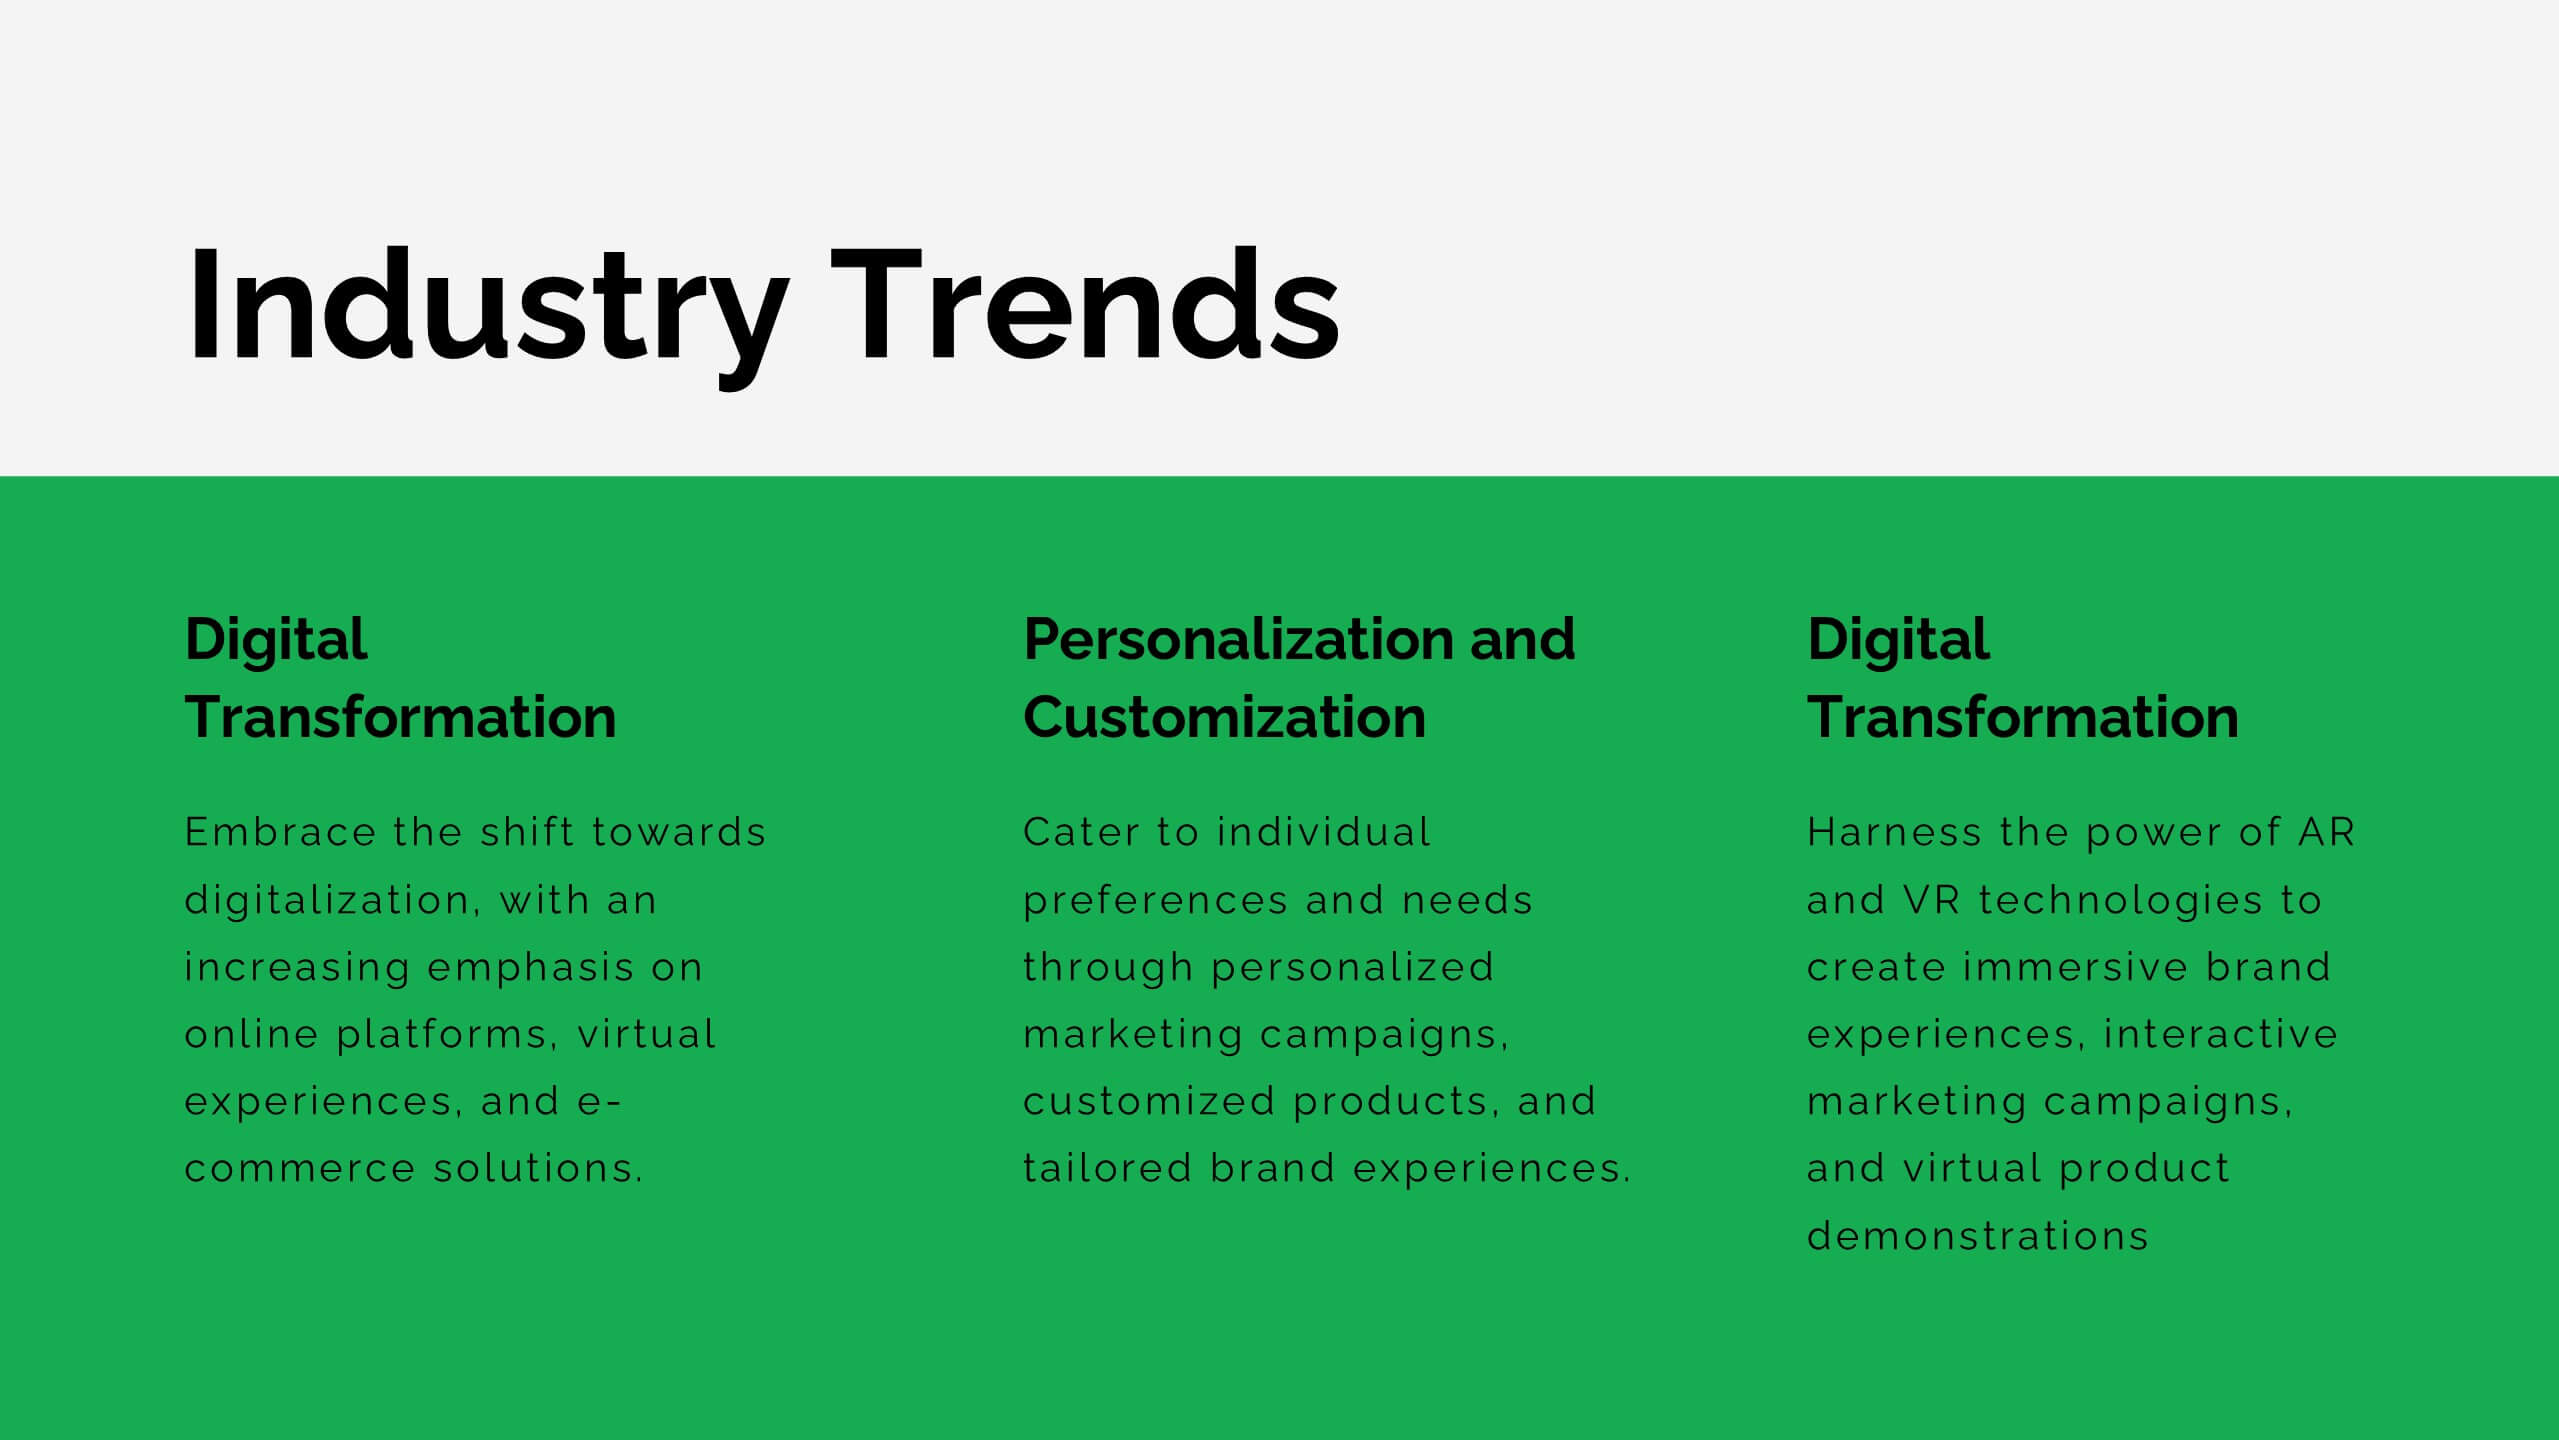
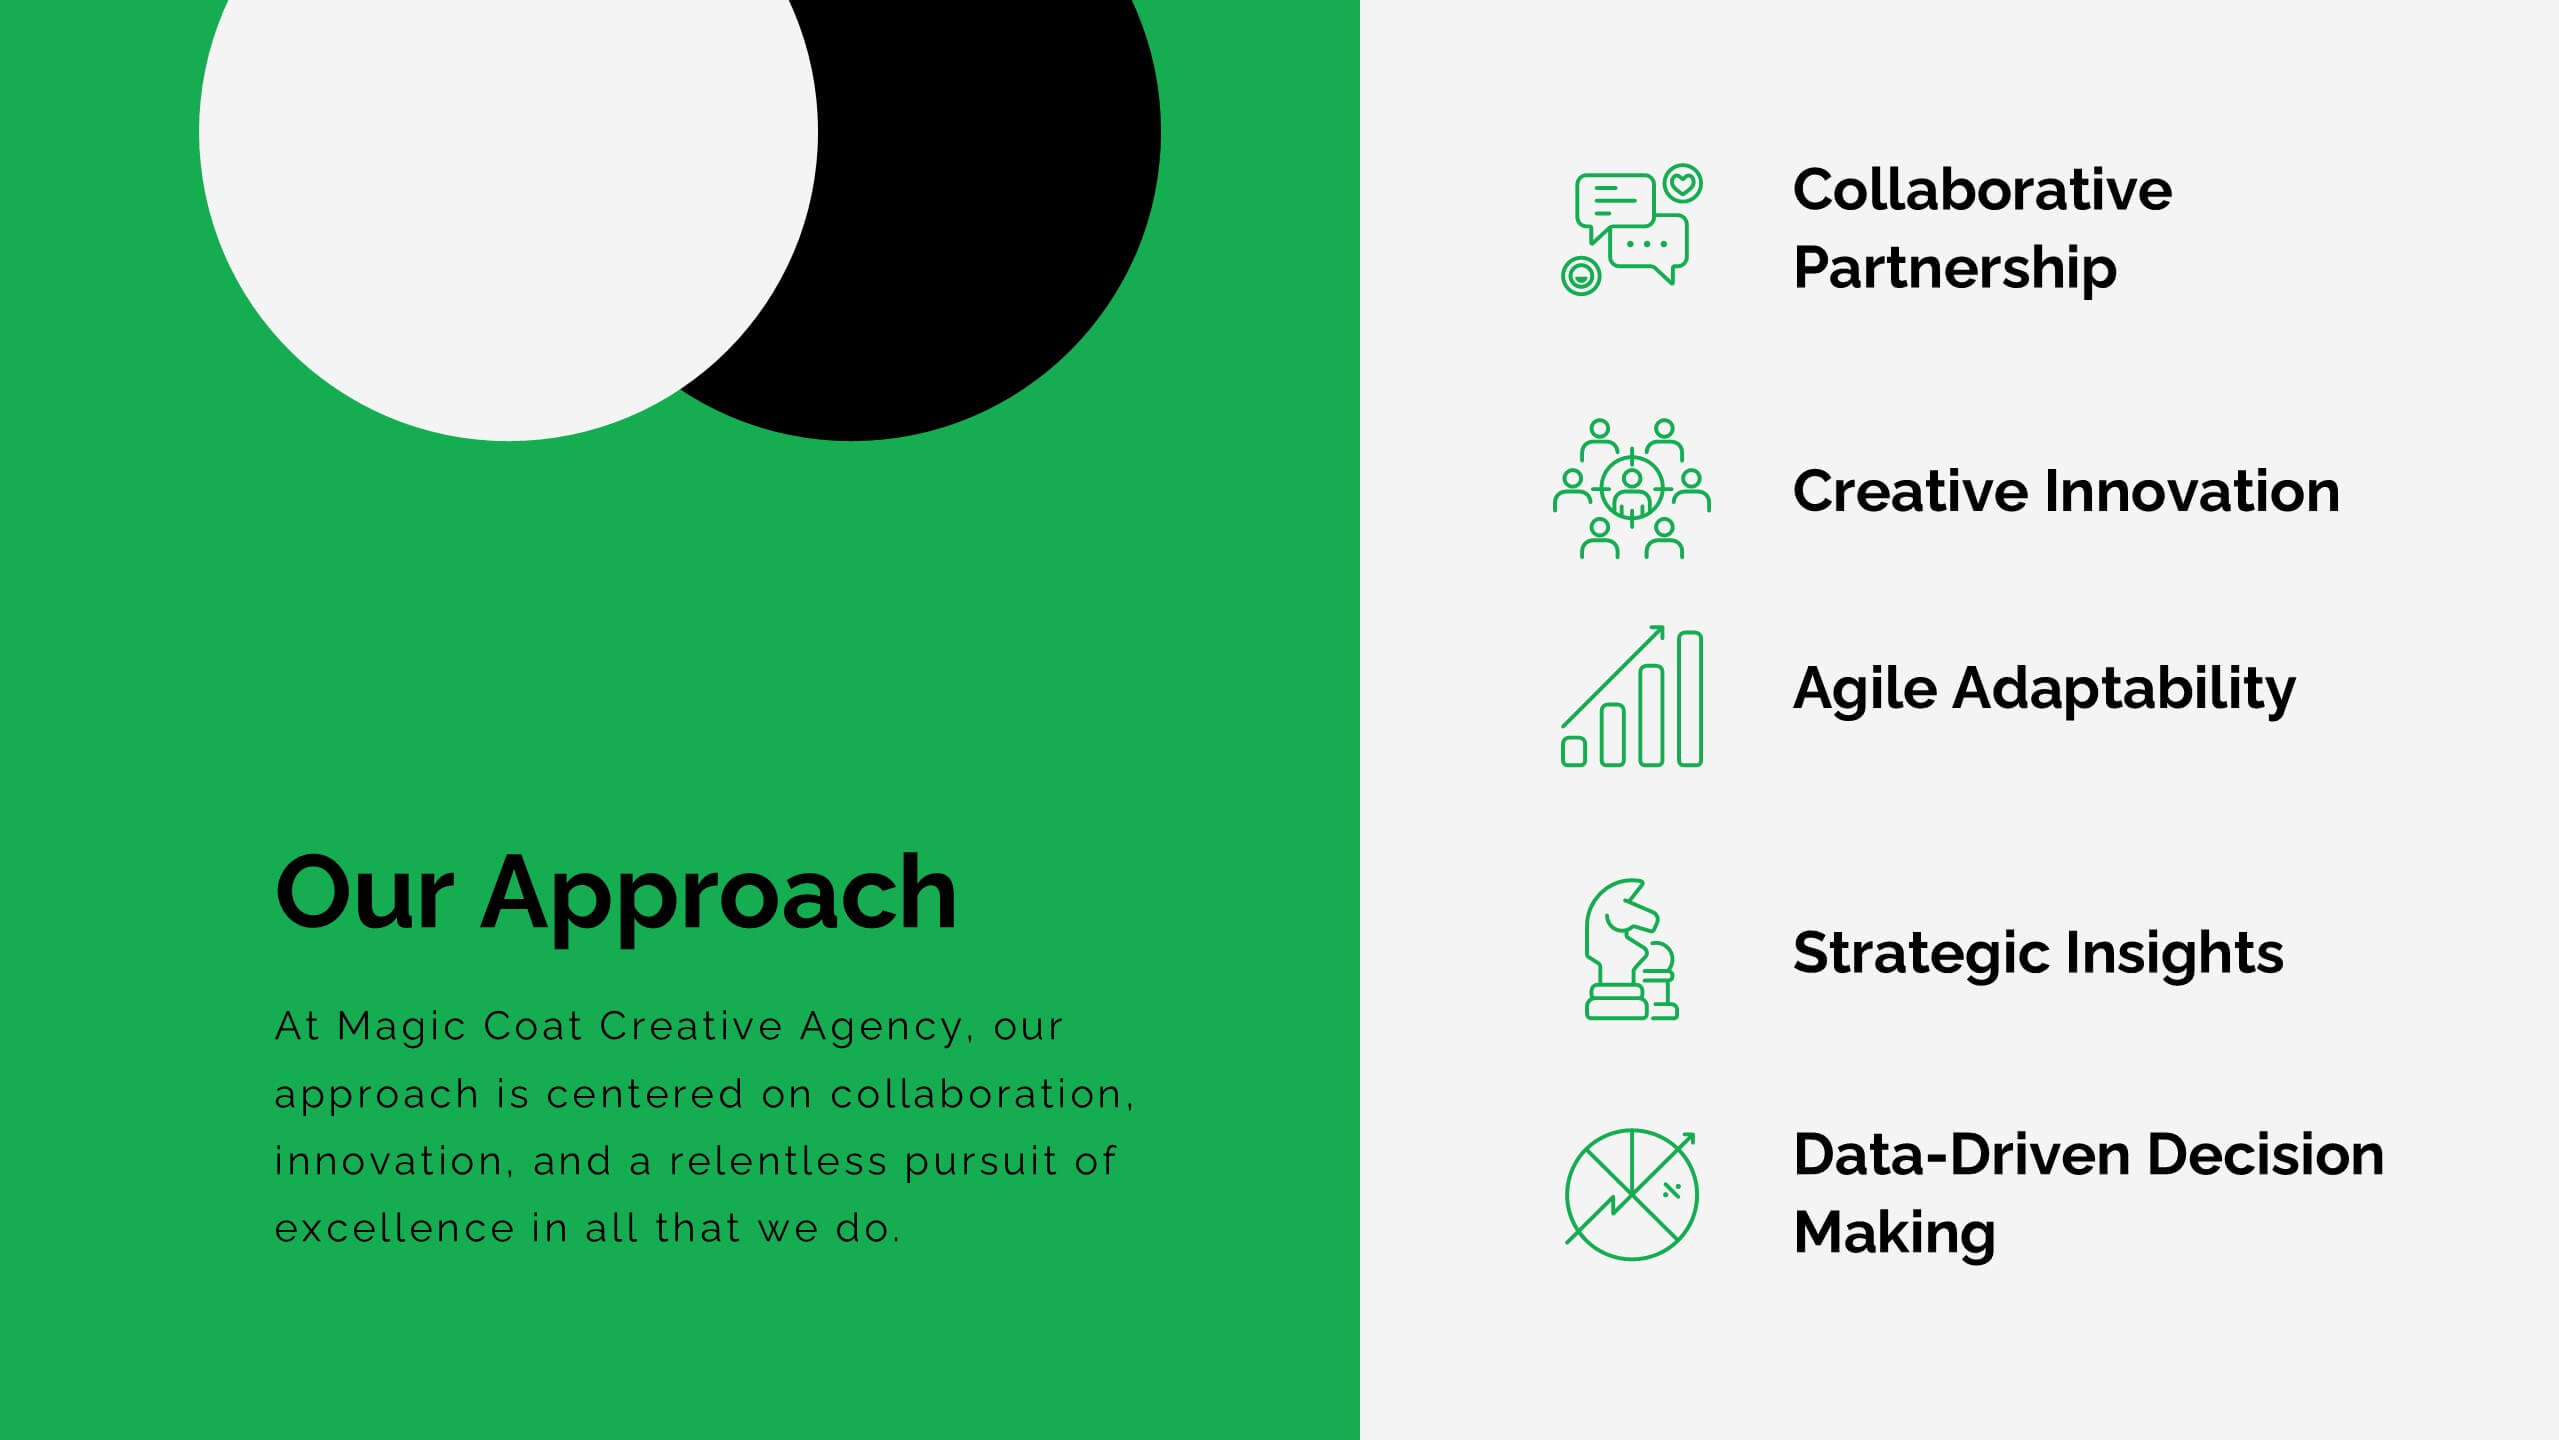
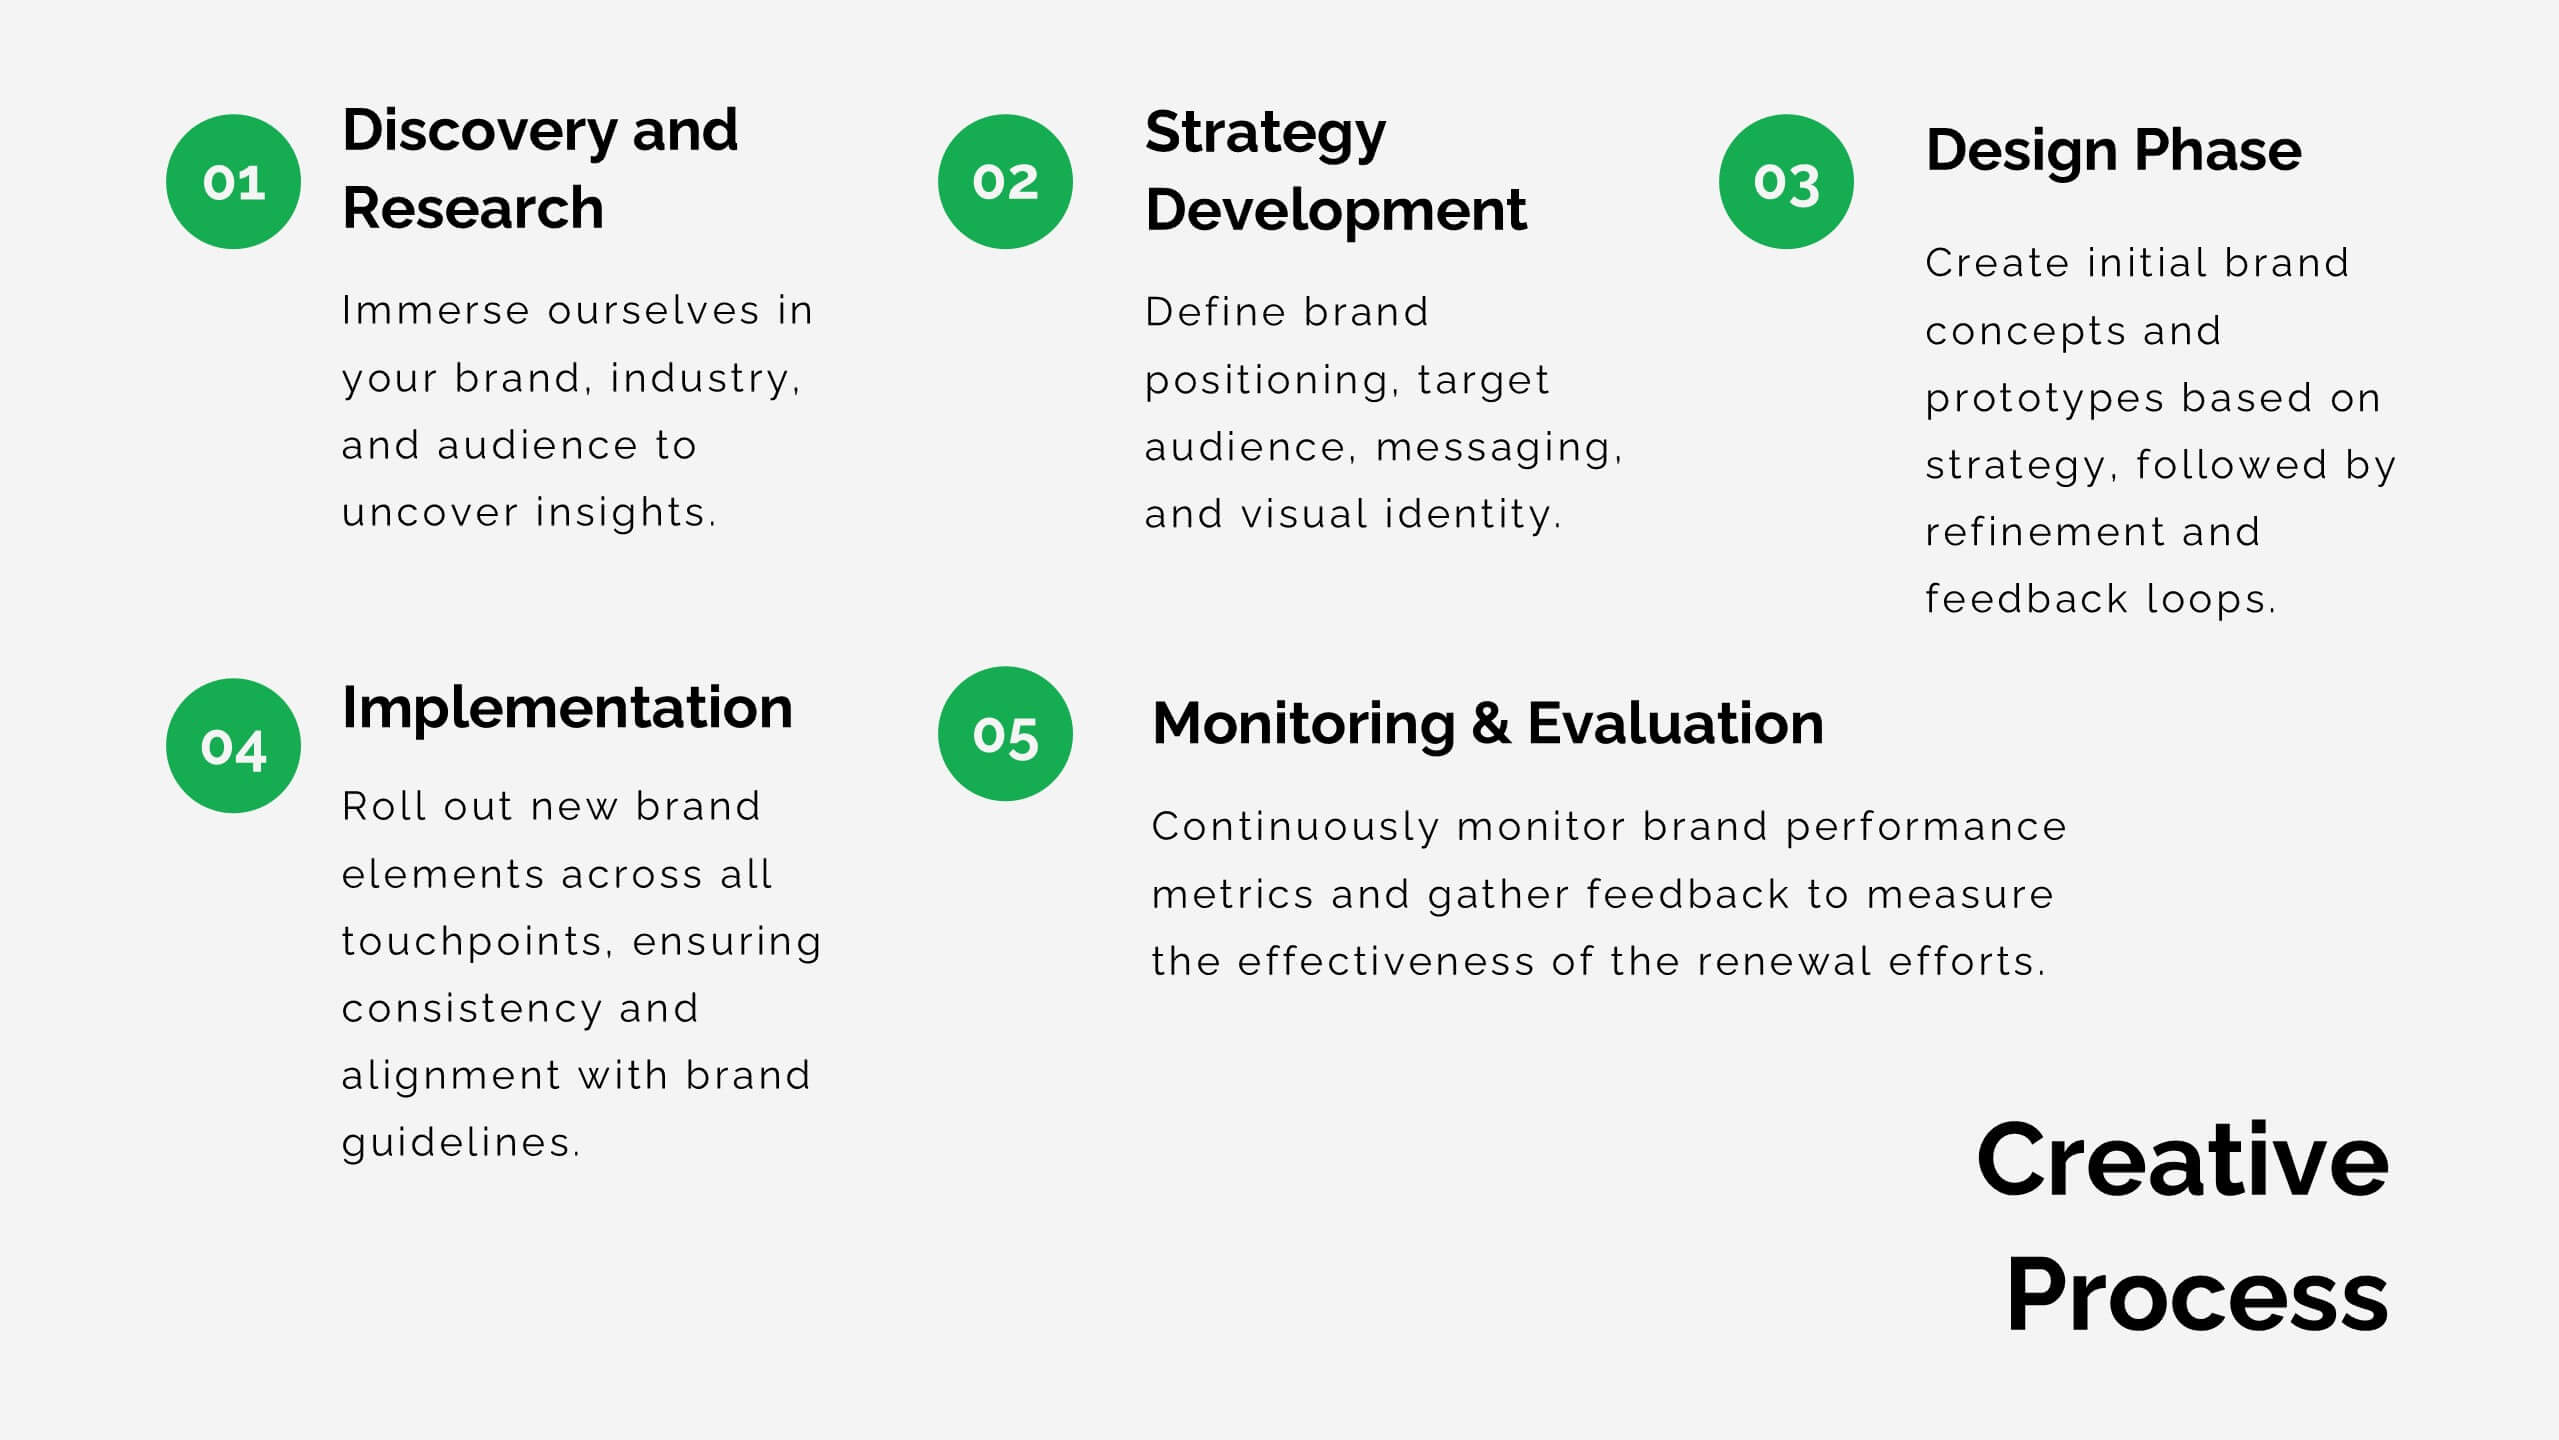
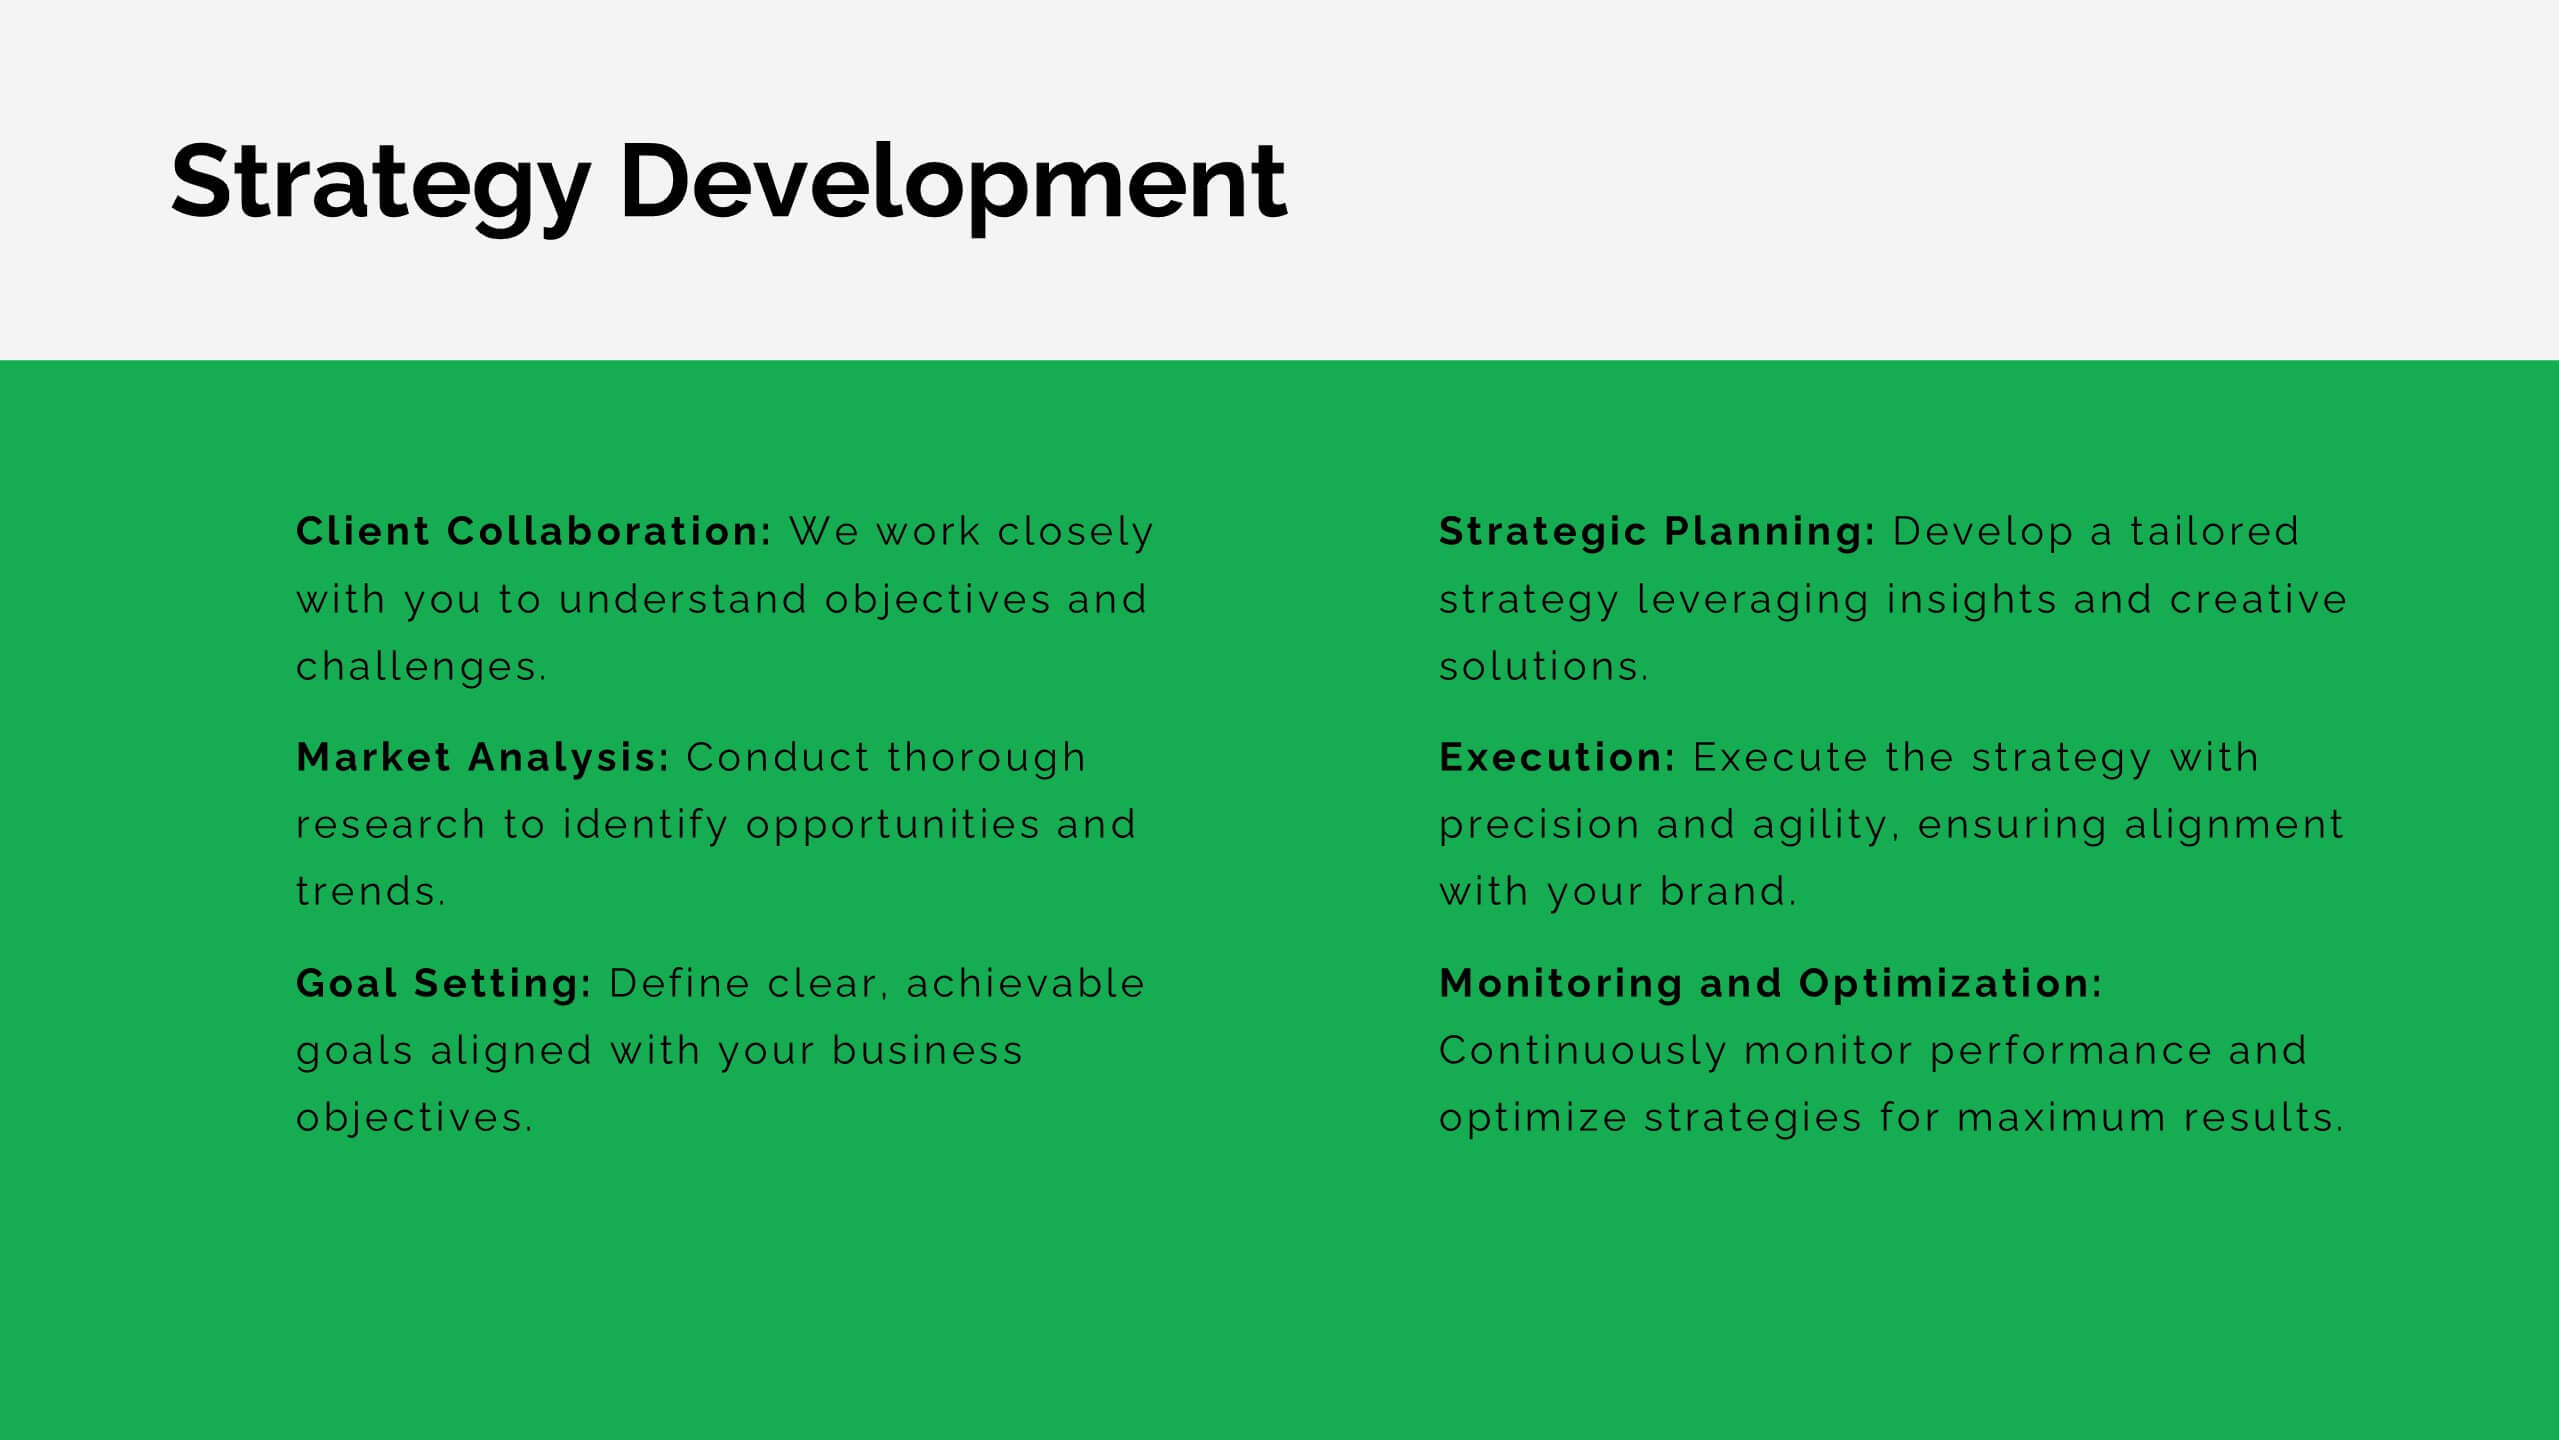
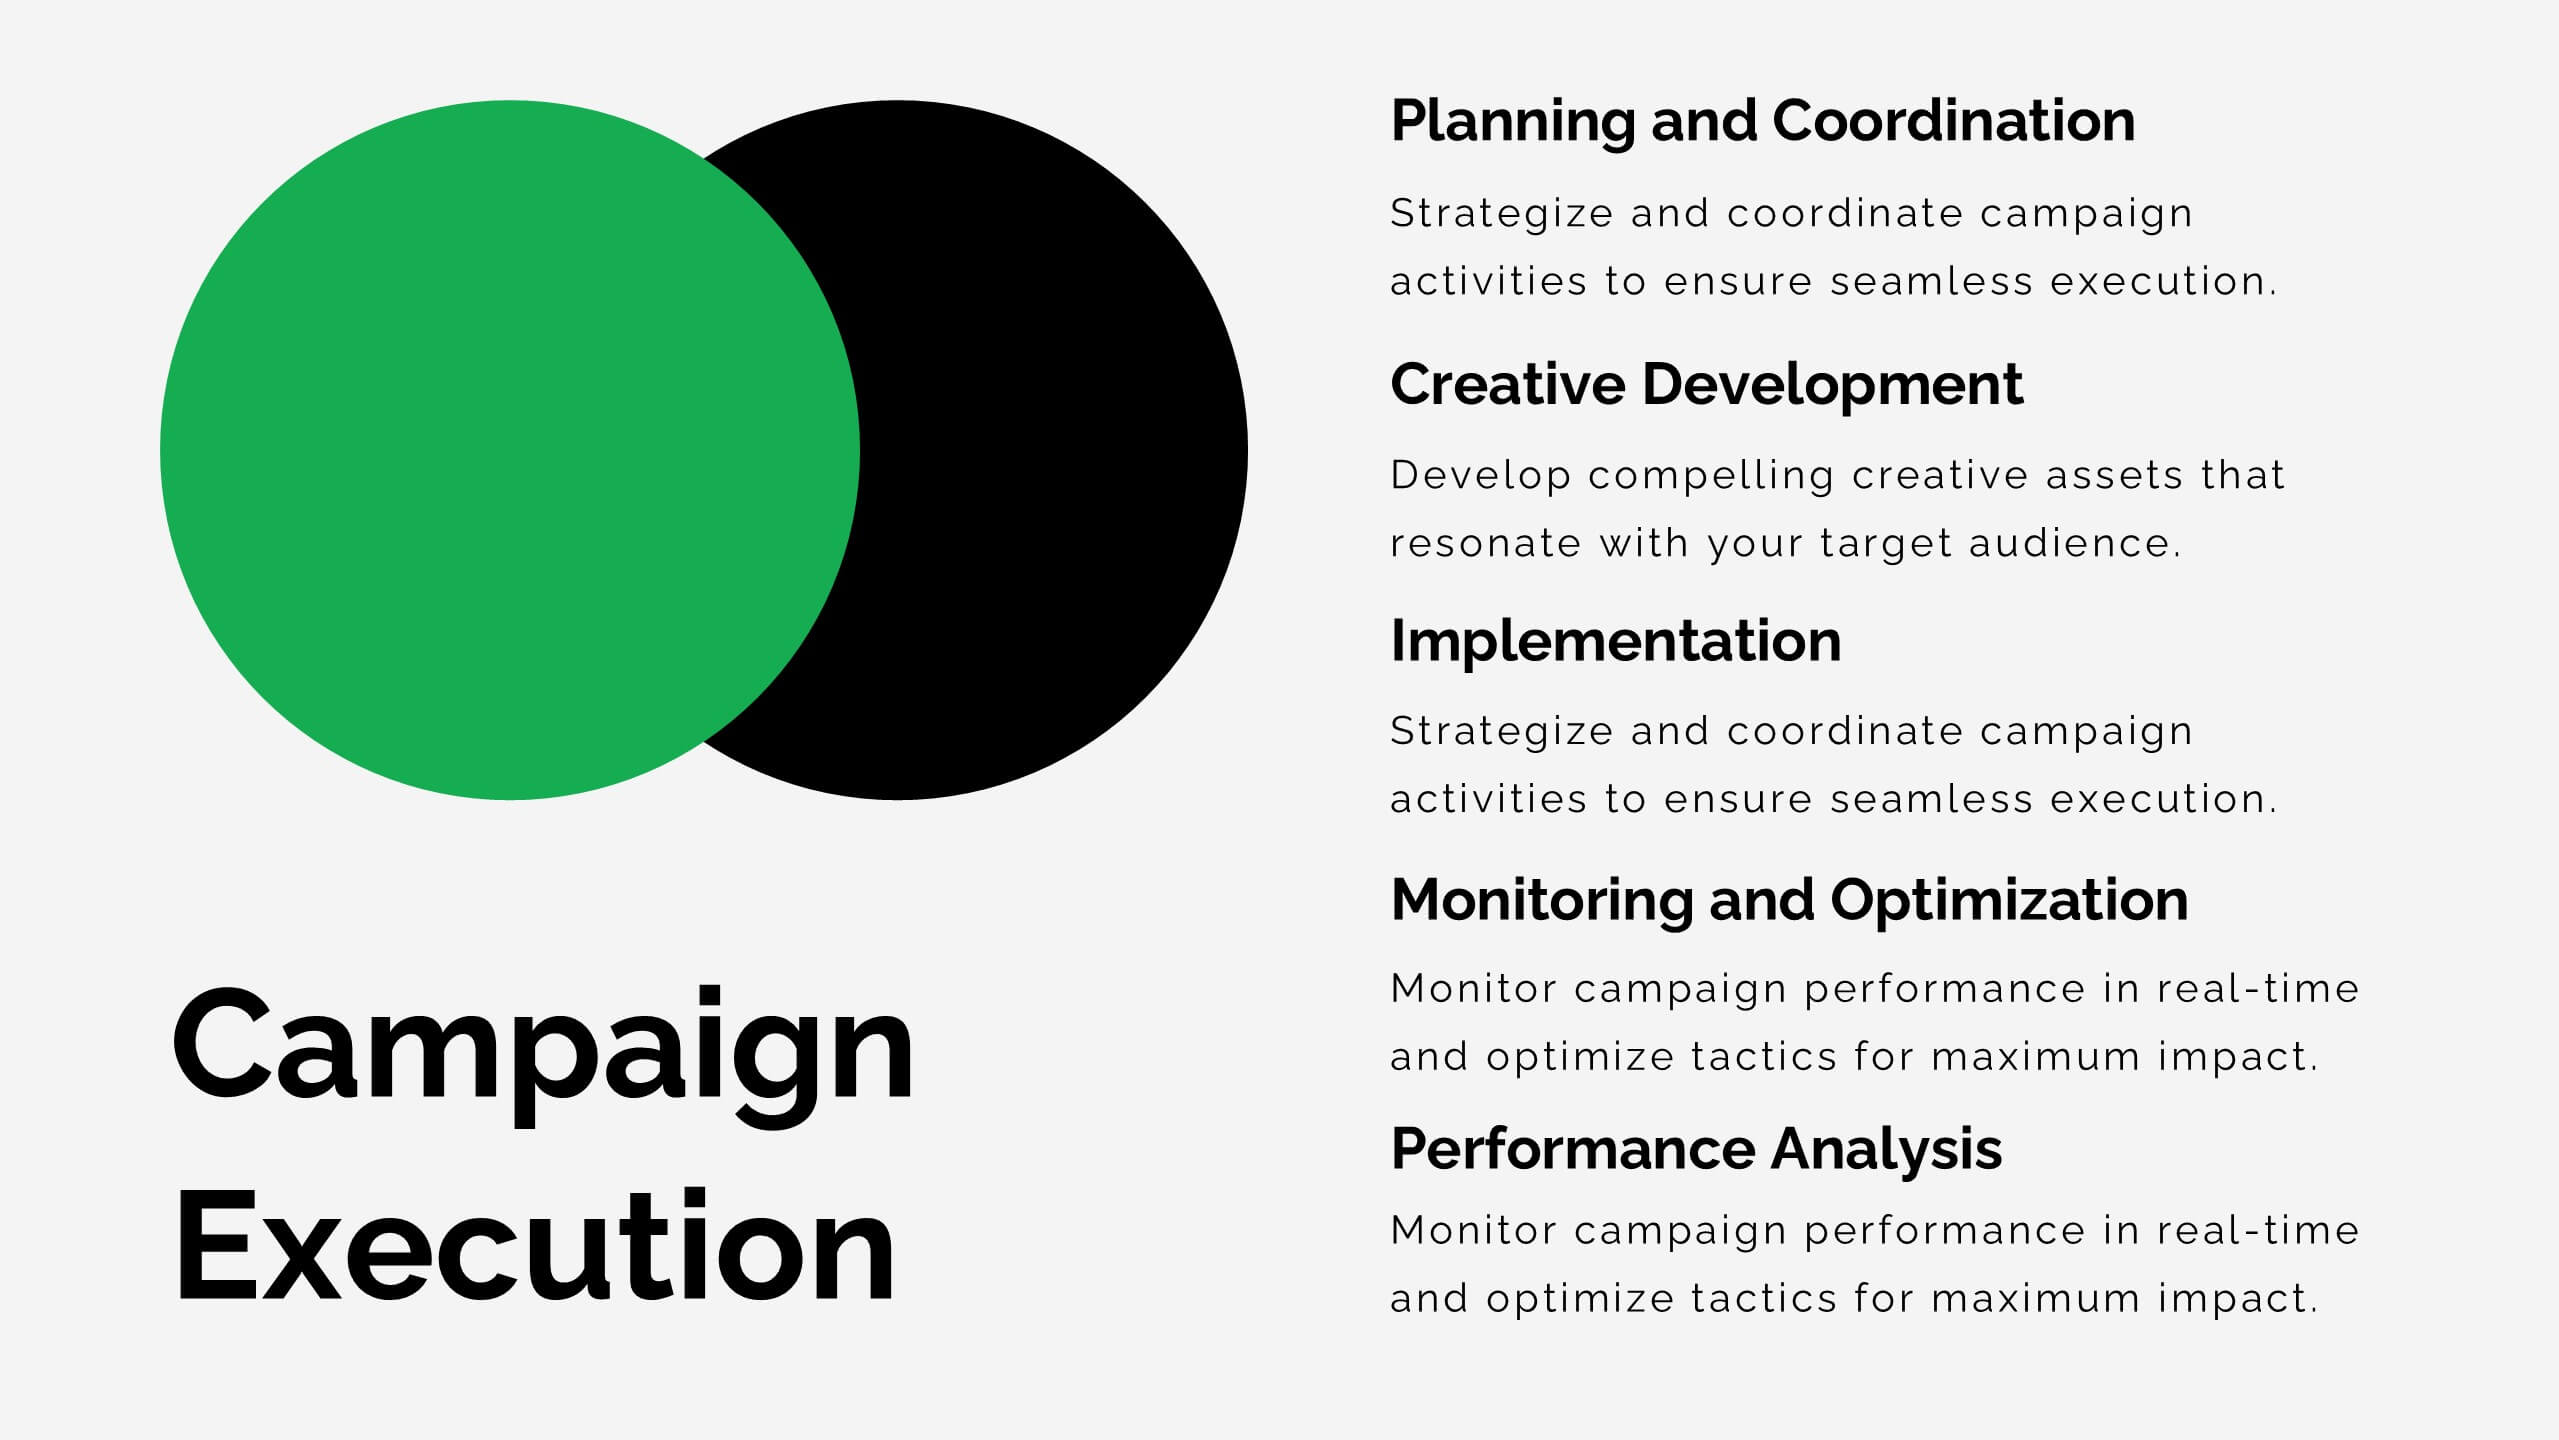
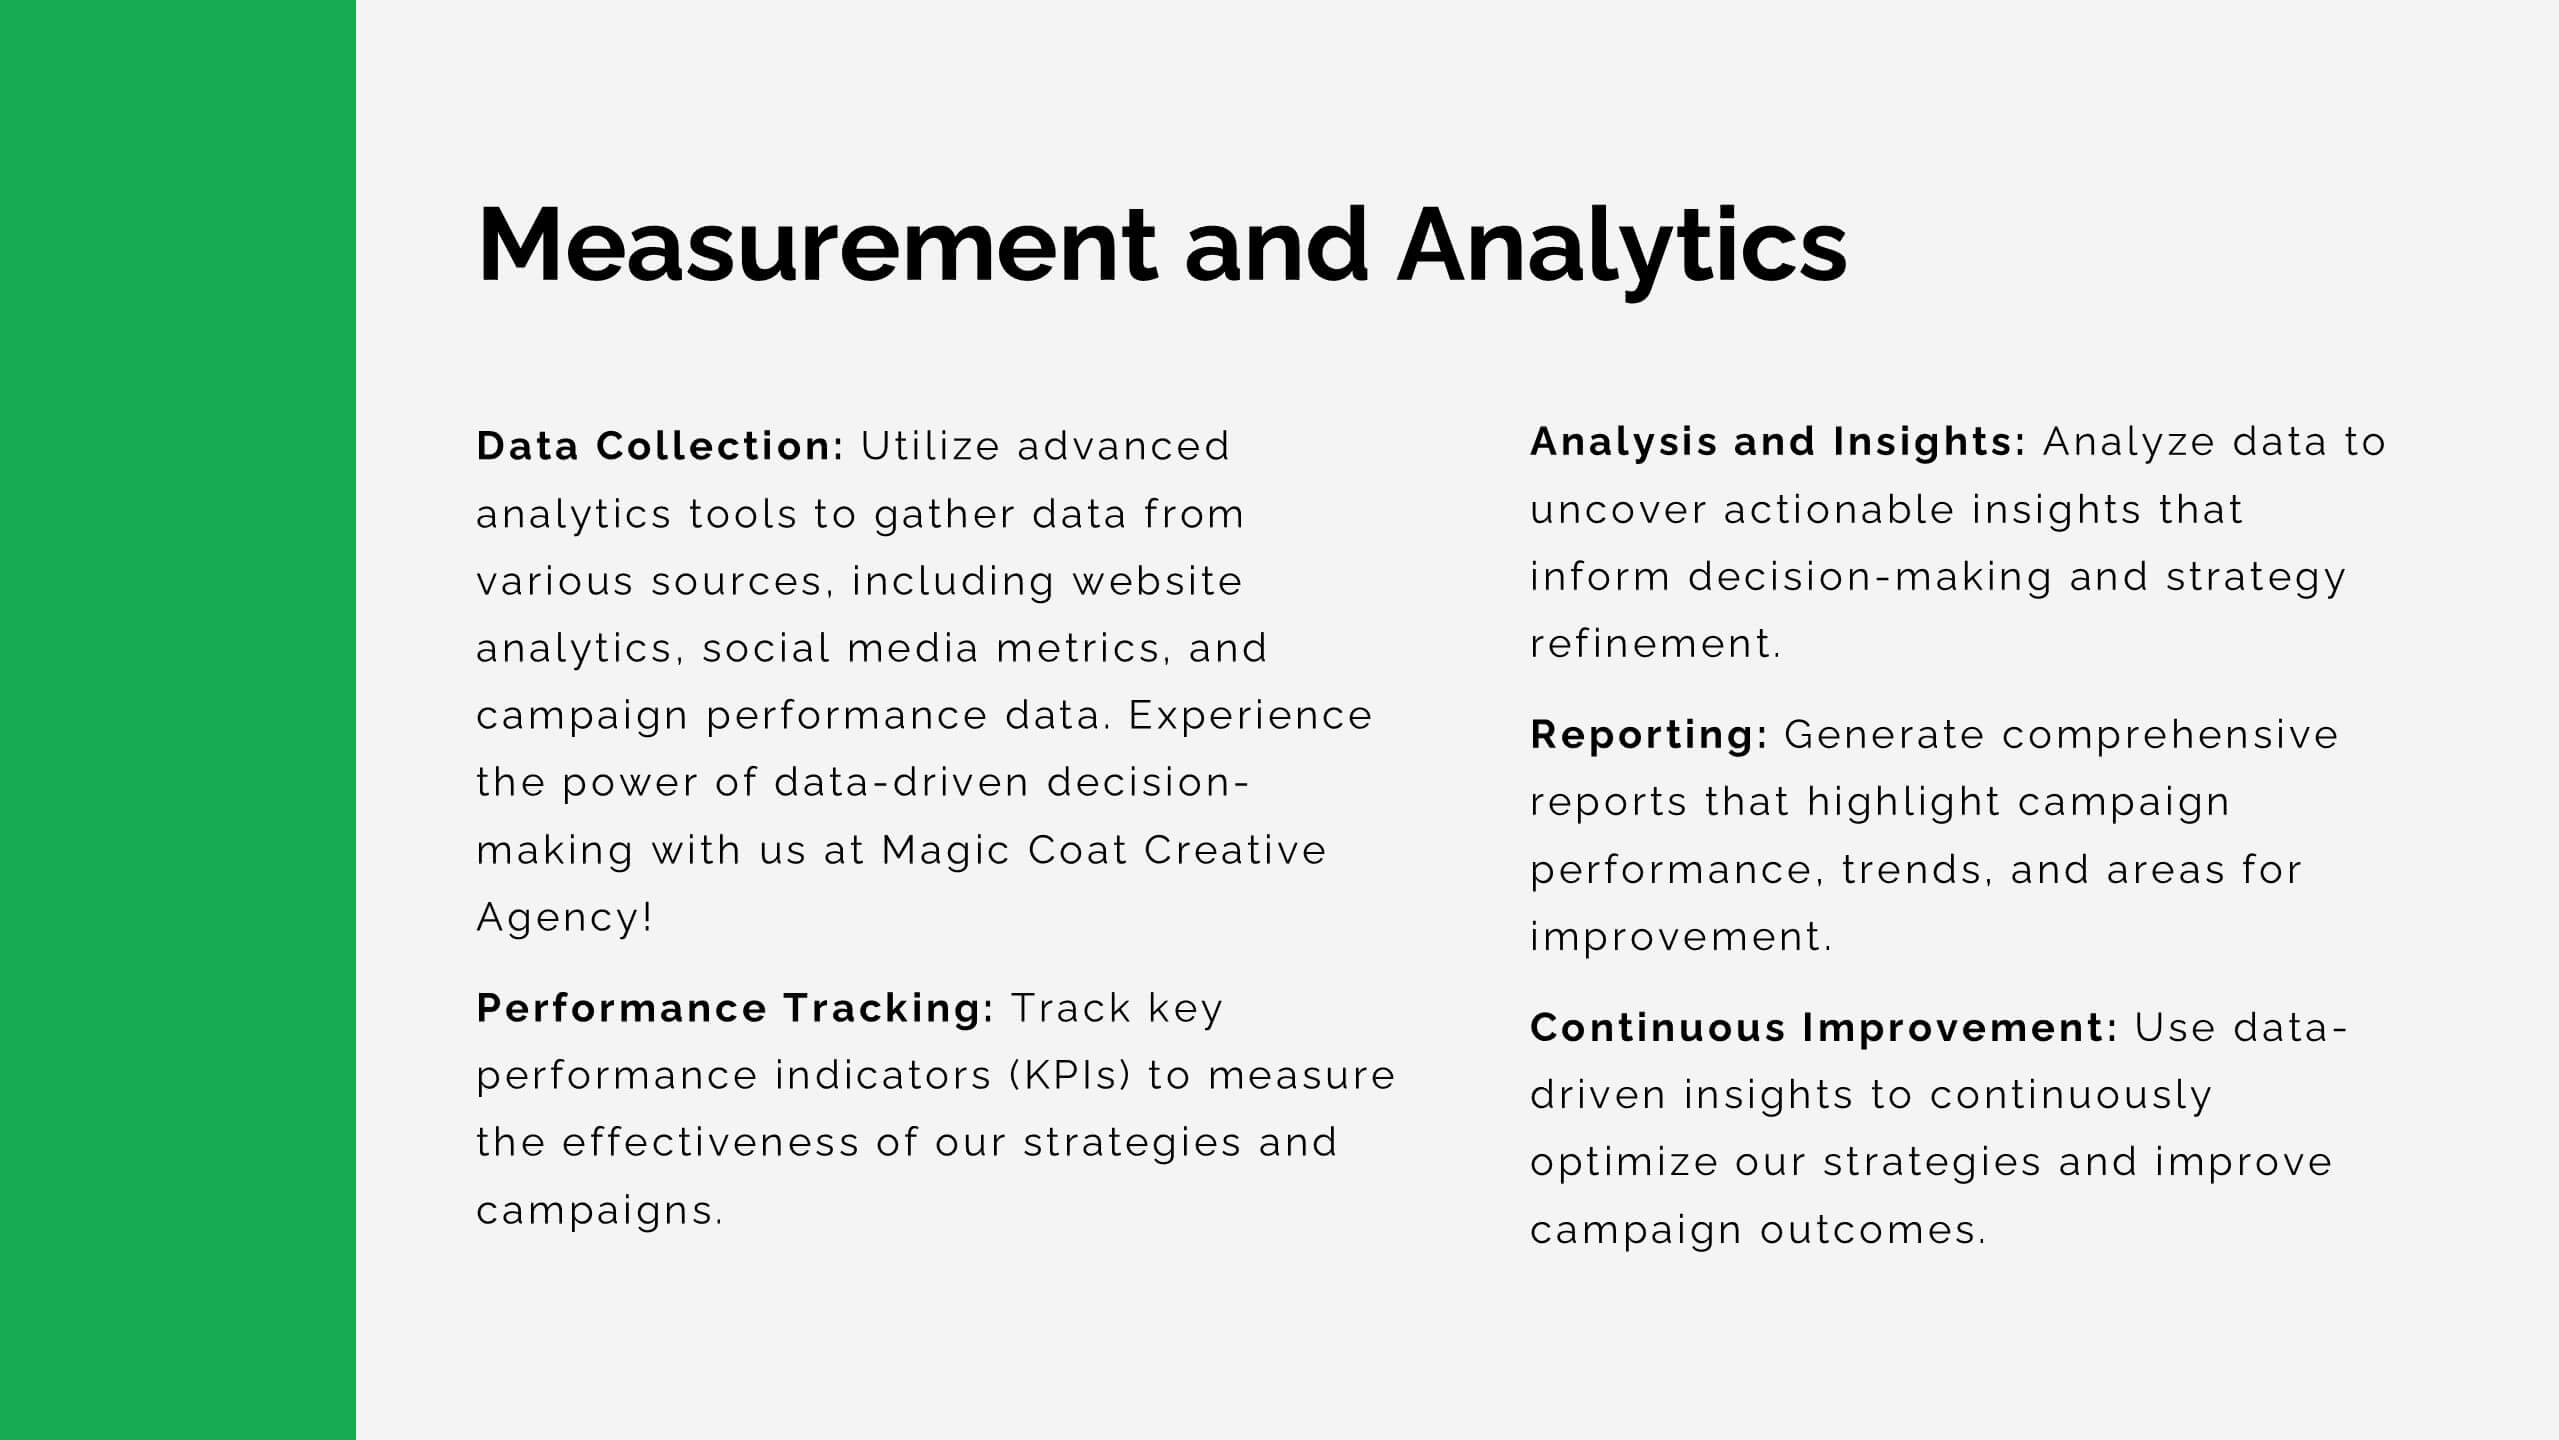
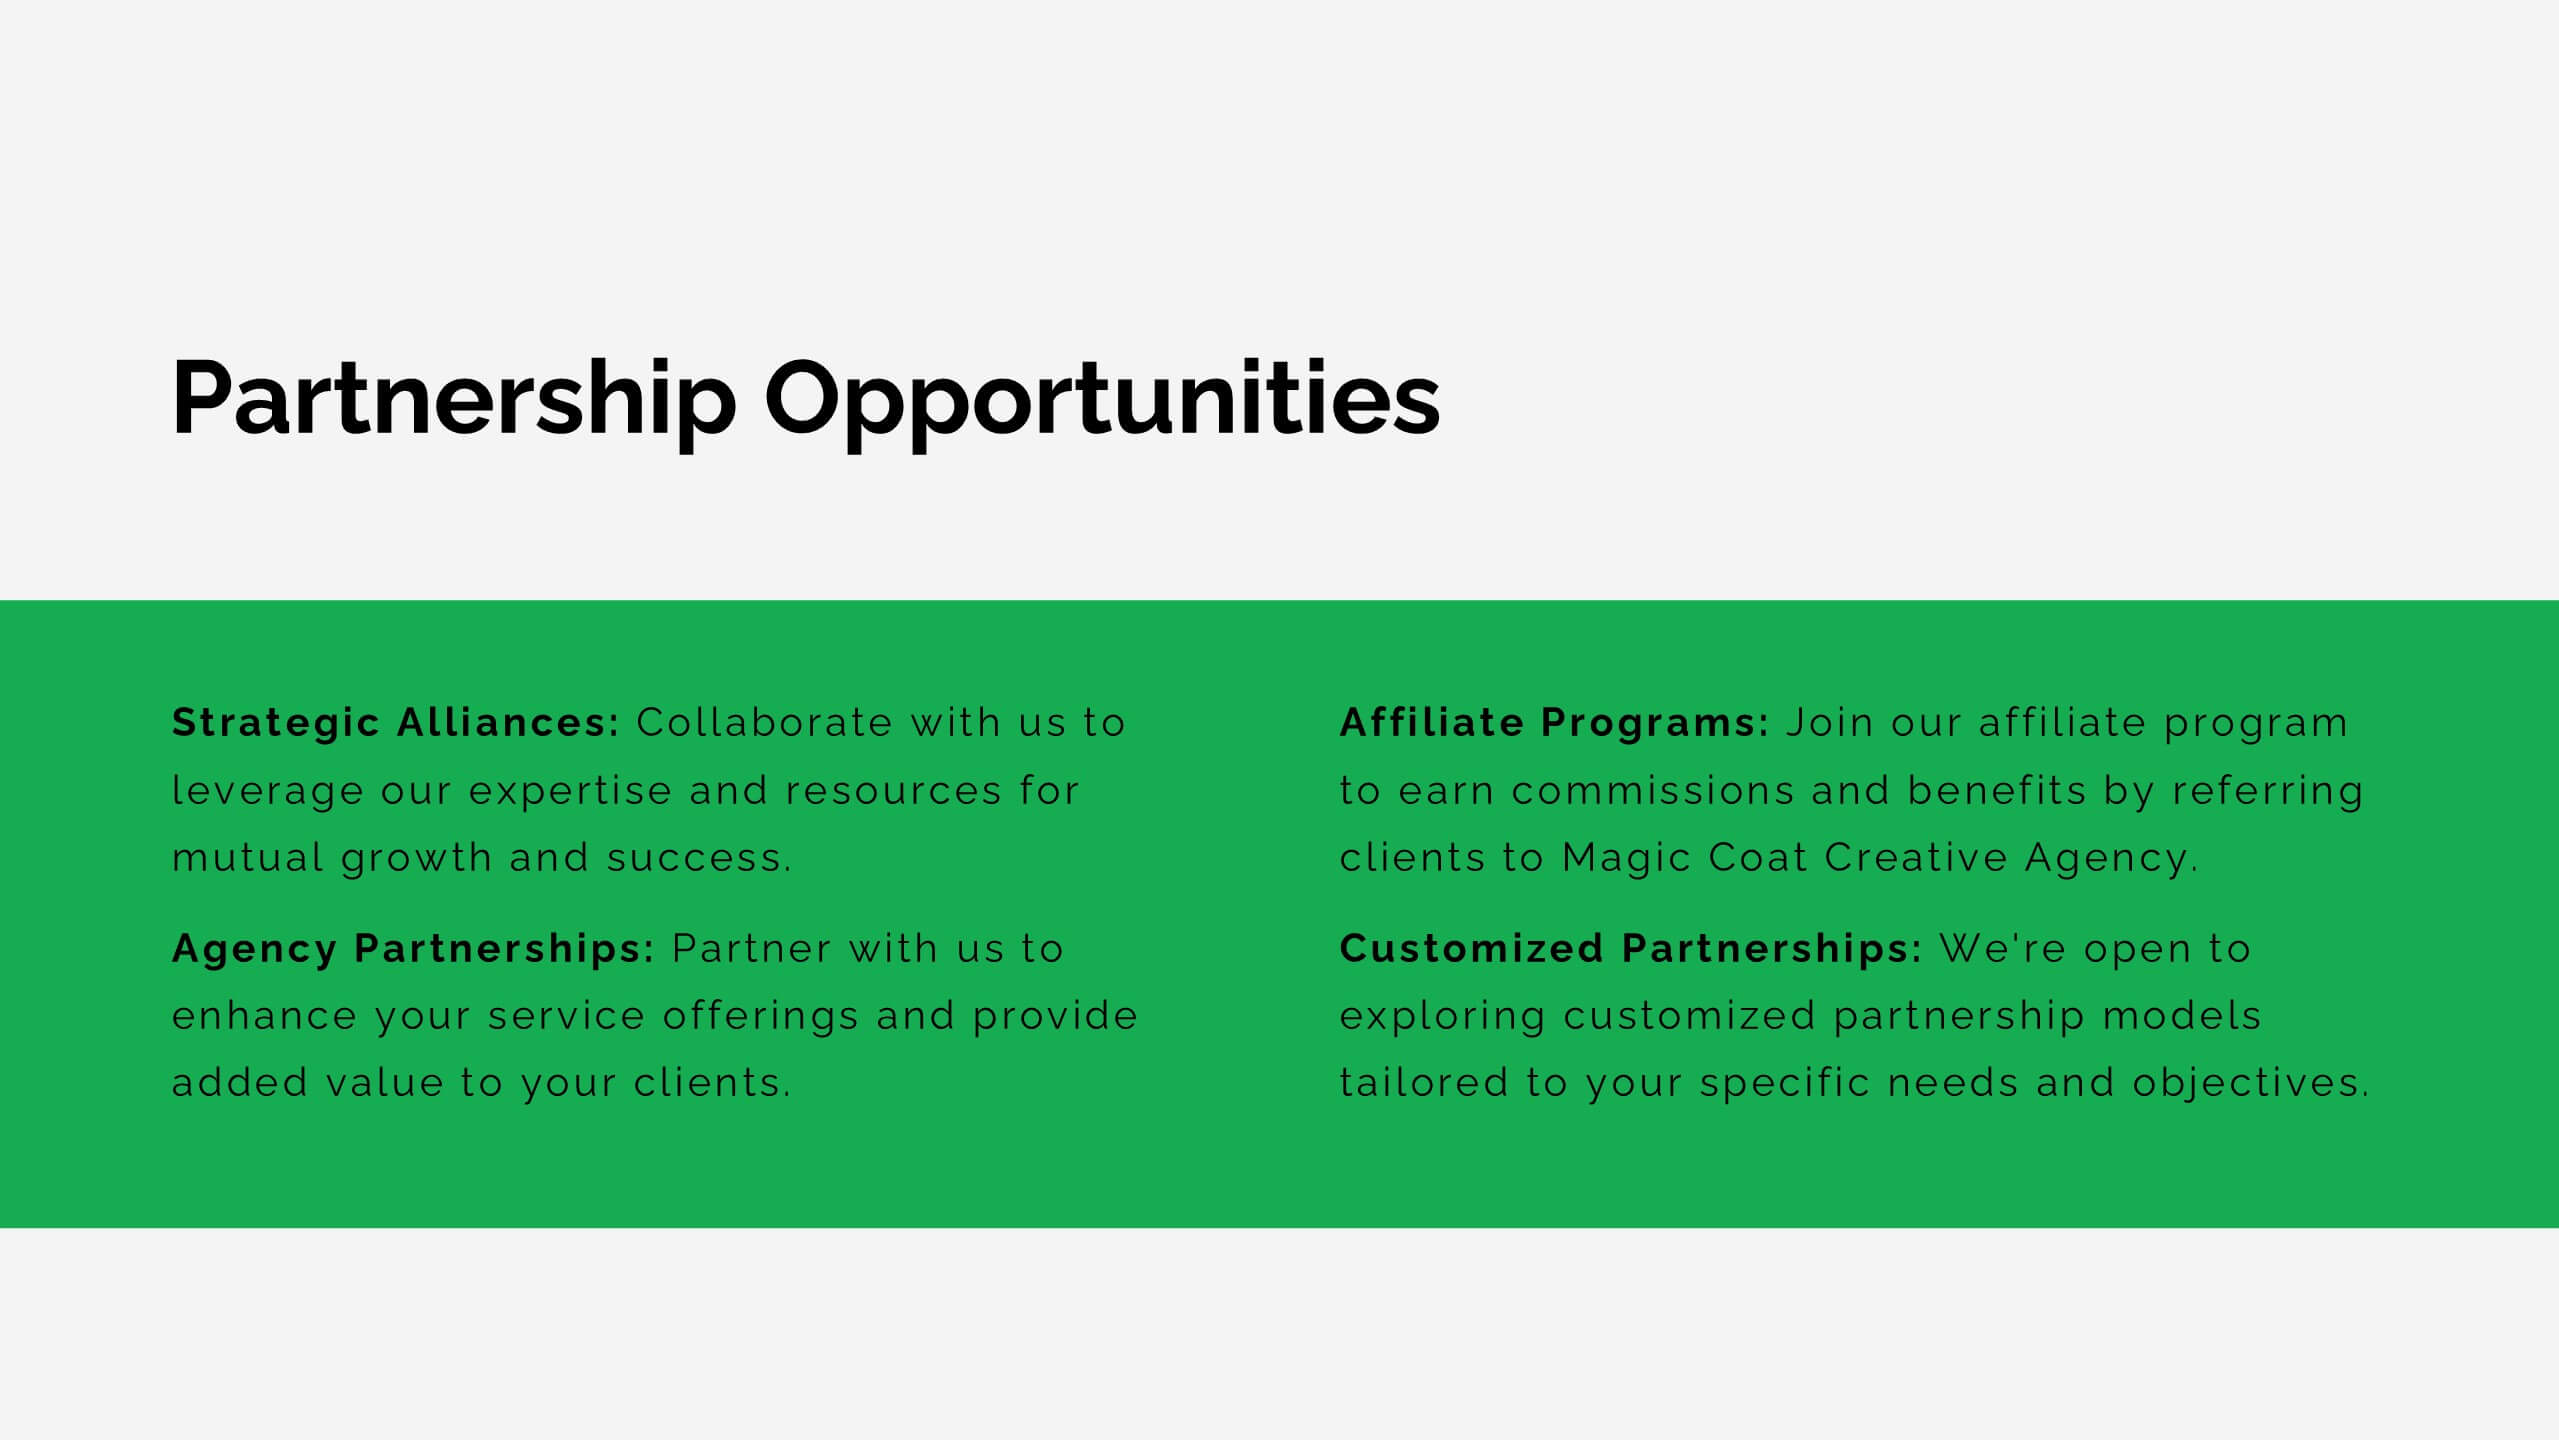
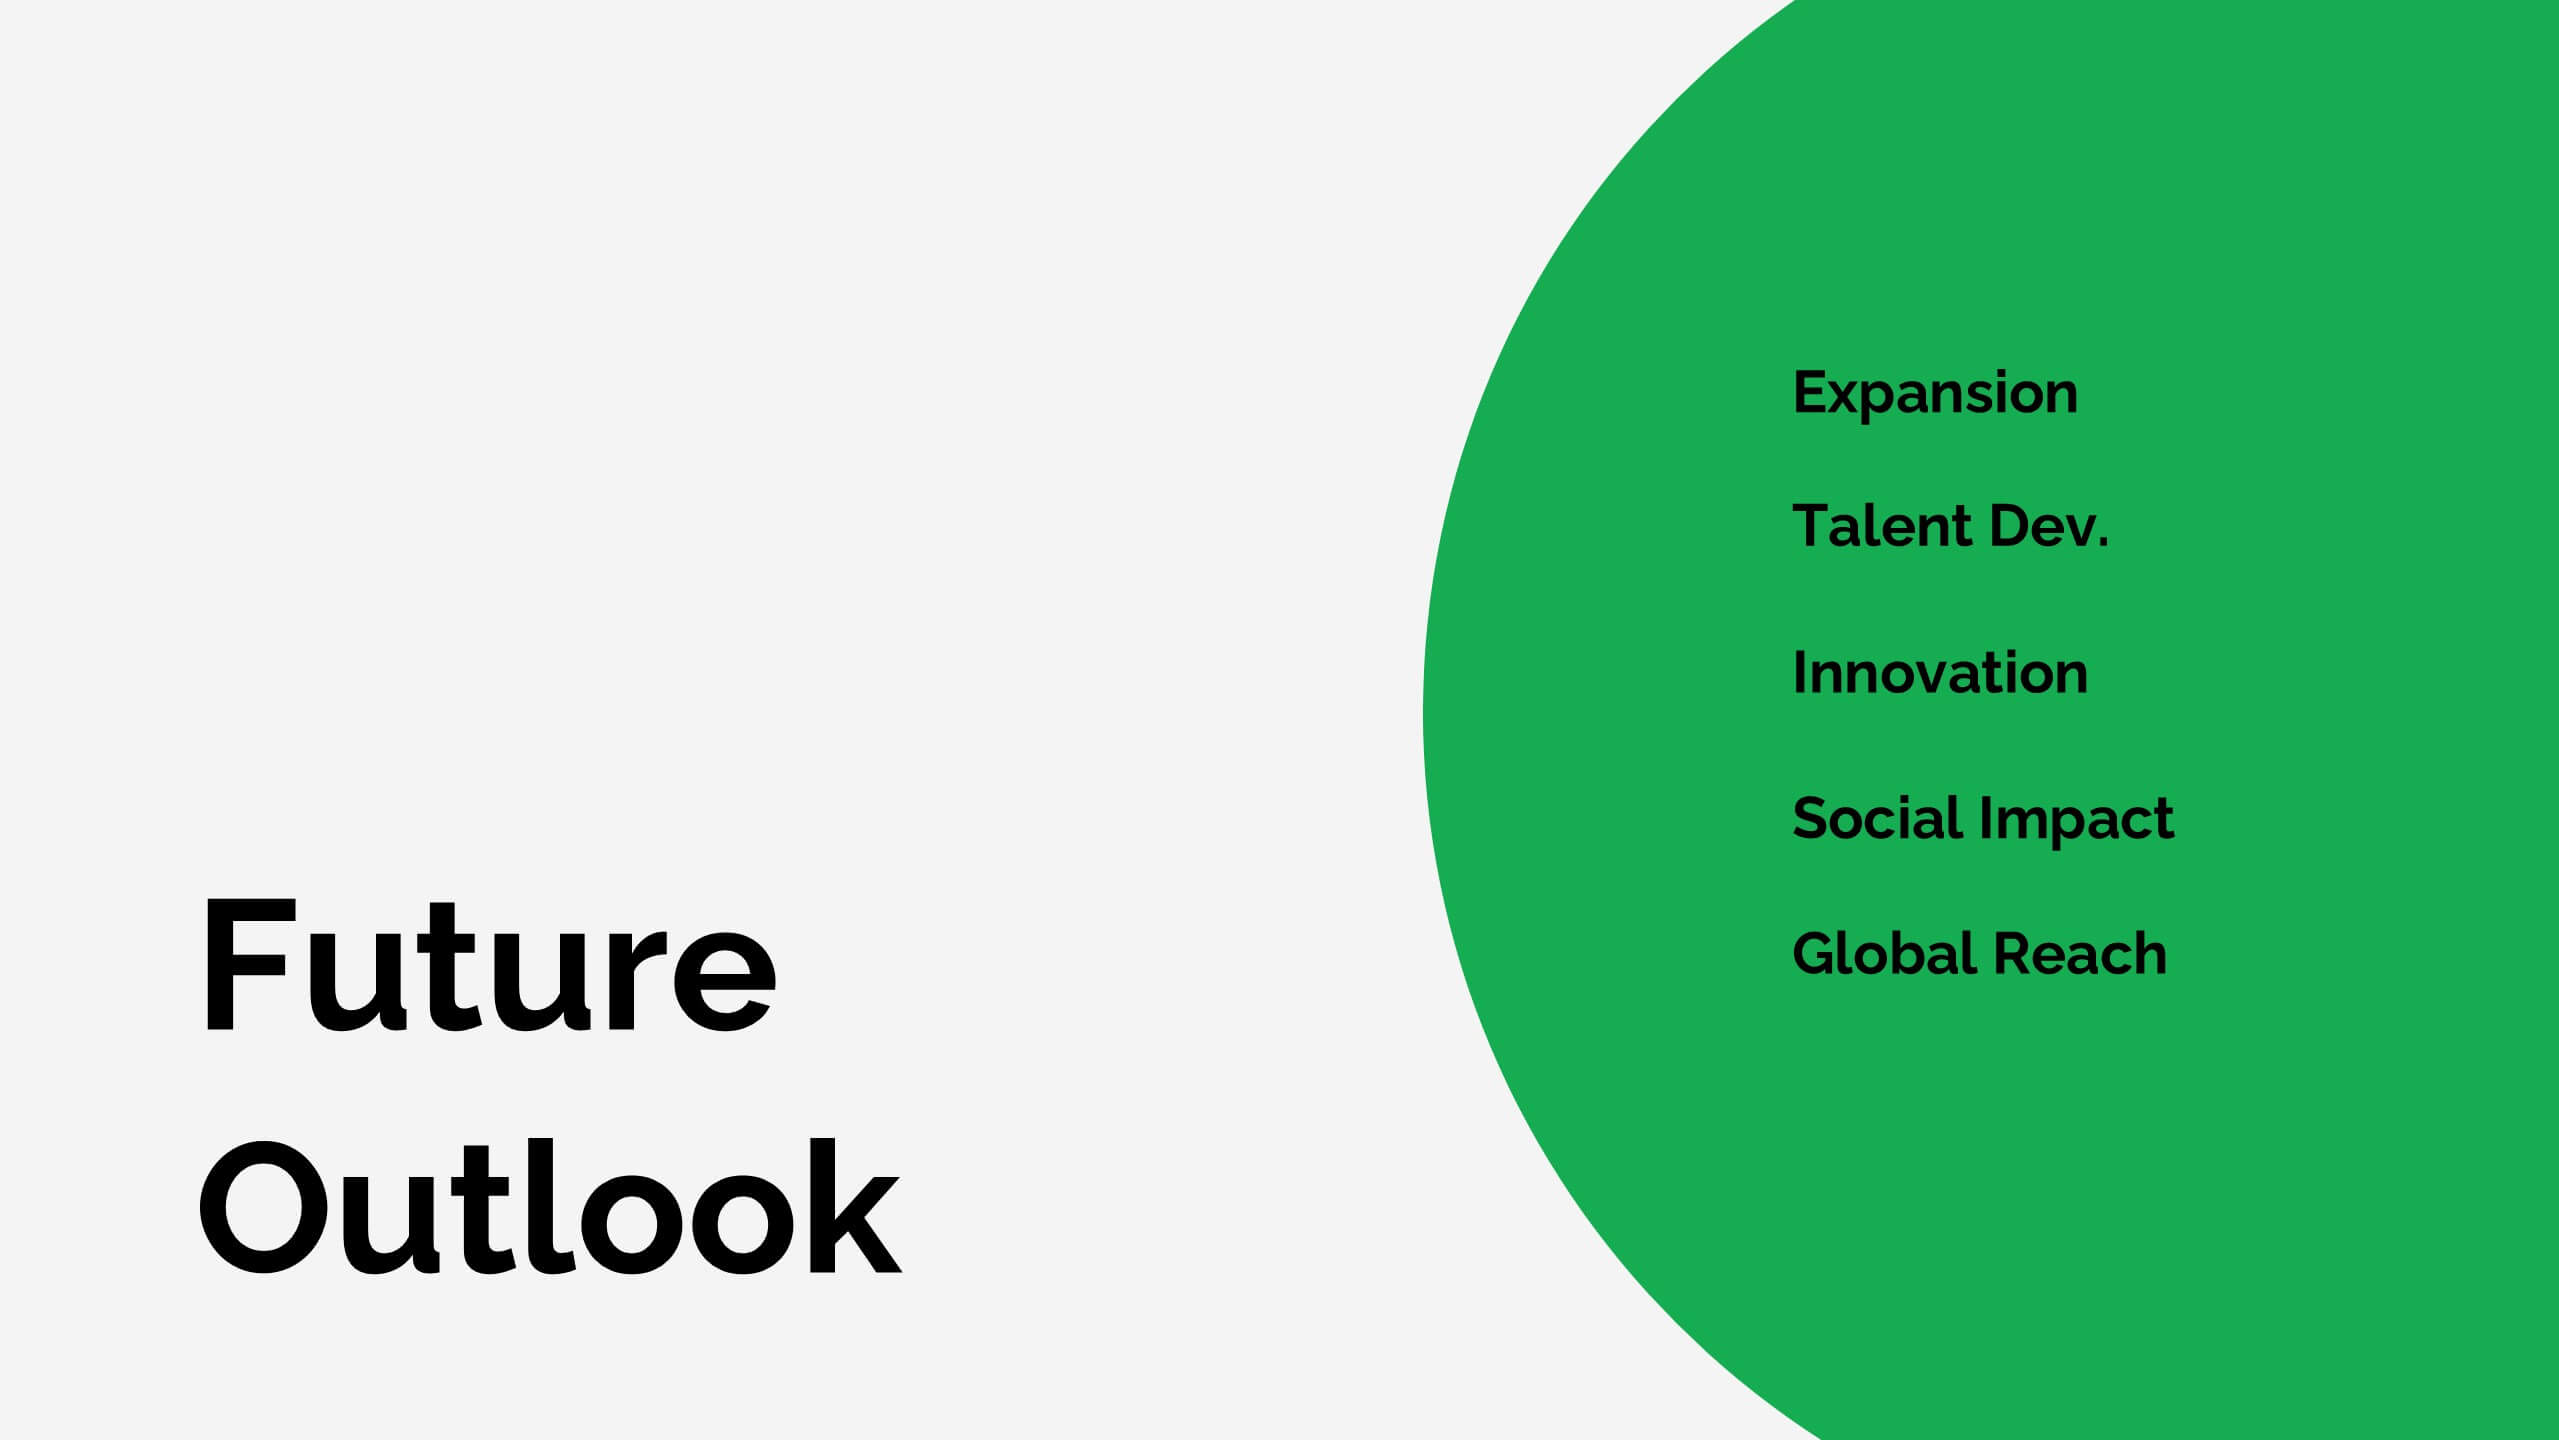
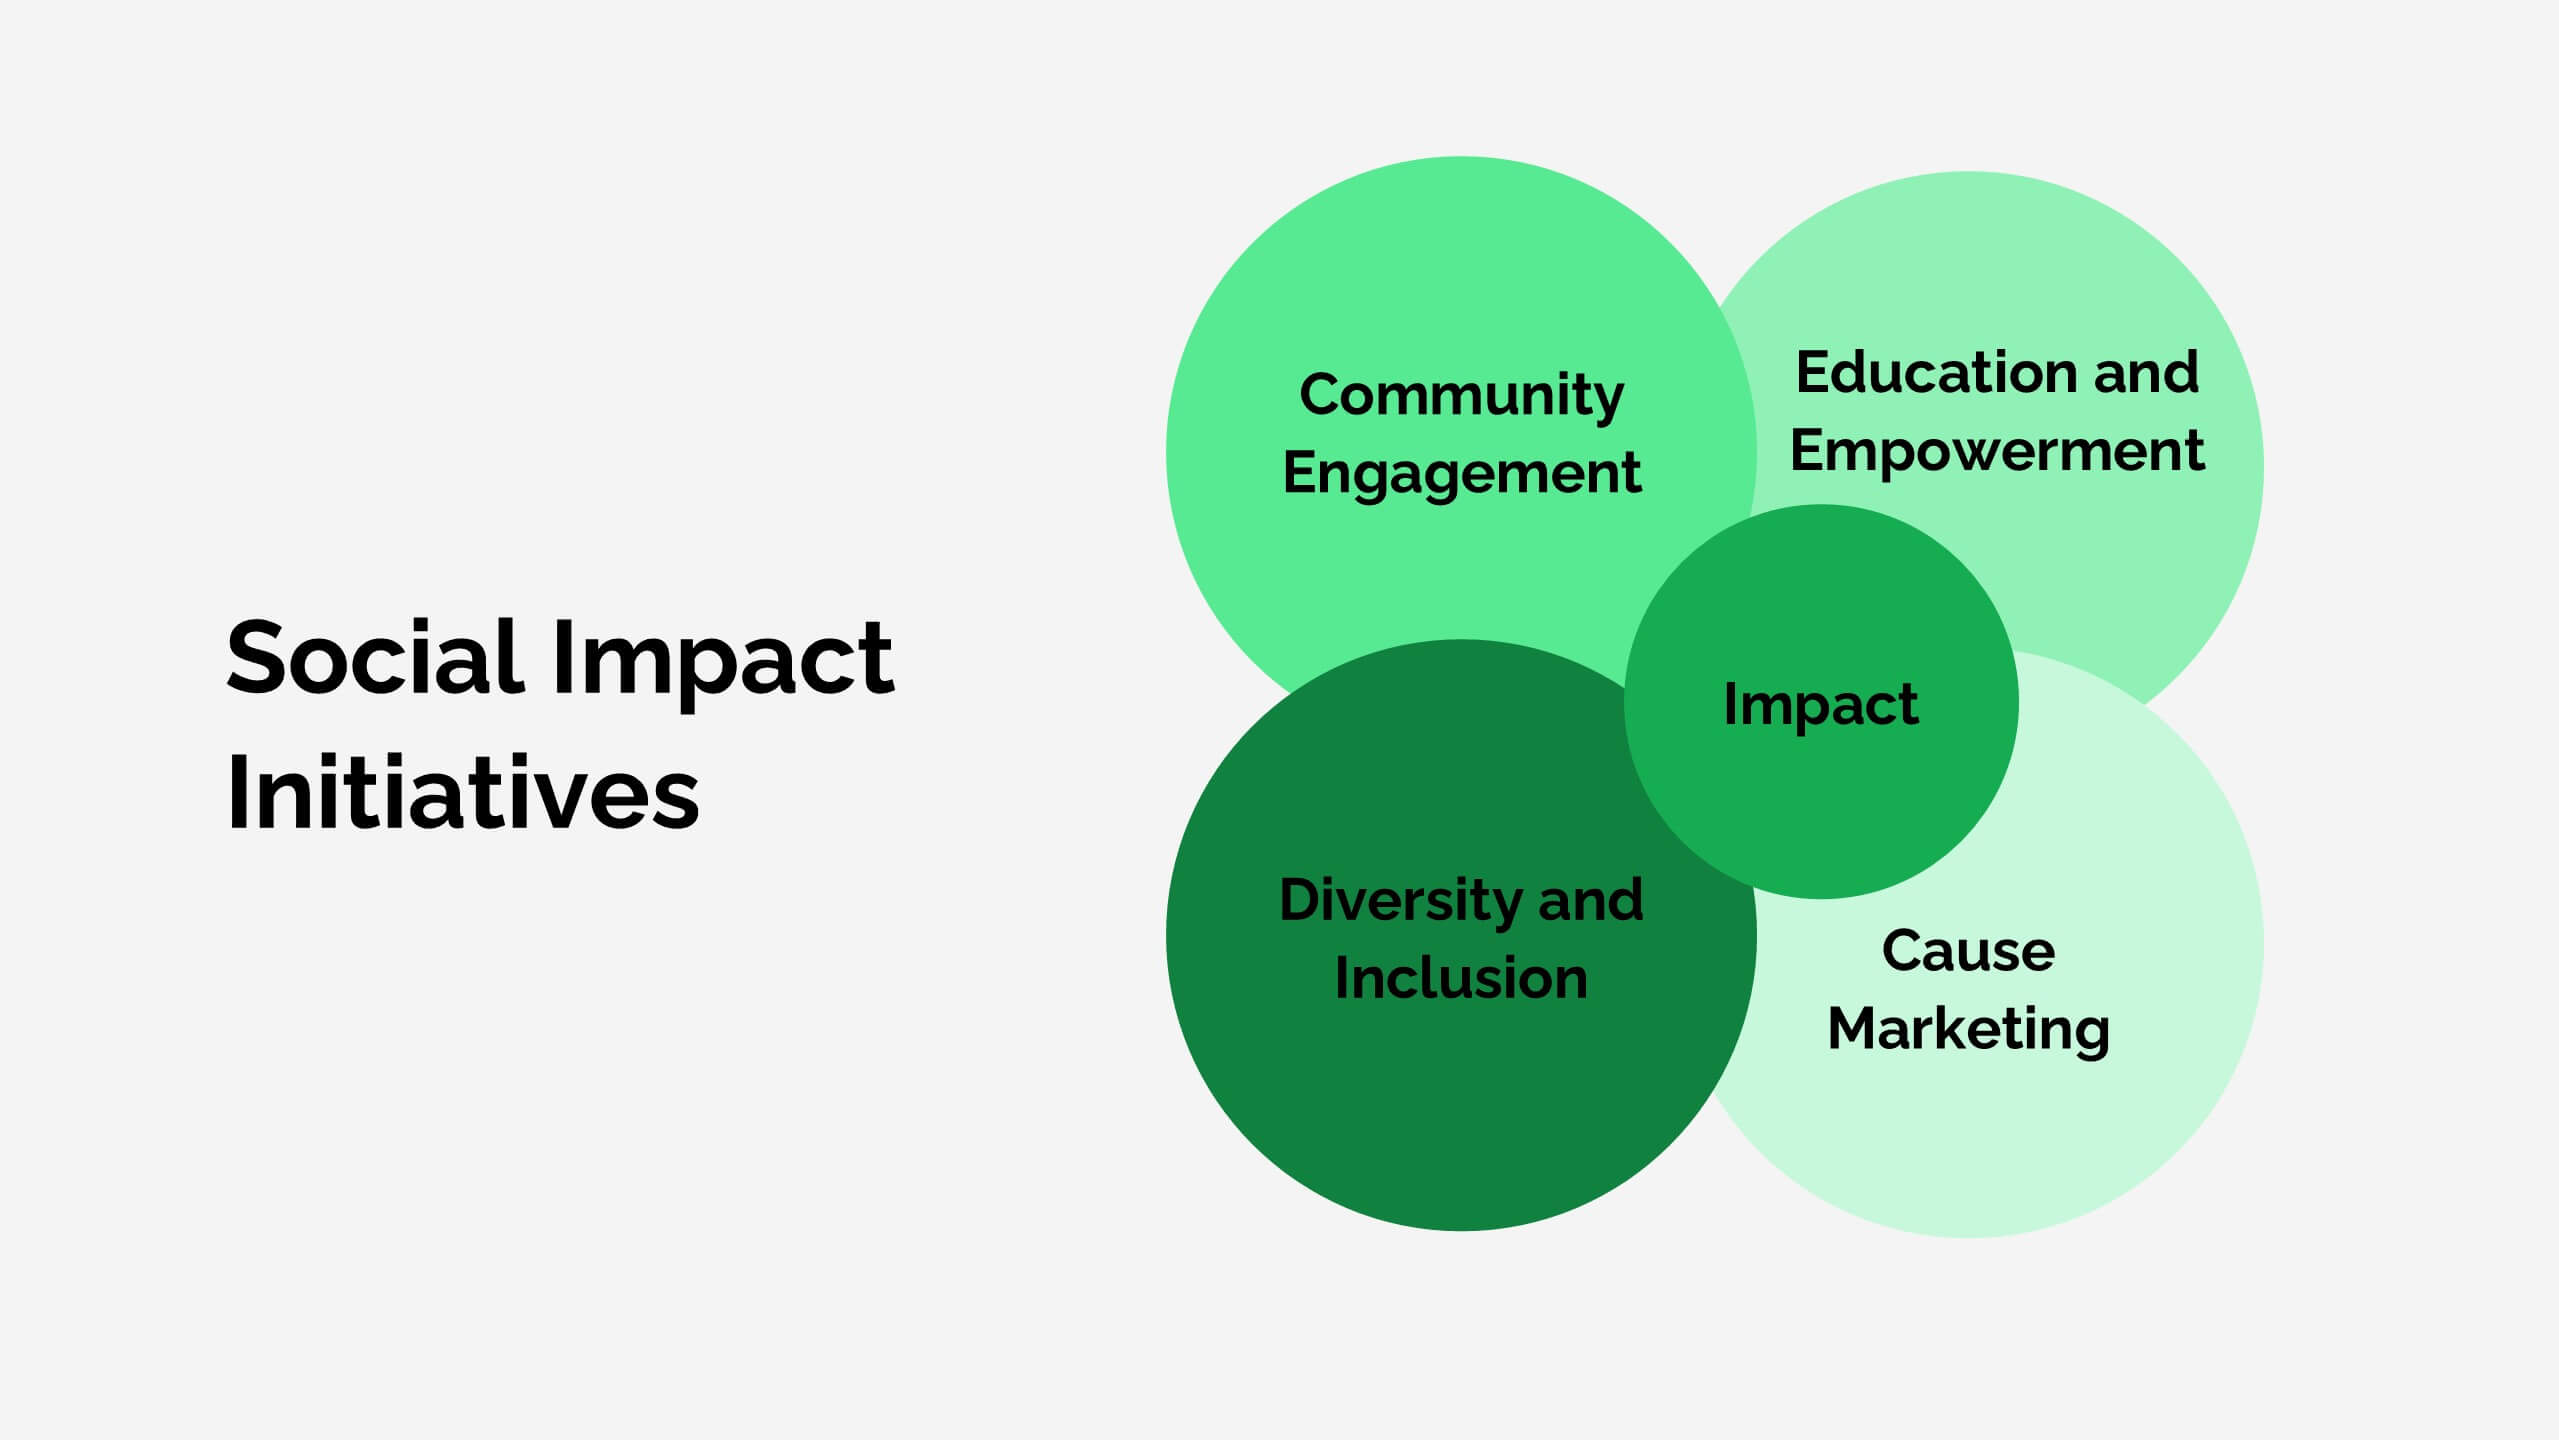
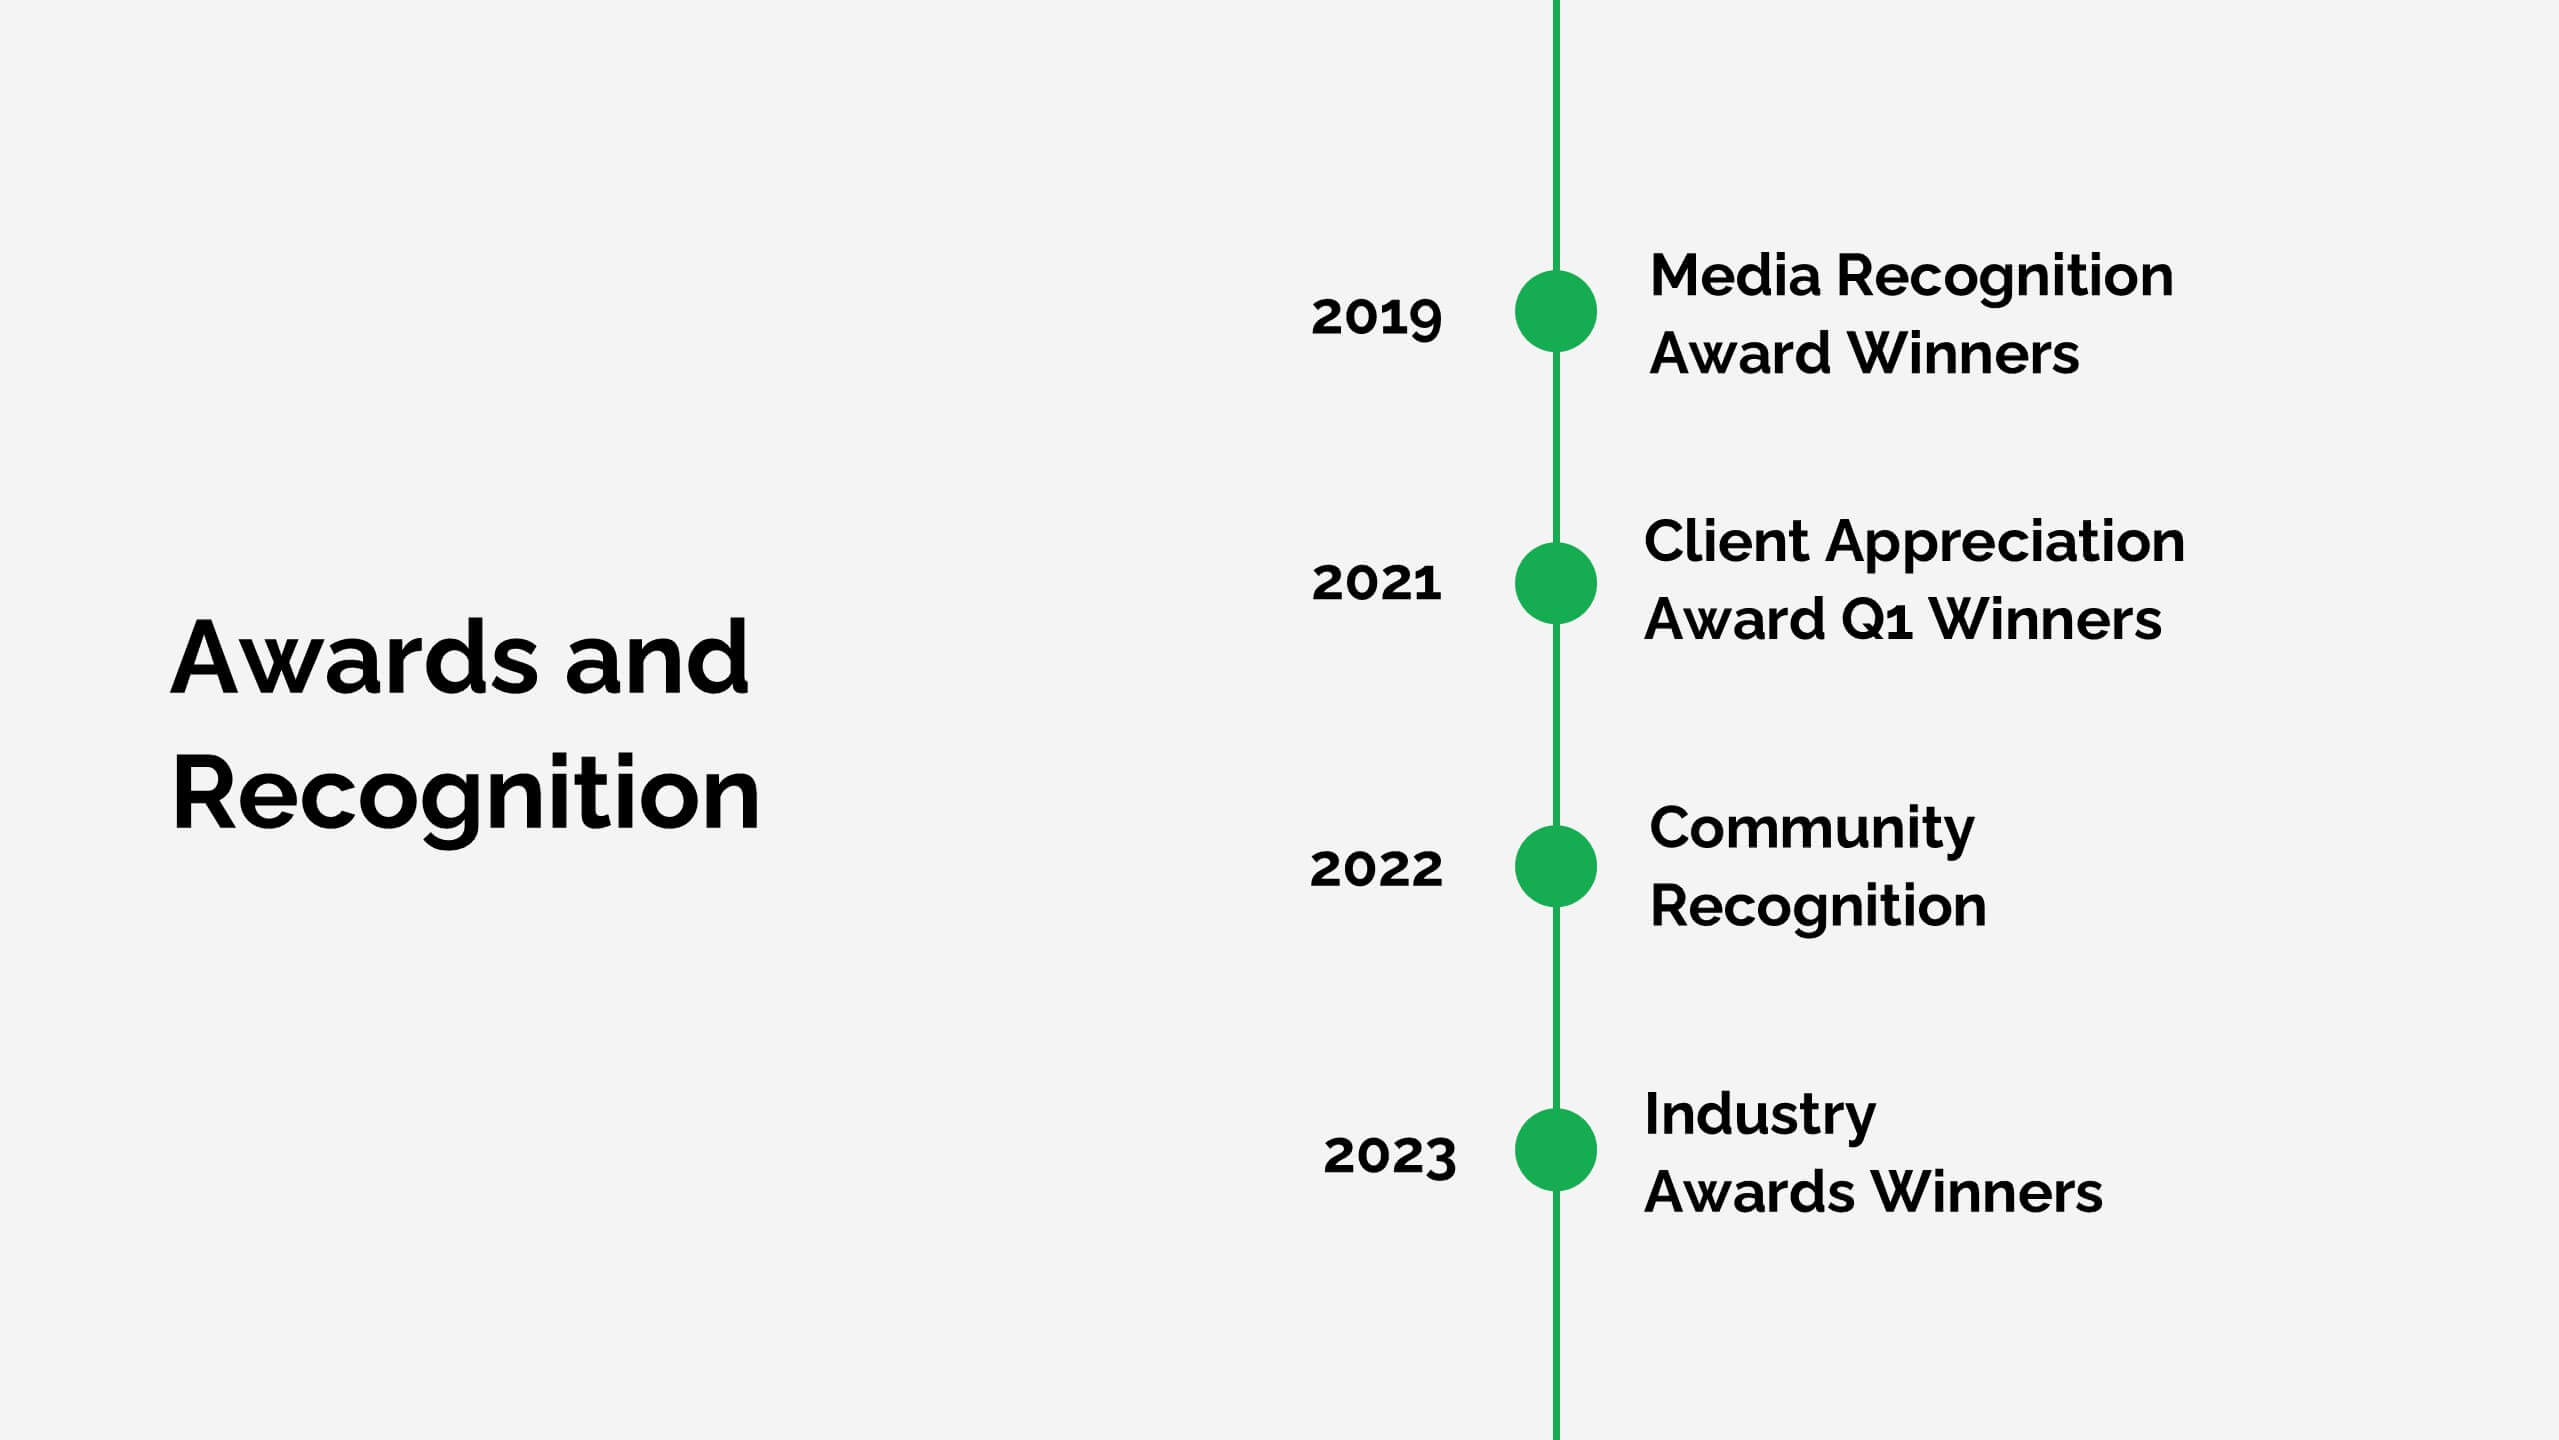
Lithium Advertising Agency Proposal Presentation
Elevate your advertising agency’s proposals with this sleek and modern template! It covers key areas like market analysis, case studies, client success stories, and campaign execution. Fully customizable, this template is perfect for presenting your agency’s services and strategies. Compatible with PowerPoint, Keynote, and Google Slides, it’s designed for impactful client presentations.


5 diapositivas
Business Insight Iceberg Presentation
Visualize surface-level data and deeper insights with the Business Insight Iceberg Presentation. Perfect for showcasing organizational structure, decision-making layers, or strategy breakdowns. Each editable layer helps communicate complexity clearly and effectively. Fully compatible with PowerPoint, Keynote, and Google Slides—ideal for professionals, analysts, and educators aiming for clarity and impact.

1 diapositiva
Success Roadmap and Personal Achievement Presentation
Visualize your path to success with the Success Roadmap and Personal Achievement Presentation. This stepwise layout guides your audience through key milestones, making it perfect for showcasing personal growth, career progression, or business achievements. Each step features a distinct icon and space for focused insights. Fully editable in Canva, PowerPoint, Keynote, and Google Slides.
4 diapositivas
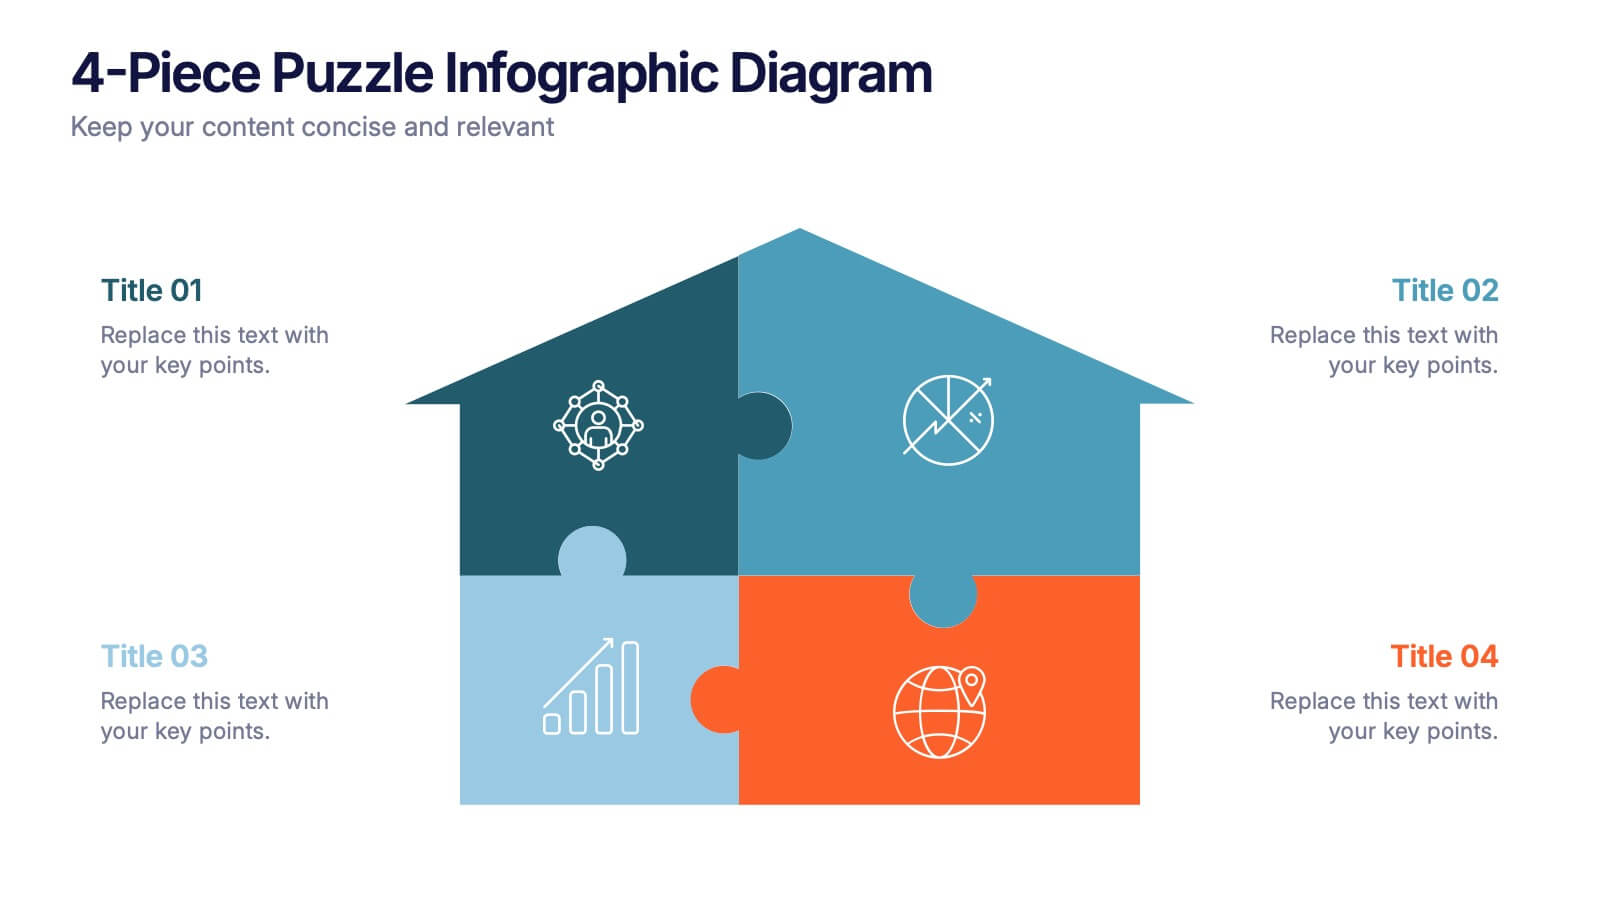
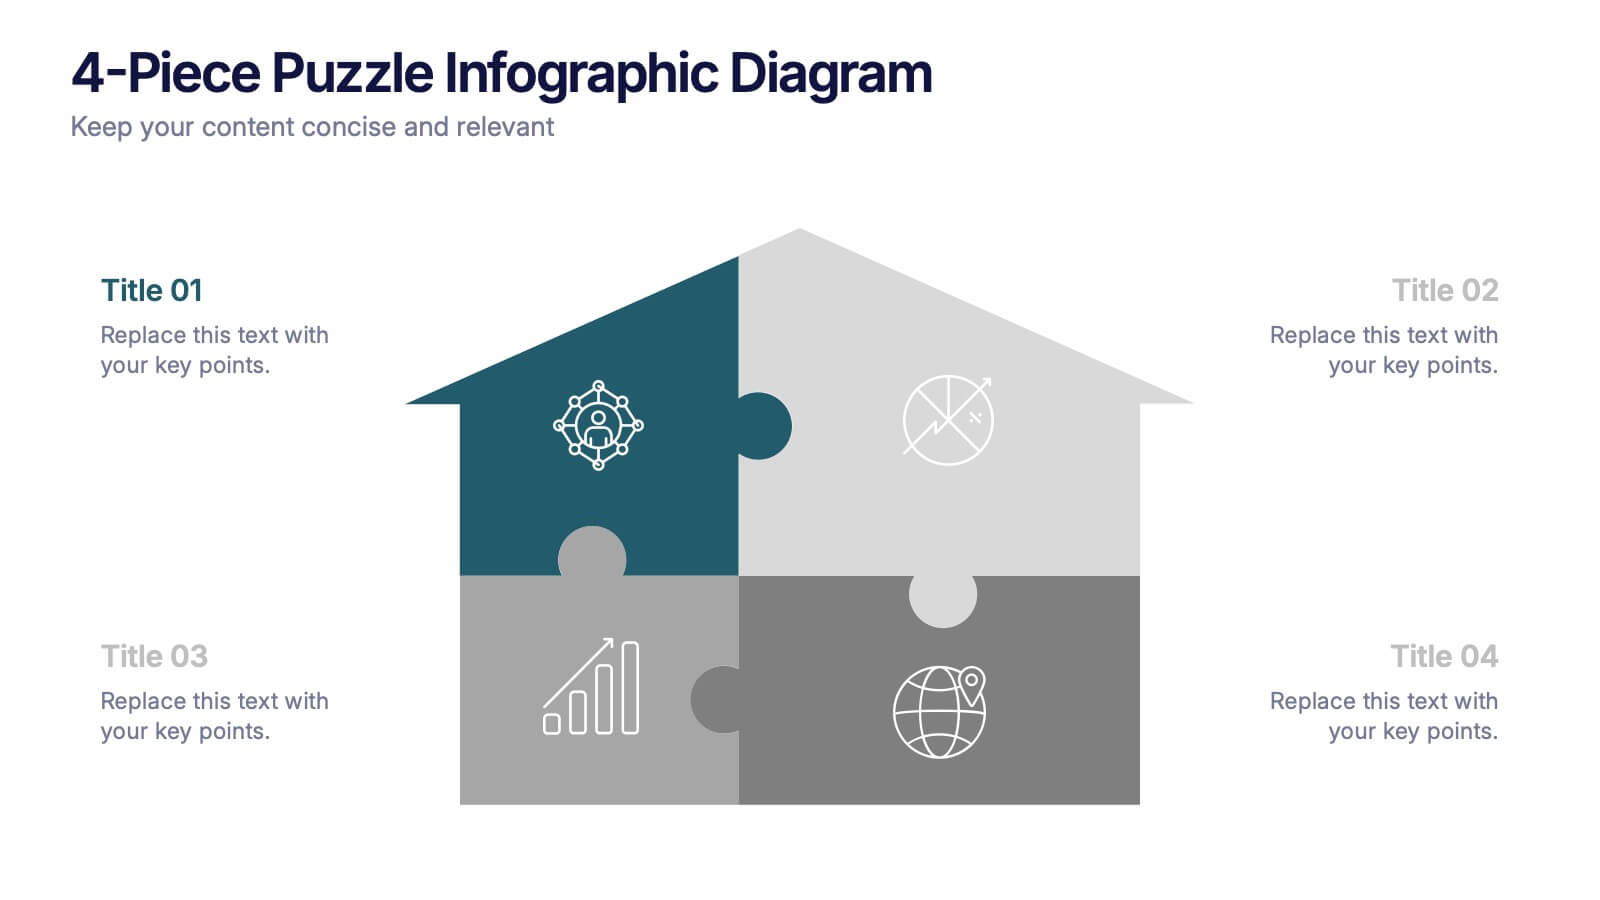
4-Piece Puzzle Infographic Diagram Presentation
Bring clarity and impact to your message with a visual layout that snaps big ideas together like a puzzle. This presentation helps you break complex concepts into four connected sections, making explanations easier and more engaging for any audience. Ideal for planning, insights, or strategy sessions. Fully compatible with PowerPoint, Keynote, and Google Slides.


7 diapositivas
Construction Gantt Chart Infographic
A Gantt chart is a project management tool that shows the timeline and dependencies of your tasks. This infographic is a visual representation of the Gantt chart, and it will help you understand this important project management tool. This template is designed to help you plan and manage your tasks in a fun and engaging way. It's a great way to get the entire team on board with the project, and it's also a great way to make sure everyone is on track and hitting their goals. The chart is a great way to see at a glance what tasks need to happen, when they need to happen, and how long each task will take.


5 diapositivas
Competitor Features Comparison Matrix Presentation
Clearly highlight competitive advantages with the Competitor Features Comparison Matrix Presentation. This sleek, easy-to-read slide lets you compare product features or service offerings across up to four competitors. Use checkmarks and icons to visually emphasize strengths and gaps. Fully editable in Canva, PowerPoint, and Google Slides—perfect for strategy, sales, or pitch decks.


6 diapositivas
High-Performance Team Building Presentation
Boost team efficiency with the High-Performance Team Building presentation template. Designed to visualize team development stages, leadership strategies, and collaboration efforts, this template is perfect for managers, HR teams, and trainers. The pyramid and rocket-themed design illustrates goal progression, making it easy to track growth. Fully customizable and compatible with PowerPoint, Keynote, and Google Slides.


23 diapositivas
Fama Business Idea Pitch Deck Presentation
Present your business idea with this impactful pitch deck, covering key areas like problem statement, solutions, competitive landscape, financials, and growth projections. With a bold design, it effectively showcases your startup’s value proposition. Compatible with PowerPoint, Keynote, and Google Slides for dynamic and professional investor presentations.


7 diapositivas
Flow Chart Infographic Presentation Template
A Flow Chart Infographic uses shapes and lines to show the flow of information, steps in a process, or the relationship between different ideas. Flow Charts are often used in business, education, and technology to show the steps in a process, decision-making flow, or to illustrate the relationship between different pieces of information. This template is perfect for showing how things work or how to do something step by step. This flowchart infographic includes a variety of different charts and description boxes that you can customize with your information to make it work for you.


7 diapositivas
Finance Dashboard Infographic
A finance dashboard is a visual representation of financial data and key performance indicators (KPIs) that provides an overview of an organization's financial health and performance. This infographic template is a tool that allows users to monitor and analyze financial data in a clear and concise manner. This offers a comprehensive overview of financial performance, budgeting, and forecasting for individuals or businesses. The template features a clean and modern design with a professional color scheme, easy-to-read fonts, and intuitive layout. The visuals are thoughtfully organized to convey financial information effectively and engage the audience.