


Características


¿Tienes alguna pregunta?
Recomendar


5 diapositivas
SWOT Analysis Infographics
SWOT analysis is a strategic planning tool used to assess the strengths, weaknesses, opportunities, and threats of an individual, organization, or project. These infographics are powerful visual tools that allow you to present comprehensive SWOT analysis in a clear and impactful way. Whether preparing a business presentation, strategic planning session, or educational material, this template provides a visually engaging format to showcase the key aspects of a SWOT analysis. The customizable features of the template allow you to tailor it to your specific industry ensuring that your SWOT analysis is presented in a concise, and impactful manner.


6 diapositivas
Market Growth Strategy with Asia Map Presentation
Visualize strategic growth across Asian markets with this map-based presentation. Highlight regions by opportunity level, compare metrics with vertical bar charts, and display yearly projections. Ideal for business development, expansion plans, or market analysis. Fully editable in PowerPoint, Keynote, and Google Slides for tailored, data-driven presentations.


4 diapositivas
AIDA Steps in Consumer Behavior
Showcase the psychology of purchase decisions with the AIDA Steps in Consumer Behavior Presentation. This sleek, modern template visually maps out the Attention, Interest, Desire, and Action stages using intuitive shapes and icons. Ideal for marketers, educators, and sales teams looking to explain buying behavior clearly. Compatible with PowerPoint, Keynote, and Google Slides.


6 diapositivas
Team Work Environment Infographic
A team work environment refers to the conditions and culture within a group of individuals who come together to work collaboratively on a common goal or project. This infographic template highlights the importance of teamwork and fosters a positive team-oriented workplace culture. The design emphasizes the key elements and benefits of a collaborative work environment, encouraging employees to work together effectively and efficiently. This infographic features illustrations that depict employees working together, collaborating, and supporting one another. This reinforces the idea of teamwork and unity within the organization.


5 diapositivas
Stakeholder Expectations and Influence Matrix Presentation
Visualize your stakeholder dynamics with the Stakeholder Expectations and Influence Matrix Presentation. This slide uses a four-quadrant model—Monitor, Keep Informed, Keep Satisfied, Manage Closely—to map influence versus interest. Perfect for strategic planning, stakeholder communication, and project alignment. Editable in PowerPoint, Keynote, and Google Slides.


7 diapositivas
Business Plan Infographic Presentation Template
A business plan is a document that is prepared by entrepreneurs and analysts to support the decision of making a business venture. It typically helps individuals in raising capital and obtaining funds for their new ventures. A business plan often involves multiple steps that can be elaborate, sometimes difficult to explain during presentations in front of potential investors if not summarized properly. This is a comprehensive template that has all of the most important features of a well thought out business plan. This professional template that will present your plan in a sophisticated way.


7 diapositivas
Sports Training Camp Schedule Deck Presentation
Plan and present weekly training programs with this Sports Training Camp Schedule Deck. Featuring a clean, color-coded layout for Monday to Saturday, this slide helps coaches organize sessions clearly. Ideal for team meetings, camp planning, or fitness schedules. Fully editable in PowerPoint, Keynote, and Google Slides for easy customization.


7 diapositivas
Pricing Comparison Table Infographic
Dive into the strategic world of pricing with our intricately designed pricing table infographic. Imbued with the trustworthiness of blue, the crisp clarity of white, the optimism of yellow, and the urgency of red, our template visualizes pricing strategies in an engaging manner. Furnished with detailed infographics, distinct icons, and adaptable image placeholders, it translates complex pricing data into an easy-to-grasp format. Seamlessly crafted for Powerpoint, Keynote, or Google Slides. A vital asset for business analysts, marketers, sales professionals, or any brand strategizing its pricing model. Engage your audience; let every slide be a value proposition.


6 diapositivas
RAPID Roles and Responsibilities Slide Presentation
Make teamwork crystal clear with a structured chart that defines who does what and when. This organized layout helps map decision-making roles, streamline collaboration, and prevent confusion in complex projects. Easy to edit and ready to use, it’s fully compatible with PowerPoint, Keynote, and Google Slides for smooth customization.


5 diapositivas
Iceberg Model Diagram Presentation
Visualize surface issues and deeper underlying factors with this Iceberg Model Diagram Template. Perfect for presentations on behavior analysis, root cause, or systems thinking. Each layer is clearly marked with colorful labels and matching text areas. Fully editable in PowerPoint, Keynote, and Google Slides for streamlined, impactful communication.


4 diapositivas
Income and Expense Highlights Presentation
Enhance learning with the Interactive Digital Learning Experience Presentation. This template mimics a multiple-choice format, making it perfect for quizzes, training modules, or eLearning content. Each slide includes labeled options (A–D) alongside a modern vertical interface, ideal for engaging assessments or lesson recaps. Fully editable in Canva, PowerPoint, Keynote, and Google Slides.


8 diapositivas
Africa Market Potential and Improvement Map Presentation
Visualize market opportunities across Africa with this insightful map template. Featuring percentage-based growth indicators and color-coded country highlights, it’s perfect for showcasing regional potential, trends, and business expansion strategies. Fully customizable in PowerPoint, Keynote, and Google Slides, this template supports clear, data-driven storytelling for marketing, economic, or strategic presentations.


4 diapositivas
Agile Workflow Presentation
Bring energy and motion to your process overview with a clean, loop-based flow that makes each stage easy to follow. This presentation is designed to clarify steps, illustrate iterations, and support clear decision-making for any project. Fully customizable and compatible with PowerPoint, Keynote, and Google Slides.


8 diapositivas
Quarterly Sales Report Presentation
Streamline your quarterly sales review with our "Quarterly Sales Report Presentation" template. This infographic is expertly designed to display sales data across various categories, using a series of shopping cart icons that represent different products or services. Each cart is labeled with a title and associated with a percentage, clearly illustrating sales performance metrics. The color-coded elements help distinguish between different data points, making complex information easily digestible. Ideal for sales managers and teams, this template aids in analyzing trends, identifying growth opportunities, and planning future sales strategies. Compatible with PowerPoint, Keynote, and Google Slides, it's a vital tool for effective sales presentations.


5 diapositivas
Veterinary Diagnostics and Treatment Presentation
Clearly outline your care process with the Veterinary Diagnostics and Treatment presentation. This slide features a visually appealing medical bag segmented into four quadrants, each marked by colorful paw prints and editable titles. Ideal for showcasing diagnosis steps, treatment plans, or service categories for veterinary clinics. Fully customizable and easy to adapt for use in PowerPoint, Keynote, and Google Slides. Perfect for pet care professionals seeking a professional, pet-friendly visual.


5 diapositivas
Economic Analysis of Europe Map Presentation
Visualize key economic indicators across European regions with this impactful map-based presentation. Use shaded country highlights and accompanying bar charts to present comparative data, performance trends, and regional growth. Ideal for economic reports, investor updates, or strategic planning. Fully editable and works seamlessly with PowerPoint, Keynote, and Google Slides.


23 diapositivas
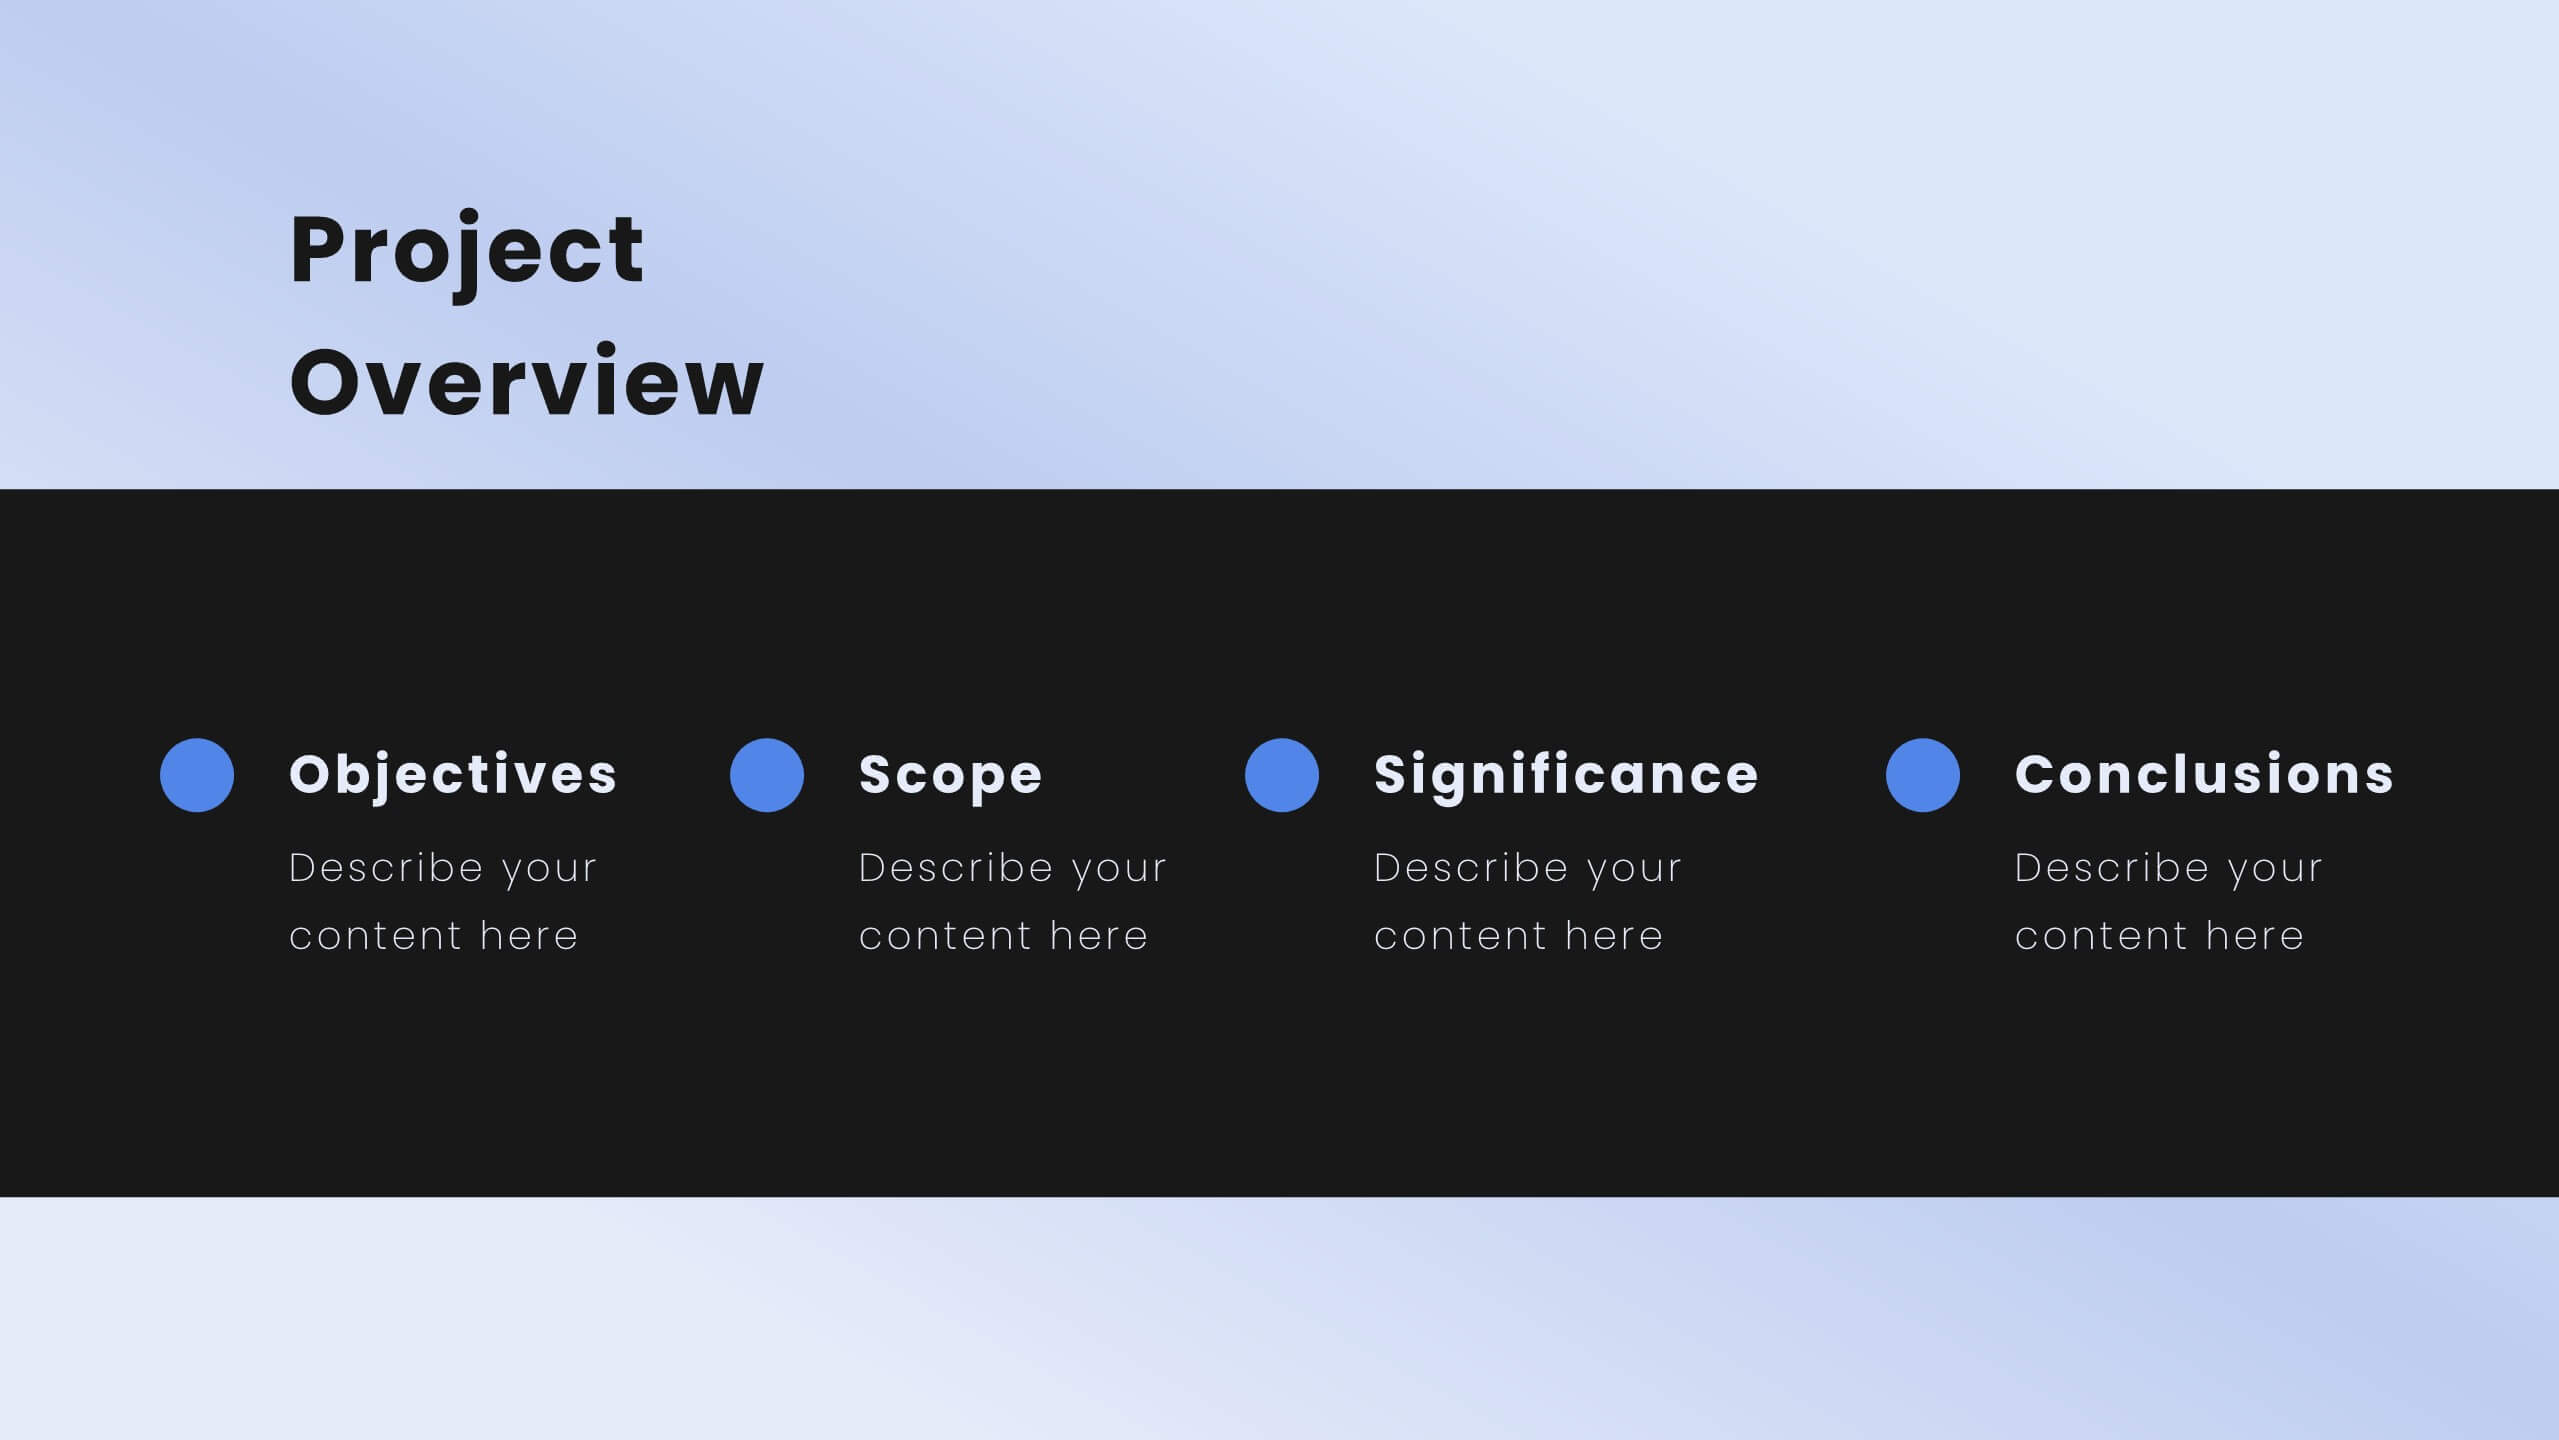
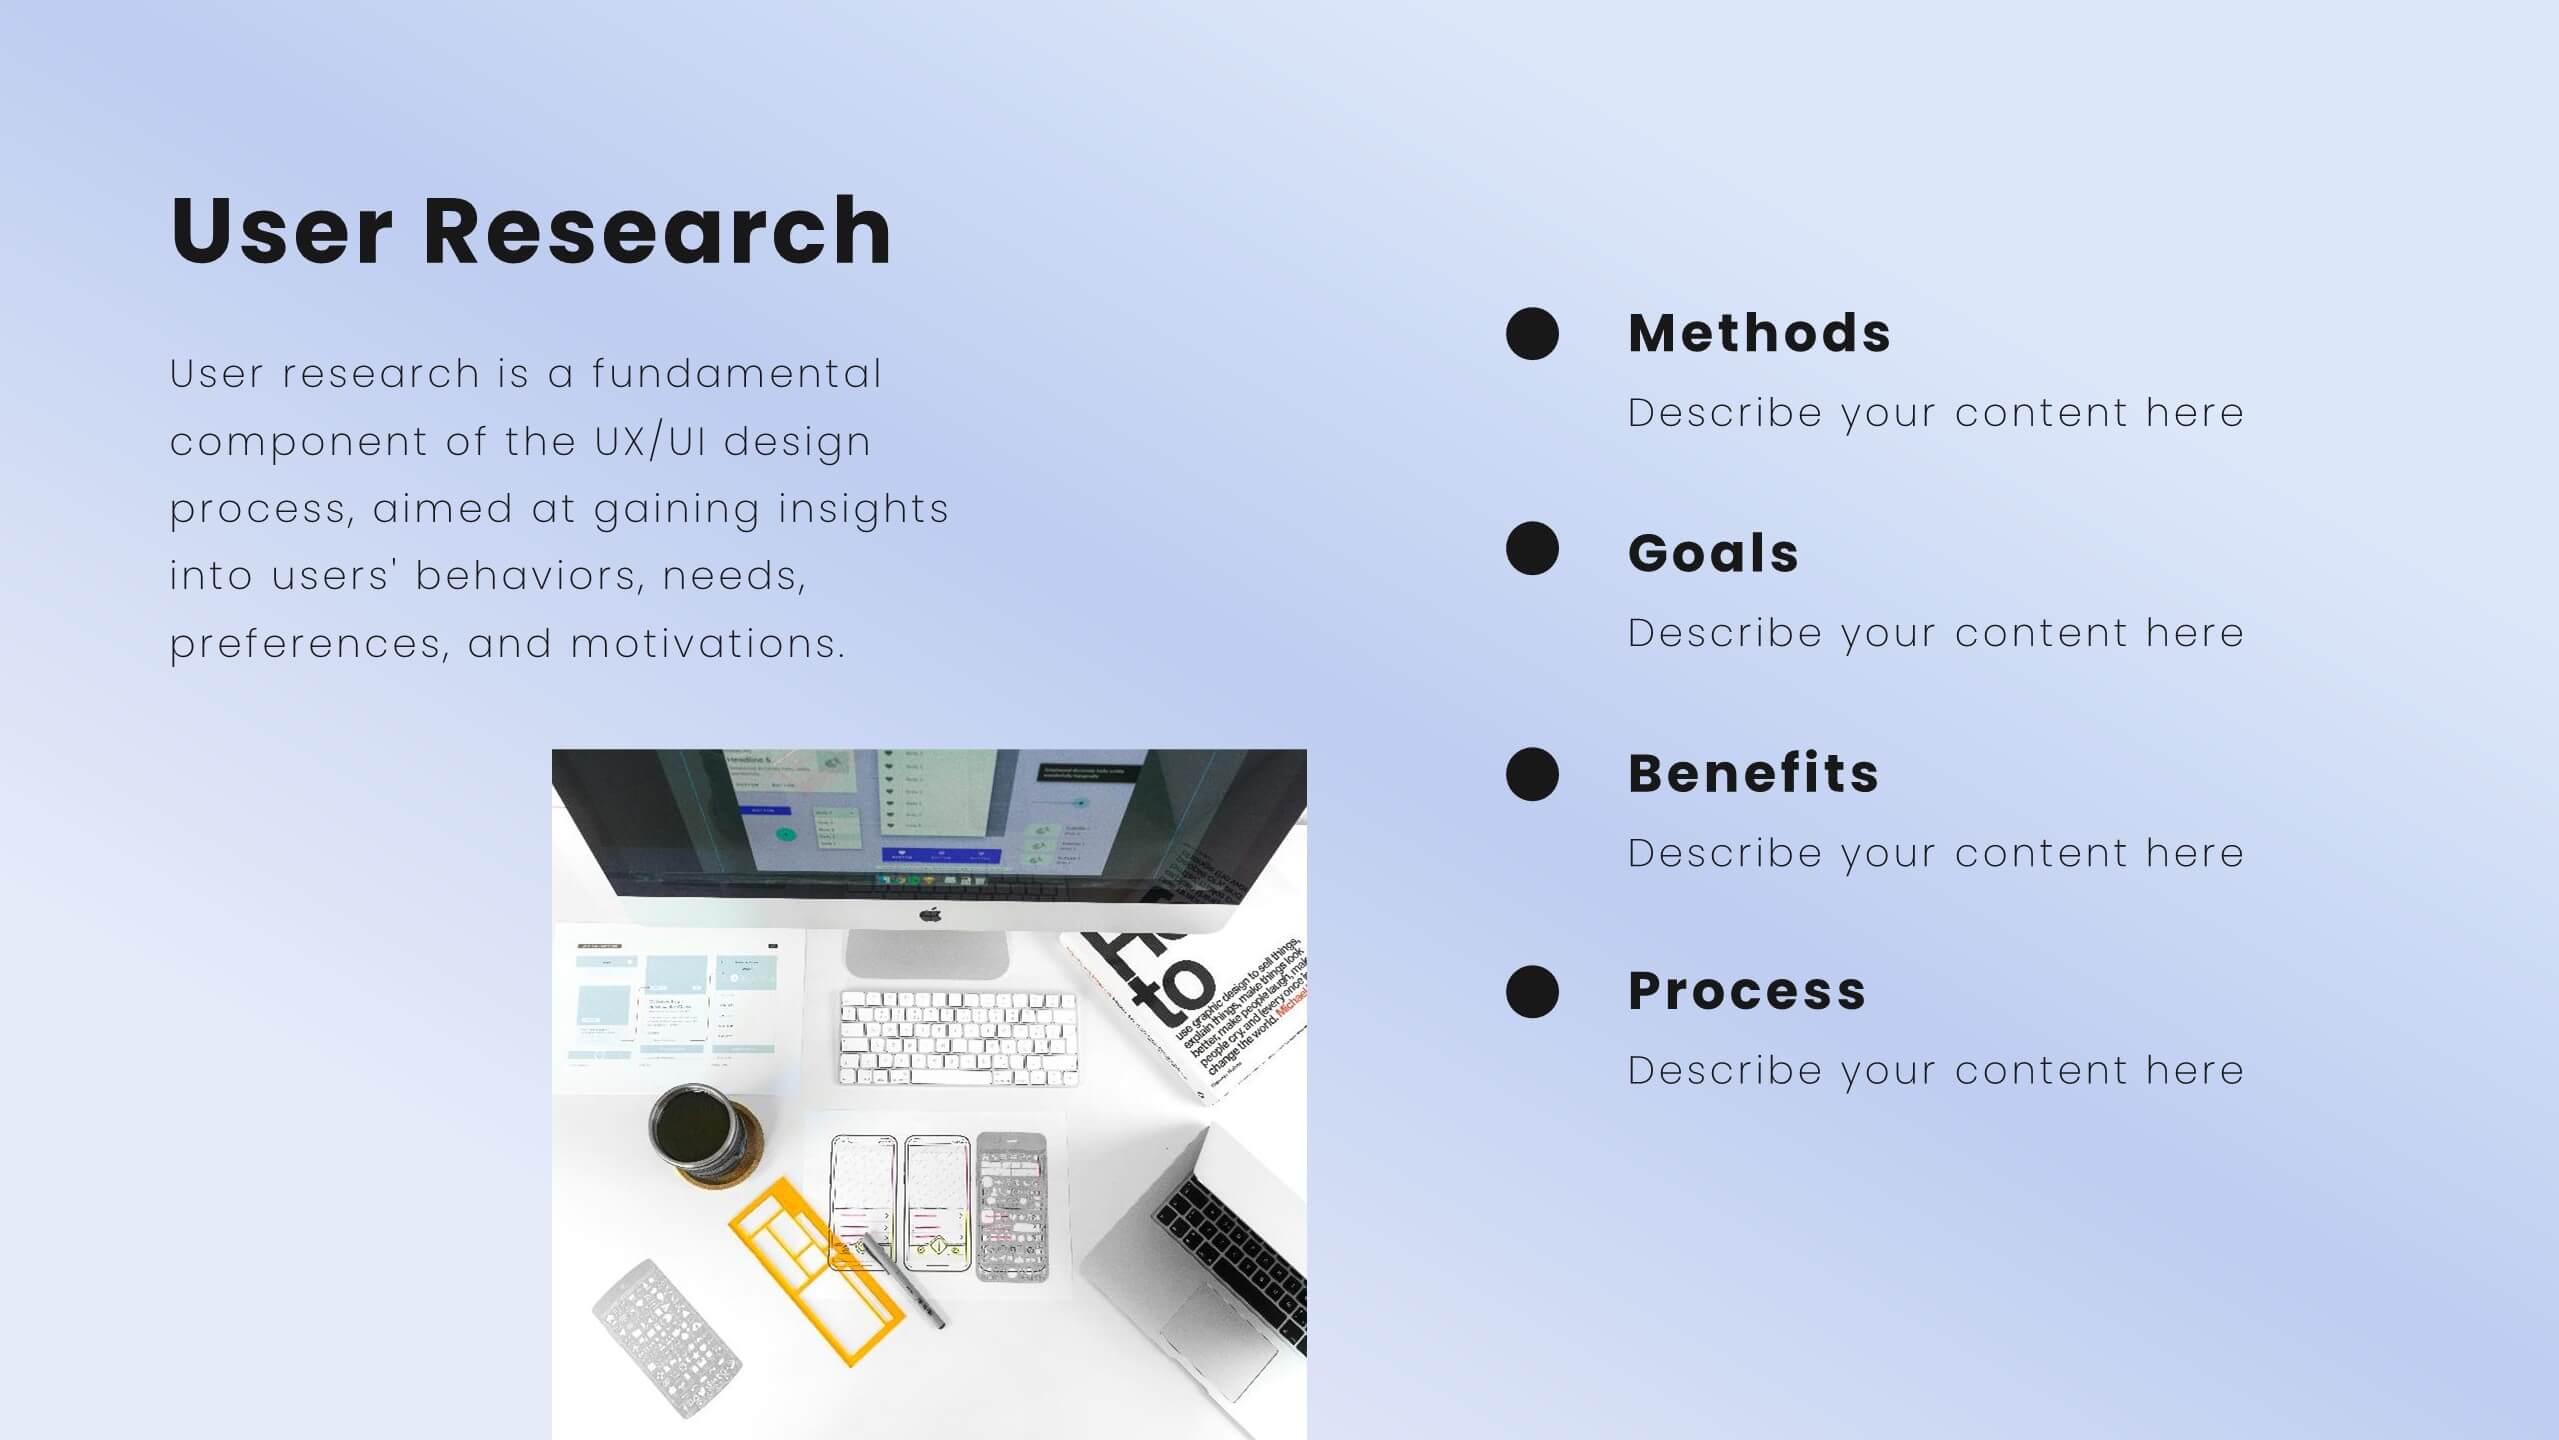
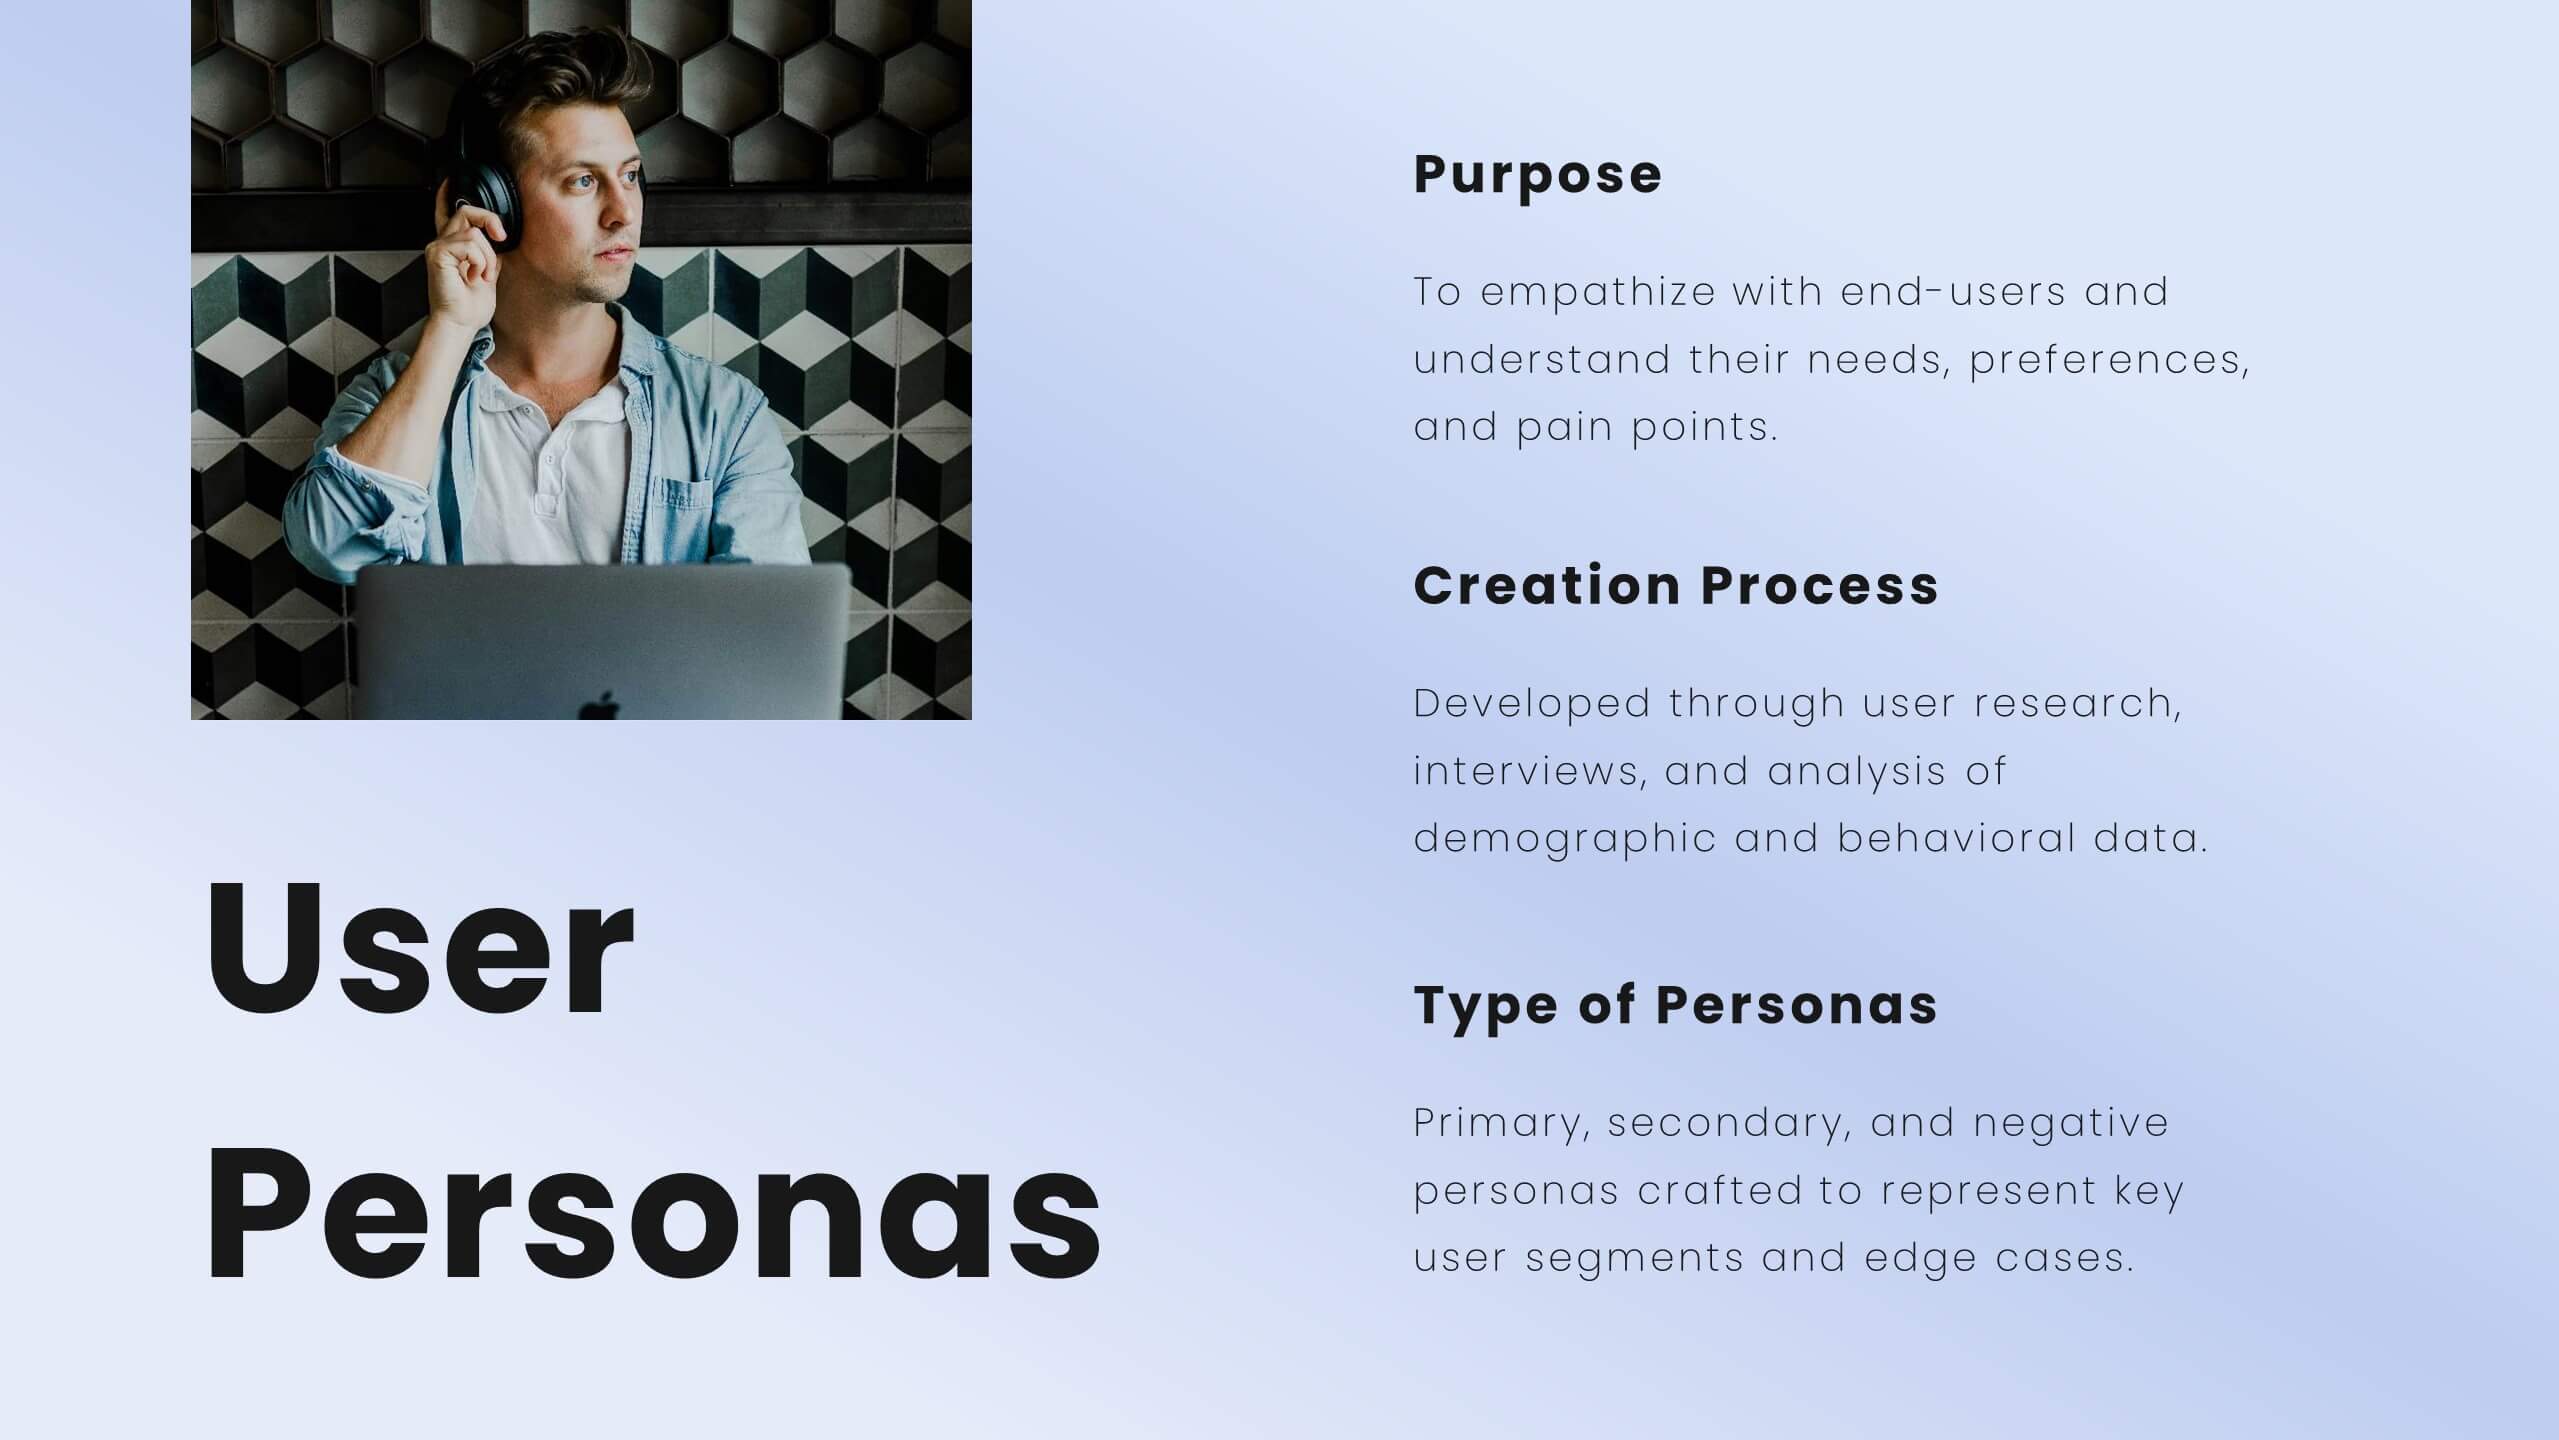
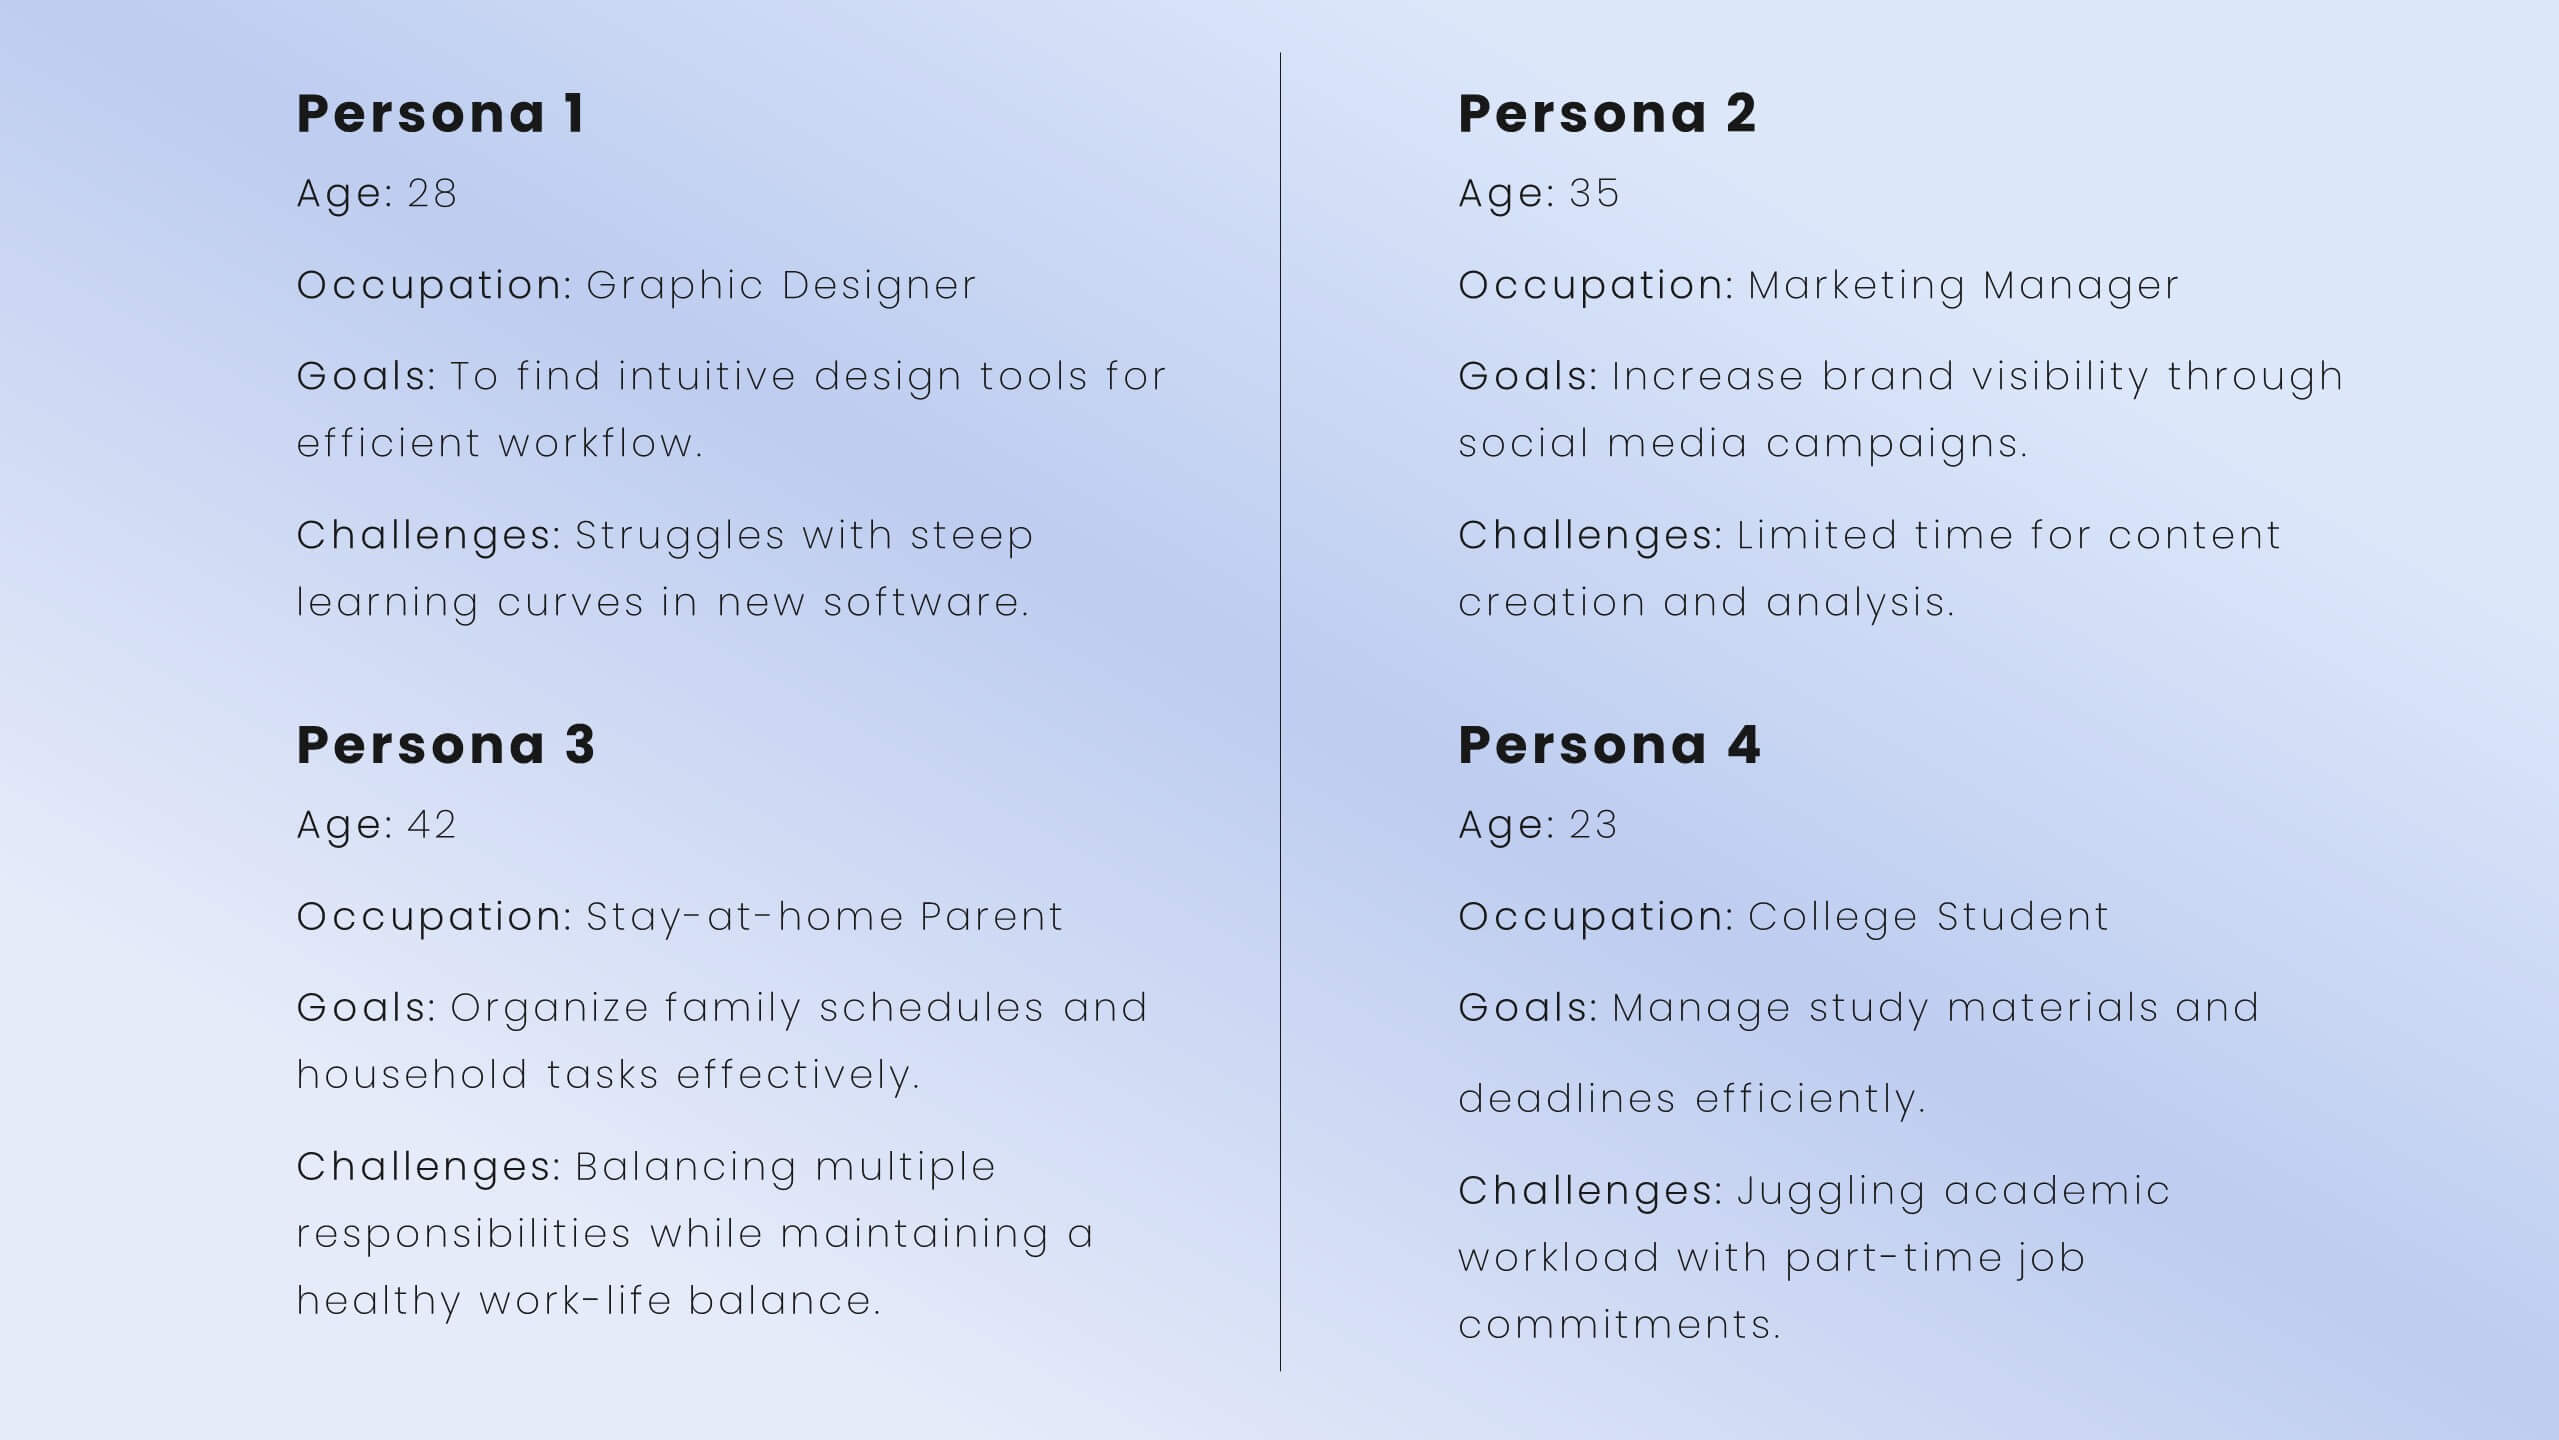
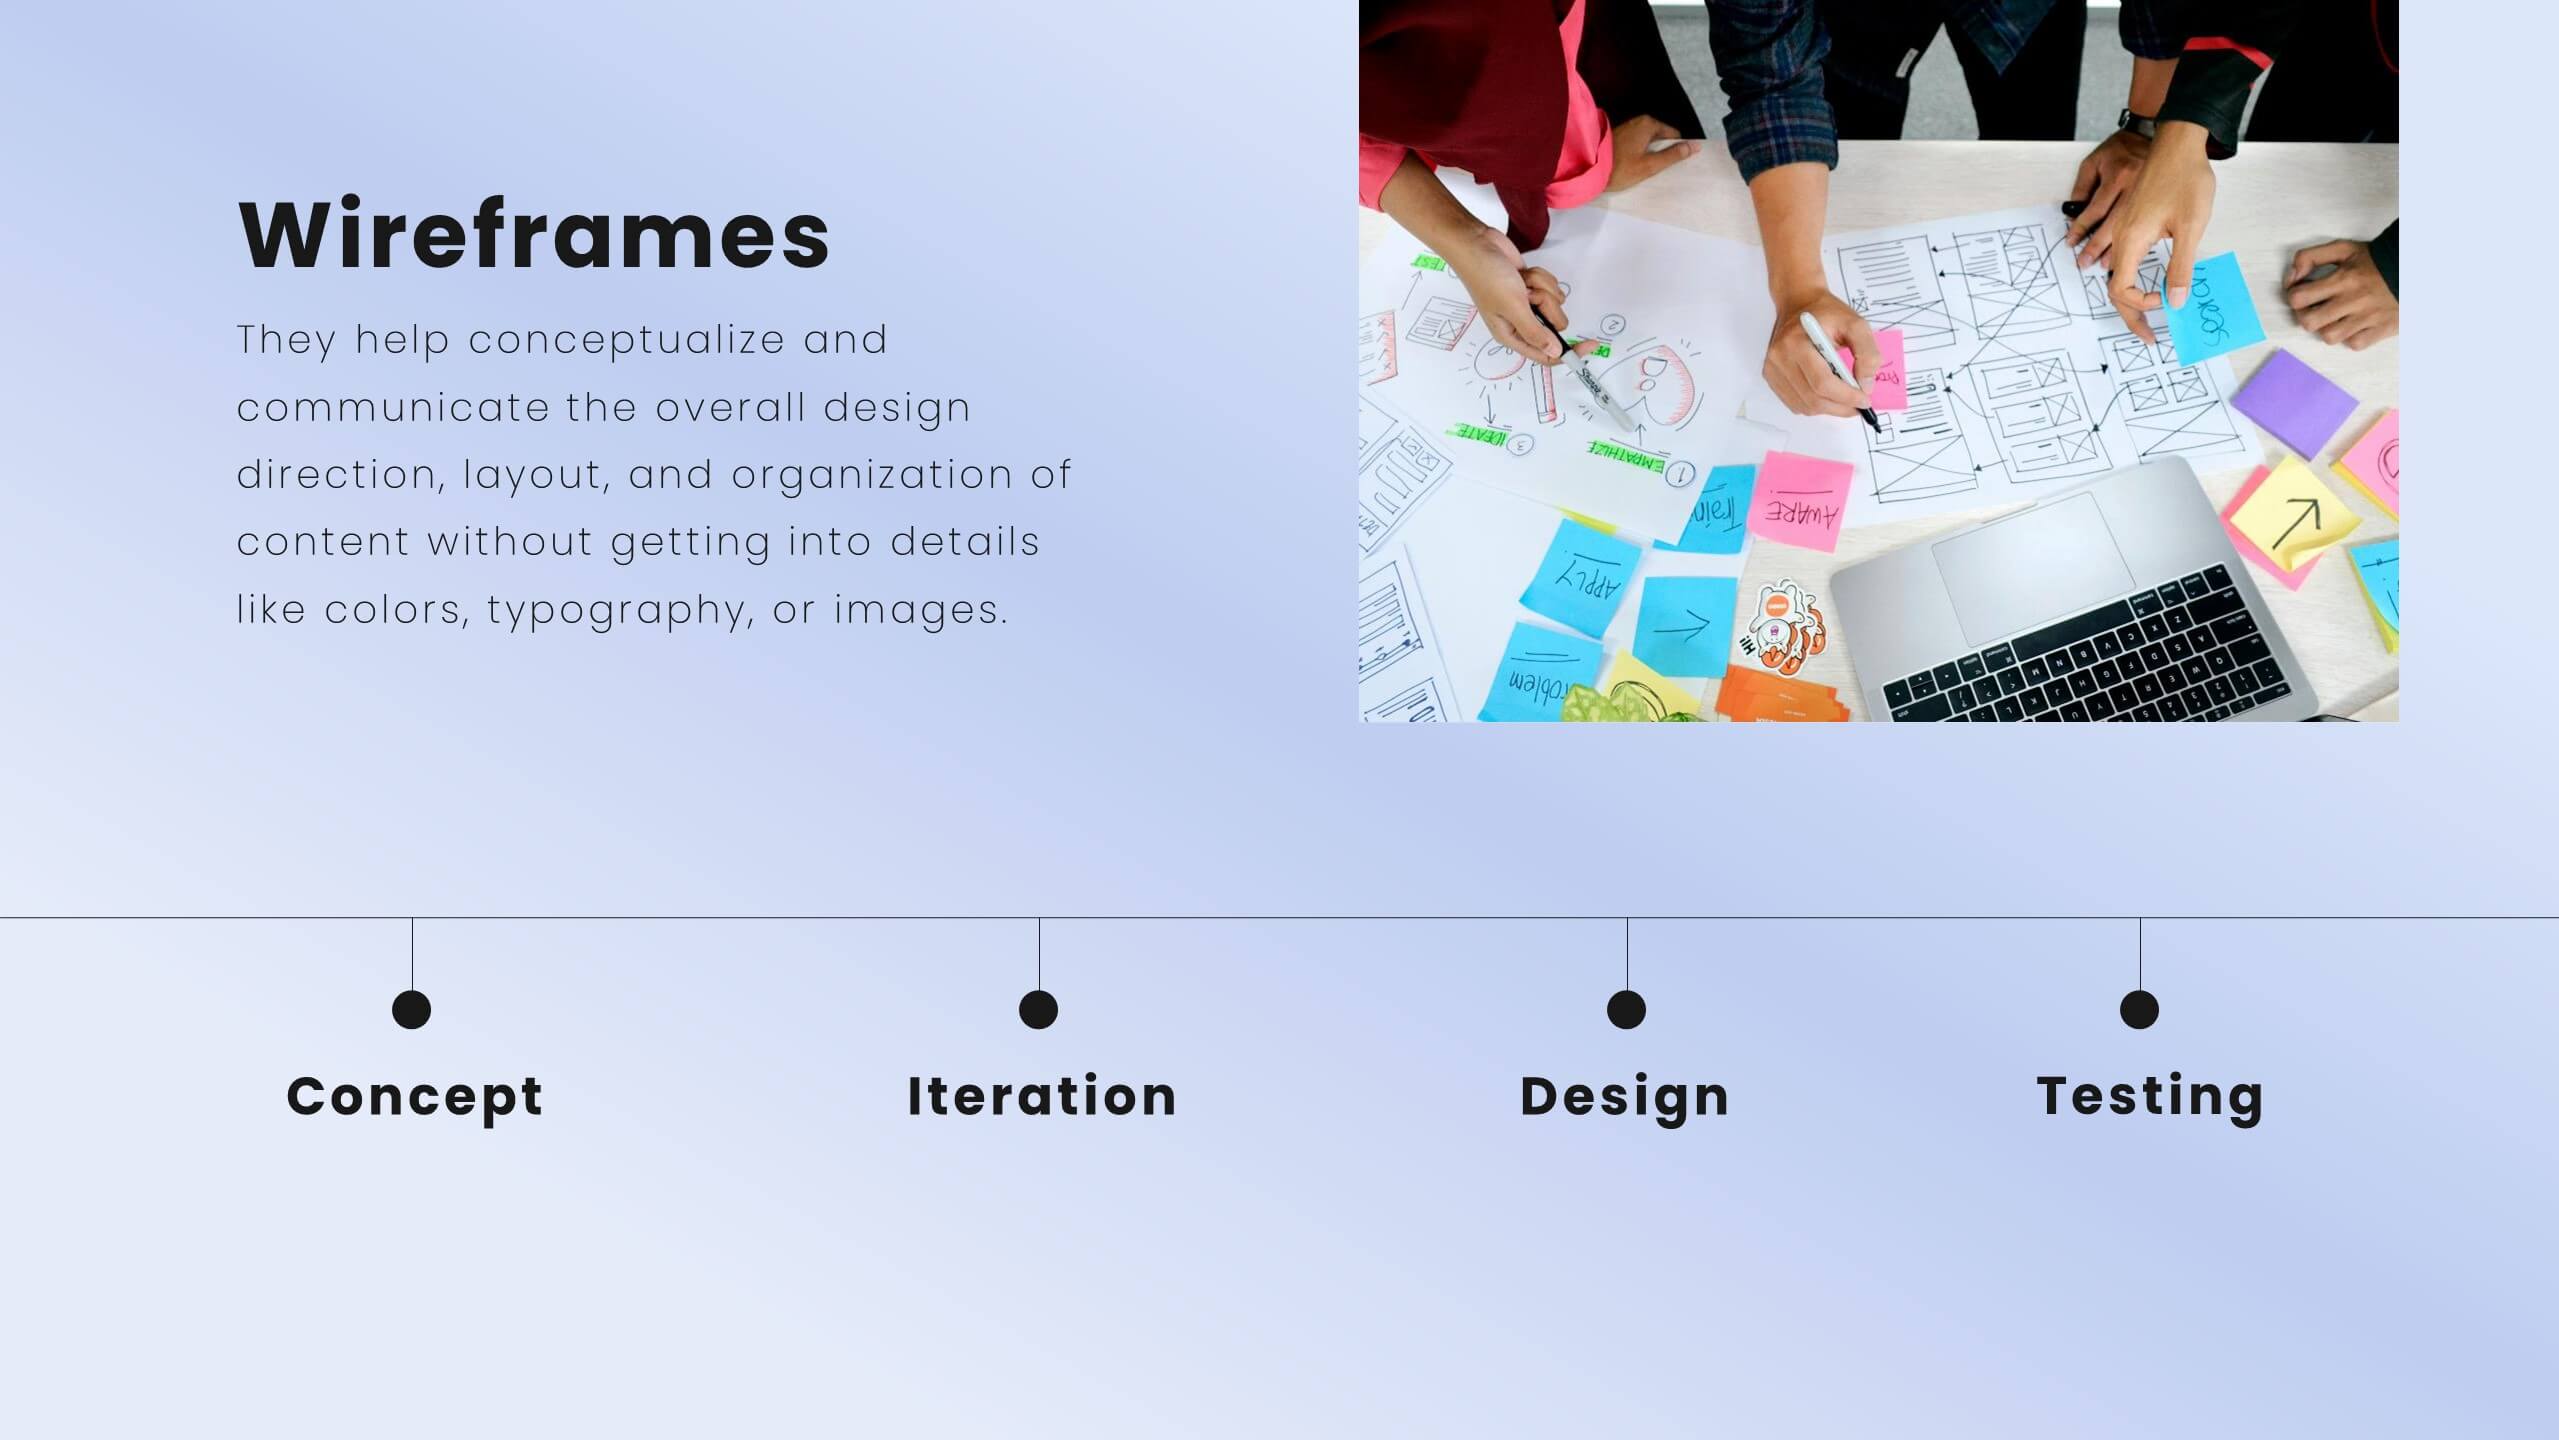
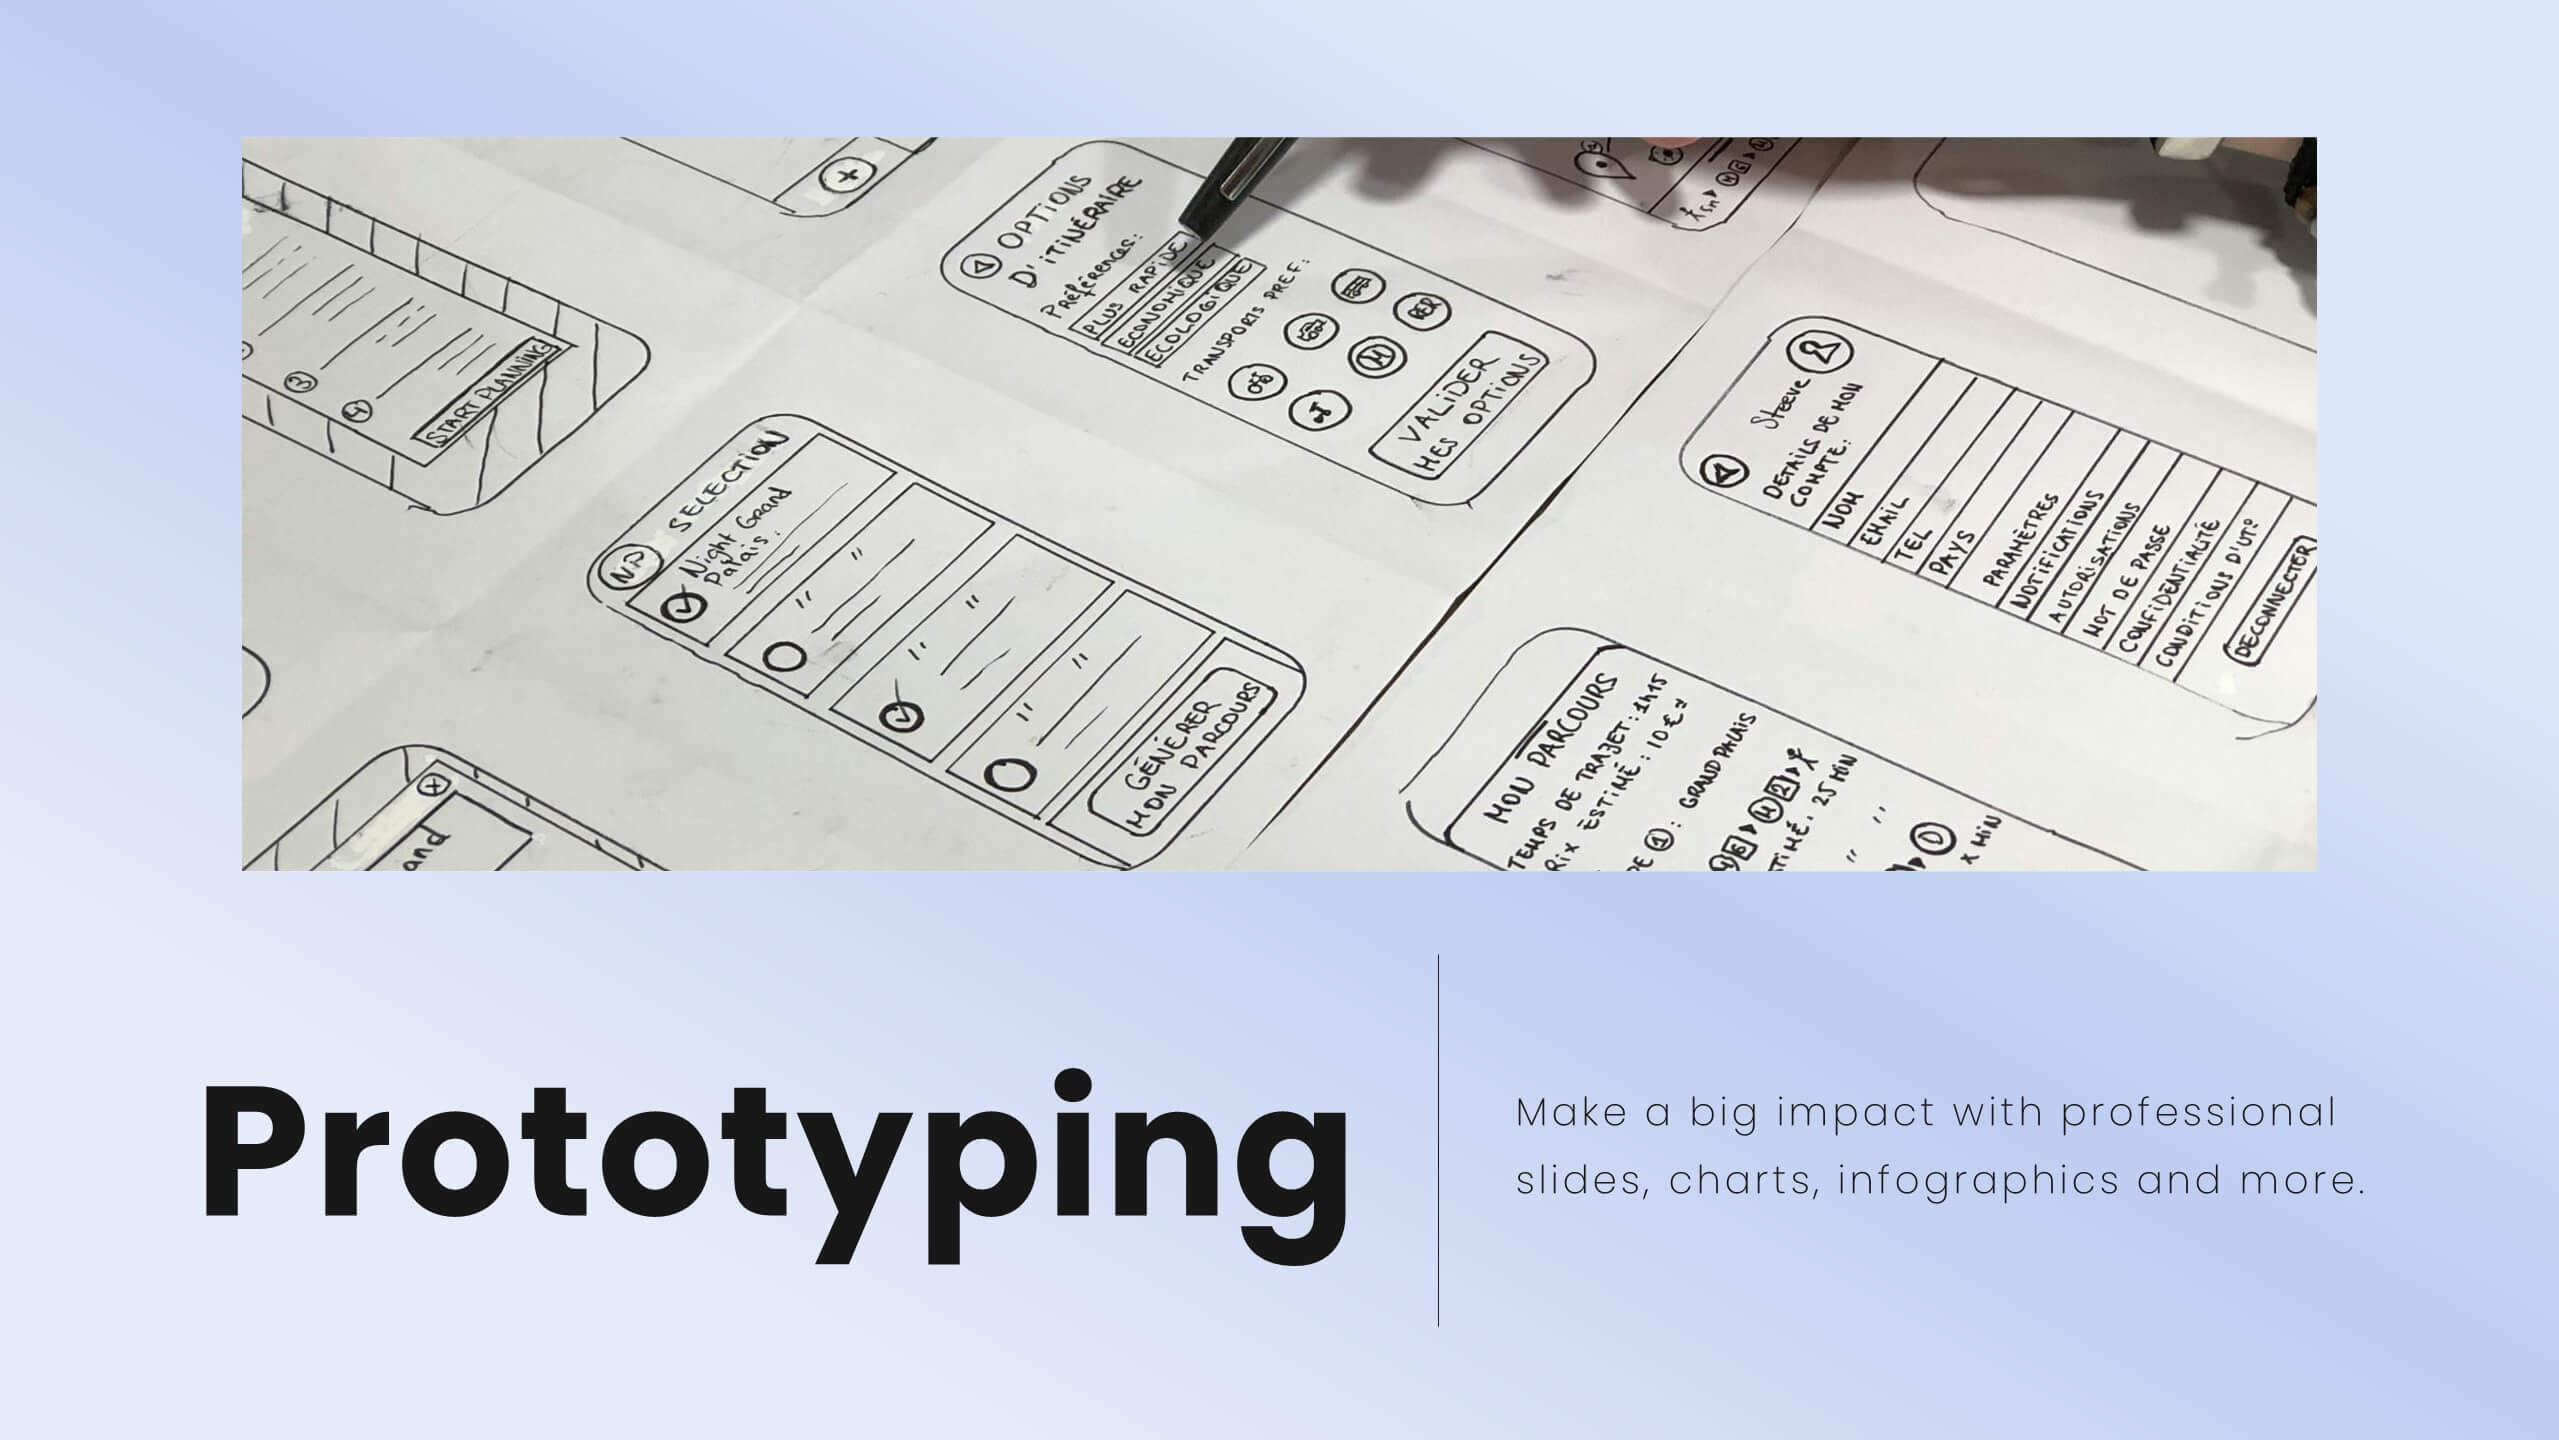
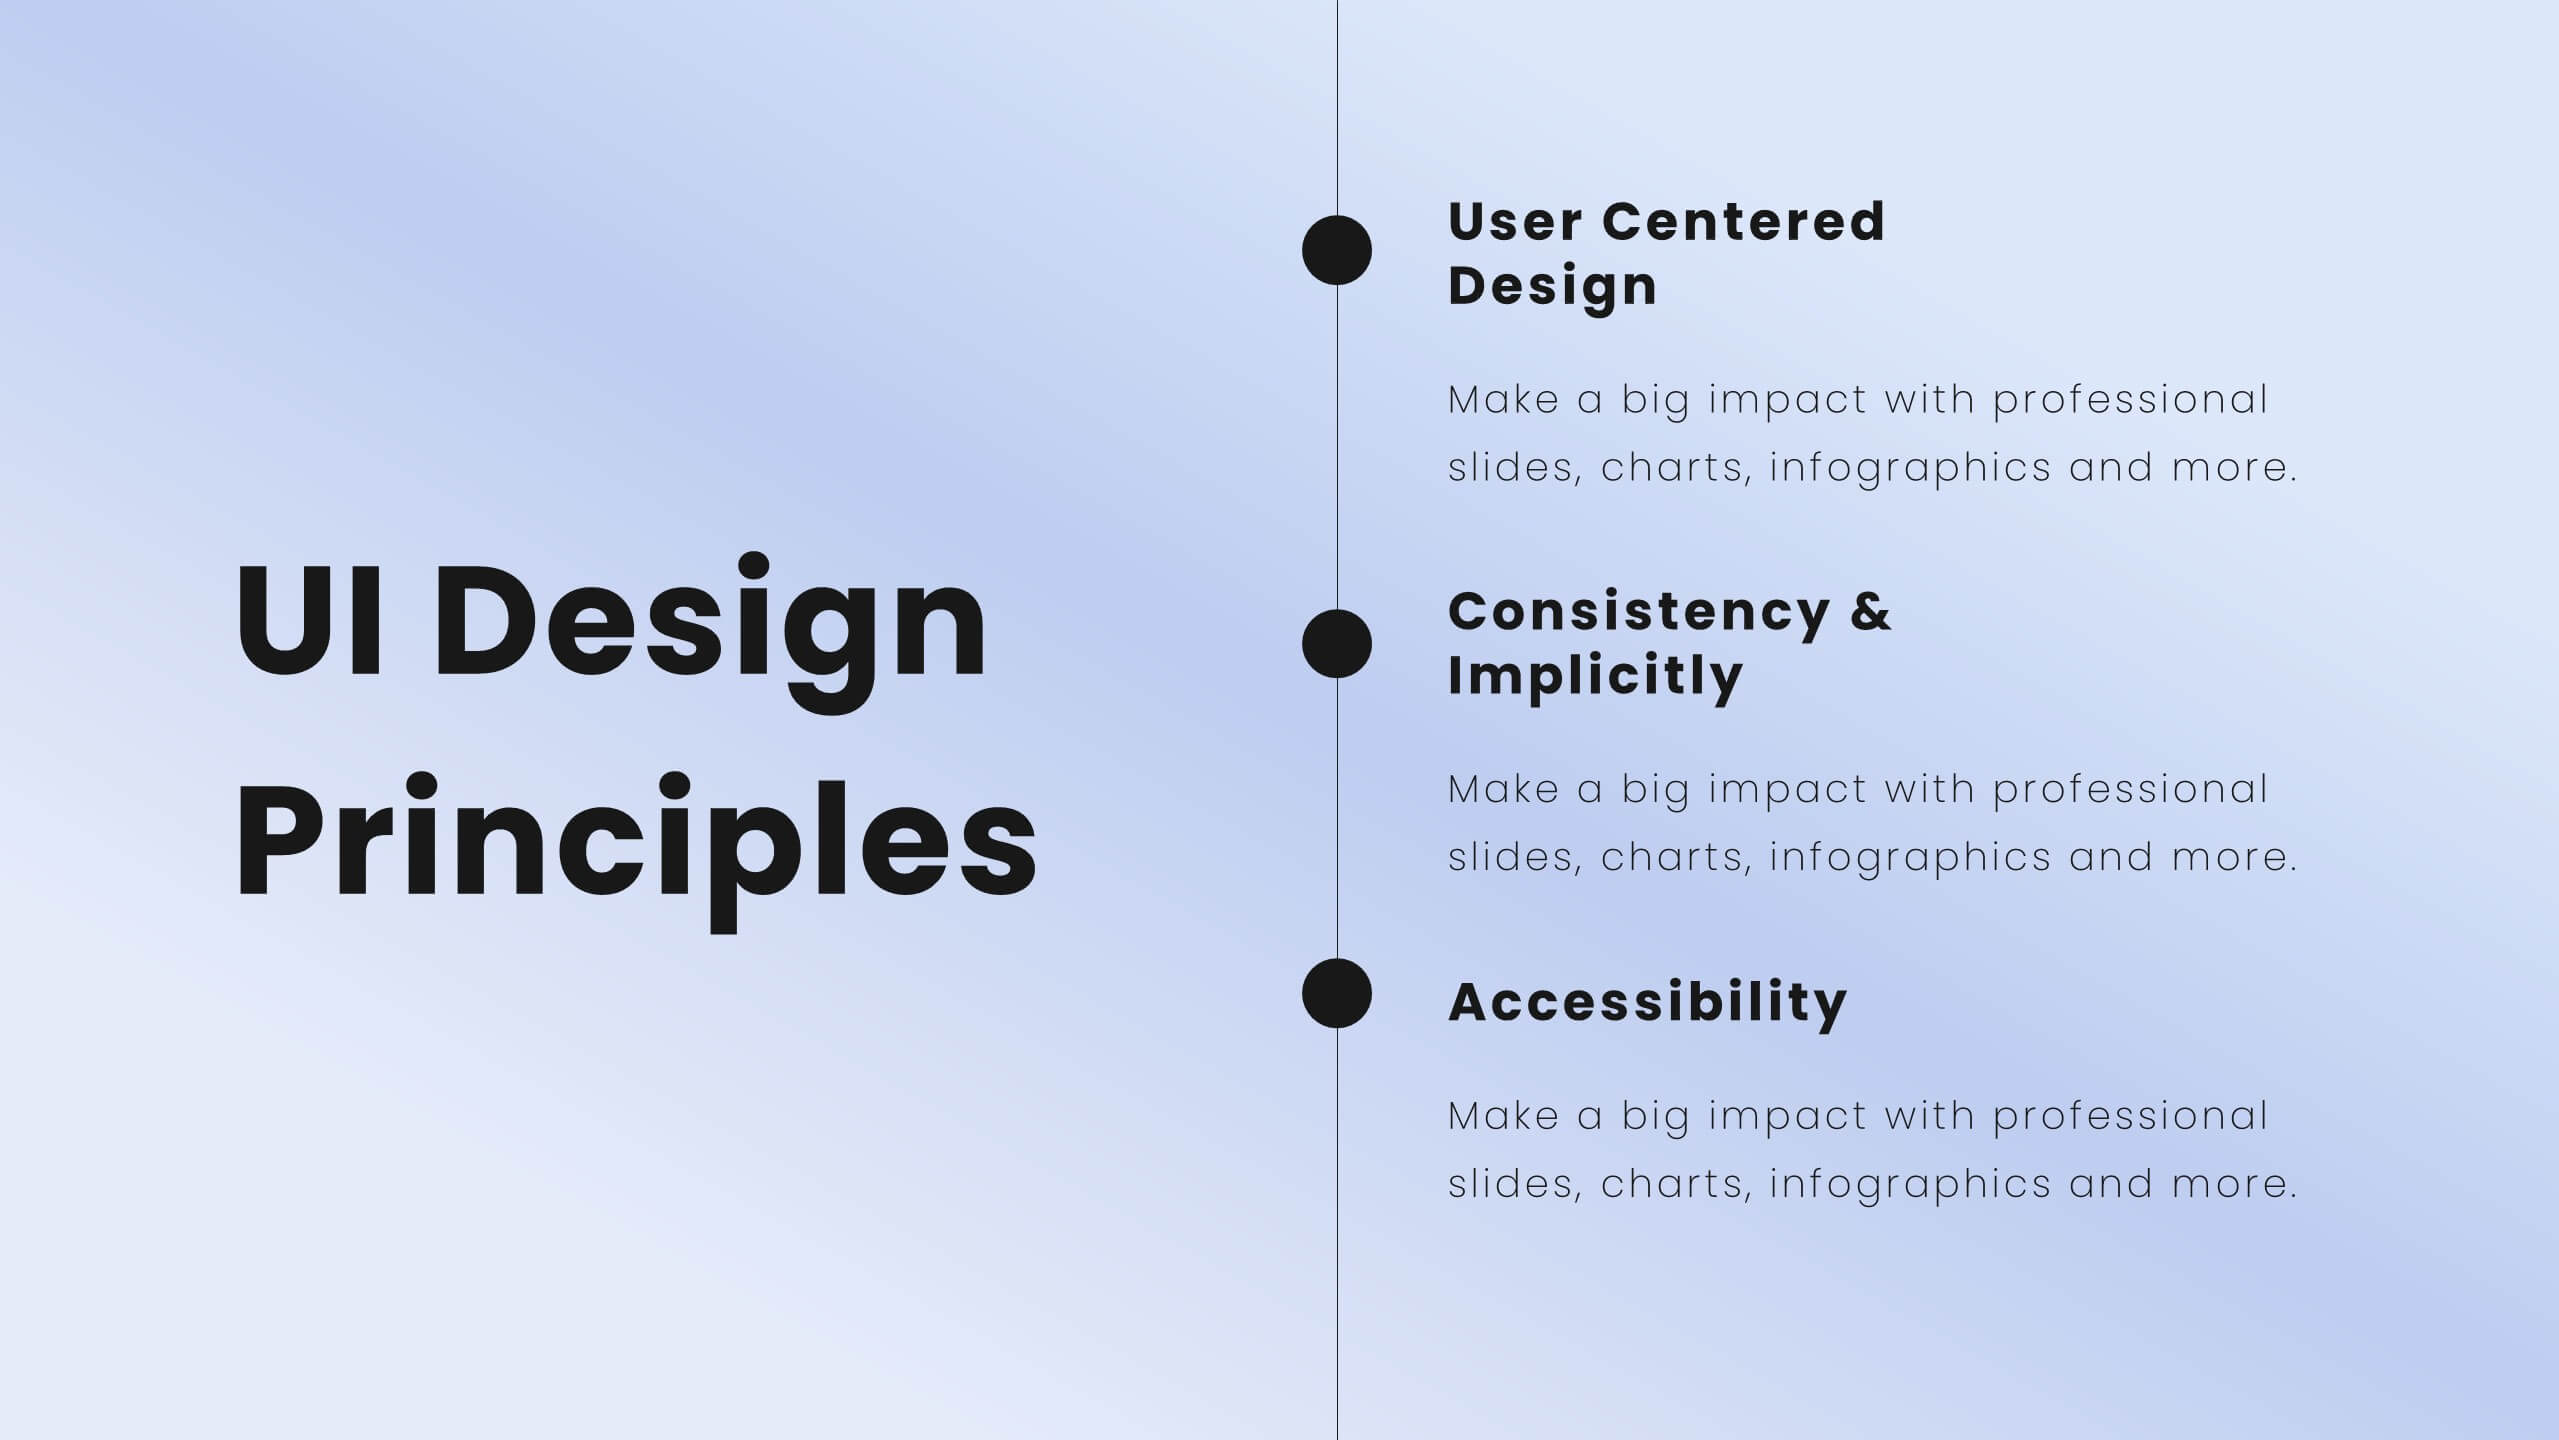
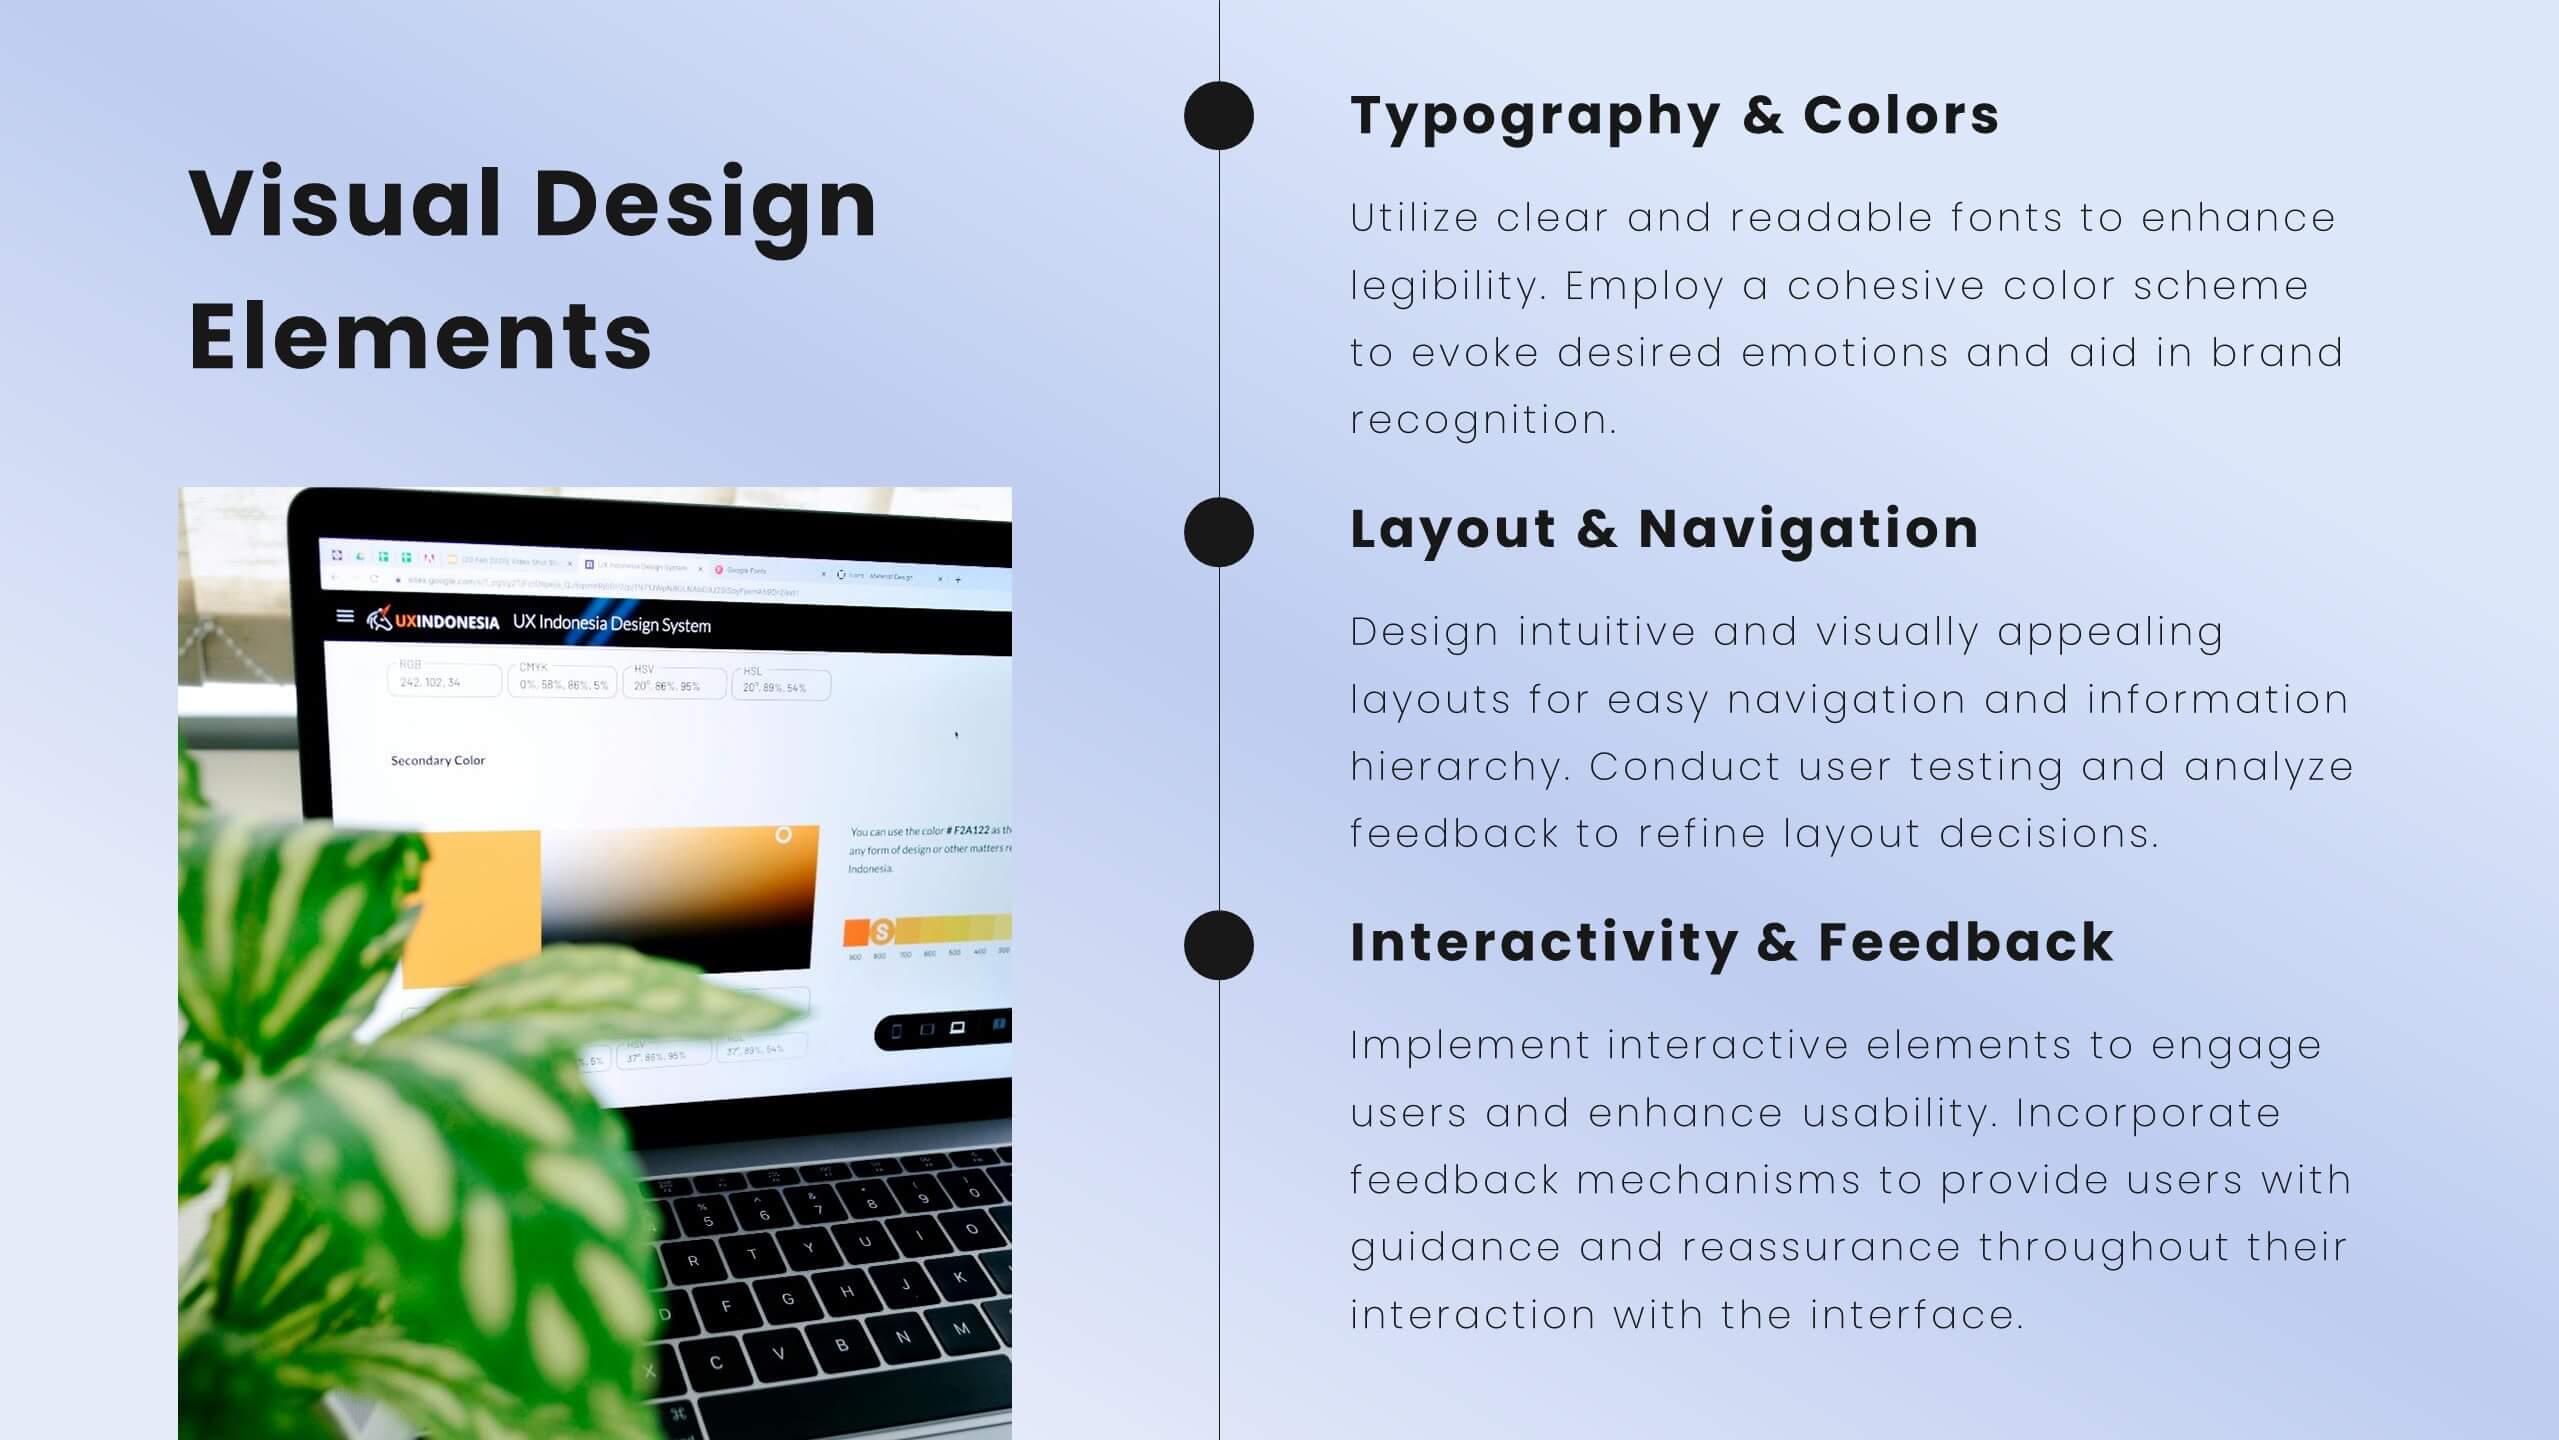
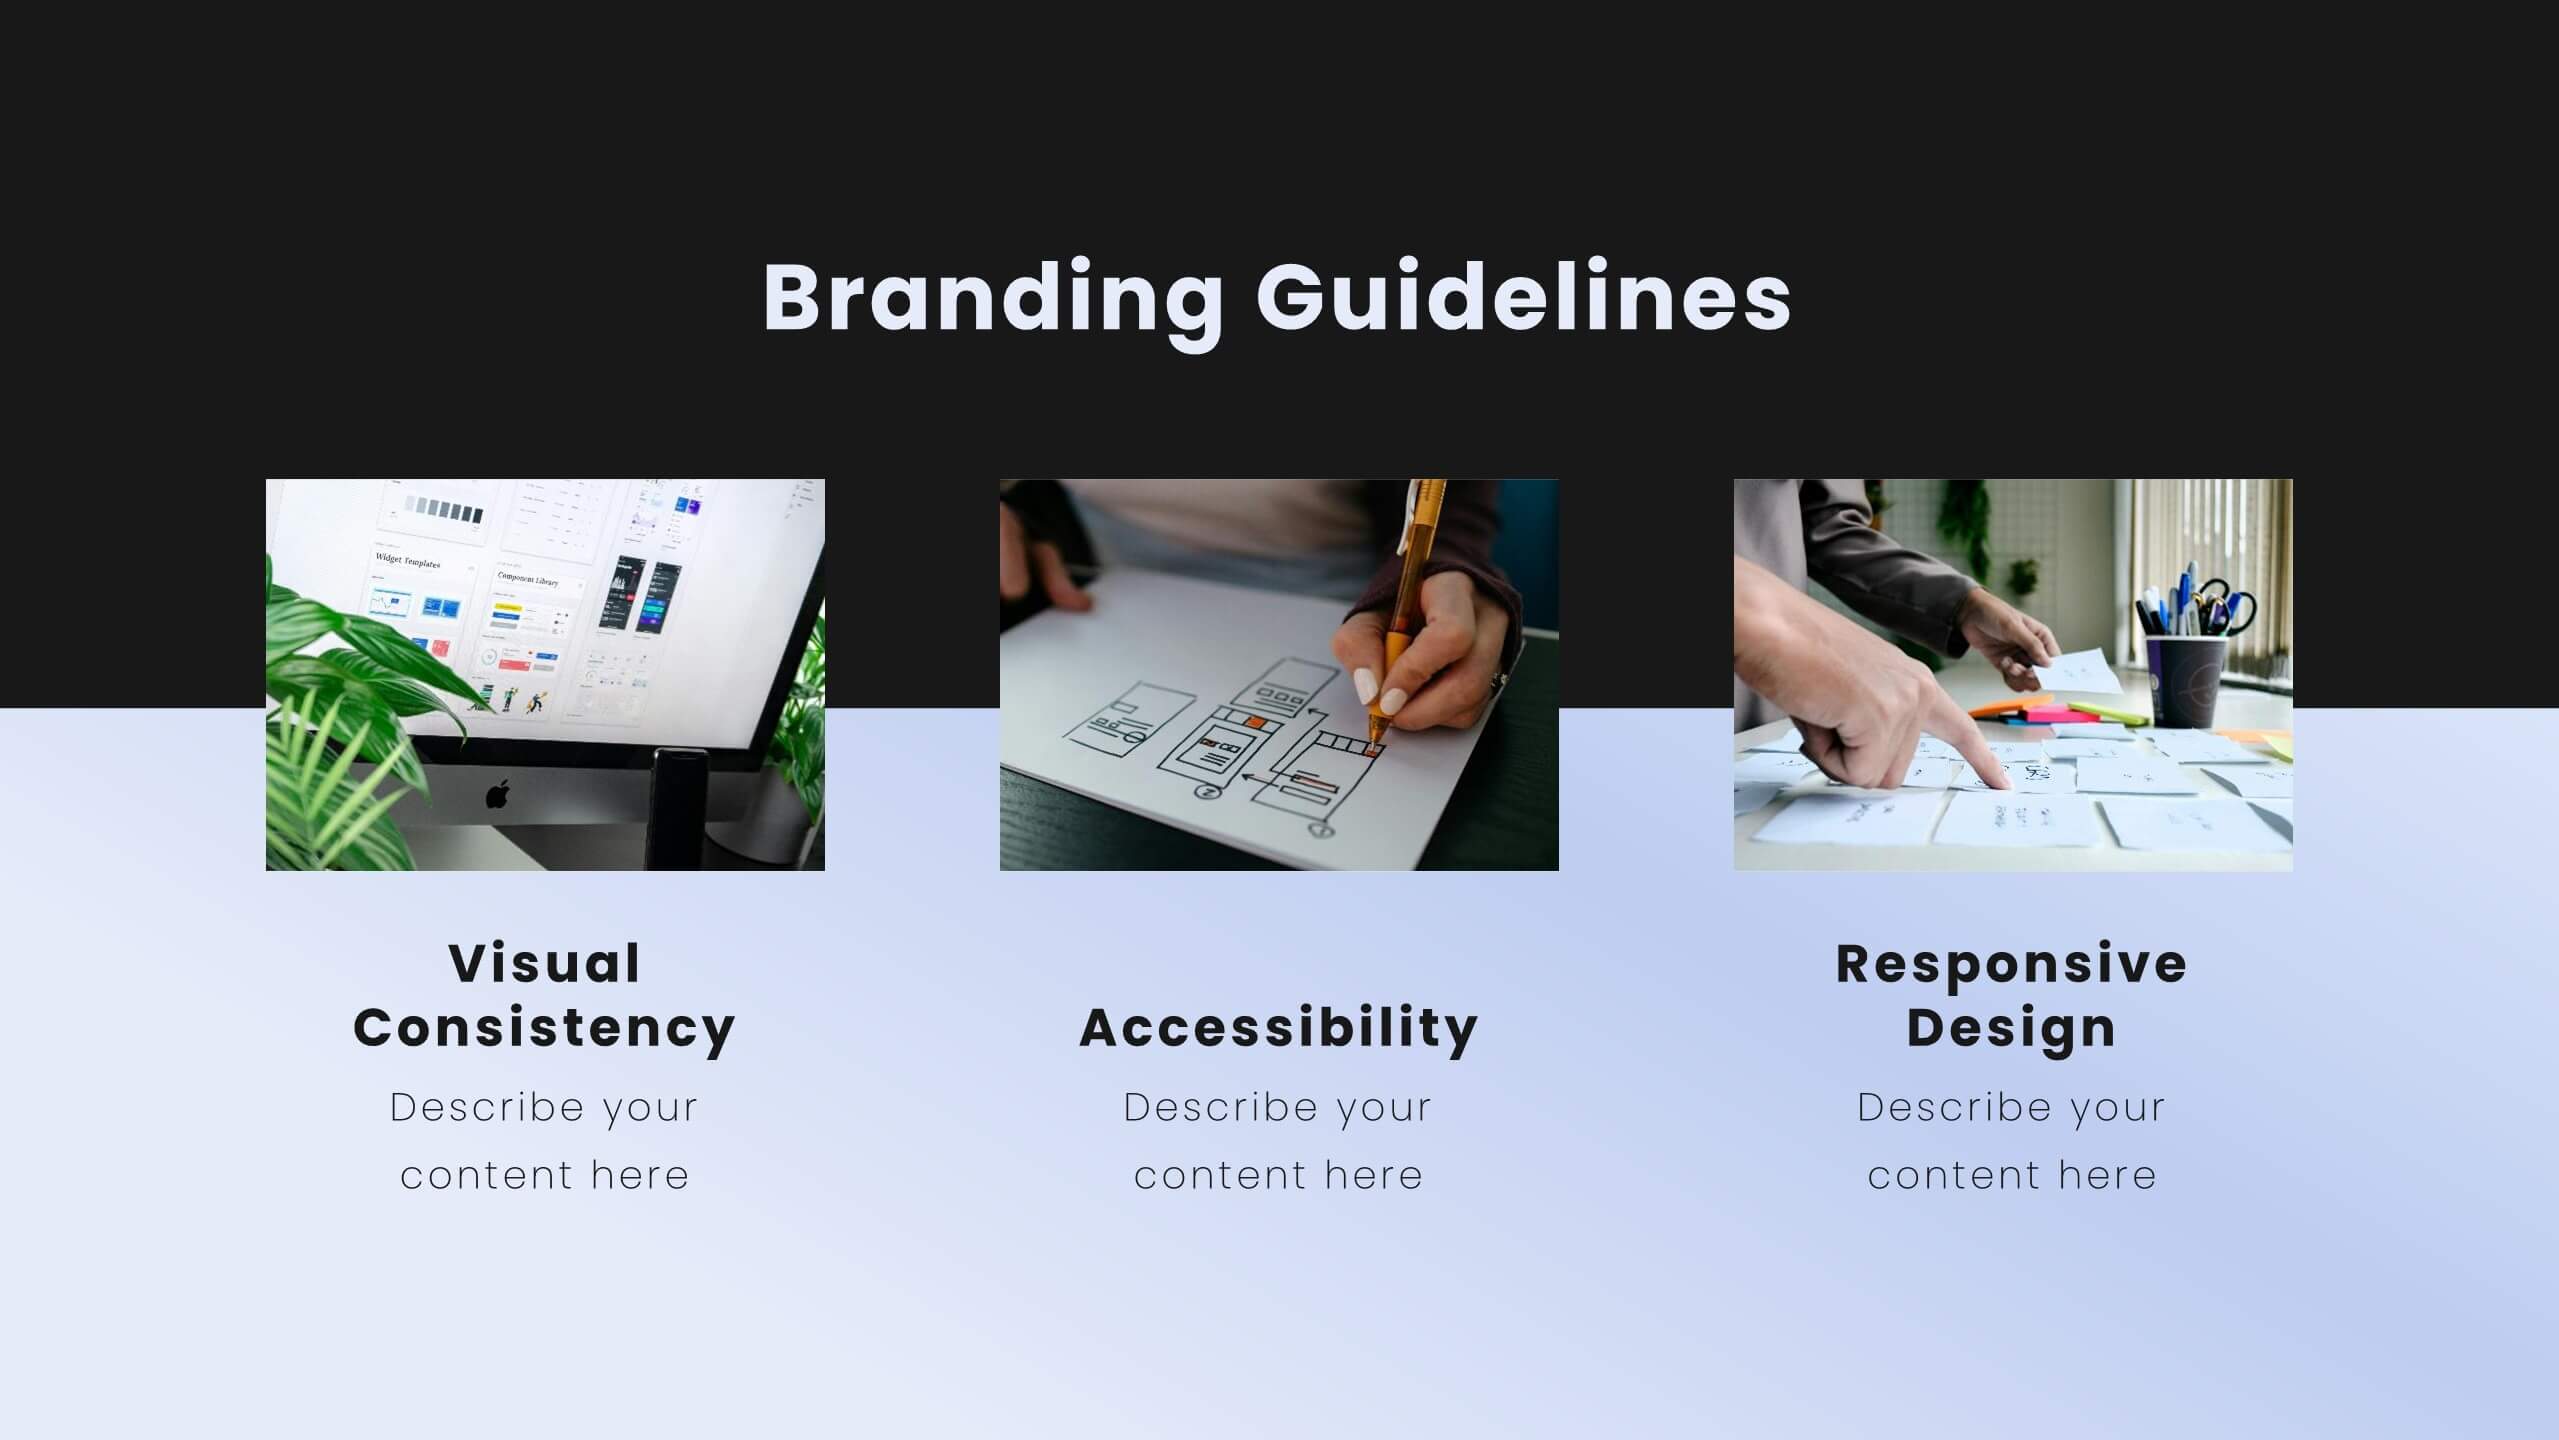
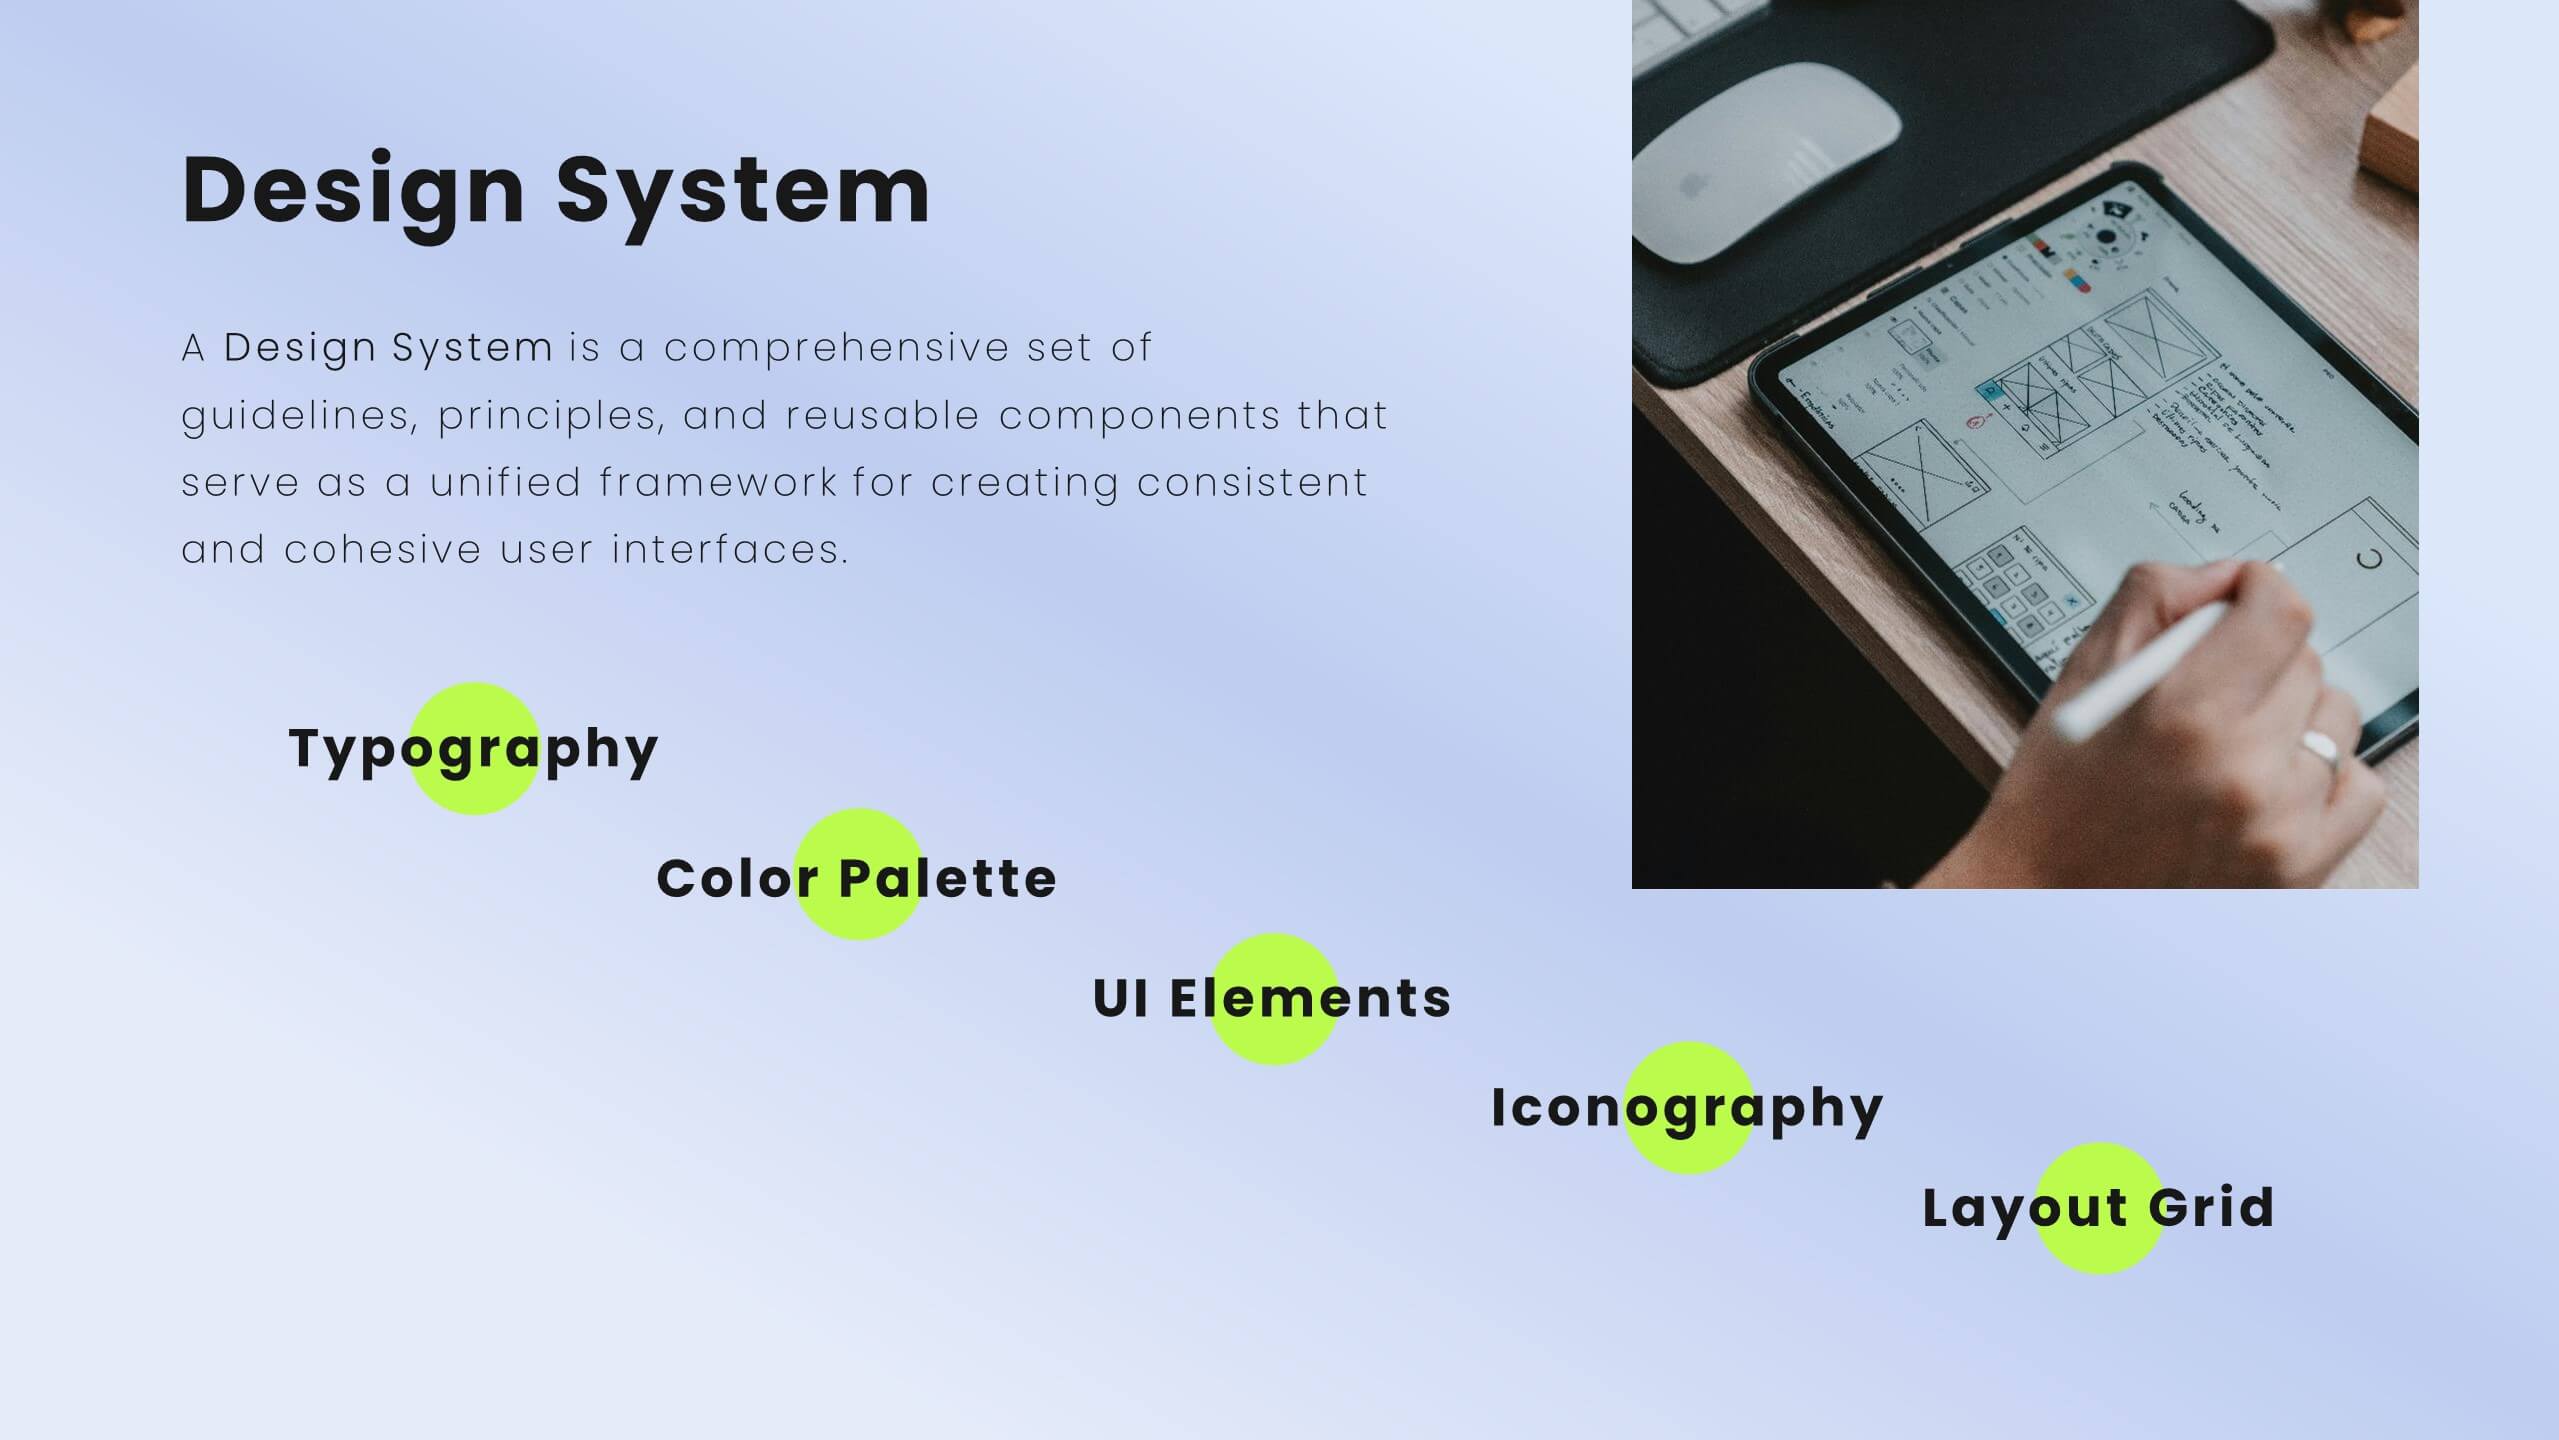
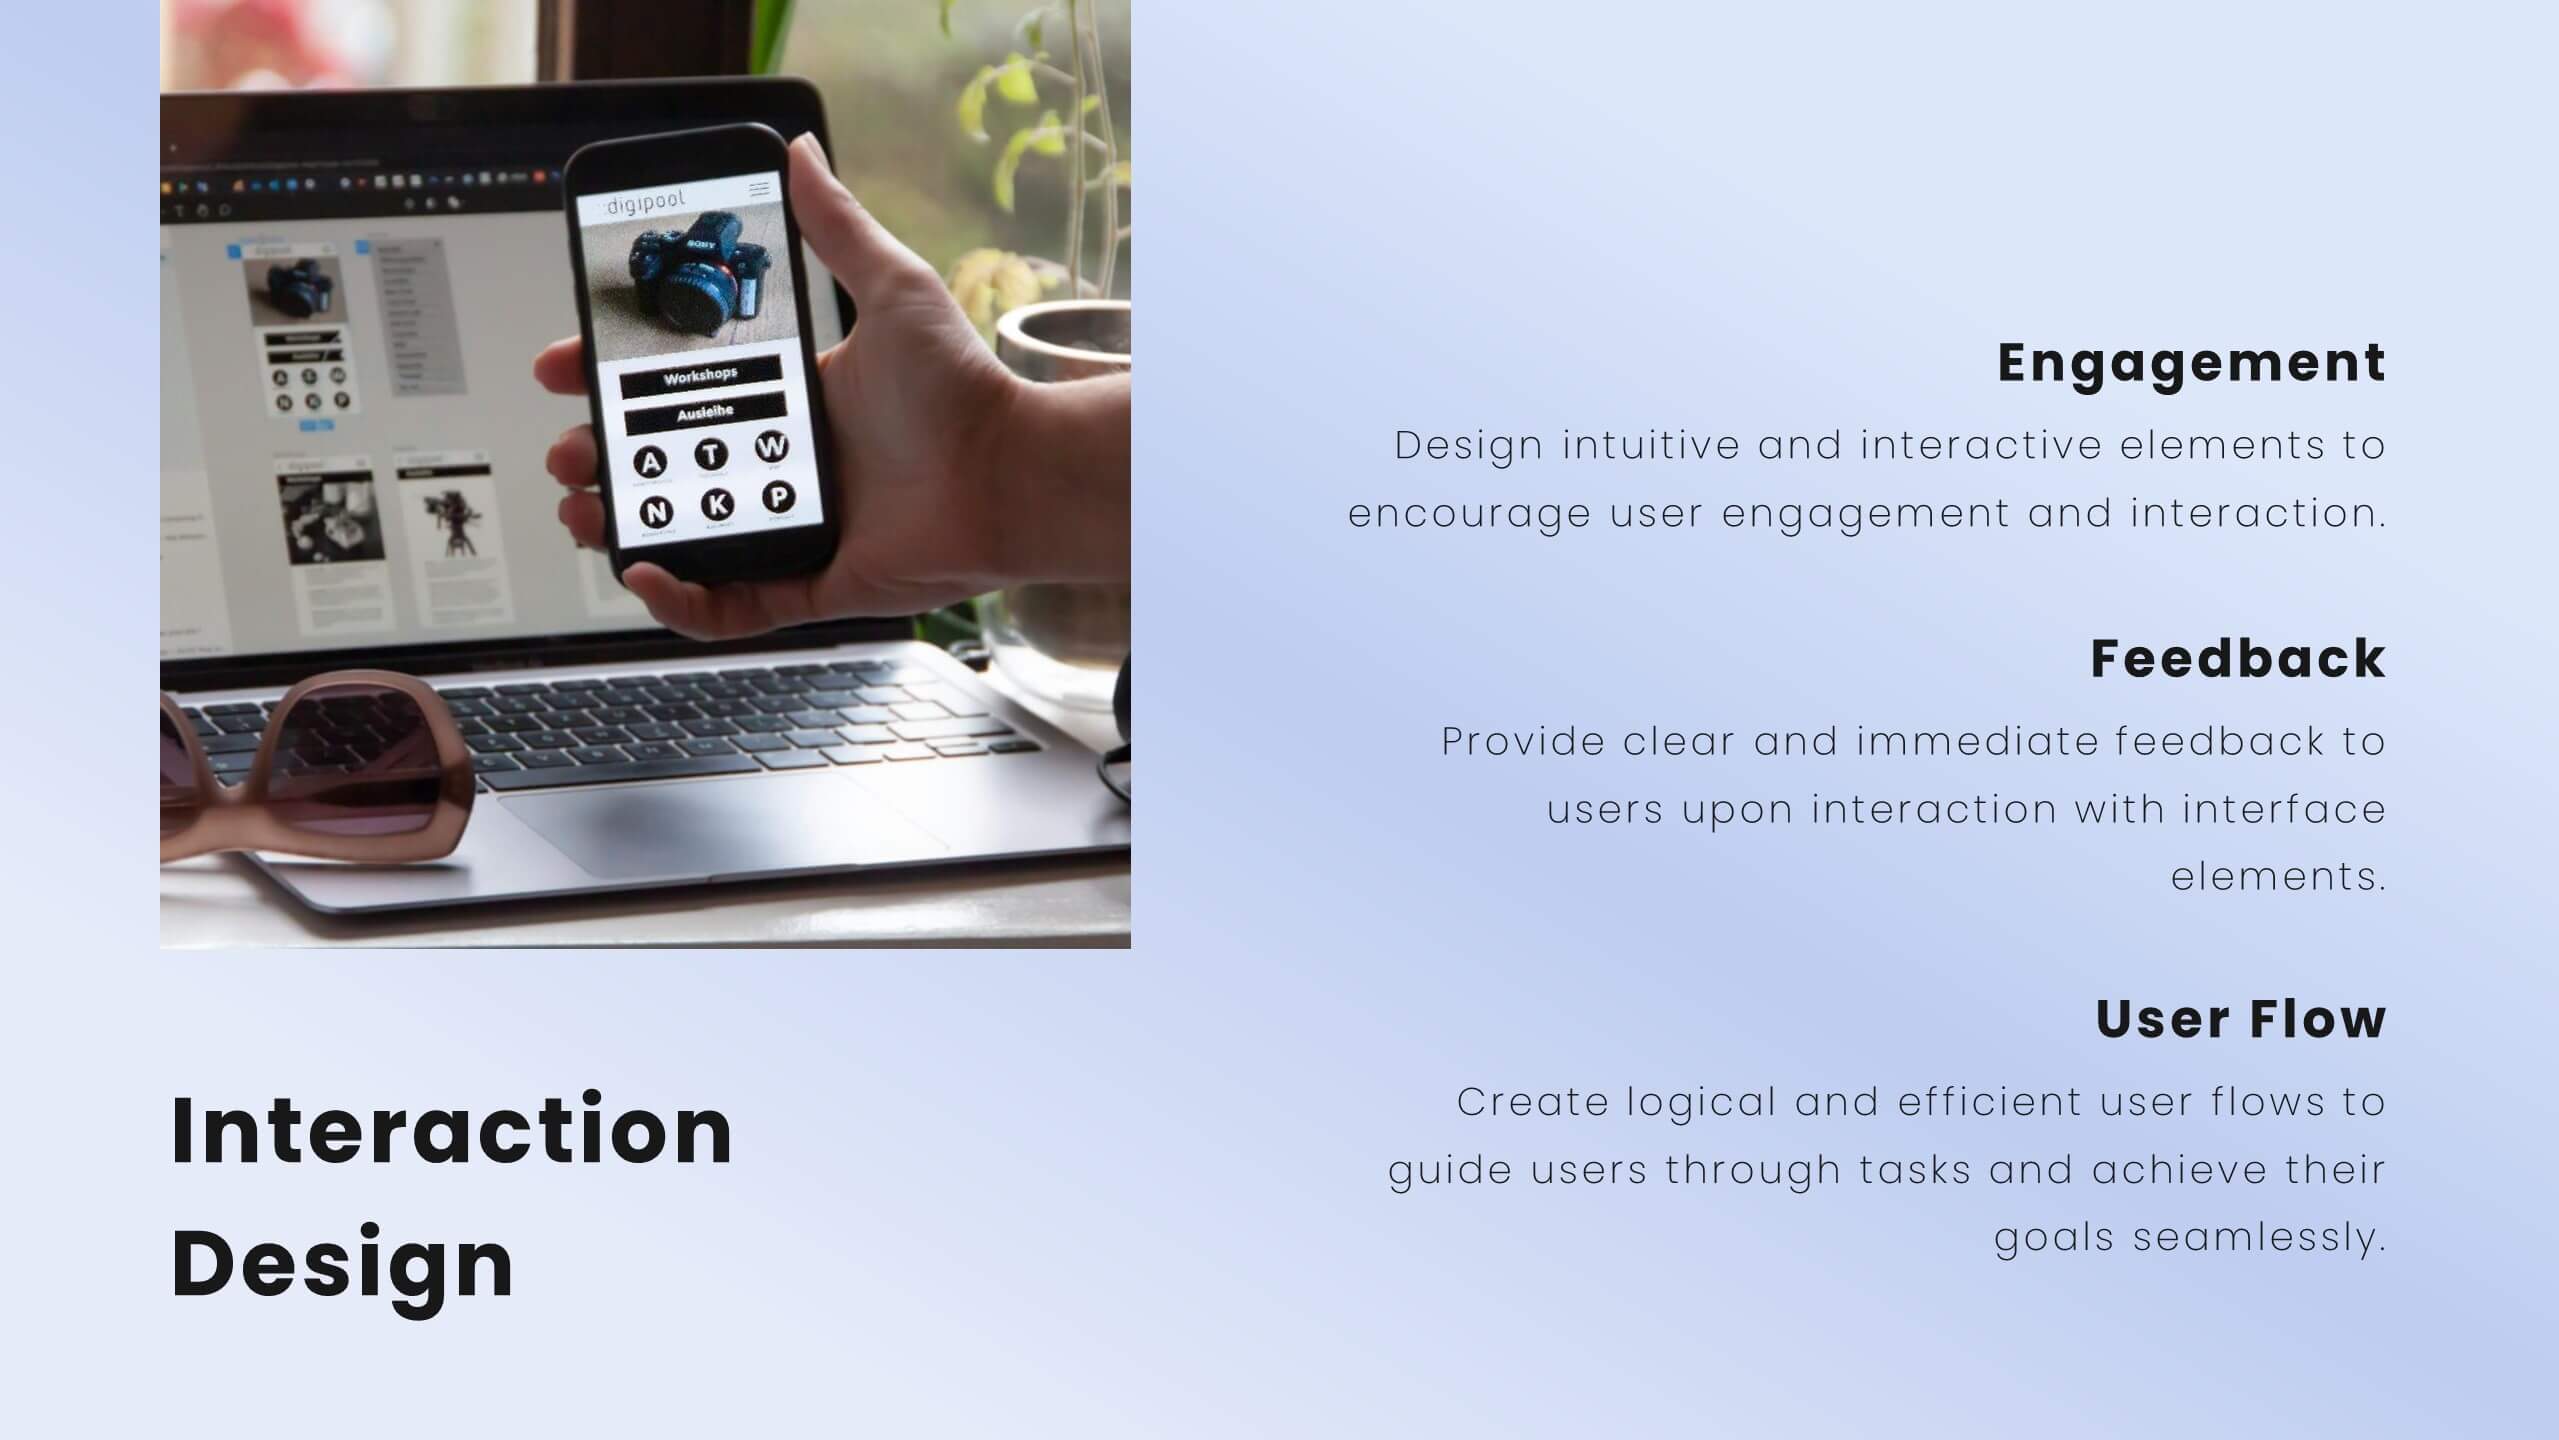
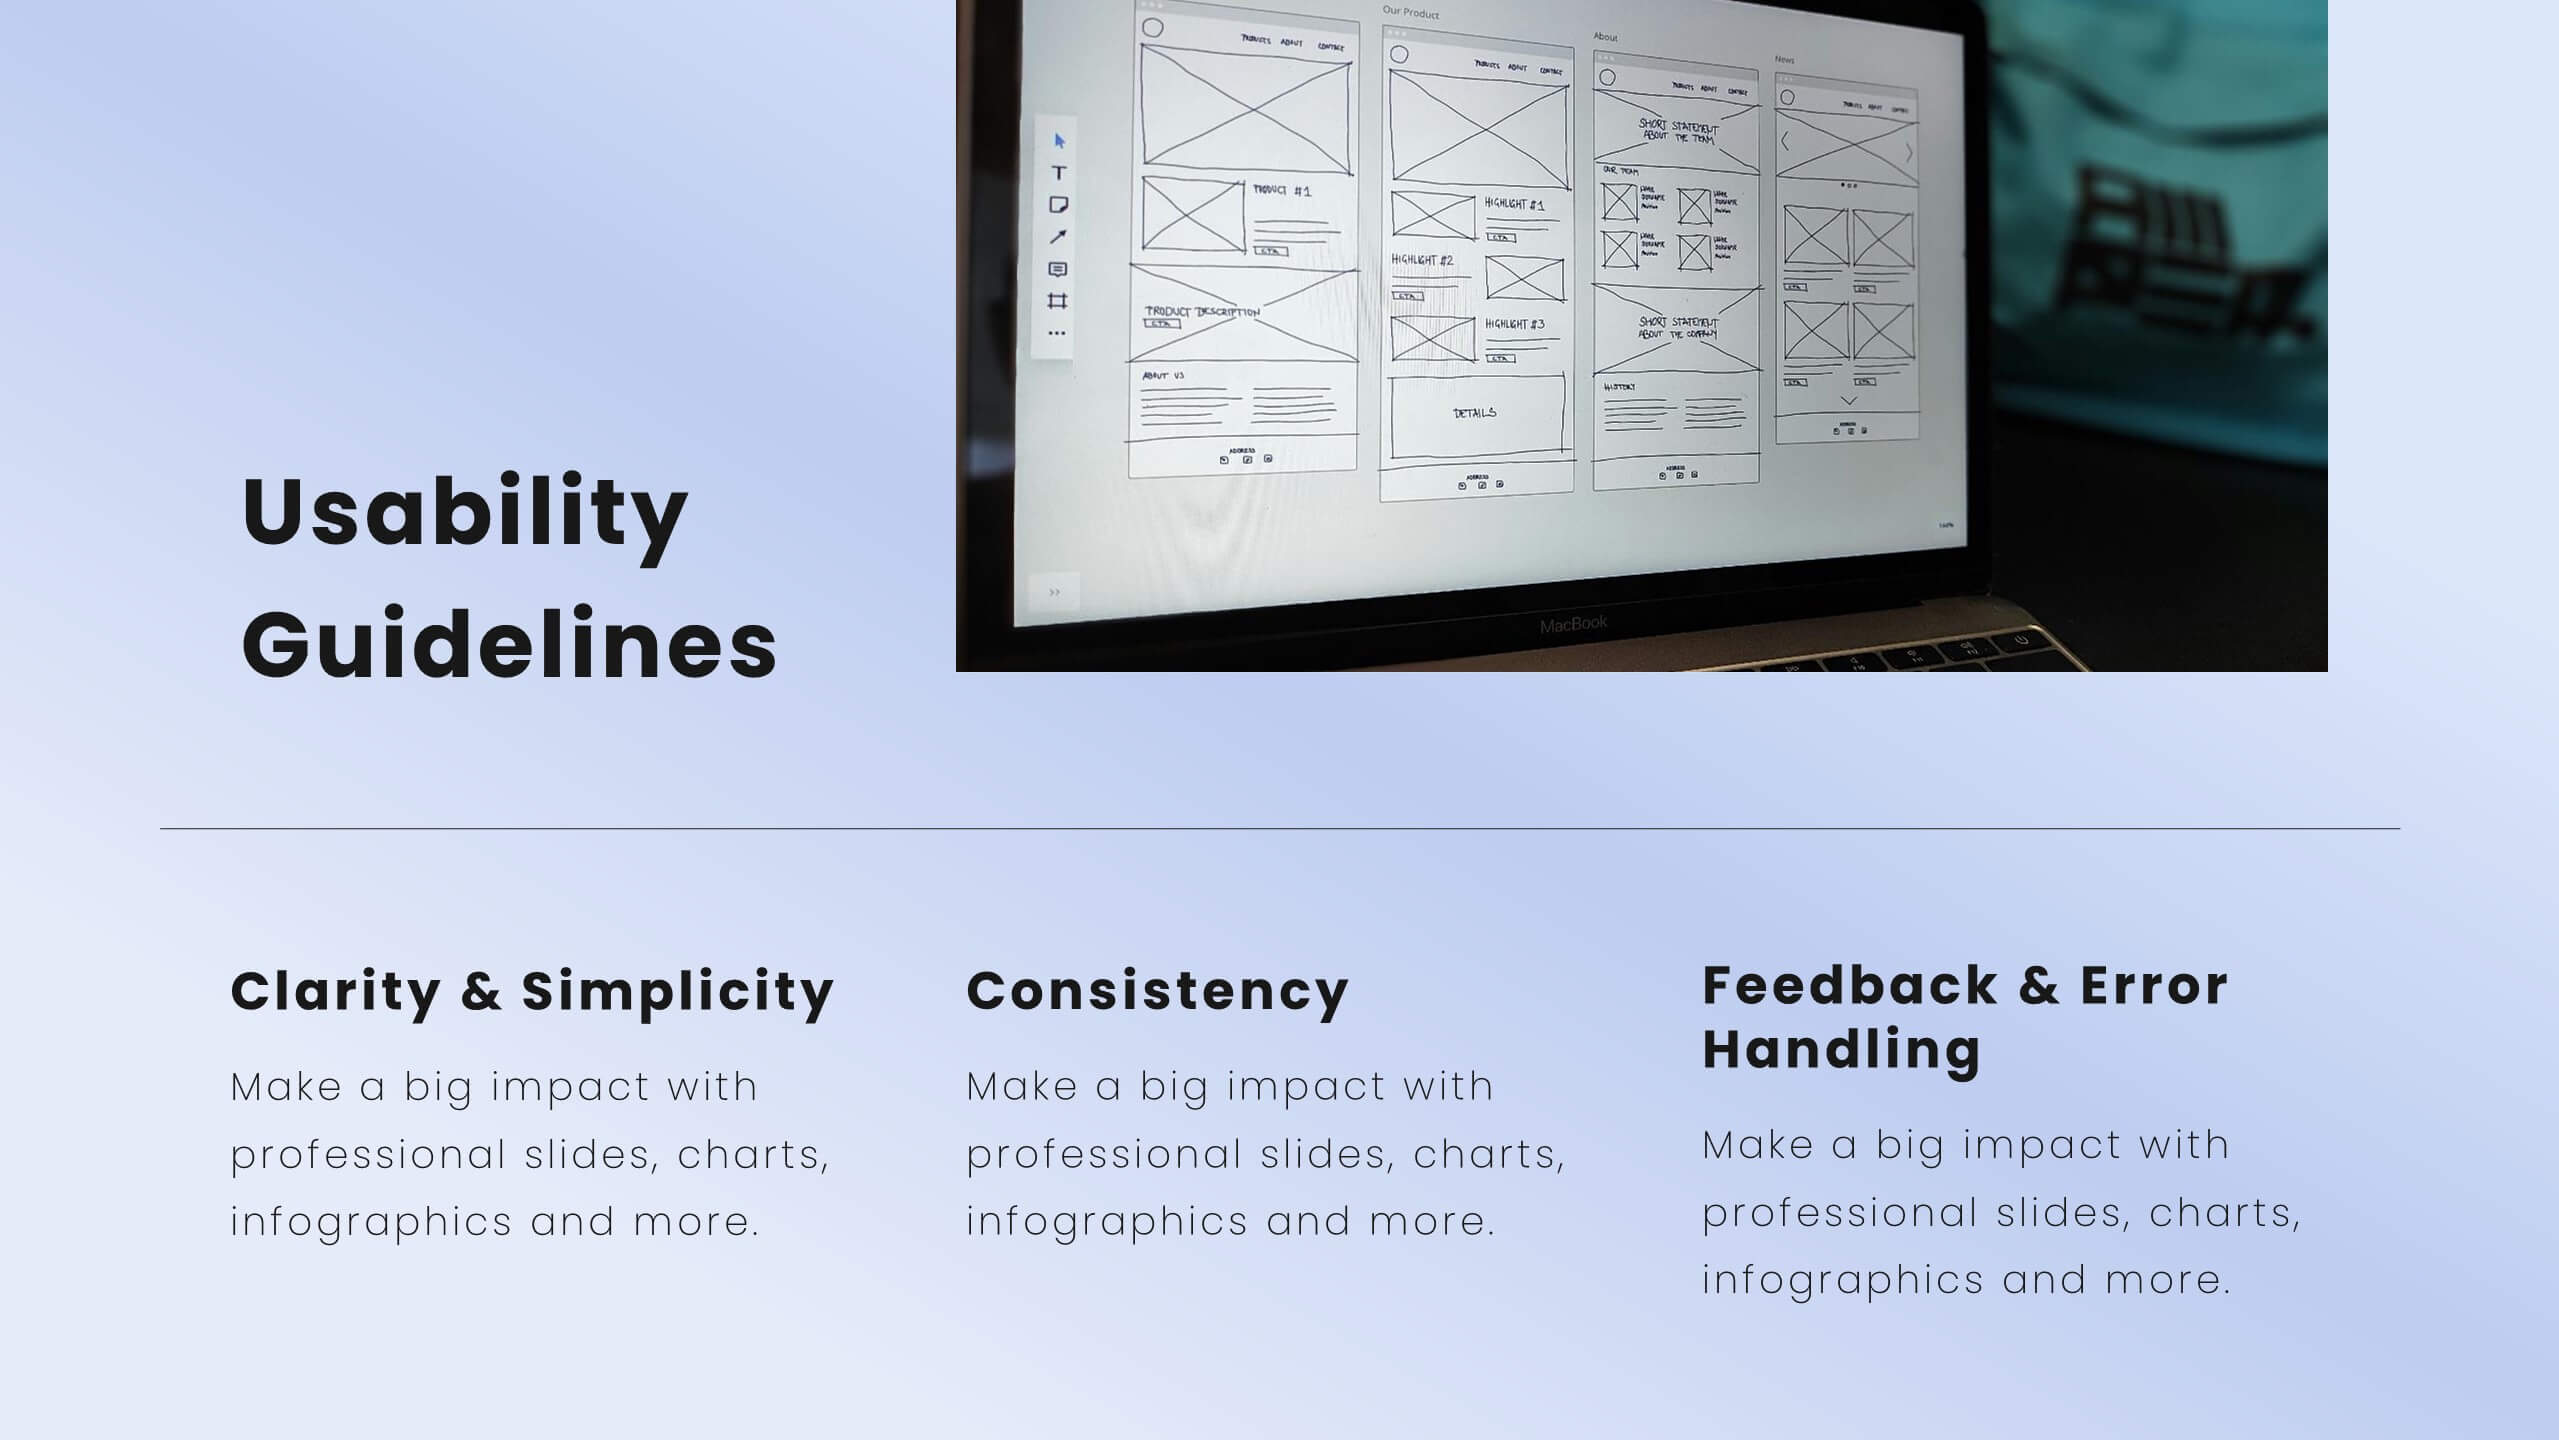
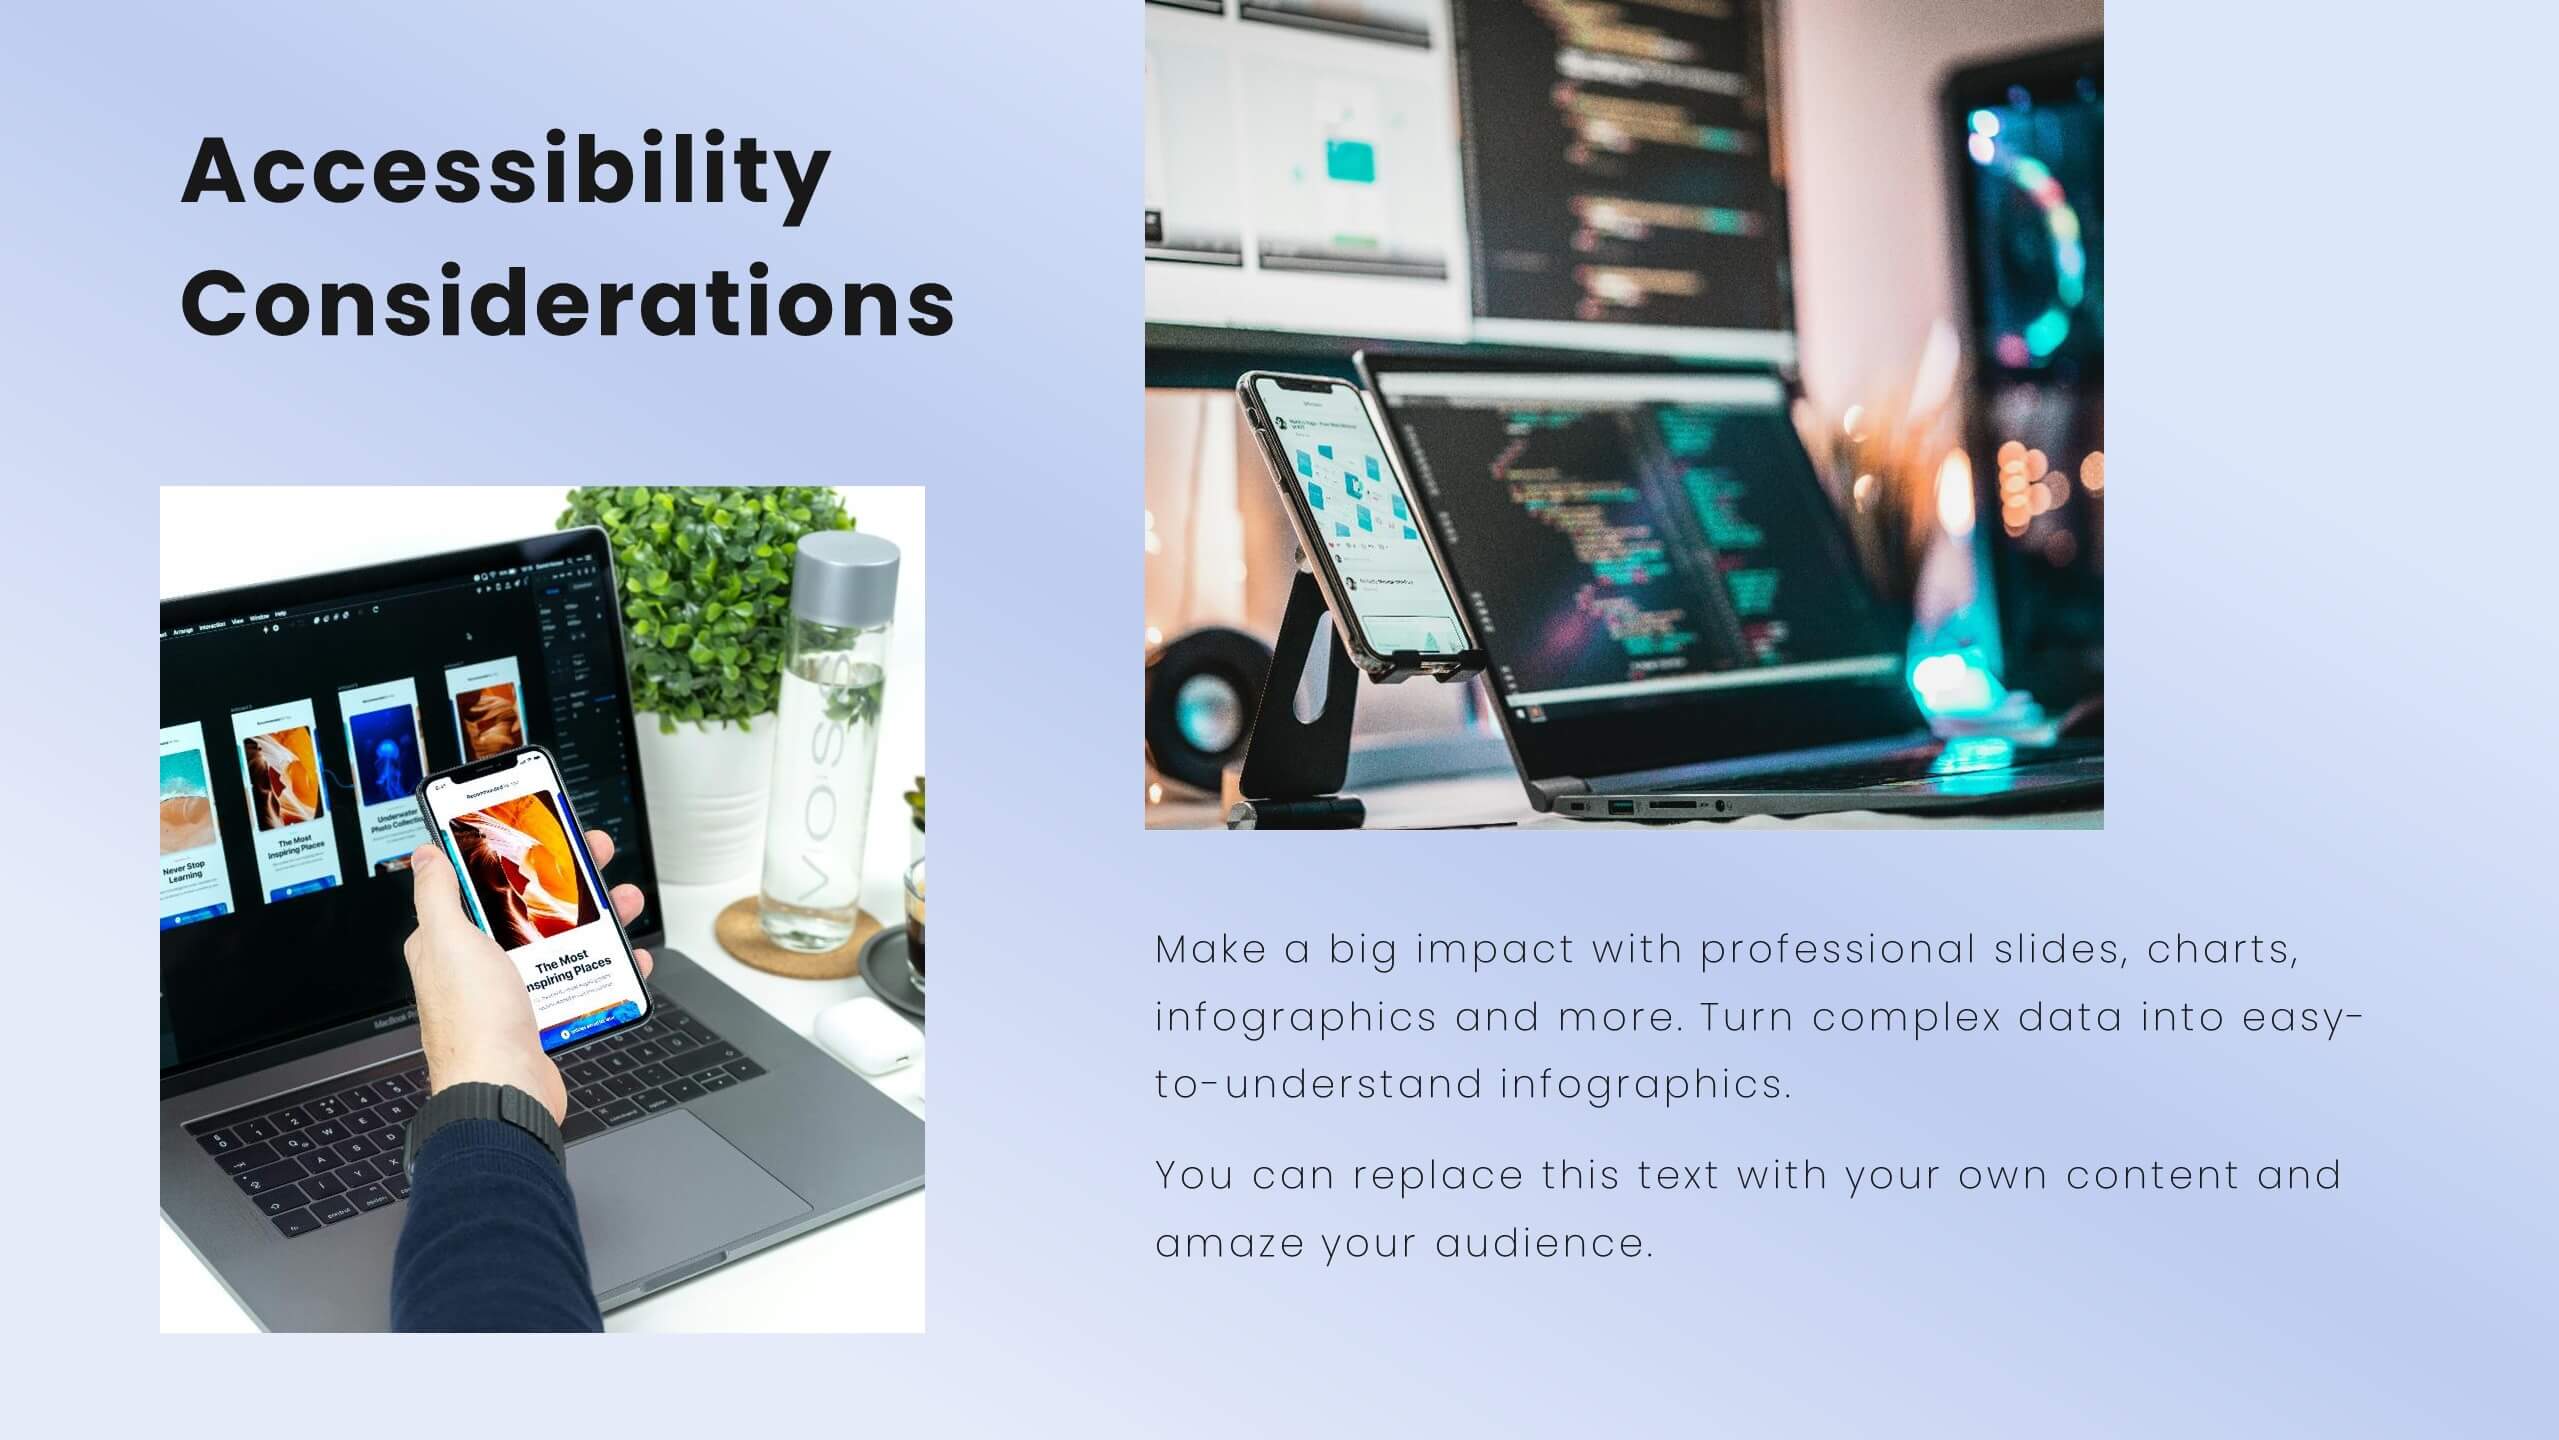
Jigsaw User Experience Proposal Presentation
Enhance user experience with this comprehensive UX proposal template! Perfect for outlining user research, personas, and design principles. Ideal for UX/UI designers aiming to present their strategies and solutions. Compatible with PowerPoint, Keynote, and Google Slides, this template ensures your UX proposals are clear, professional, and impactful. Create exceptional user experiences today!