


Características


¿Tienes alguna pregunta?
Recomendar


6 diapositivas
Aviation Center Infographic
An aviation center refers to a facility or institution that is dedicated to activities related to aviation, which includes the design, development, manufacturing, maintenance, operation, and training associated with aircraft and aerospace technology. This engaging infographic template provides a concise and visually appealing overview of an aviation center's facilities, services, and offerings. This infographic plays a vital role in advancing the aviation industry, conducting research, offering training, and providing resources for aviation professionals and enthusiasts. This is the perfect template to encourage potential pilots and aviation enthusiasts.


6 diapositivas
Business Growth Metrics Butterfly Chart
Highlight performance patterns and opportunities with the Business Growth Metrics Butterfly Chart Presentation. This engaging layout uses mirrored radial segments to present six growth indicators—ideal for tracking progress across two categories, departments, or timeframes. The butterfly-shaped curves draw the viewer’s attention to the center, making comparisons intuitive and visually balanced. Fully customizable in PowerPoint, Keynote, and Google Slides, this template is perfect for showcasing KPI trends, sales metrics, or marketing performance.


7 diapositivas
PESTEL Analysis Infographic Presentation Template
A PESTEL Analysis Infographic is a great tool to highlight the risks and opportunities of a market. Based on the needs of your customers, this Infographic can help you communicate key information about competition, regulatory environment and economic outlook. This template can also be used for stocks of any company from any industry. This is a comprehensive pestel analysis infographic that will show you the factors that are driving and restraining the growth of your industry. This template can help companies to identify their weaknesses and drive their strengths with the pestel analysis.


13 diapositivas
Organizational Company Profile Presentation
Elevate your business overview with this straightforward Company Profile template. The opening slide announces the essence of your business, preparing the audience for a journey through your organizational landscape. Structured to highlight the key areas of your business, the template includes an 'About Us' section, laying out your mission and vision. Learn about the dedicated team behind the success with the 'Meet Our Team' slide, providing a personal touch to your corporate identity. Set clear, achievable goals with a slide dedicated to outlining your short-term and long-term objectives. Engage your audience with a 'Business Facts' slide that provides tangible insights into your company's performance. Finally, the 'Contact Us' slide offers a clear invitation for further dialogue, fostering potential partnerships. Ideal for those searching for a comprehensive yet accessible company presentation, this template is designed to convey your business strengths and opportunities effectively.


5 diapositivas
Market Segmentation Strategy Presentation
Refine your approach with our "Market Segmentation Strategy" presentation template. Perfect for marketers looking to target specific consumer bases, this layout visually divides your market into manageable segments. It's ideal for presentations on market analysis and targeted marketing strategies, ensuring compatibility with PowerPoint, Keynote, and Google Slides to accommodate any presentation environment.


21 diapositivas
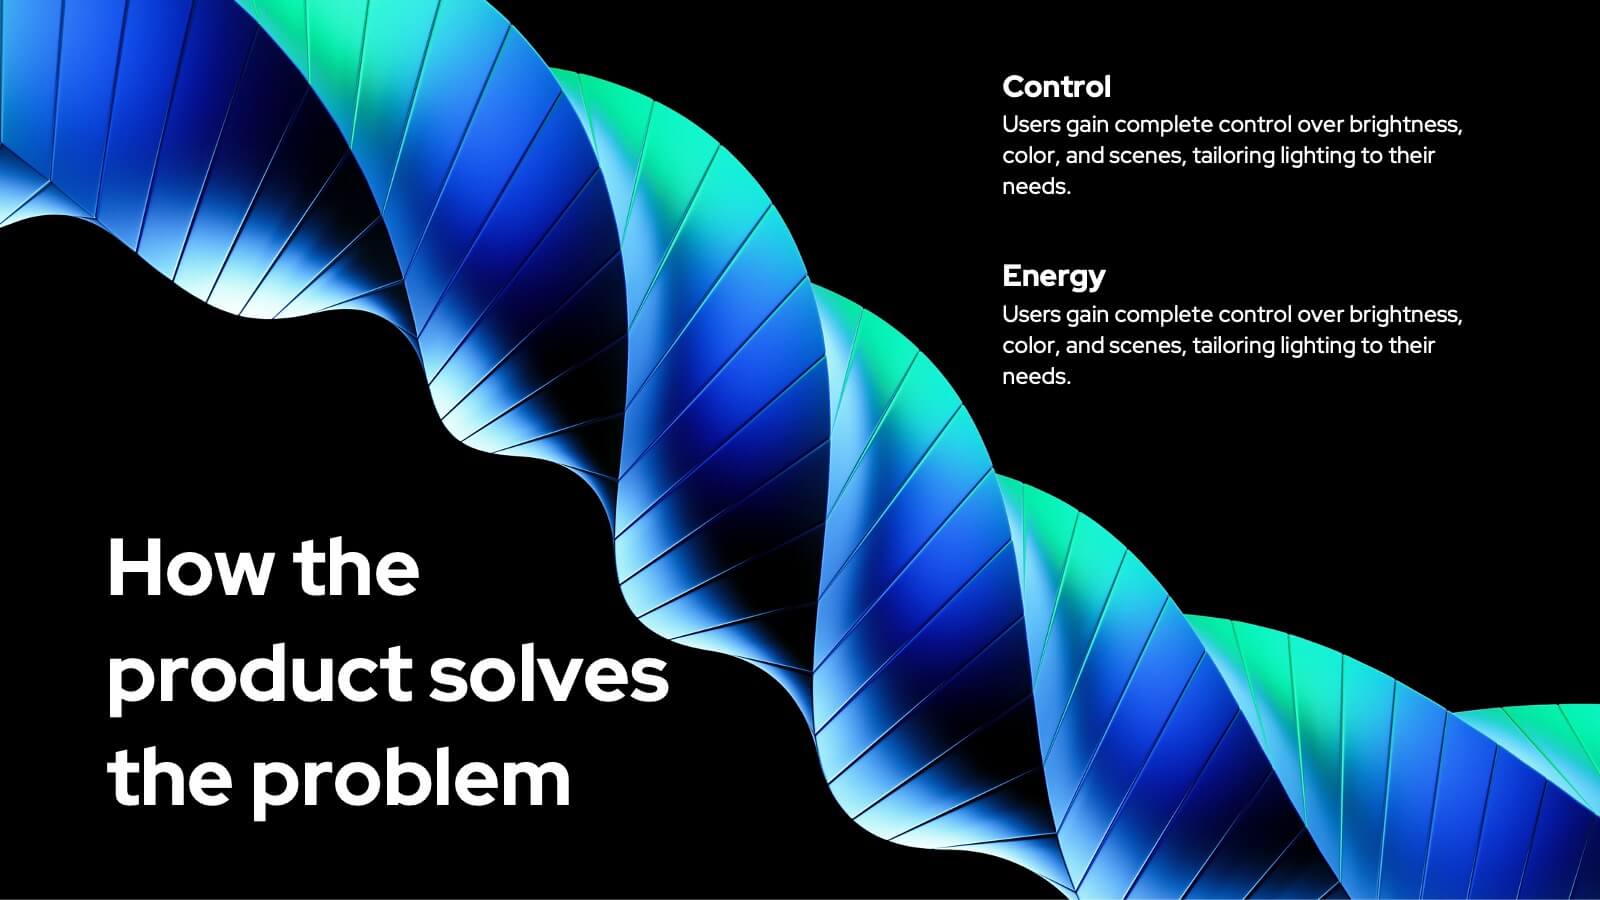
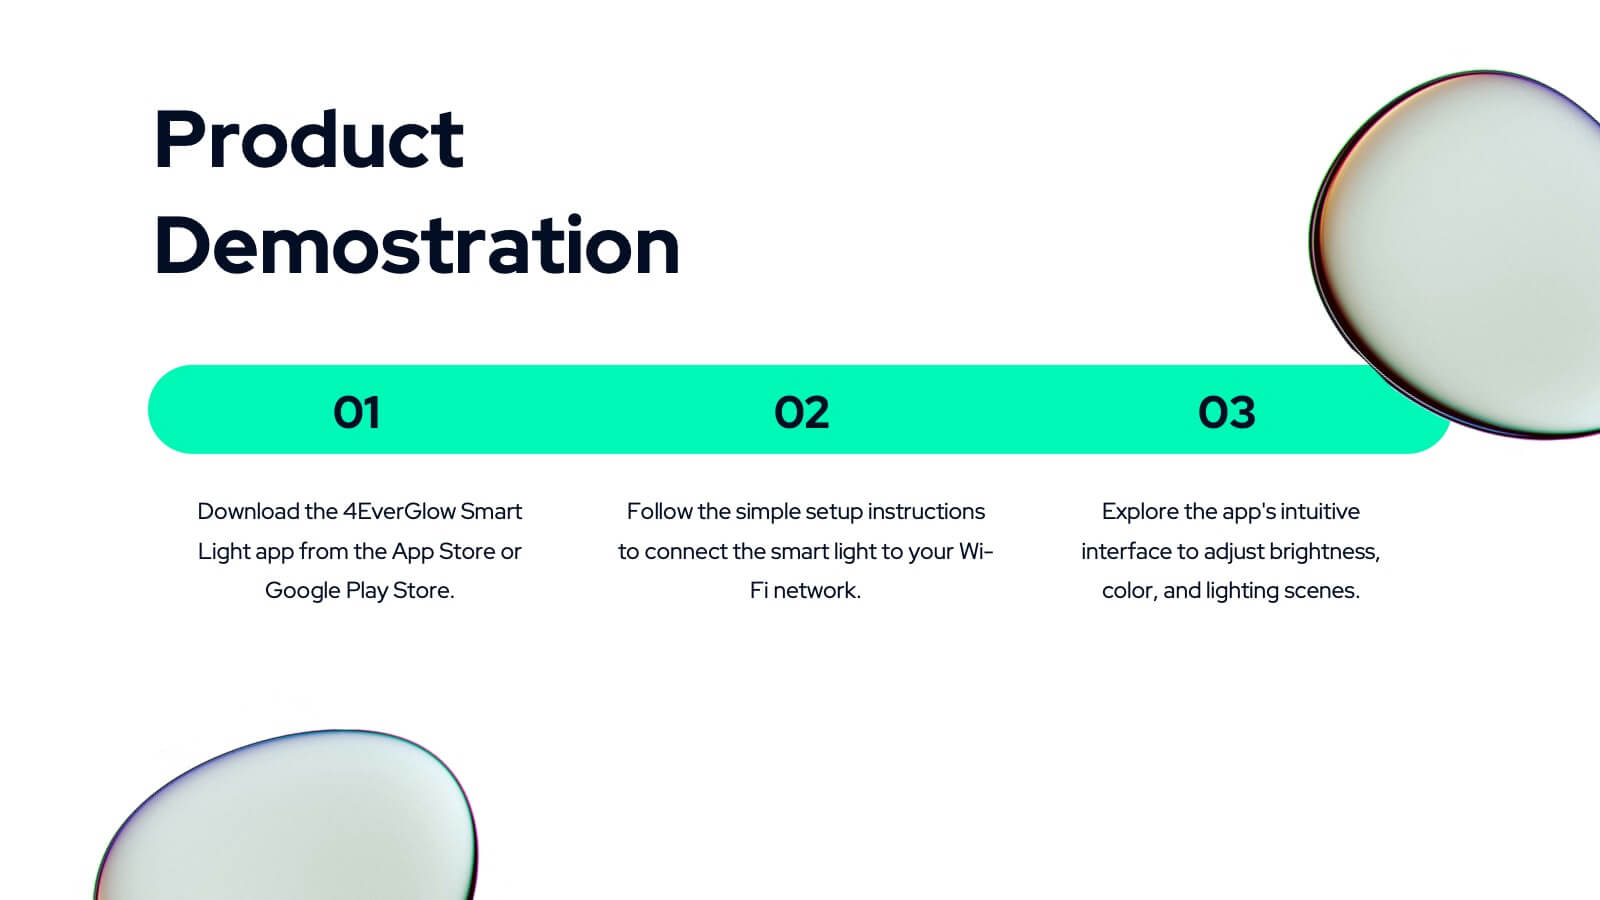
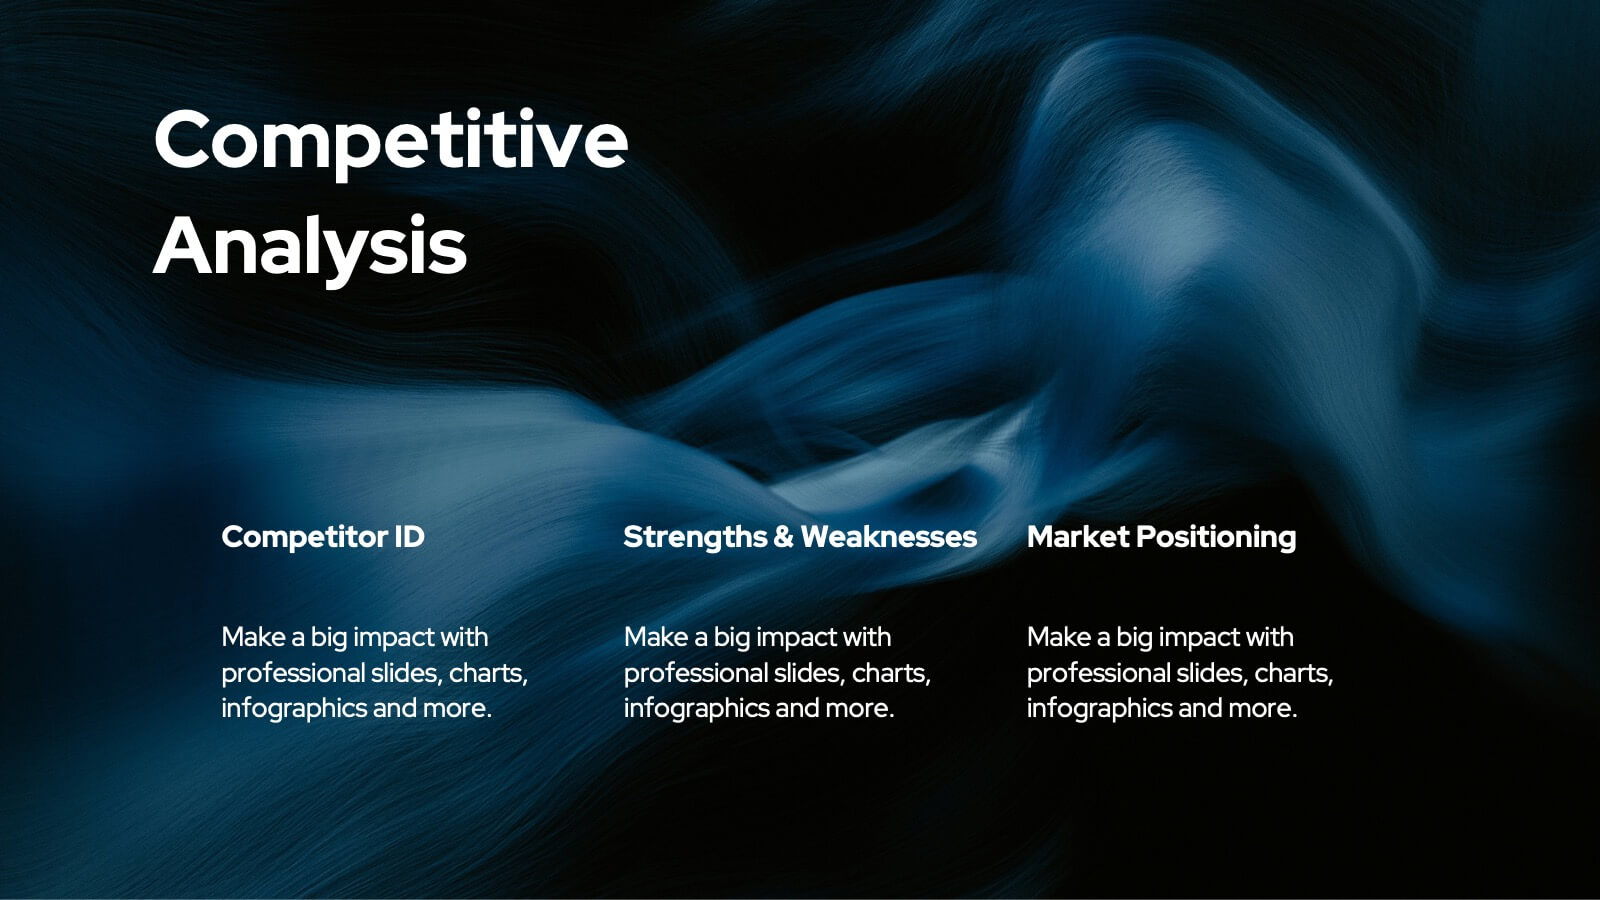
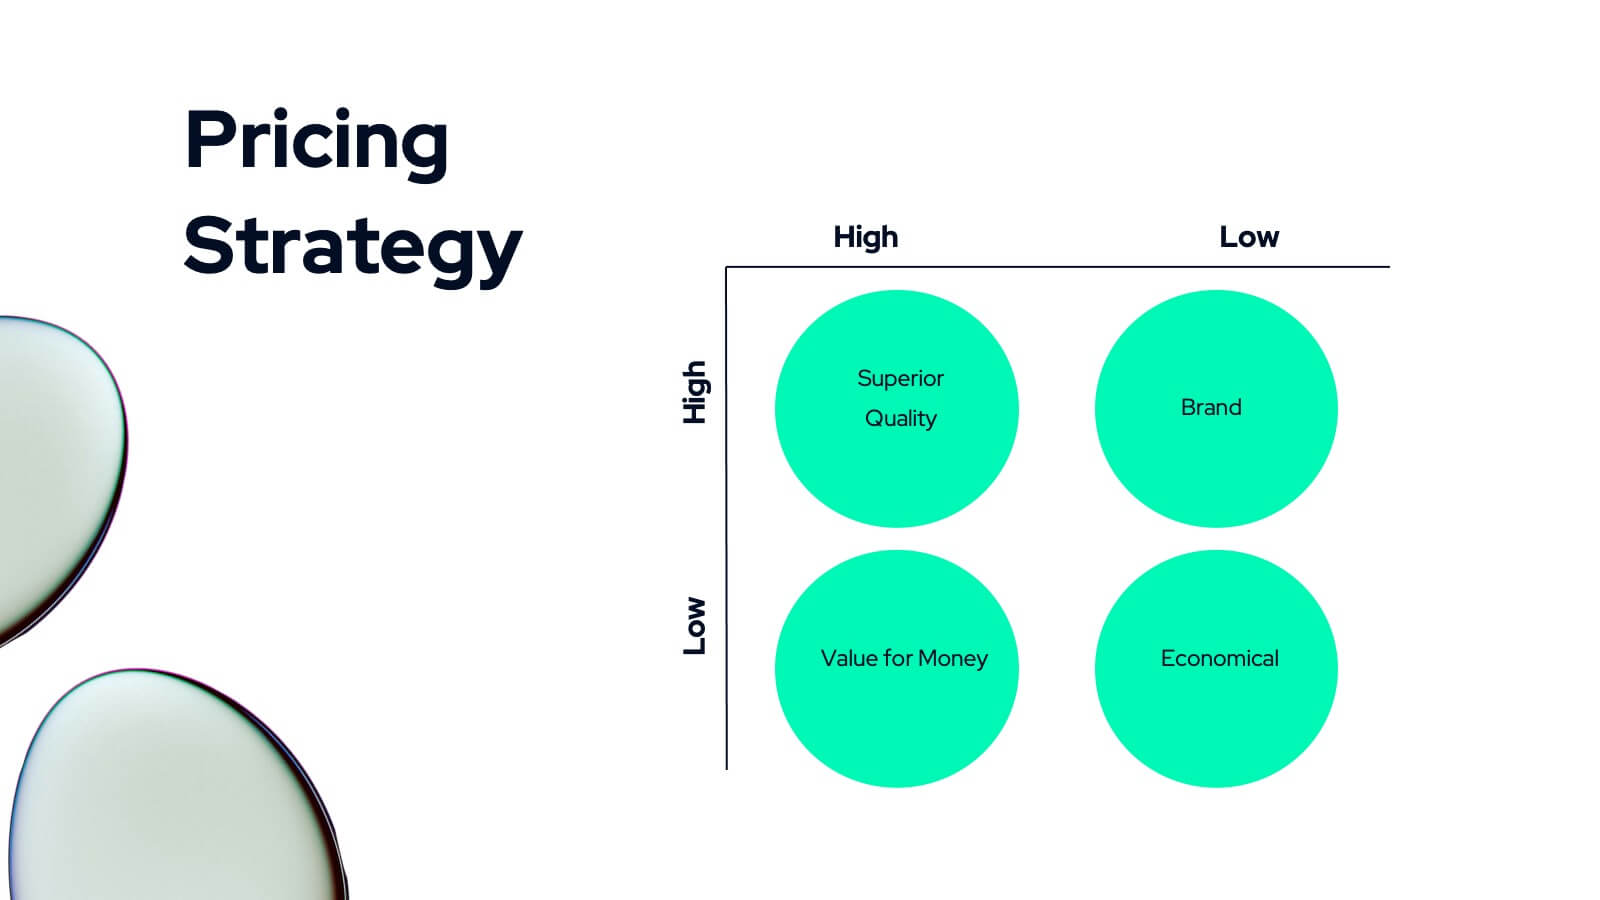
Selkie New Product Proposal Presentation
Dive into your next big idea with this sleek, Selkie-inspired presentation template, designed for presenting a new product proposal! Highlight key features, market opportunities, and potential growth in a visually captivating format that flows effortlessly. Engage your audience and make an impact. Compatible with PowerPoint, Keynote, and Google Slides for easy customization.


23 diapositivas
Meteor New Product Proposal Presentation
The Meteor New Product Proposal template is the perfect tool for presenting your innovative ideas in a bold and professional manner. With its striking yellow and black color scheme, this template grabs attention while maintaining a clean and modern aesthetic. It’s designed to help you effectively communicate your product’s potential, covering key aspects such as problem statement, solution, market opportunity, competitive landscape, and unique selling proposition. The template also includes sections for financials, growth projections, and risk analysis, ensuring that every critical detail is covered. Ideal for startups, product managers, and marketers, this template is fully compatible with PowerPoint, Keynote, and Google Slides, making it easy to customize and present on any platform. Impress investors, stakeholders, or team members with a comprehensive and visually compelling proposal that highlights the strengths and opportunities of your new product.


20 diapositivas
Vivid Product Development Plan Presentation
Develop your product with confidence using this detailed product development plan template! Perfect for outlining features, market analysis, and competitive advantages. Ideal for product managers and teams. Compatible with PowerPoint, Keynote, and Google Slides, this template ensures your plan is clear, professional, and comprehensive. Achieve product success today!


5 diapositivas
Medical Systems and Drug Research Overview Presentation
Present critical insights with this heart-themed infographic, ideal for showcasing medical systems, drug development stages, or treatment data. The visual layout supports four key points with a clear, engaging style. Fully customizable in PowerPoint, Keynote, and Google Slides—perfect for researchers, healthcare analysts, and pharmaceutical presentations.


4 diapositivas
Vision Statement Slide Presentation
Spark inspiration from the very first slide with a clean, modern layout designed to express future goals with clarity and confidence. This presentation helps teams communicate direction, long-term aspirations, and strategic focus in a simple, structured format. Fully compatible with PowerPoint, Keynote, and Google Slides.


6 diapositivas
Body Anatomy Infographic
Anatomy refers to the biological structures and systems that make up the body reproductive and organs, as well as other physiological unique features. This infographic template is a visual representation that provides information about the various structures and systems within the anatomy. This can be a valuable educational tool for understanding the anatomy and functions of reproductive and other related systems. This informative Anatomy Infographic can serve as a valuable resource for educational settings, healthcare professionals, and anyone interested in understanding the complexities of the body.


22 diapositivas
Crystal Business Plan Presentation
This business plan template is ideal for presenting strategies, conference overviews, and session details. With slides for keynote speakers, breakout sessions, and networking breaks, it offers a dynamic and professional layout. Compatible with PowerPoint, Keynote, and Google Slides, it ensures a clear and organized flow for any business presentation.


6 diapositivas
Agriculture Jobs Infographic
Agriculture jobs encompass a wide range of career opportunities that involve the cultivation, production, processing, and distribution of crops, livestock, and other agricultural products. This infographic template showcases the diversity of jobs within the agriculture industry, highlighting the roles, required skills, and potential career growth. This infographic can be organized into different categories of agriculture jobs, such as Farming and Crop Production, Livestock Management, Agricultural Engineering, and Agricultural Research. This template is compatible with Powerpoint, Keynote, and Google Slides.


6 diapositivas
Big Data Analytics Presentation
The "Big Data Analytics Presentation" template is expertly designed to visualize global data analytics strategies across different regions. The map highlights key areas in distinct colors, drawing attention to where data initiatives are being implemented or where significant market trends are observed. Each region on the map corresponds to specific titles that can be customized to represent various analytical focuses such as market penetration, user demographics, or revenue growth. Accompanying the map are percentage circles that quantify planning, execution, and success rates, making this template invaluable for analysts, data scientists, and corporate strategists who need to present complex data in an easily digestible format. This visual tool is perfect for enhancing presentations, strategic meetings, and reports with a clear, concise, and visually engaging representation of data-driven insights.


4 diapositivas
Global Business Distribution Layout Presentation
Visualize your company’s international footprint with this Global Business Distribution Layout. Perfect for showcasing market reach, branch networks, or regional performance. Features a clean world map design with customizable highlight zones. Fully editable in PowerPoint, Keynote, and Google Slides—ideal for corporate overviews, investor decks, and business expansion presentations.


5 diapositivas
Secure Cloud Storage and Access Presentation
Highlight your data protection strategy with the Secure Cloud Storage and Access presentation slide. Featuring a central cloud shield icon with five connected callouts, it’s perfect for illustrating encryption methods, access protocols, or compliance points. Fully editable in PowerPoint, Keynote, and Google Slides.


5 diapositivas
Scientific Process and Research Framework Presentation
Present each stage of your scientific research with clarity using this linear flow diagram. Ideal for breaking down experiments, protocols, or academic processes into structured phases. Features labeled sections, icons, and directional arrows to guide your audience. Fully editable in PowerPoint, Keynote, and Google Slides to match your content needs.