


Características


¿Tienes alguna pregunta?
Recomendar


5 diapositivas
Strategic HR Planning with Skills Gap Analysis
Lead with insight. The Strategic HR Planning with Skills Gap Analysis slide is your go-to tool for aligning talent strategy with organizational needs. Ideal for showcasing workforce priorities, skill readiness, and actionable development plans—fully editable in PowerPoint, Keynote, and Google Slides.


6 diapositivas
Interview Question Infographic
Illuminate the path to insightful dialogue with our sleek Infographic Template, a visual masterpiece designed to make every question count! With its chic, minimalist design, this template pairs clean lines and soft colors to create an environment where information stands out and engagement flourishes. Perfect for those looking to elevate dialogue, whether through educational content, team meetings, or customer interactions, this tool makes communication clear and effective. It elegantly balances text and imagery, turning complex questions into easy-to-understand visuals that captivate and inform. Adaptable to various contexts, this template allows for full customization to match your brand’s aesthetic, ensuring that your message not only resonates but also reflects your unique style. Ideal for use in digital forums, presentations, or as part of interactive guides, it ensures your points are both seen and remembered, making every interaction more meaningful.


5 diapositivas
Social Myths & Facts Infographics
A Social Myth might be a certain belief, while a Social Fact would be the correct answer with data. This engaging and informative Infographics template is designed to help you dispel common misconceptions and provide accurate information on various social topics. With this template you can cover stereotypes, challenge myths, or present facts to promote understanding and awareness. The template features a modern design with vibrant colors and captivating visuals, making it visually appealing and easy to navigate. It includes a variety of design elements such as icons, illustrations and timelines that can all be customized.


8 diapositivas
End-to-End Project Lifecycle Management Presentation
Visualize each phase of your project lifecycle with this clean, circular flow layout. Ideal for showcasing planning, execution, and delivery stages in a structured loop. Each segment is fully editable to match your content. Compatible with PowerPoint, Google Slides, and Keynote for effortless customization and professional results.


4 diapositivas
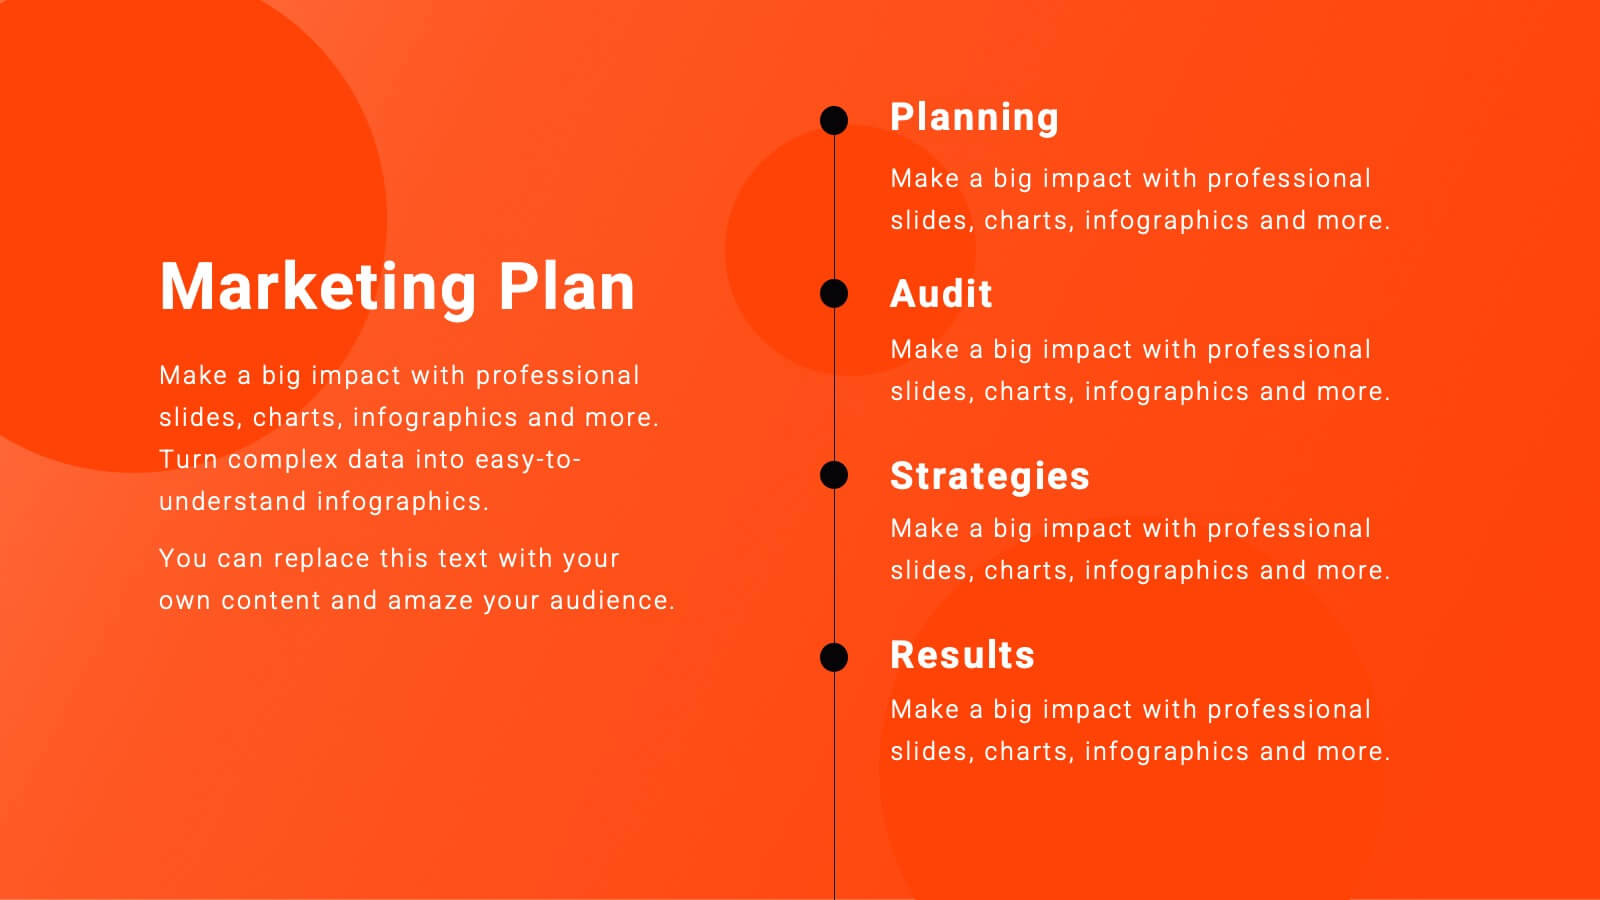
Cyber Threat Prevention Strategies Presentation
Clearly communicate your cybersecurity roadmap using this sleek timeline-style slide design. Each step is represented by a distinct icon and color-coded milestone, ideal for outlining protocols such as threat detection, employee training, or system hardening. Designed for IT teams, security analysts, and corporate risk departments. Fully editable and compatible with PowerPoint, Keynote, and Google Slides.
8 diapositivas
Creative Alphabet Visual Reference Presentation
This creative presentation uses a bold A–B–C visual structure to highlight key points in a clean, modern layout. Ideal for overviews, comparisons, or step-by-step frameworks. Fully customizable in Canva, it balances design and clarity—perfect for business strategies, education, or visual storytelling with strong alphabetical cues and icon integration.


32 diapositivas
Willowshade Brand Guidelines Proposal Presentation
This dynamic presentation template is tailored to define and showcase comprehensive brand guidelines. Key sections include logo design, typography, color palette, imagery, brand voice, and values, ensuring brand consistency across platforms. It also features areas for target audience analysis, market research, competitive landscape, and unique selling propositions to reinforce strategic positioning. Visual examples for website, social media, packaging, and advertising highlight real-world applications. Fully customizable and compatible with PowerPoint, Keynote, and Google Slides.


21 diapositivas
Terraflare Project Status Report Presentation
Keep stakeholders updated with this comprehensive project status report template, featuring agenda, key highlights, performance metrics, project progress, risk assessments, and goals. Easily track progress, strategic initiatives, and team productivity. Perfect for PowerPoint, Keynote, and Google Slides, ensuring clear communication of project updates and priorities.

23 diapositivas
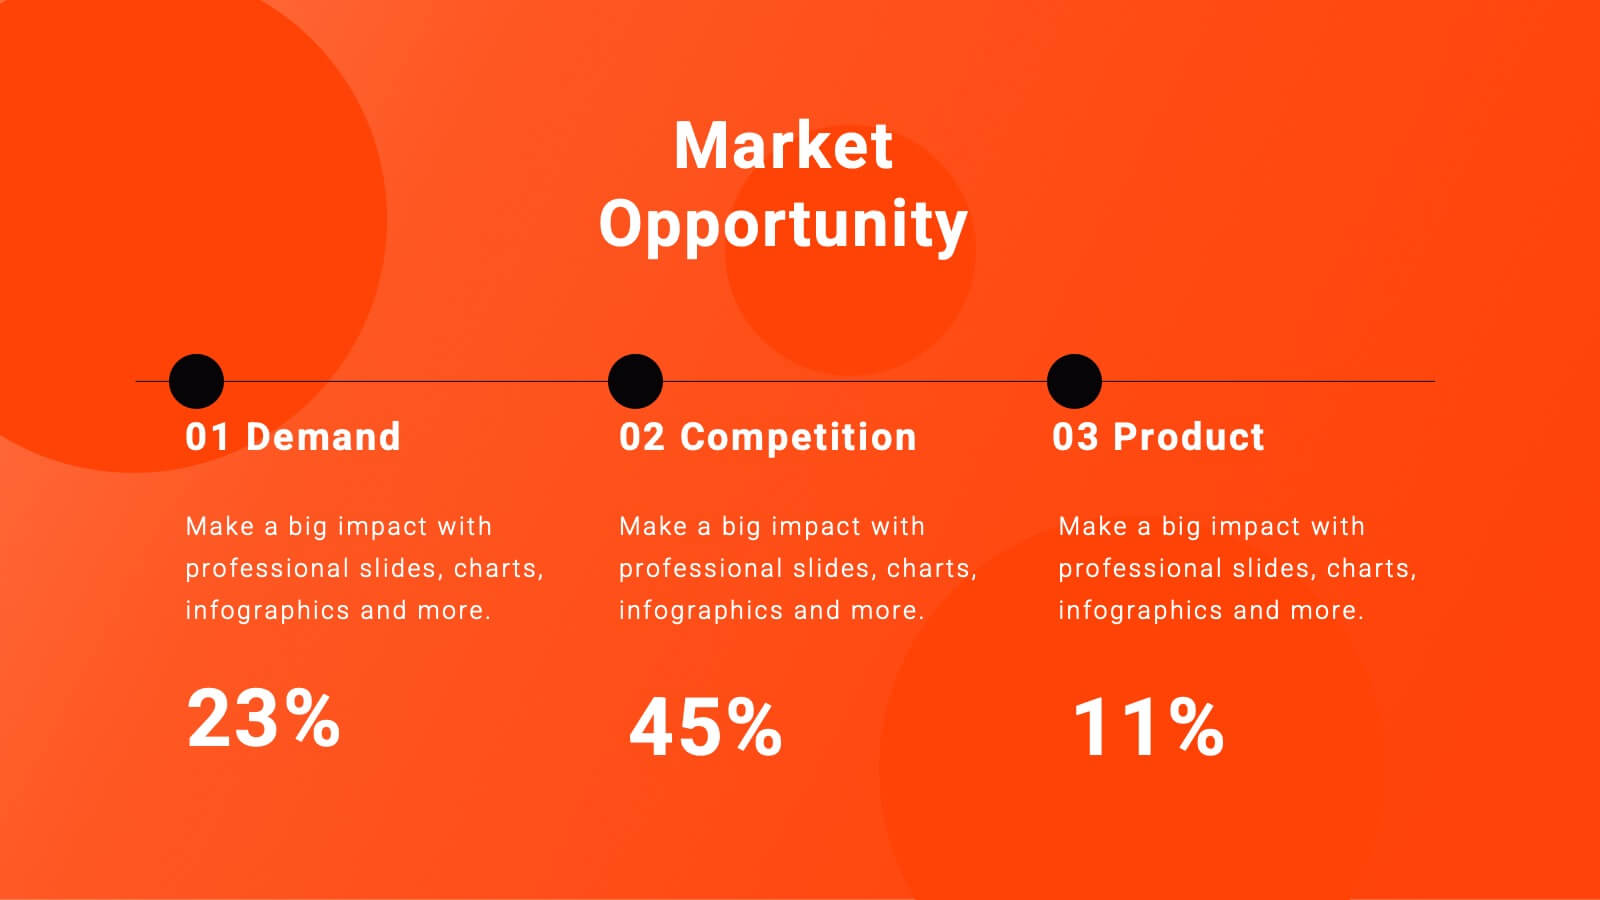
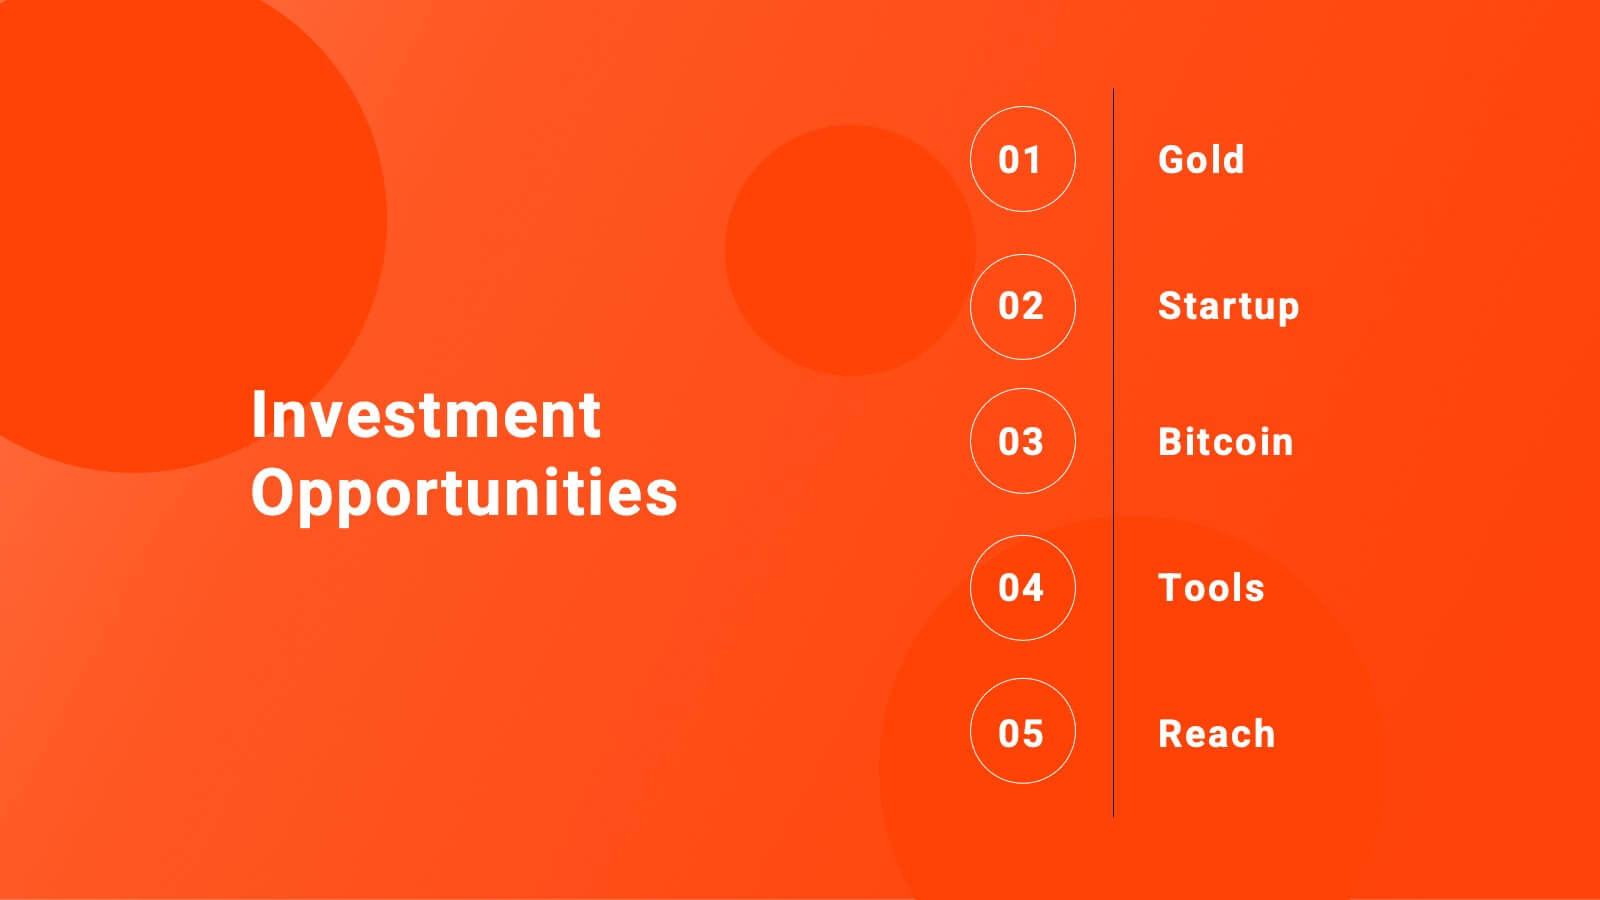
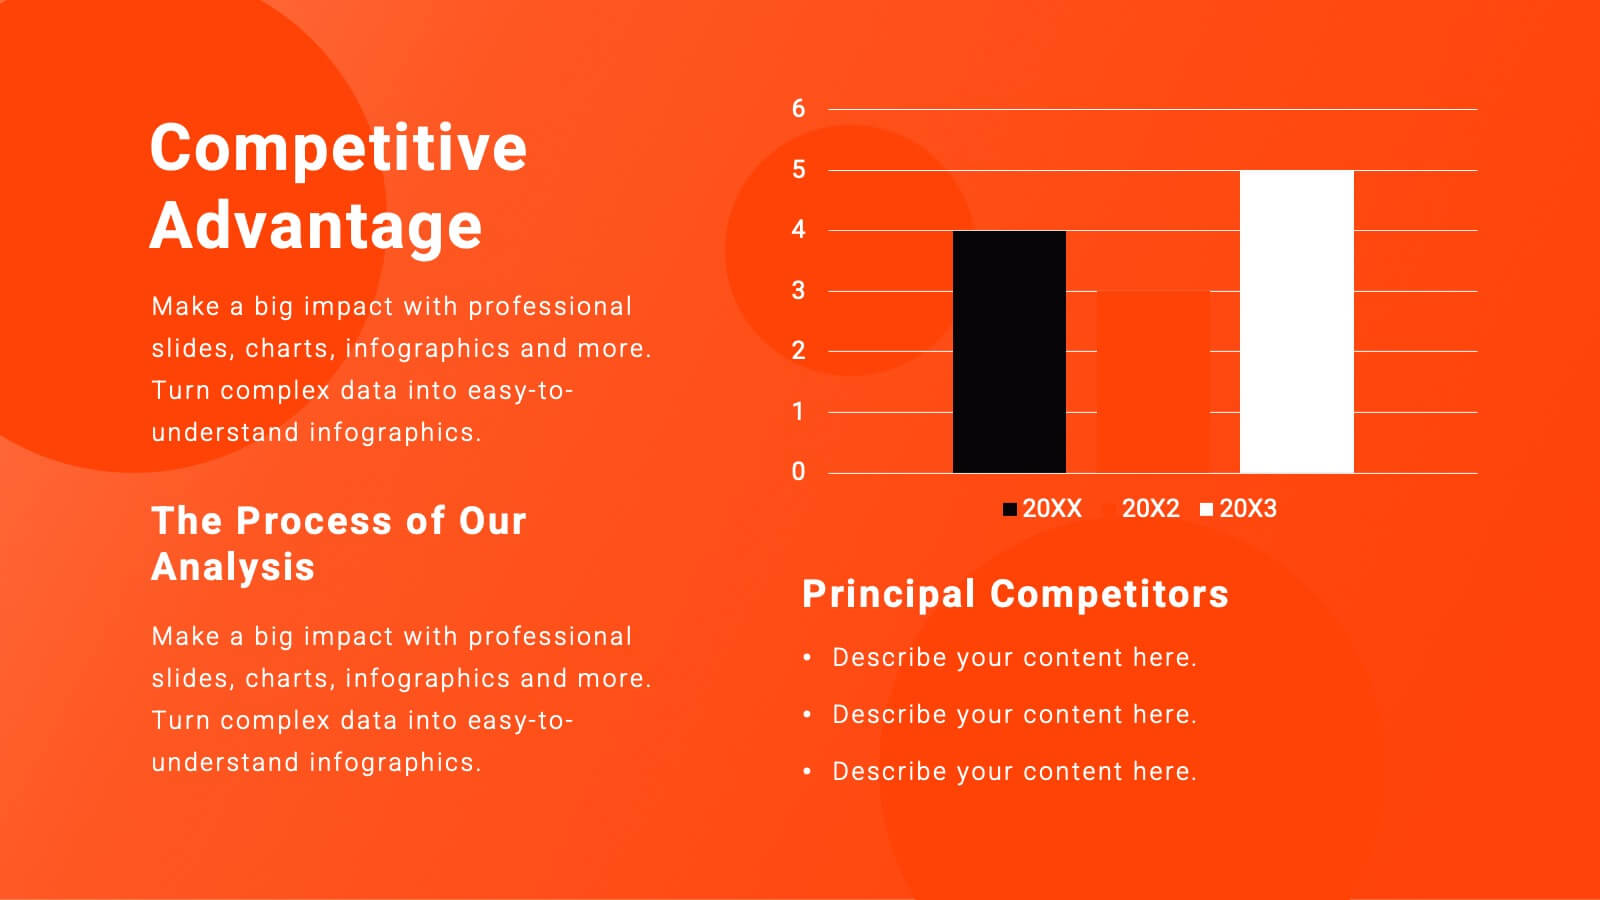
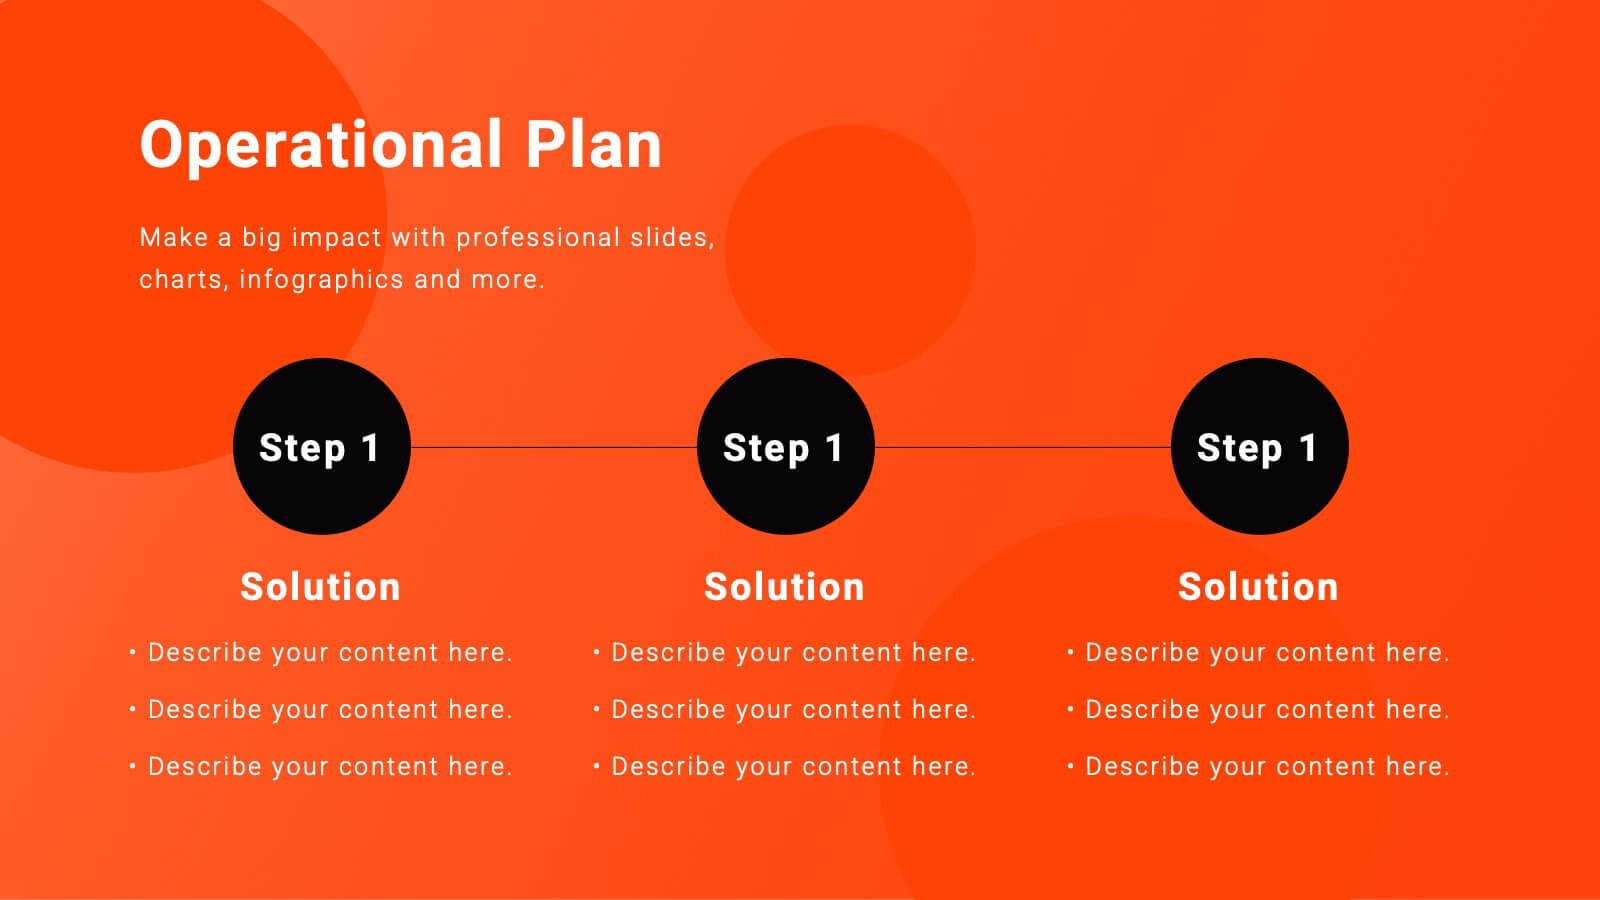
Equinox Business Operations Plan Presentation
Elevate your business operations with this dynamic plan template! Perfect for detailing company background, market opportunities, and strategic objectives. Ideal for business leaders and managers aiming to streamline operations and drive growth. Compatible with PowerPoint, Keynote, and Google Slides, this template ensures your business plan is clear, professional, and impactful. Drive success today!


6 diapositivas
Learning Models and Instructional Design Presentation
Present educational strategies with clarity using the Learning Models and Instructional Design Presentation. This wavy, multi-step visual helps illustrate instructional stages, e-learning workflows, or training models with ease. Ideal for educators, coaches, and corporate trainers. Fully editable in PowerPoint, Keynote, Canva, and Google Slides.


26 diapositivas
Sustainable Business Practices Presentation
Present your eco-friendly business approach with this straightforward template that reflects your commitment to sustainability. It's decked with leafy designs and organic textures that naturally convey your green message. From showcasing your leadership to illustrating growth with intuitive graphs, the template makes it simple to share your vision. Perfect for any platform, like PowerPoint or Google Slides, it’s designed to help you communicate big ideas, like reducing carbon footprints or embracing renewable resources, in a way that’s easy for everyone to grasp. Let this template be the backdrop as you chart a course for a sustainable future, making complex concepts like ‘green initiatives’ and ‘sustainable practices’ clear and actionable.


7 diapositivas
Security Infographic Presentation Template
Security is the key to protecting your information and the future of your business. Security is the ability to defend a position and data from threats. This presentation template is a great way to show how important security is for your businesses. This includes physical security and digital security. With this template show how a strong security strategy is essential. Your first priority as a business owner should be the safety and security of your workplace. This template features the perfect security illustrations you need to get your point across when displaying this presentation.


7 diapositivas
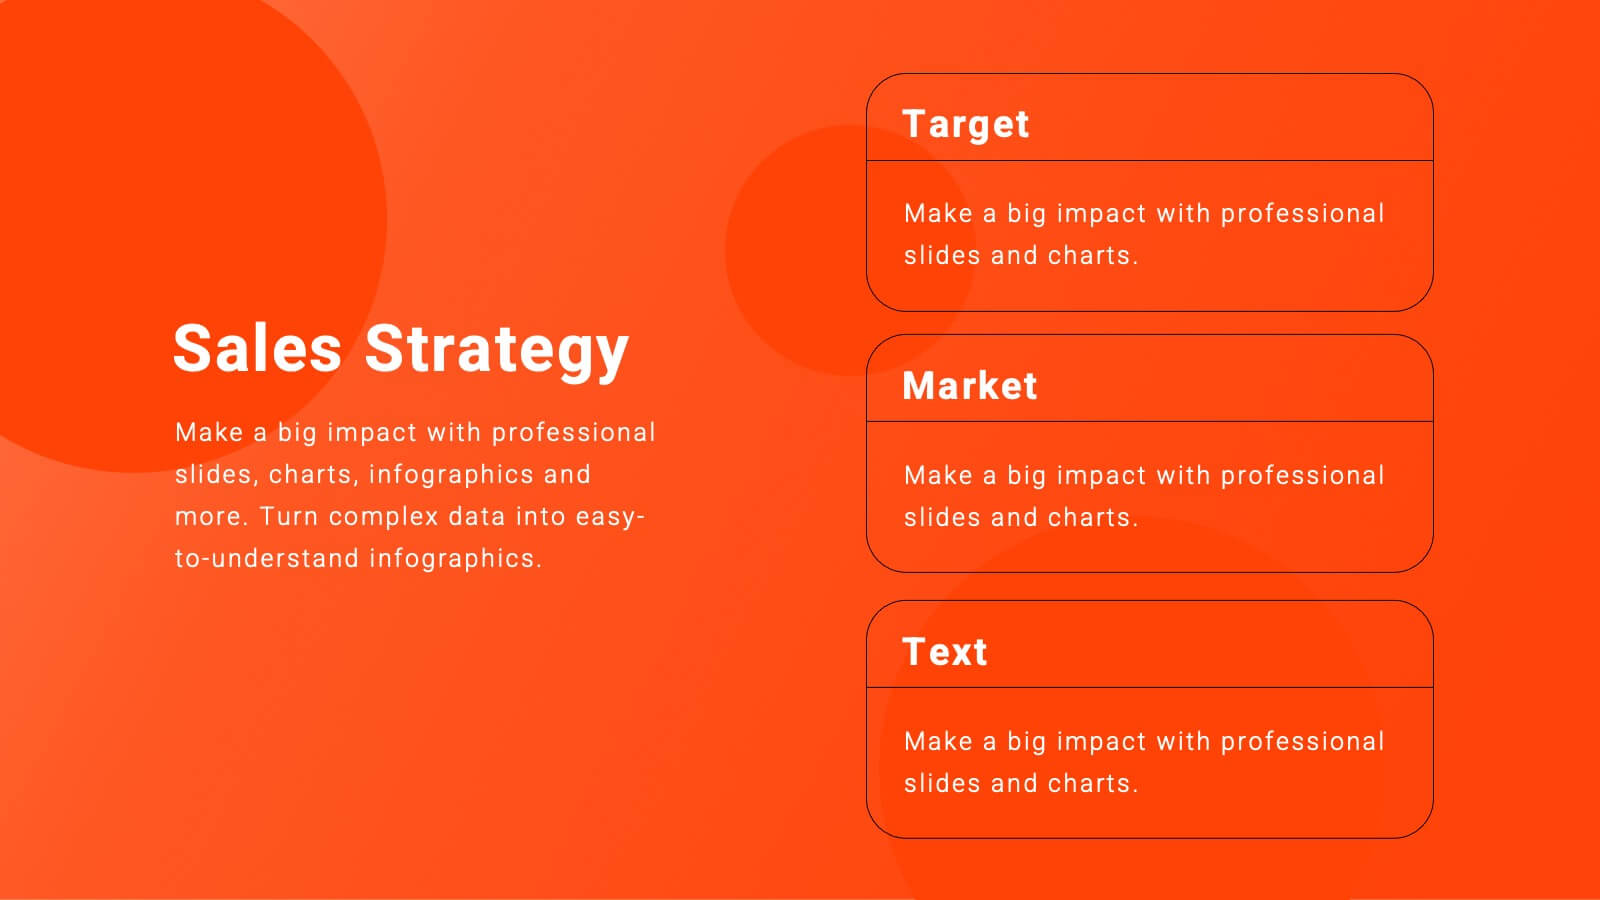
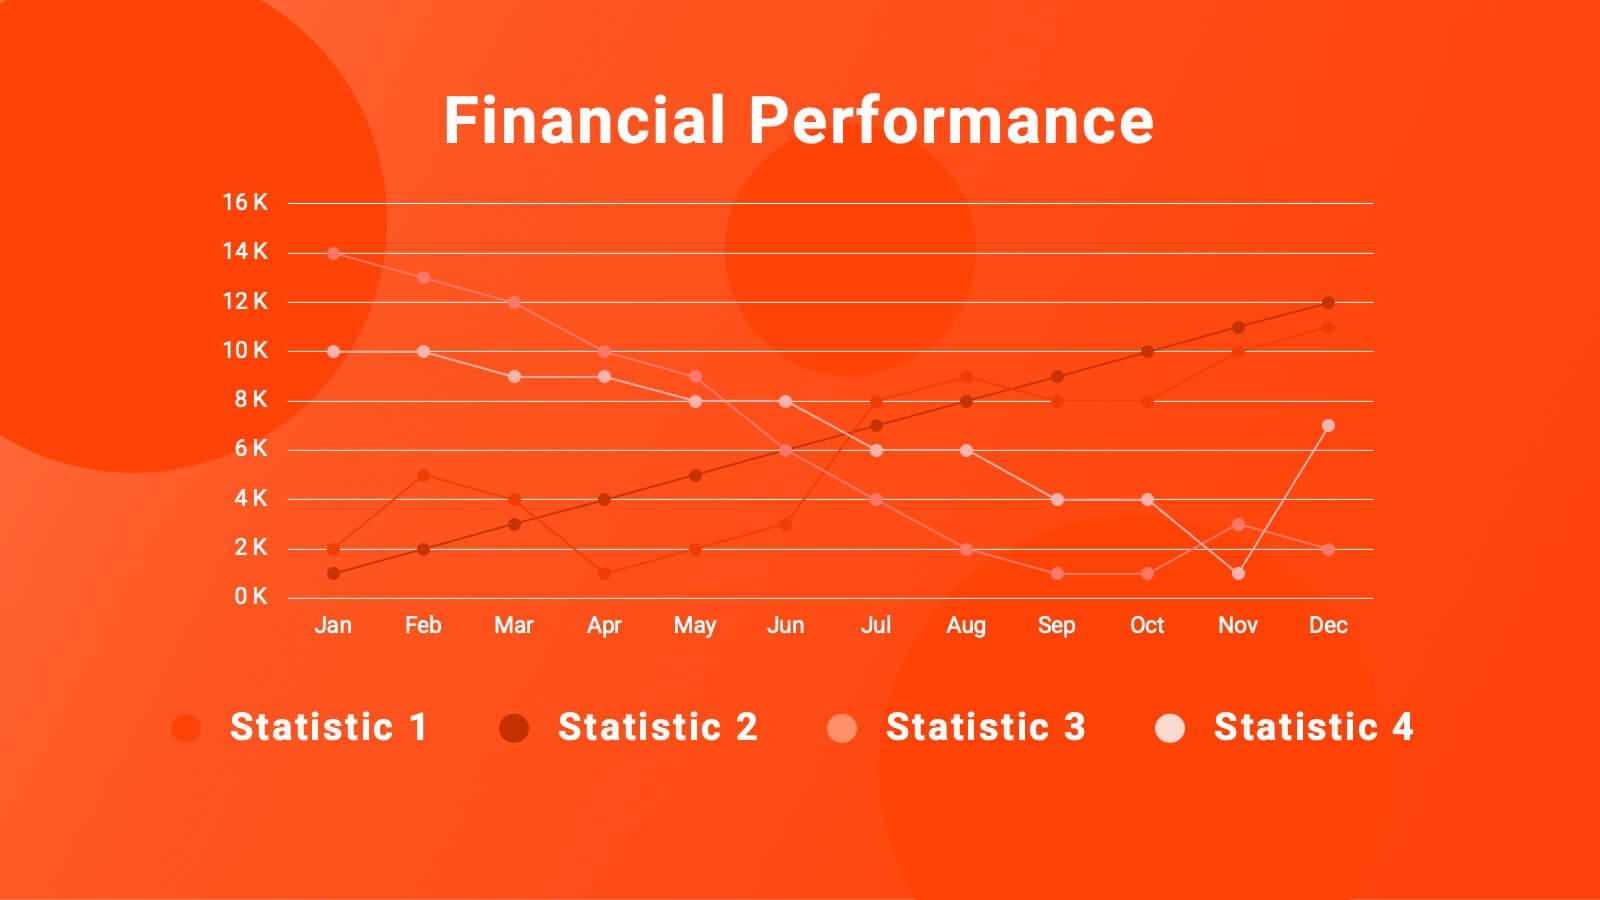
Balance Sheet and Profit Overview Presentation
Give your financial summary a clean, modern look with the Balance Sheet and Profit Overview Presentation. This slide offers a dual-column layout with icons and space for six key financial metrics or business insights—ideal for summarizing assets, liabilities, profits, and more. Easily editable in Canva, PowerPoint, and Google Slides.


6 diapositivas
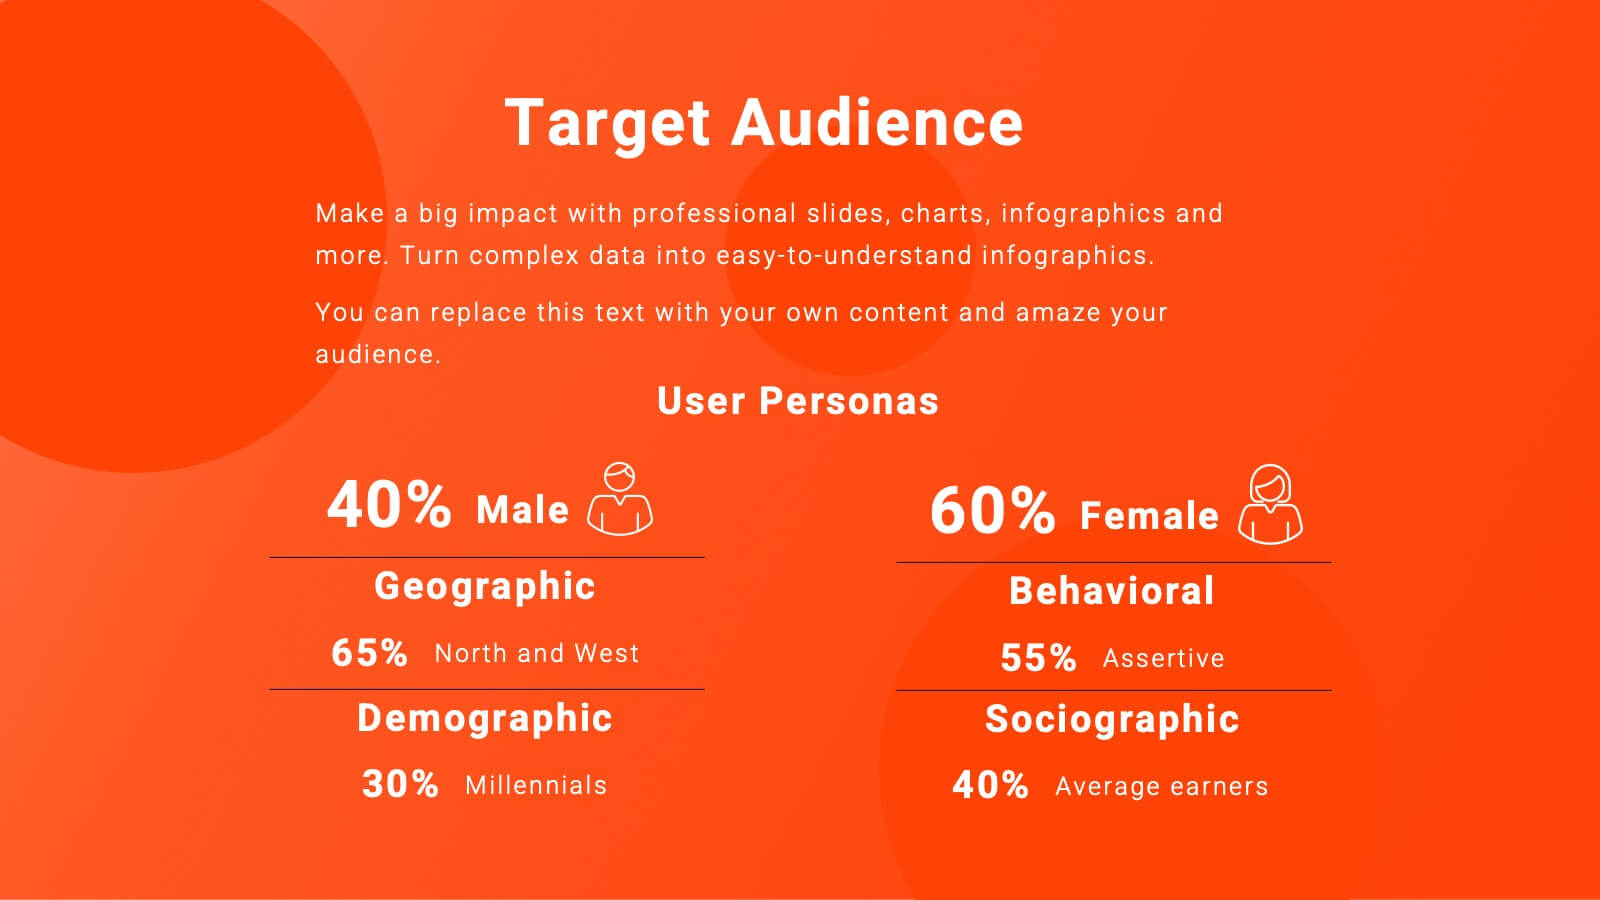
Customer Needs and Segmentation Profile Presentation
Pinpoint what truly drives your audience with the Customer Needs and Segmentation Profile Presentation. This template helps you clearly map customer motivations, preferences, and pain points through segmented icons and visuals. Ideal for marketers and business analysts. Fully editable in Canva, PowerPoint, or Google Slides for easy customization.


5 diapositivas
North American Business Overview and Map Presentation
Showcase regional performance data across North America with this clean, data-driven map slide. Highlight four key statistics using pinpoint markers and modern percentage indicators. Ideal for market overview, financial reporting, or strategic insights. Fully customizable and compatible with PowerPoint, Keynote, and Google Slides for seamless business presentations.


5 diapositivas
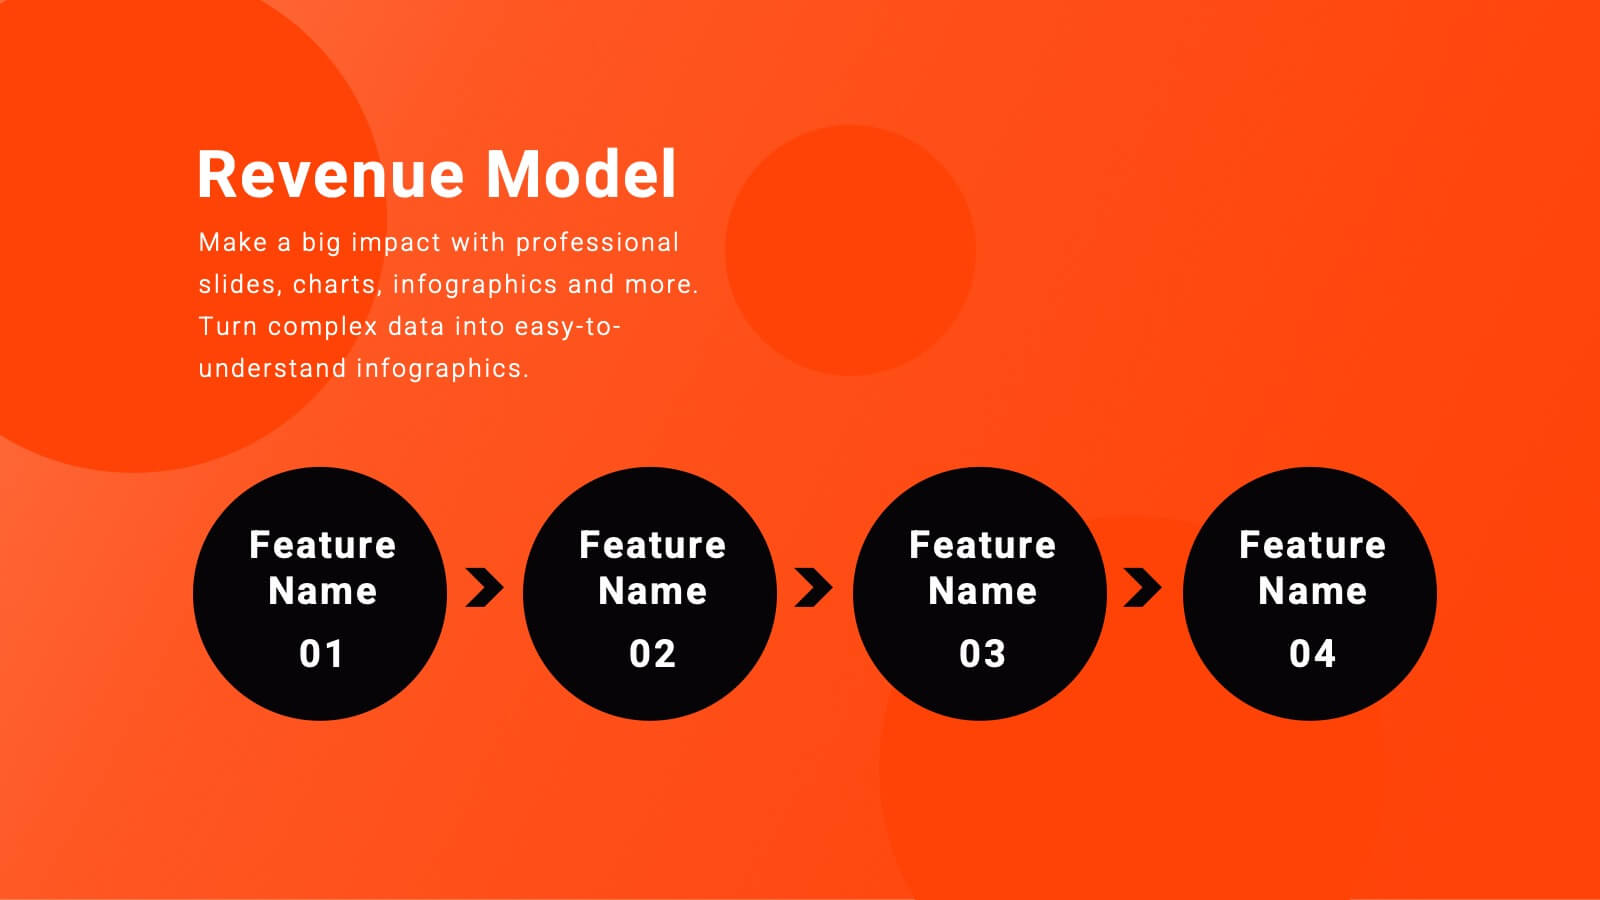
Linear and Looping Process Flow Design Presentation
Visualize your workflow with clarity using the Linear and Looping Process Flow Design Presentation. This diagram blends linear steps and repeating loops, making it ideal for showcasing ongoing processes, development cycles, or multi-phase strategies. Each segment includes an icon and title to support your message. Editable in PowerPoint, Google Slides, and Canva.


6 diapositivas
Letter Recognition and Phonics Training Presentation
Make early learning visual and interactive with this clean, A-to-F phonics layout. Each letter icon is paired with editable text for sound associations, learning milestones, or steps in a language program. Great for educators, speech therapists, or early childhood presentations. Fully editable in PowerPoint, Keynote, and Google Slides.