


Características


¿Tienes alguna pregunta?
Recomendar


5 diapositivas
Economy Resumption Infographics
Economy Resumption refers to the process of restarting or restoring economic activity following a period of disruption or decline. This Infographic is a visual representations of information and data related to the economy after a disruption. They are designed to provide insights into the current state of the economy, the factors affecting its recovery, and the measures being taken to stimulate growth. This template can provide valuable insights into the state of the economy by presenting data and information in an accessible and visually engaging way. This can help decision-making and drive positive economic outcomes.


5 diapositivas
Recycling Basics Infographics
Recycling is the process of converting waste materials into new products to reduce the consumption of raw materials, energy usage, and environmental pollution. These infographic templates are designed to educate and motivate individuals to embrace recycling as a sustainable practice. With its eye-catching design, concise information, and visually appealing graphics, this template will help raise awareness and inspire positive recycling behaviors in your audience. This template allows you to effectively communicate key information about recycling. This is compatible with Powerpoint, Keynote, and Google Slides.


8 diapositivas
Data-Driven KPI Slide Presentation
Bring your data to life with a sharp, modern layout that turns complex metrics into clear, compelling visuals. This presentation helps you showcase performance insights, compare trends, and highlight key takeaways with ease. Fully customizable and compatible with PowerPoint, Keynote, and Google Slides.


30 diapositivas
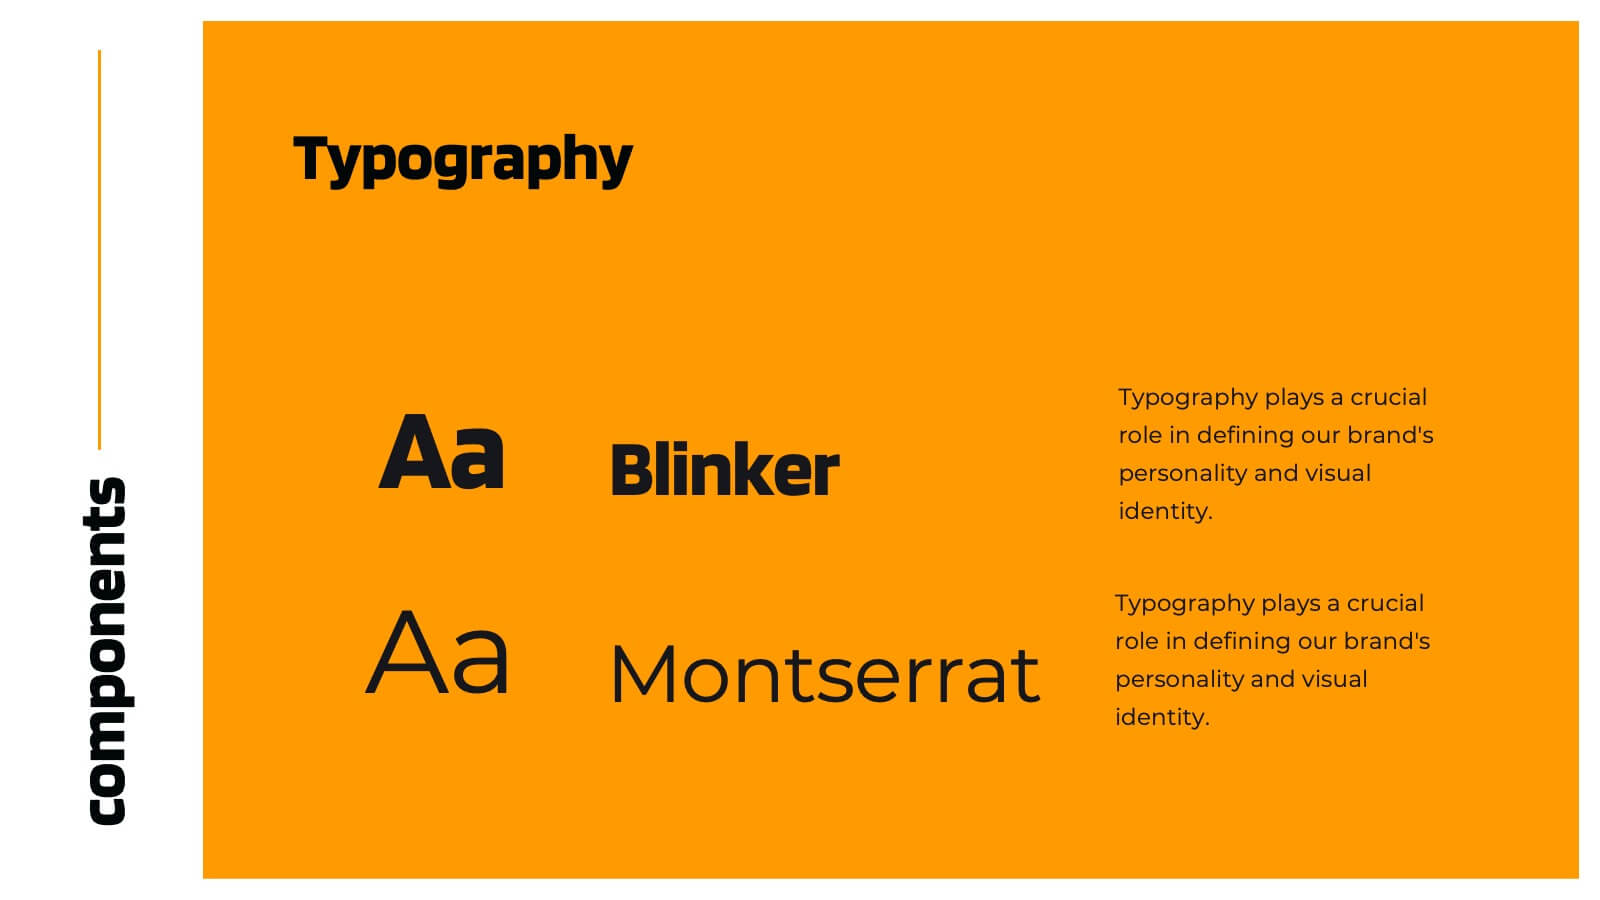
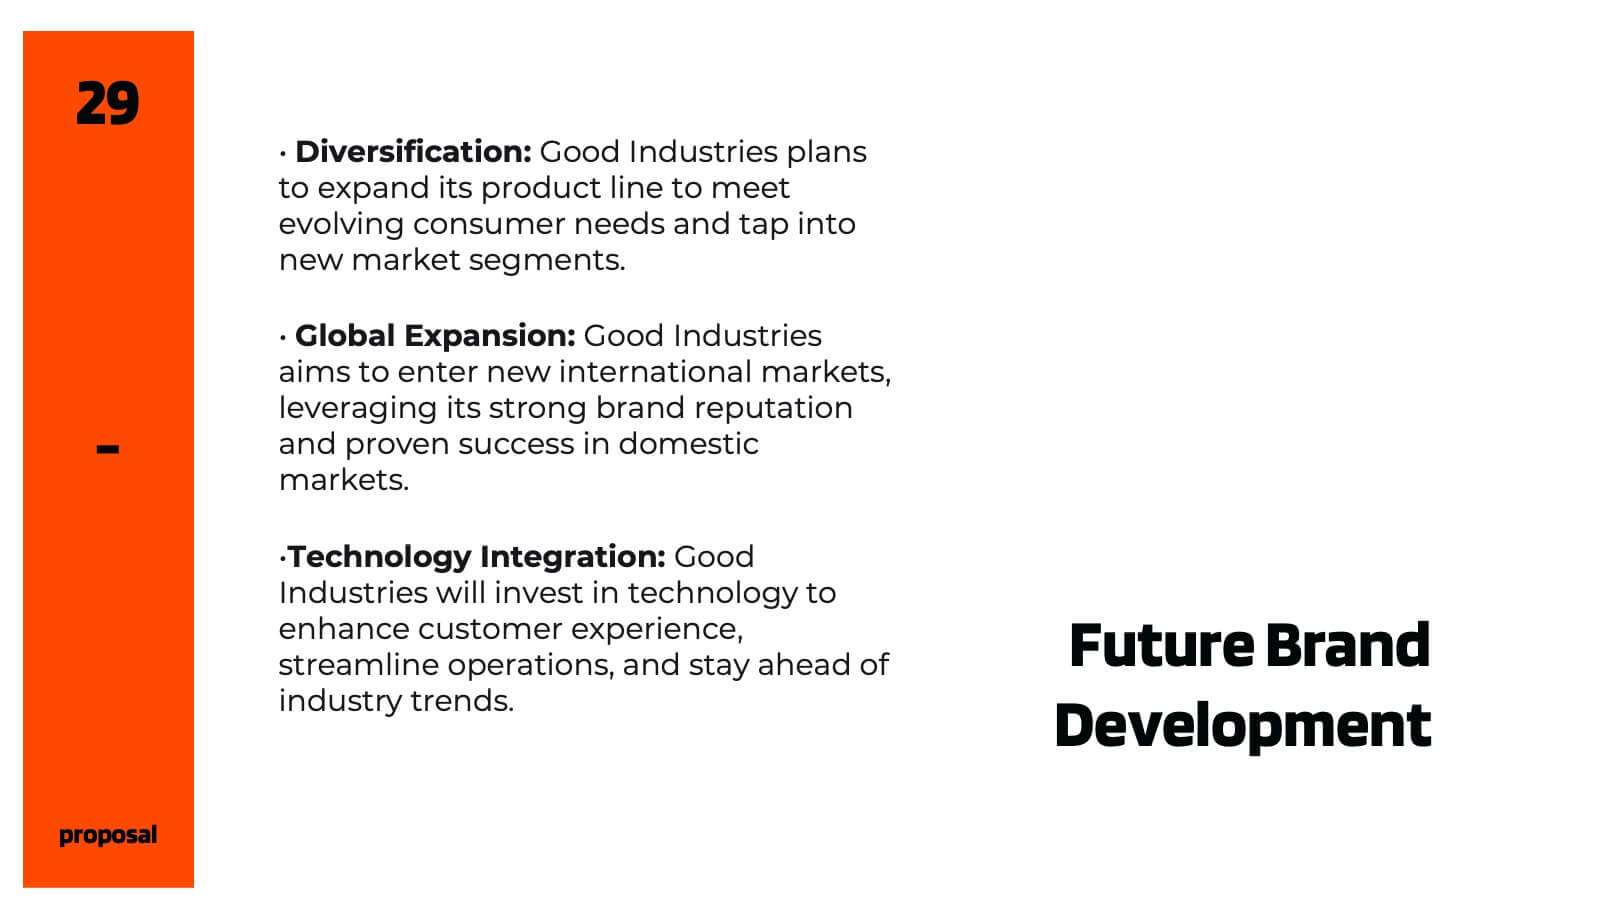
Chromalight Brand Guidelines Proposal Presentation
Elevate your brand's story with this visually engaging presentation template that embodies modern, professional aesthetics. From mission and vision statements to brand identity and market positioning, each slide is crafted to showcase your brand's core essence. Ideal for brand strategists and marketers, this template is compatible with PowerPoint, Keynote, and Google Slides.


5 diapositivas
Impacts of Fake News Infographics
Fake News refers to deliberately false or misleading information presented as factual news. The spread of fake news can have significant impacts on individuals, society, and even the democratic process. With this infographic template, you can effectively communicate the far-reaching consequences of fake news and encourage critical thinking and media literacy. Whether you're presenting to a classroom, sharing on social media, or creating educational materials, this template serves as a powerful tool to raise awareness and promote responsible consumption of information in the digital era. Compatible with Powerpoint, Keynote, and Google Slides.


6 diapositivas
Corporate Foundation and Pillars Presentation
Highlight your company's core principles with this visually impactful pillar-style slide. Designed to illustrate business frameworks, strategies, or guiding values, this layout helps communicate stability and growth. Fully customizable in PowerPoint, Keynote, and Google Slides for seamless brand alignment.


6 diapositivas
Circular Wheel Diagram Presentation
Bring motion and balance to your ideas with this clean, circular design that connects every element in a seamless flow. Ideal for showcasing continuous processes, team dynamics, or strategic cycles, it keeps your message clear and engaging. Fully compatible with PowerPoint, Keynote, and Google Slides for easy editing.


5 diapositivas
Spider Chart for Mind Organization Presentation
Clarify complex ideas with the Spider Chart for Mind Organization Presentation. This layout visually maps key topics and subtopics, helping you identify patterns, priorities, or areas of focus. Ideal for planning, decision-making, and brainstorming sessions. Fully customizable in Canva, PowerPoint, Google Slides, and Keynote for seamless use.


21 diapositivas
Sonicwave Market Analysis Report Presentation
A vibrant, modern template designed for market analysis presentations. Covers agenda, key highlights, metrics, financial summaries, competitor insights, and strategic initiatives. Ideal for professionals presenting data-driven insights on trends and performance. Fully customizable in PowerPoint, Keynote, and Google Slides for business, marketing, and analytical reporting needs.


8 diapositivas
Product Development and Market Growth Presentation
Discover the dynamics of 'Product Development and Market Growth' with this versatile presentation template. Designed for business analysts and product managers, it visualizes key stages of product evolution and market expansion. Ideal for presentations on business growth strategies, compatible with all major presentation platforms.


6 diapositivas
Economic Pyramid Infographic
Showcase economic structures with our Economic Pyramid Infographic, compatible with Powerpoint, Google Slides, and Keynote. This template is designed for economists, educators, and business professionals, providing a visual hierarchy of economic indicators or demographics. Each level of the pyramid represents a different segment, such as income brackets, consumer classes, or resource distribution. It's an ideal tool for presentations that require a clear depiction of economic stratification or market segmentation. Customizable and easy to understand, this infographic helps simplify complex economic data into digestible visual tiers for any audience.


20 diapositivas
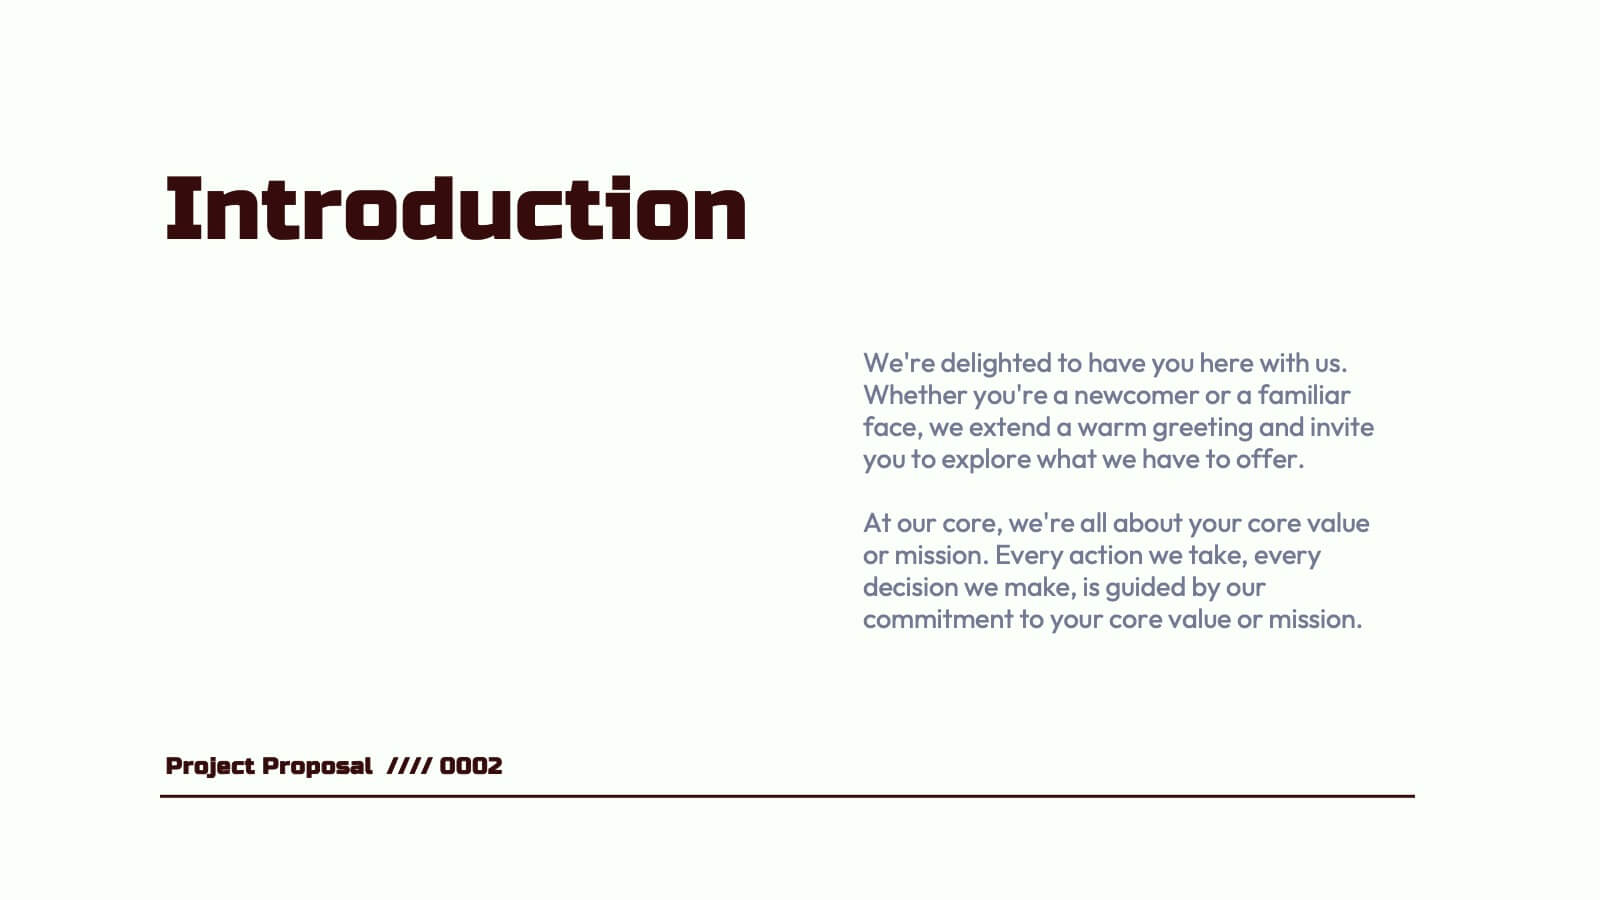
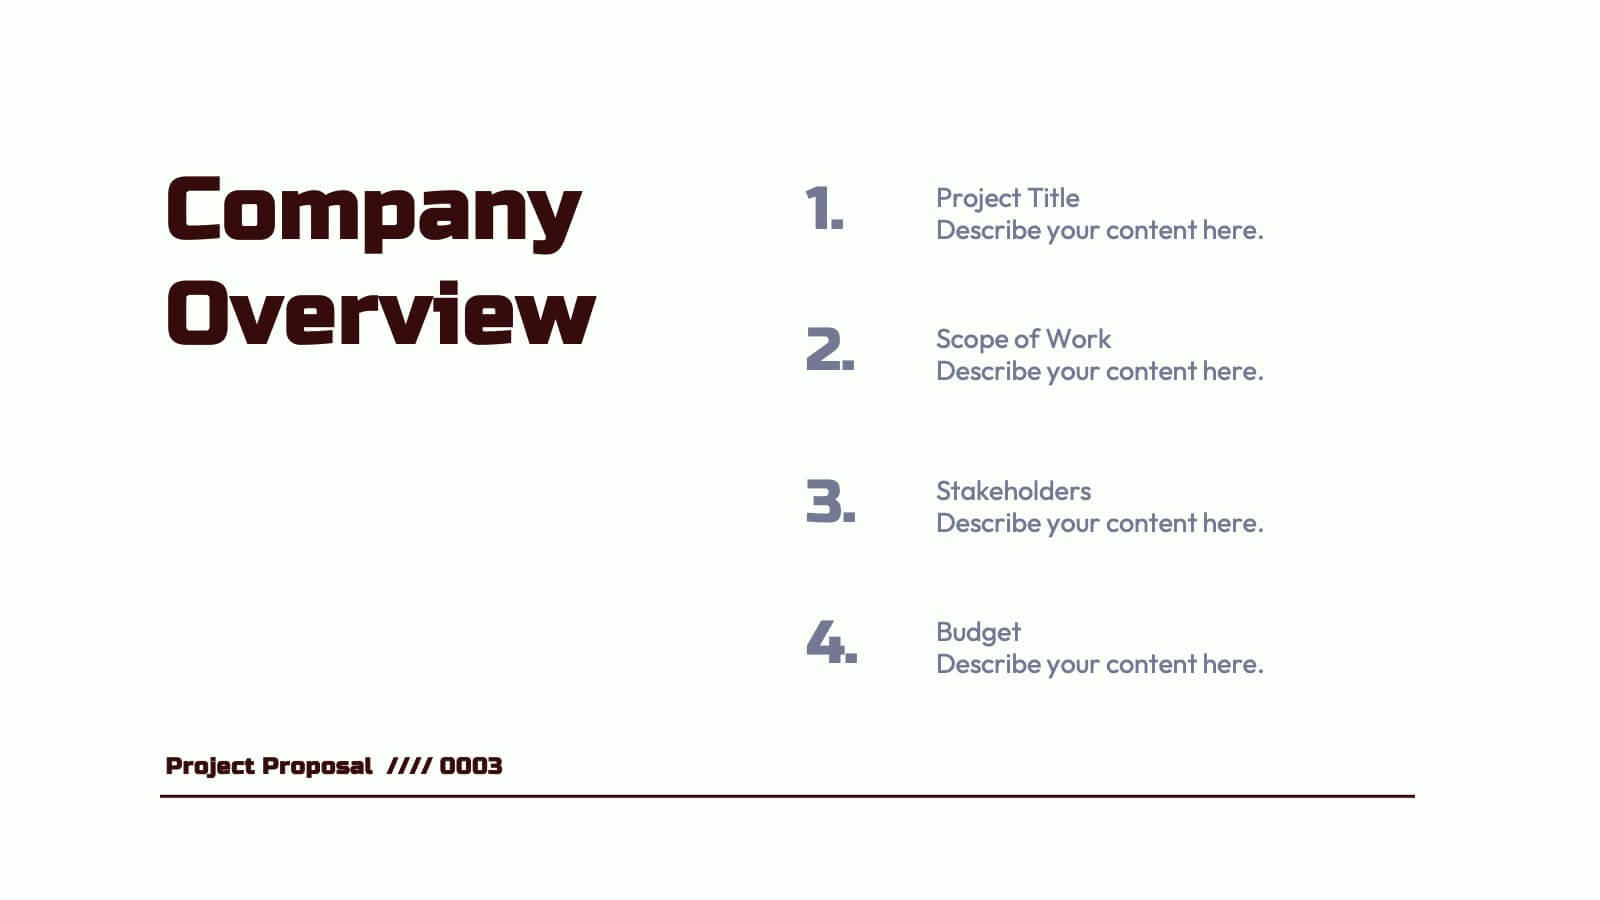
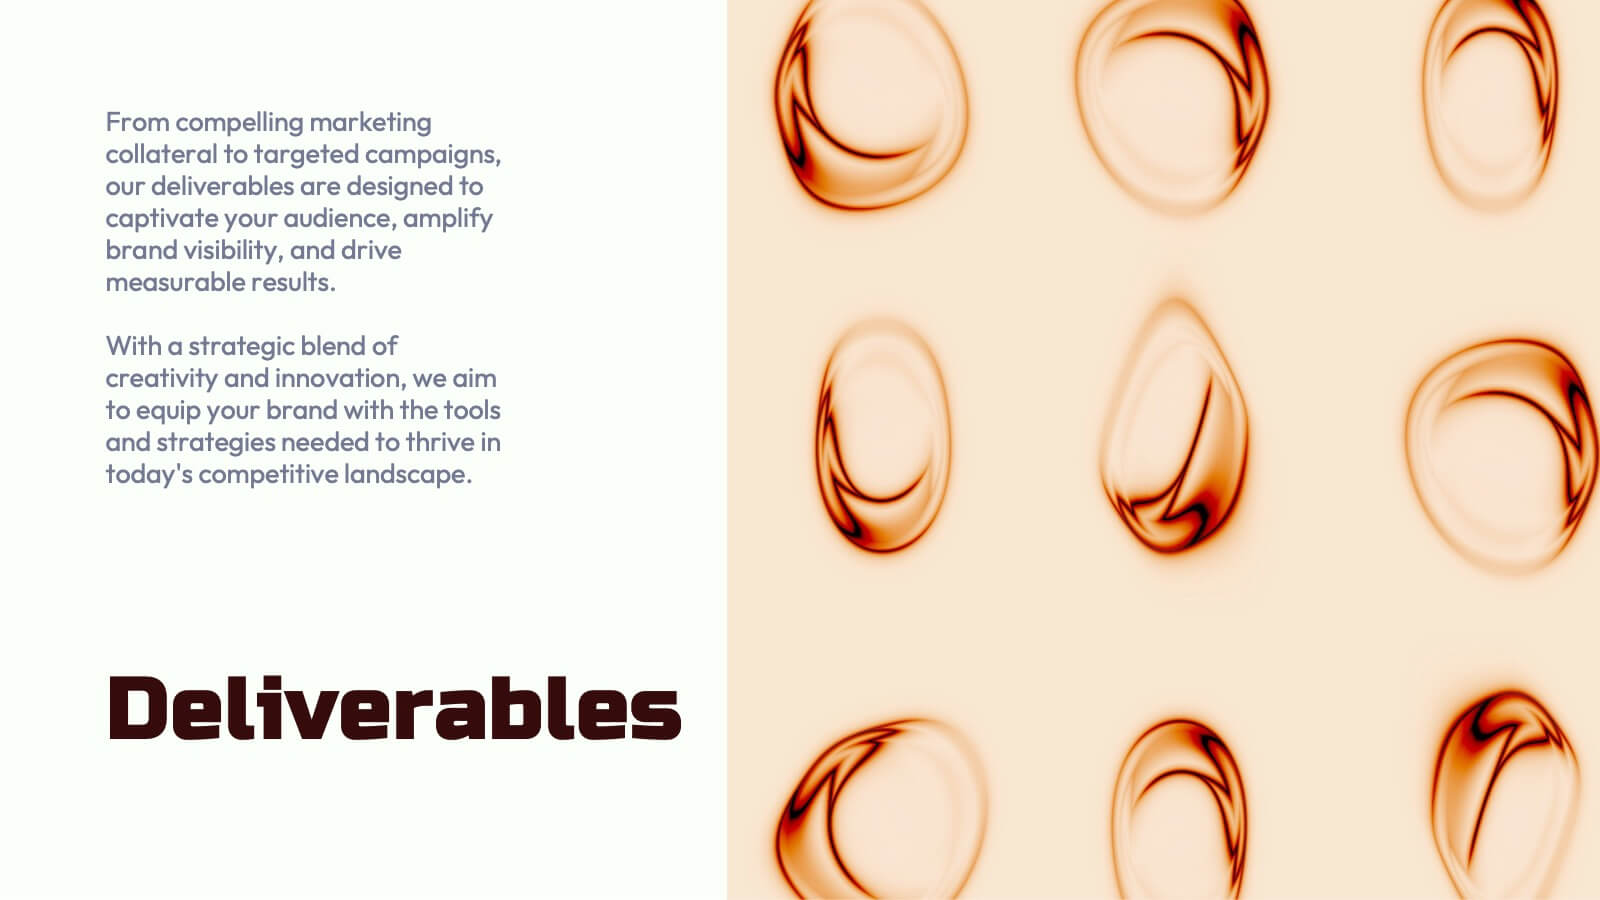
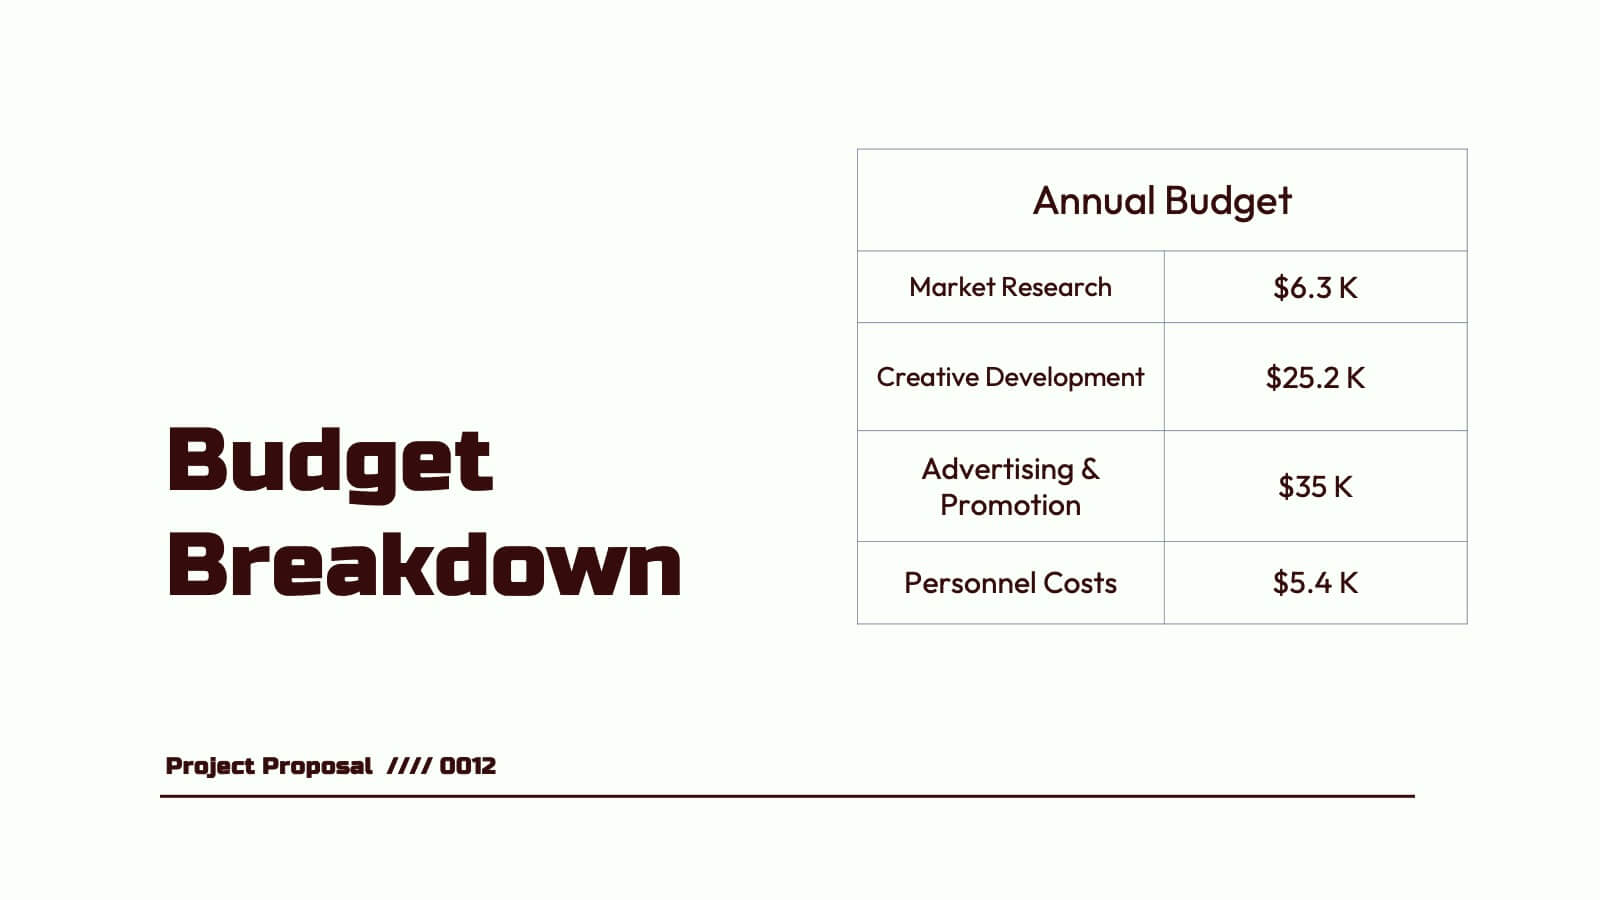
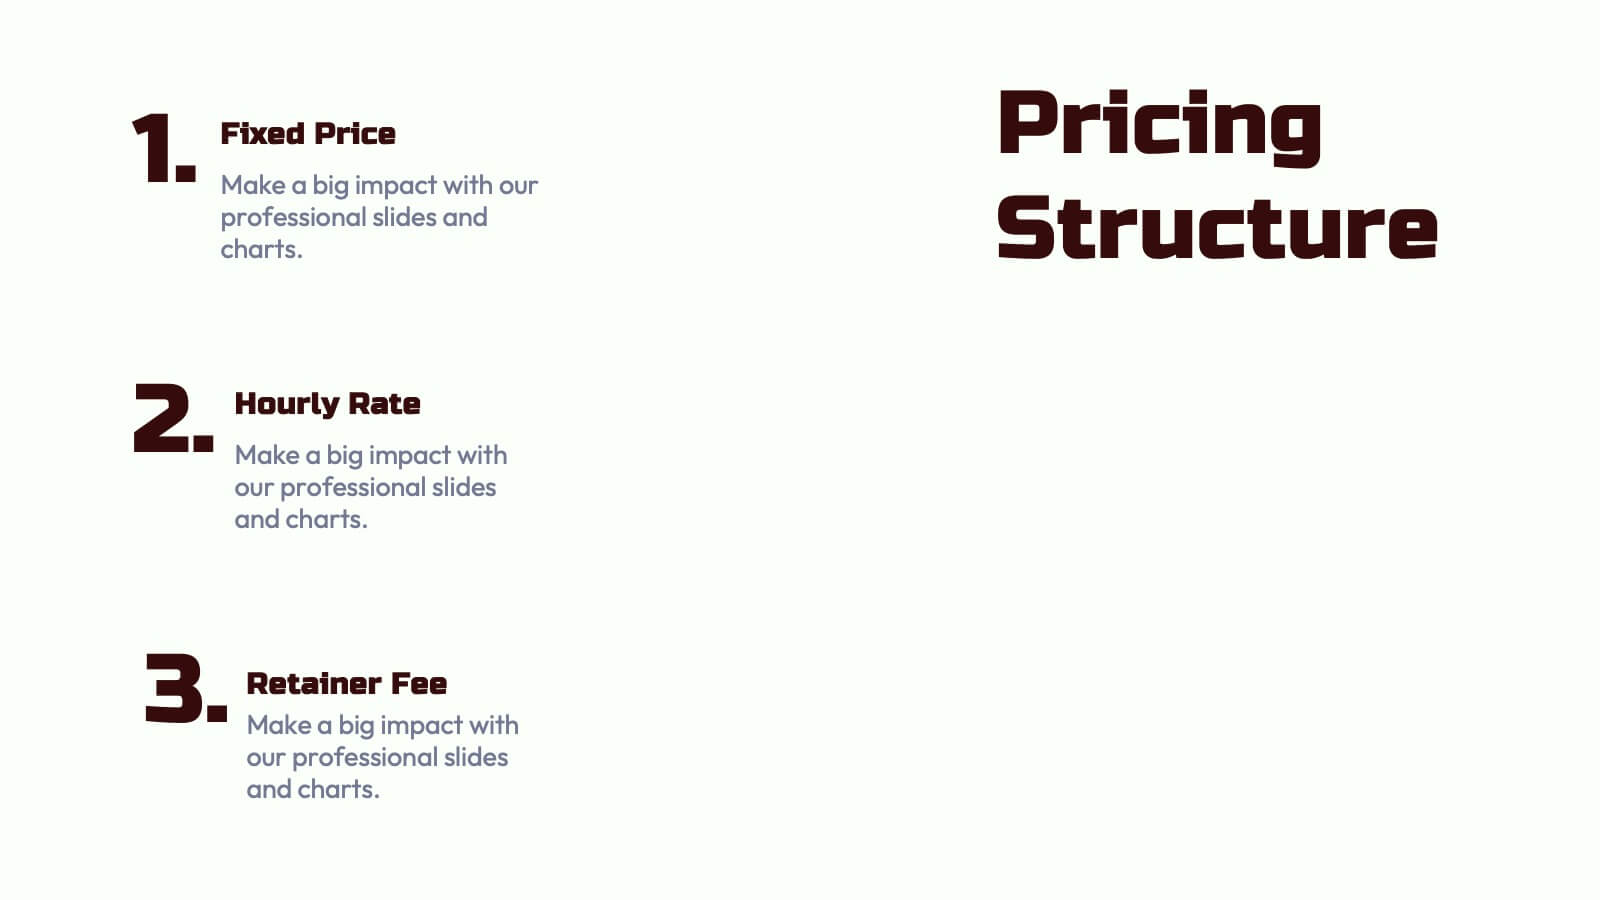
Nebula Project Proposal Presentation
Create a compelling project proposal with this structured, professional template! It includes sections for problem statements, proposed solutions, goals, timelines, and pricing. Perfect for organizing your ideas clearly and professionally, it's fully customizable and compatible with PowerPoint, Keynote, and Google Slides. This template makes it easy to present your proposals effectively and win clients.


7 diapositivas
Aviation Management Infographic
Aviation management encompasses the effective and efficient operation of various facets within the aviation industry. This vibrant and informative infographic is designed to take you through the skies of efficient aviation operations and successful management strategies. Compatible with Powerpoint, Keynote, and Google Slides. This template involves planning, organizing, directing, and coordinating the activities of airlines, airports, and other organizations related to aviation and aerospace. The featured jet visuals symbolizes the aviation industry's movement and efficiency, setting the tone for the informative adventure.


7 diapositivas
Insurance Infographics Presentation Template
The primary purpose of insurance is to provide protection against future risk, accidents and uncertainty. Insurance policies offer a variety of benefits to help you plan for your future and protect what is important to you. This template will help your customers learn how important insurance is for their daily lives. With this template your consumer will be informed on how Insurance is not a risk coverage, but it is a measure that can provide for loss compensation when risks occur. The template provided takes into consideration the needs of your audience and includes helpful illustrations.


5 diapositivas
Risks Assessment Matrix Presentation
Visualize risk like never before with a clear, color-coded grid that helps you evaluate impact, likelihood, and priority in seconds. Perfect for project planning, compliance reviews, or business strategy sessions, this presentation makes complex assessments simple. Fully compatible with PowerPoint, Keynote, and Google Slides for effortless editing.


7 diapositivas
Budget Forecasting and Planning Infographic
The Budget Forecasting and Planning infographic template is designed to simplify financial planning and forecasting. It is compatible with PowerPoint, Google Slides, and Keynote. This set of slides offers a variety of charts, including bar graphs and dot matrices, to compare projected and actual budget figures over different periods. The template uses a color-coding system to differentiate between quarters or fiscal years, and it provides placeholders for detailed descriptions of budget items. It's an excellent tool for financial analysts, accountants, and business managers who need to present budget forecasts, variances, and financial strategies in a clear and visually engaging manner.


7 diapositivas
Pillar Points Infographic Presentation
A Pillar Infographic presents information on a specific topic or subject in a clear and organized manner. It consists of several sections or "pillars" that are interconnected and support the overall message of the infographic. In this template each pillar can be used to represent different aspects of the topic being discussed. Each section contains relevant data, statistics, and other information that illustrates the aspect. This can be used in marketing and advertising to promote products or services, as well as in education and journalism to explain complex ideas in a visually appealing way.