


Características


¿Tienes alguna pregunta?
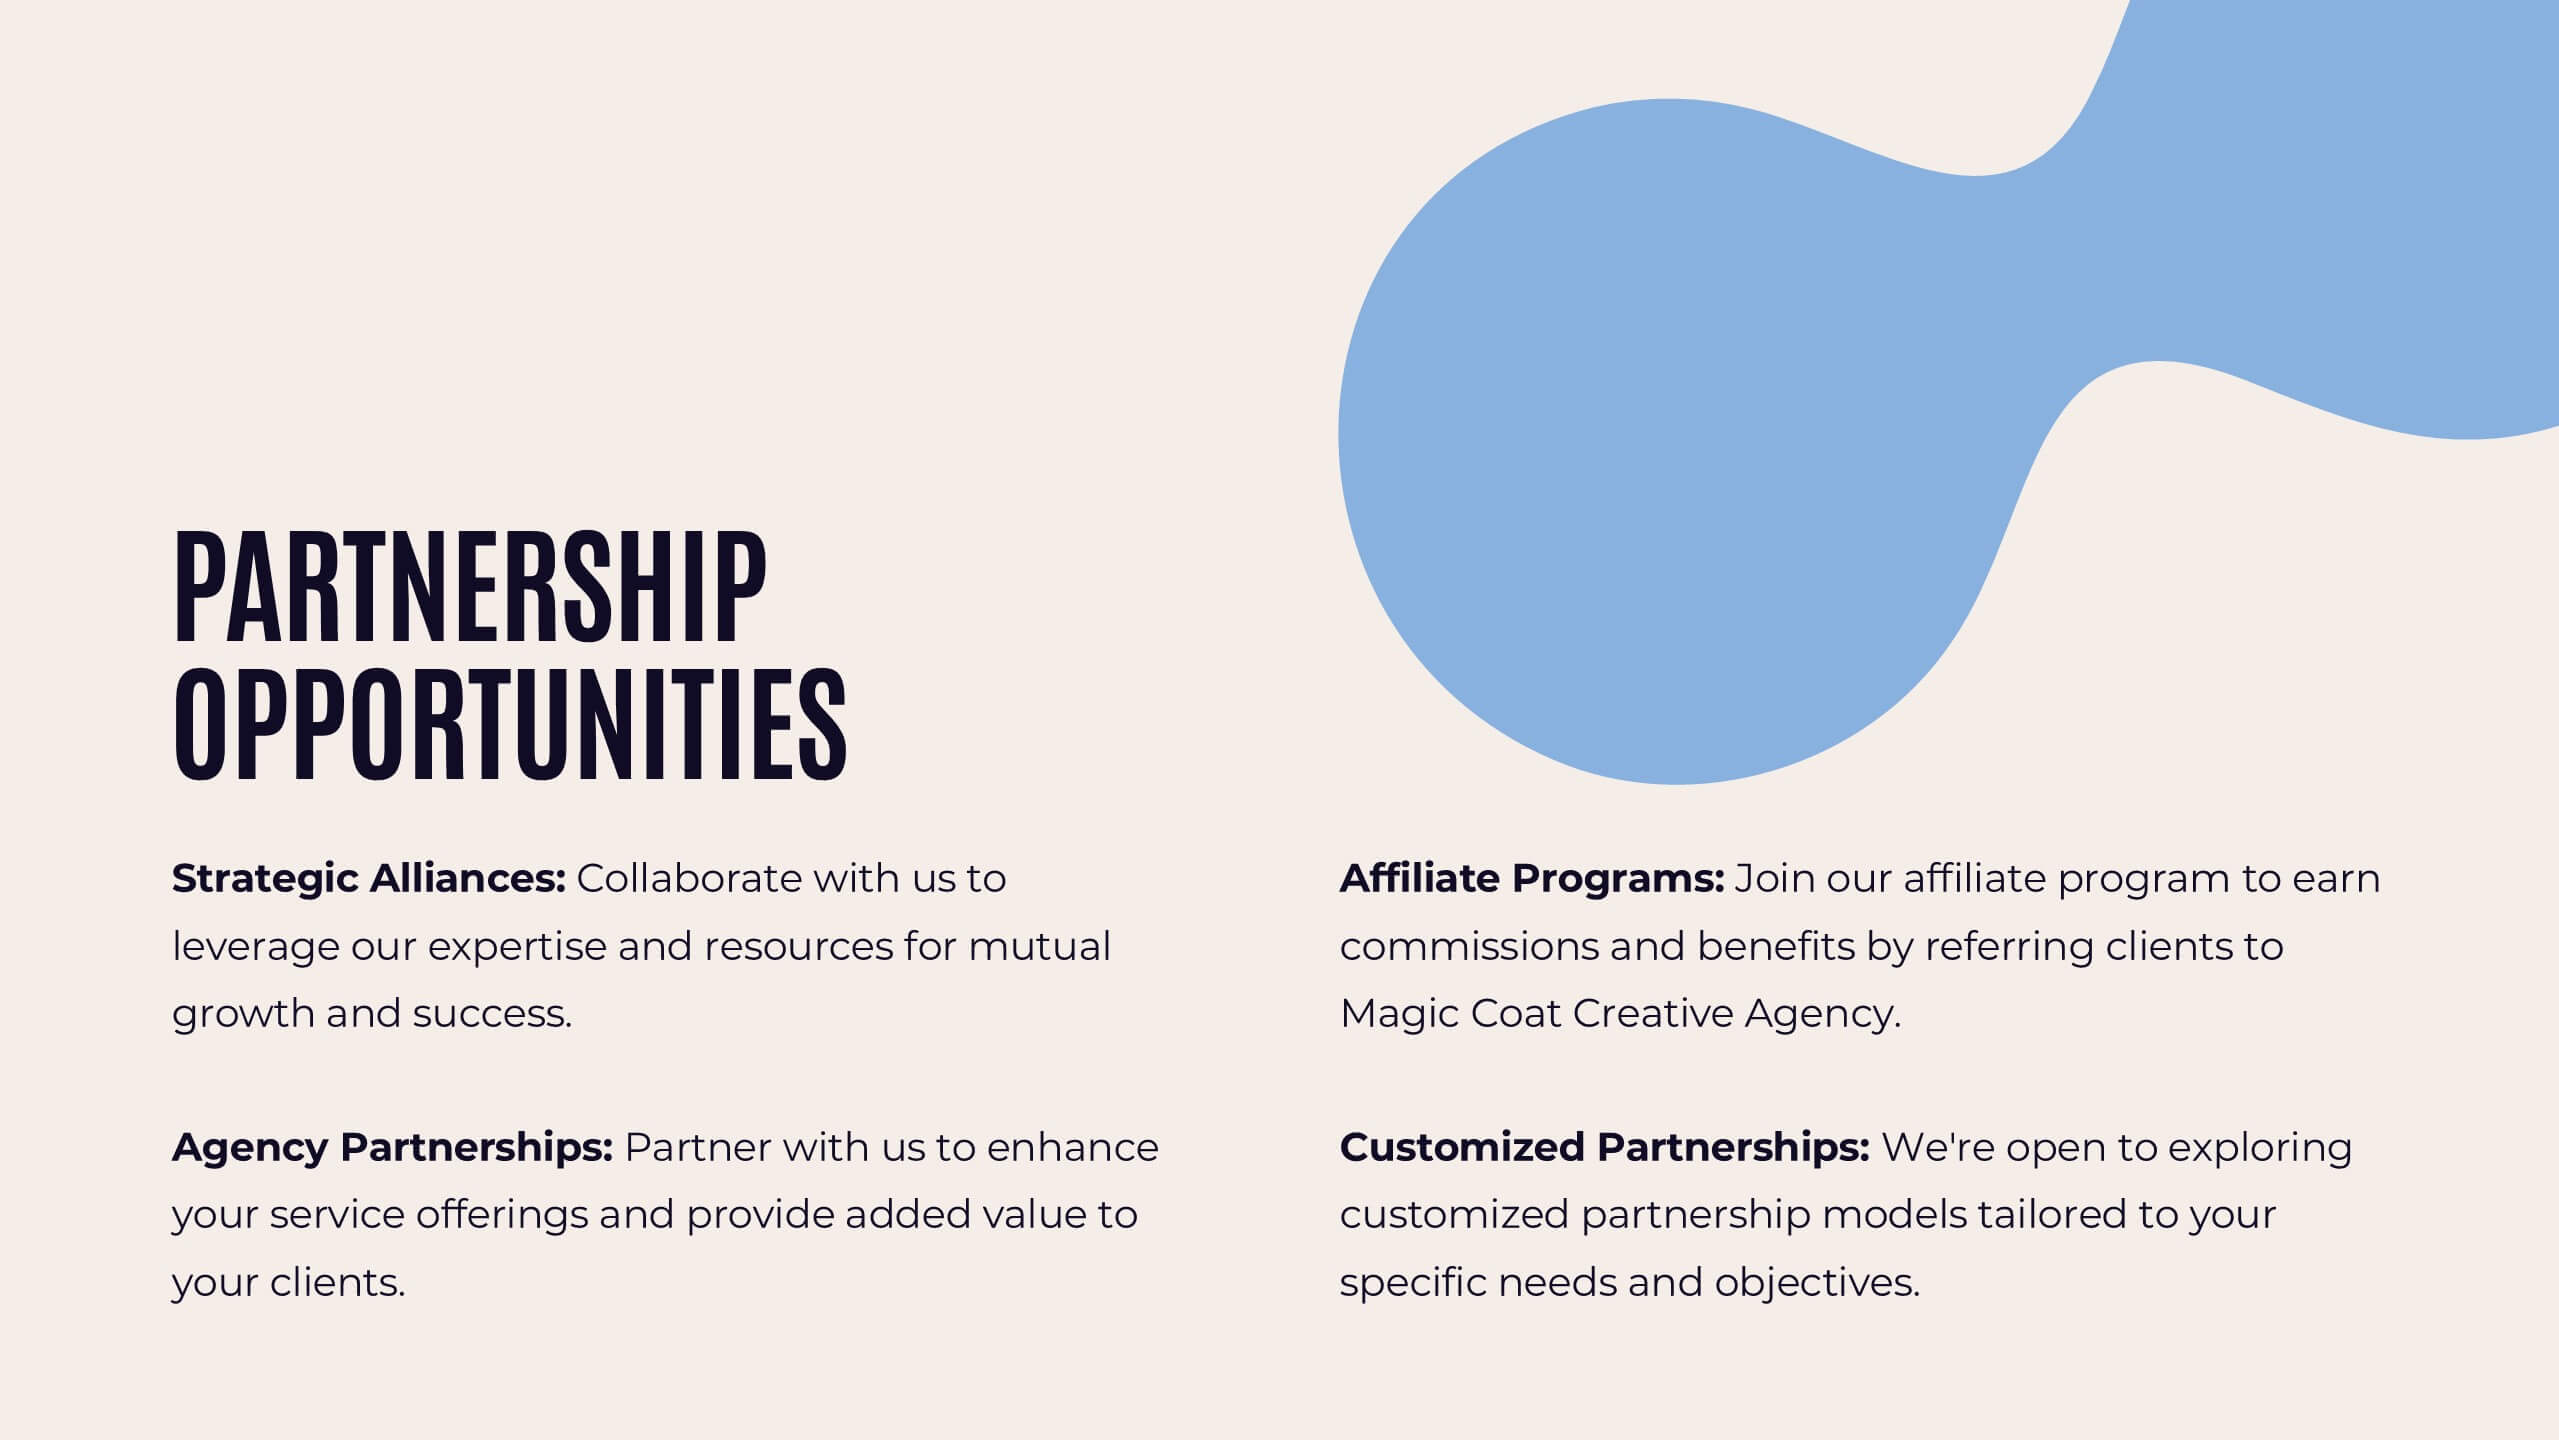
Recomendar


6 diapositivas
Effective Communication in Meetings Presentation
Communicate with impact using this circular diagram template designed to visualize six key elements or steps for better meeting communication. With centered speech bubble icons and balanced layout, it's ideal for sharing best practices, communication roles, or team feedback loops. Fully customizable in PowerPoint, Keynote, and Google Slides.


26 diapositivas
Farming Company Profile Creative Presentation
Step onto the fertile grounds of the farming company landscape, where green fields stretch to the horizon and the golden sun promises a bountiful harvest. With a canvas painted in rich green and sunlit yellow, our template captures the heart and soul of farming life. Adorned with colorful farm-centric graphics, rustic icons, and evocative image placeholders, it's a visual ode to the age-old tradition of agriculture. Meticulously tailored for Powerpoint, Keynote, or Google Slides. Perfect for farming entrepreneurs, agricultural businesses, or anyone rooted in the rich soil of cultivation. Sow your ideas; watch your farming story grow.


7 diapositivas
Office Scenes Infographic Presentation Template
An Office Scene Infographic is a visualization of the most common types of office spaces, along with their pros and cons. This infographic template is great for a school presentation, office projects, employee onboarding programs, or planning a workplace makeover. Within this infographic, you will be able to display absolutely everything that needs to be shown within a corporate setting. This office scene template is a fully layered and customizable infographic that allows you to create your own design. Use it as an infographic, as a presentation, or even a website/app background.


5 diapositivas
Investment Opportunity Business Case
Visualize the value behind your proposal with this key-themed layout, ideal for presenting compelling reasons to invest. Each section highlights a unique point, making it easy to walk stakeholders through critical benefits and insights. Fully editable and compatible with PowerPoint, Keynote, and Google Slides.


7 diapositivas
Business Model Canvas Value Infographic
The business model canvas is a strategic management tool that provides a visual framework for developing, describing, and analyzing a business model. Prepare for a dynamic voyage through business success with our business model canvas value infographic. This is not just a blueprint; it's a vivid map to unlock the value potential in your business model. Navigate through the core elements, envision your venture, and redefine success. Compatible with Powerpoint, Keynote, and Google Slides. Showcase how a strong customer relationships is key. With this infographic illustrate the strategies to keep your audience coming back for more!


6 diapositivas
Startup Business Validation Plan Presentation
Present your startup’s validation strategy with this structured, color-coded framework. Ideal for mapping business assumptions, customer segments, and testing stages. Includes five top-phase boxes and supporting rows for team input or feedback. Fully editable in PowerPoint, Keynote, or Google Slides—perfect for founders, incubators, or pitch decks.


6 diapositivas
Circular Business Wheel Model Presentation
Break down your strategy into dynamic segments with this Circular Business Wheel Model. This layout is ideal for showcasing interconnected business areas like sustainability, innovation, monetization, and market appeal. Perfect for strategy decks, business planning, and growth presentations. Compatible with PowerPoint, Keynote, and Google Slides—fully editable for your needs.


7 diapositivas
RAPID Traceability Matrix Infographic
The RAPID Traceability Matrix infographic template provides a visual tool for mapping out decision-making roles within project management. Compatible with PowerPoint, Google Slides, and Keynote, this template array features various layouts to assign and display the roles of Recommend, Agree, Perform, Input, and Decide across multiple team members and project tasks. Utilizing a clean and organized design, each slide incorporates colored icons and matrix tables to clearly delineate responsibilities. This approach helps in clarifying the decision-making process and ensuring accountability within project teams.


6 diapositivas
Sustainabilitiy Management Goals and Metrics Presentation
Make your sustainability story shine with a clean, modern presentation that highlights environmental goals, measurable results, and ongoing progress. Perfect for communicating corporate impact and performance data with clarity and purpose. Fully customizable and compatible with PowerPoint, Keynote, and Google Slides for a professional and visually engaging delivery.


20 diapositivas
Oscillation Project Proposal Presentation
This project proposal template is designed to captivate your audience with a bold purple and yellow color scheme, adding a modern flair to your presentation. It includes comprehensive sections like company overview, objectives and goals, methodology, deliverables, and budget breakdown. Perfect for clearly communicating your project vision and strategy, this template streamlines your content while highlighting your professional approach. Compatible with PowerPoint, Keynote, and Google Slides, it provides versatility for seamless delivery across platforms.


6 diapositivas
Targeted Segment Analysis and Mapping Presentation
Highlight your market focus with the Targeted Segment Analysis and Mapping Presentation. This circular layout is perfect for breaking down five audience segments, using subtle icons and visual emphasis for clarity. Ideal for marketers, strategists, and business analysts presenting niche targeting. Fully editable in Canva, PowerPoint, Keynote, and Google Slides.


22 diapositivas
Bona Advertising Agency Proposal Presentation
Present your agency’s vision with confidence using this sleek advertising proposal template. It covers everything from market analysis and strategy development to campaign execution and client testimonials. Ideal for securing new partnerships, it’s compatible with PowerPoint, Keynote, and Google Slides for a polished, professional presentation.


6 diapositivas
Big Data Insights Visual Presentation
Transform complex analytics into clear, engaging visuals that tell a compelling story. This modern layout is perfect for showcasing data connections, performance metrics, and analytical insights in a visually balanced way. Fully editable and compatible with PowerPoint, Keynote, and Google Slides for seamless customization and professional presentations.


5 diapositivas
European Market Trends with Europe Map Presentation
Navigate market dynamics with the European Market Trends with Europe Map template, designed for business professionals analyzing key trends and opportunities across the region. It features an editable map, key data indicators, and graphical elements to represent market trends and opportunities. Compatible with PowerPoint and Google Slides, it's ideal for presentations on market analysis and growth strategies.


20 diapositivas
Fenrir Investor Pitch Presentation
Deliver a compelling and persuasive pitch with this sleek and professional investor pitch deck! It covers essential sections like problem and solution, market opportunity, business model, financials, and growth strategy to ensure your vision is clearly communicated. Ideal for startup fundraising or business presentations, this template is fully compatible with PowerPoint, Keynote, and Google Slides.


20 diapositivas
Vitrumin Photography Portfolio Presentation
Showcase your creative work with this elegant and modern photography portfolio presentation template. Featuring essential slides such as an introduction, project highlights, creative process, awards, and client testimonials, this template is perfect for presenting your work professionally. Fully customizable and easy to edit, it's compatible with PowerPoint, Keynote, and Google Slides.


20 diapositivas
Symphonix Marketing Campaign Presentation
The Marketing Campaign Presentation Template is designed for impactful storytelling and strategy. With 20 vibrant, customizable slides, it covers key topics like consumer behavior, emerging trends, data-driven strategies, and sustainability. Perfect for marketers and agencies, it’s fully compatible with PowerPoint, Keynote, and Google Slides for seamless presentations.