


Features
- 5 Unique slides
- Fully editable and easy to edit in Microsoft Powerpoint, Keynote and Google Slides
- 16:9 widescreen layout
- Clean and professional designs
- Export to JPG, PDF or send by email


Do you have any questions?
Recommend


5 slides
Financial Market Trends and Forecast Presentation
Visualize economic shifts and data insights with this upward growth line infographic. Ideal for presenting financial forecasts, investment strategies, and market milestones, this layout features a stylized arrow path with icons, letter markers, and space for detailed annotations. Fully editable and compatible with PowerPoint, Keynote, and Google Slides.


5 slides
5-Year Strategic Roadmap Slide Presentation
Take your audience on a dynamic journey with a flowing, milestone-based layout that makes long-term planning feel clear and engaging. This presentation helps you map out goals, priorities, and key initiatives across five years with structure and clarity. Ideal for strategy meetings and planning sessions. Fully compatible with PowerPoint, Keynote, and Google Slides.


26 slides
Corporate Culture Development Presentation
Embark on a journey to forge a vibrant corporate culture with this expertly designed presentation template, where every slide is a brushstroke in the larger picture of your company’s ethos. Orange and blue hues leap off the screen, infusing each slide with the energy and innovation that are the hallmarks of a thriving workplace. Use this template to paint a vivid narrative of your company’s values, mission, and people. Chart the growth of your organizational climate with data-driven graphics, celebrate the uniqueness of your team with personalized profiles, and map out the future with strategic infographics. This template is not just a collection of slides; it's a canvas for storytelling, perfect for HR visionaries and leaders dedicated to nurturing a workspace that breathes collaboration and creativity. Ready for action in your preferred software, it's the gateway to transforming the abstract concept of company culture into a tangible, inspiring reality.


5 slides
Perspective of Economic Trends in Africa Map Presentation
Visualize key economic insights across Africa with this data-driven map layout. Use labeled progress bars and highlighted countries to present regional performance, sector growth, or market distribution. Fully editable in PowerPoint, Keynote, or Google Slides, this clean template is ideal for business reports, financial reviews, and investment-focused presentations.


10 slides
Effective Decision-Making in Five Steps Presentation
Make smarter choices with the Effective Decision-Making in Five Steps presentation. This dynamic template breaks down the key stages of strategic thinking and problem-solving into a clear, engaging framework. Designed for leaders, teams, and consultants, this structured layout helps guide discussions and optimize workflows. Fully editable and available for PowerPoint, Keynote, and Google Slides for seamless customization.


4 slides
Effective Team Communication
Break down communication impact with this data-driven walkie-talkie infographic. Perfect for showing percentage-based contributions, roles, or workflow efficiency across teams. Fully customizable in PowerPoint, Keynote, and Google Slides.


5 slides
Essential Education Infographics
Education is a key driver of individual and societal progress, and investing in education is essential for building a better future for all. This vertical infographic template is designed for educators, trainers, and other professionals who want to create informative and visually appealing educational materials. The theme of the template is centered around education, with bright and colorful illustrations of books, pencils, and other educational tools. Compatible with PowerPoint, Keynote, and Google Slides. Each slide is fully editable, allowing you to easily change the colors, fonts, and content to suit your needs.


6 slides
Cloud Computing Infrastructure Overview Presentation
Break down complex systems with ease using the Cloud Computing Infrastructure Overview slide. This layout features a central cloud icon with multiple surrounding components, perfect for mapping out services, connections, or infrastructure layers. Fully editable in PowerPoint, Keynote, and Google Slides.


26 slides
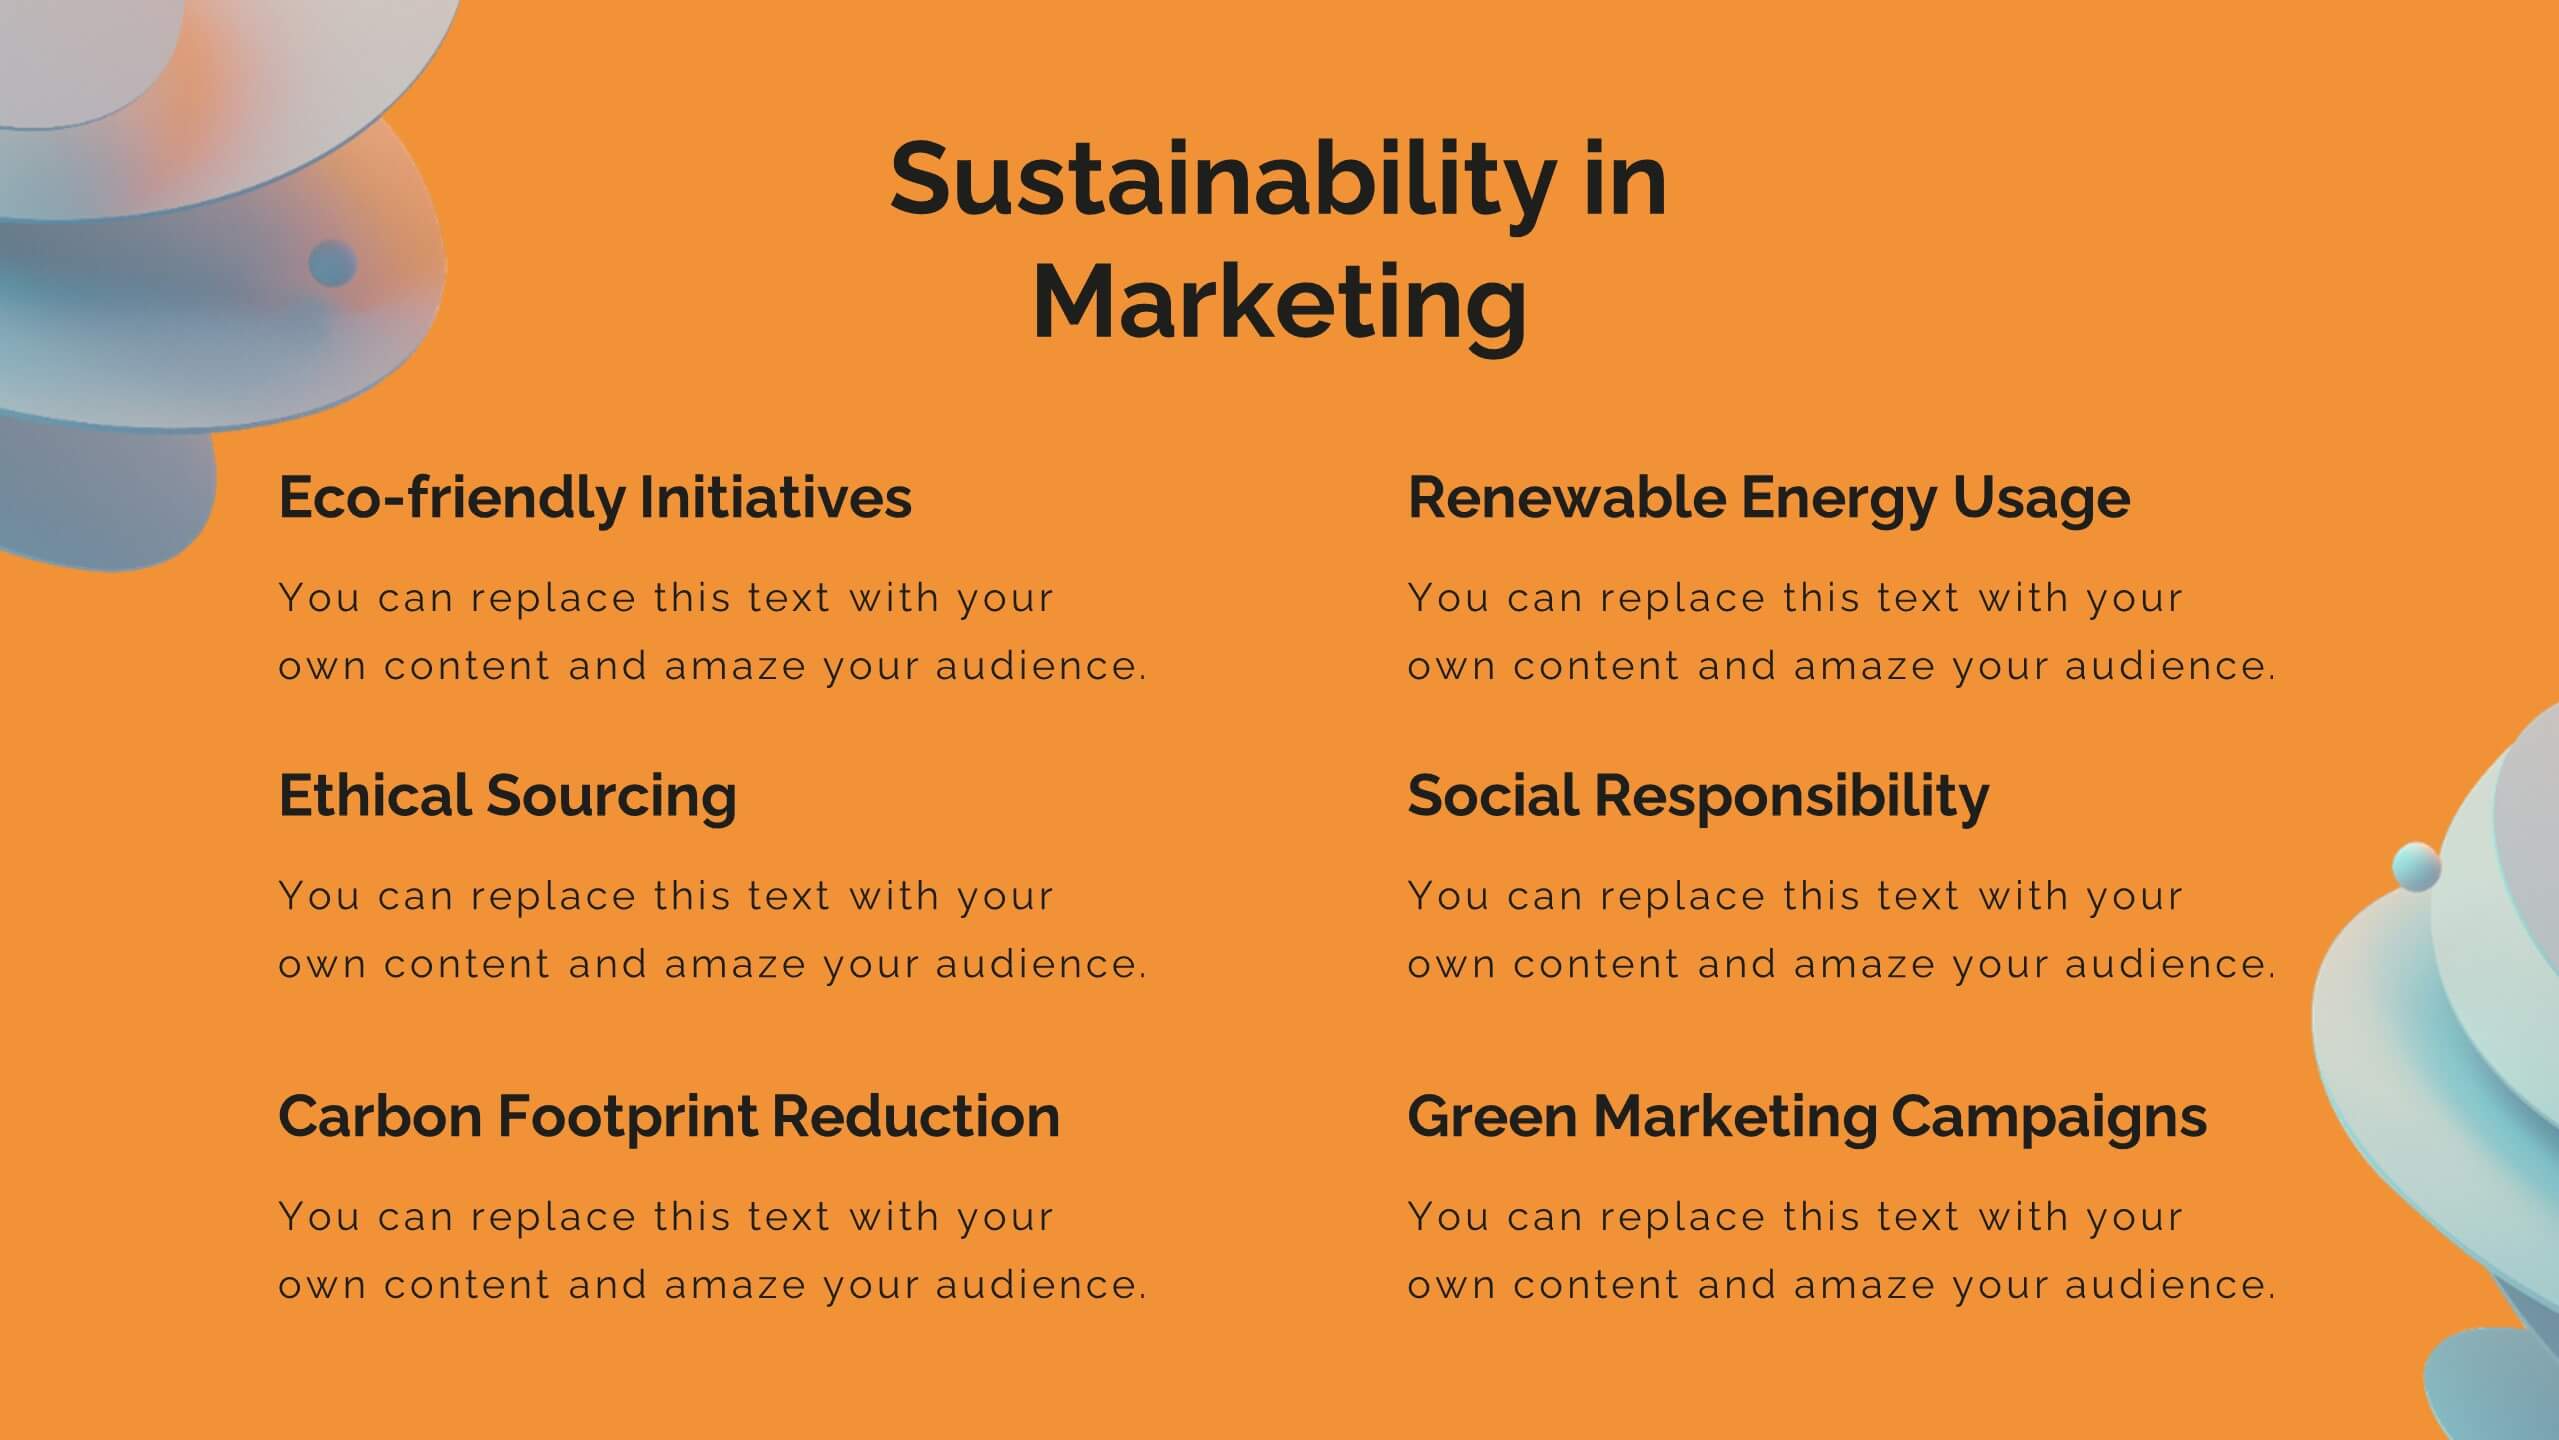
Sustainable Business Practices Presentation
Present your eco-friendly business approach with this straightforward template that reflects your commitment to sustainability. It's decked with leafy designs and organic textures that naturally convey your green message. From showcasing your leadership to illustrating growth with intuitive graphs, the template makes it simple to share your vision. Perfect for any platform, like PowerPoint or Google Slides, it’s designed to help you communicate big ideas, like reducing carbon footprints or embracing renewable resources, in a way that’s easy for everyone to grasp. Let this template be the backdrop as you chart a course for a sustainable future, making complex concepts like ‘green initiatives’ and ‘sustainable practices’ clear and actionable.


26 slides
Ethical Business Practices Presentation
Promote integrity with our Ethical Business Practices presentation template, suitable for PowerPoint, Keynote, and Google Slides. This essential tool is crafted for business leaders, compliance officers, and educators who aim to reinforce the importance of ethics in the corporate environment. Our template facilitates a clear understanding of ethical standards in business operations. It includes slides on ethical decision-making, corporate governance, social responsibility, and the long-term benefits of maintaining high ethical standards. With customizable layouts, you can present real-world scenarios, ethical frameworks, and company policies that illustrate your commitment to ethical conduct. This SEO-optimized template is key for reaching audiences interested in building trust and credibility through responsible business practices. Use this template to lead discussions on ethics, influence corporate culture positively, and showcase how ethical behavior is not just right but also beneficial for business success.


6 slides
Pyramid-Triangle Visual Logic Presentation
Present interconnected concepts with clarity using the Pyramid-Triangle Visual Logic Presentation. This layout uses a hexagonal pyramid structure to show relationships between six ideas or categories, making it ideal for strategy models, balanced frameworks, or multi-step solutions. Each section includes a title, icon, and editable content block to ensure clarity and customization. Compatible with PowerPoint, Keynote, and Google Slides.


7 slides
Geometric Sequence Infographic Presentation
Geometric infographics typically involve the use of various shapes to convey different pieces of information. This Geometric Template is a professional way to show your great designworks and ideas. This template can be used in a variety of contexts, from business and marketing to education and journalism. This clean design includes many categories, dividers and icons which will help you show your data in the best way. Start creating your own customized presentation by adding your text, images and other content from your slides, just download in PowerPoint, Keynote or Google Slides.


7 slides
Rotational Process Flow in Wheel Layout Presentation
Showcase continuous workflows, lifecycle stages, or strategic loops with the Rotational Process Flow in Wheel Layout Presentation. This visually engaging circular diagram breaks down processes into six distinct segments, each with editable icons, colors, and titles—ideal for marketing funnels, product development stages, or team cycles. Fully compatible with PowerPoint, Keynote, and Google Slides.


20 slides
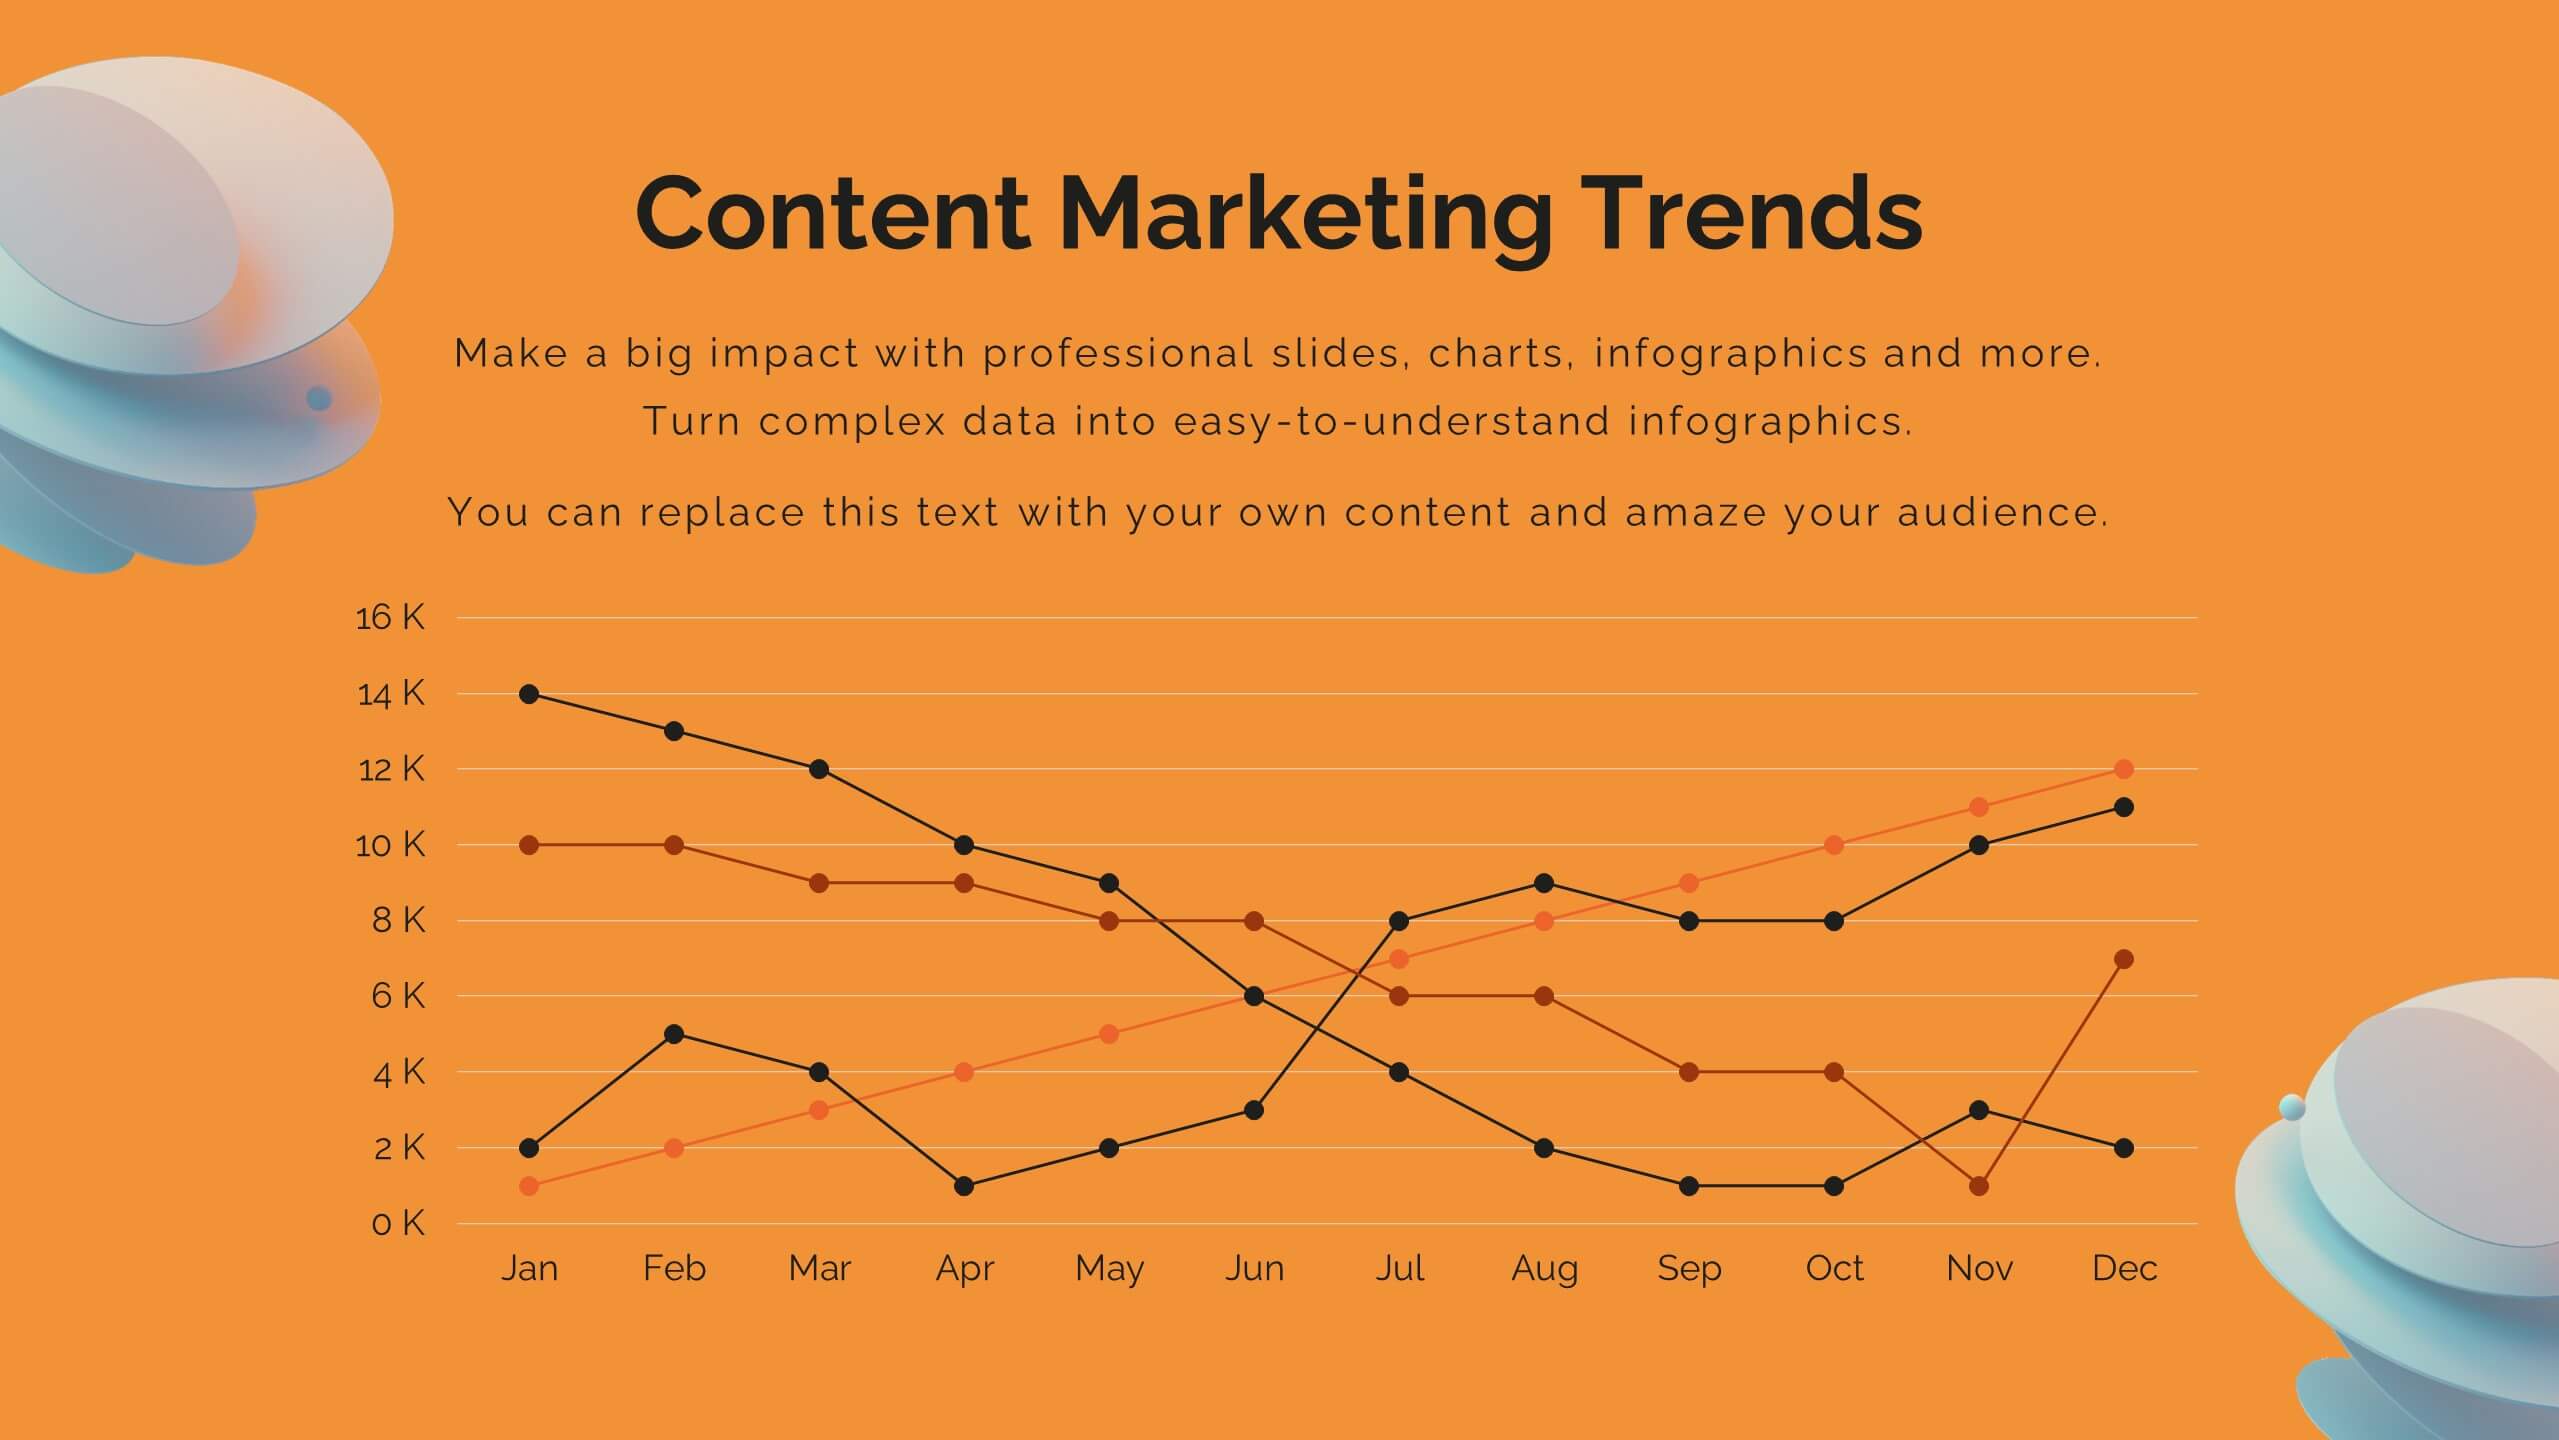
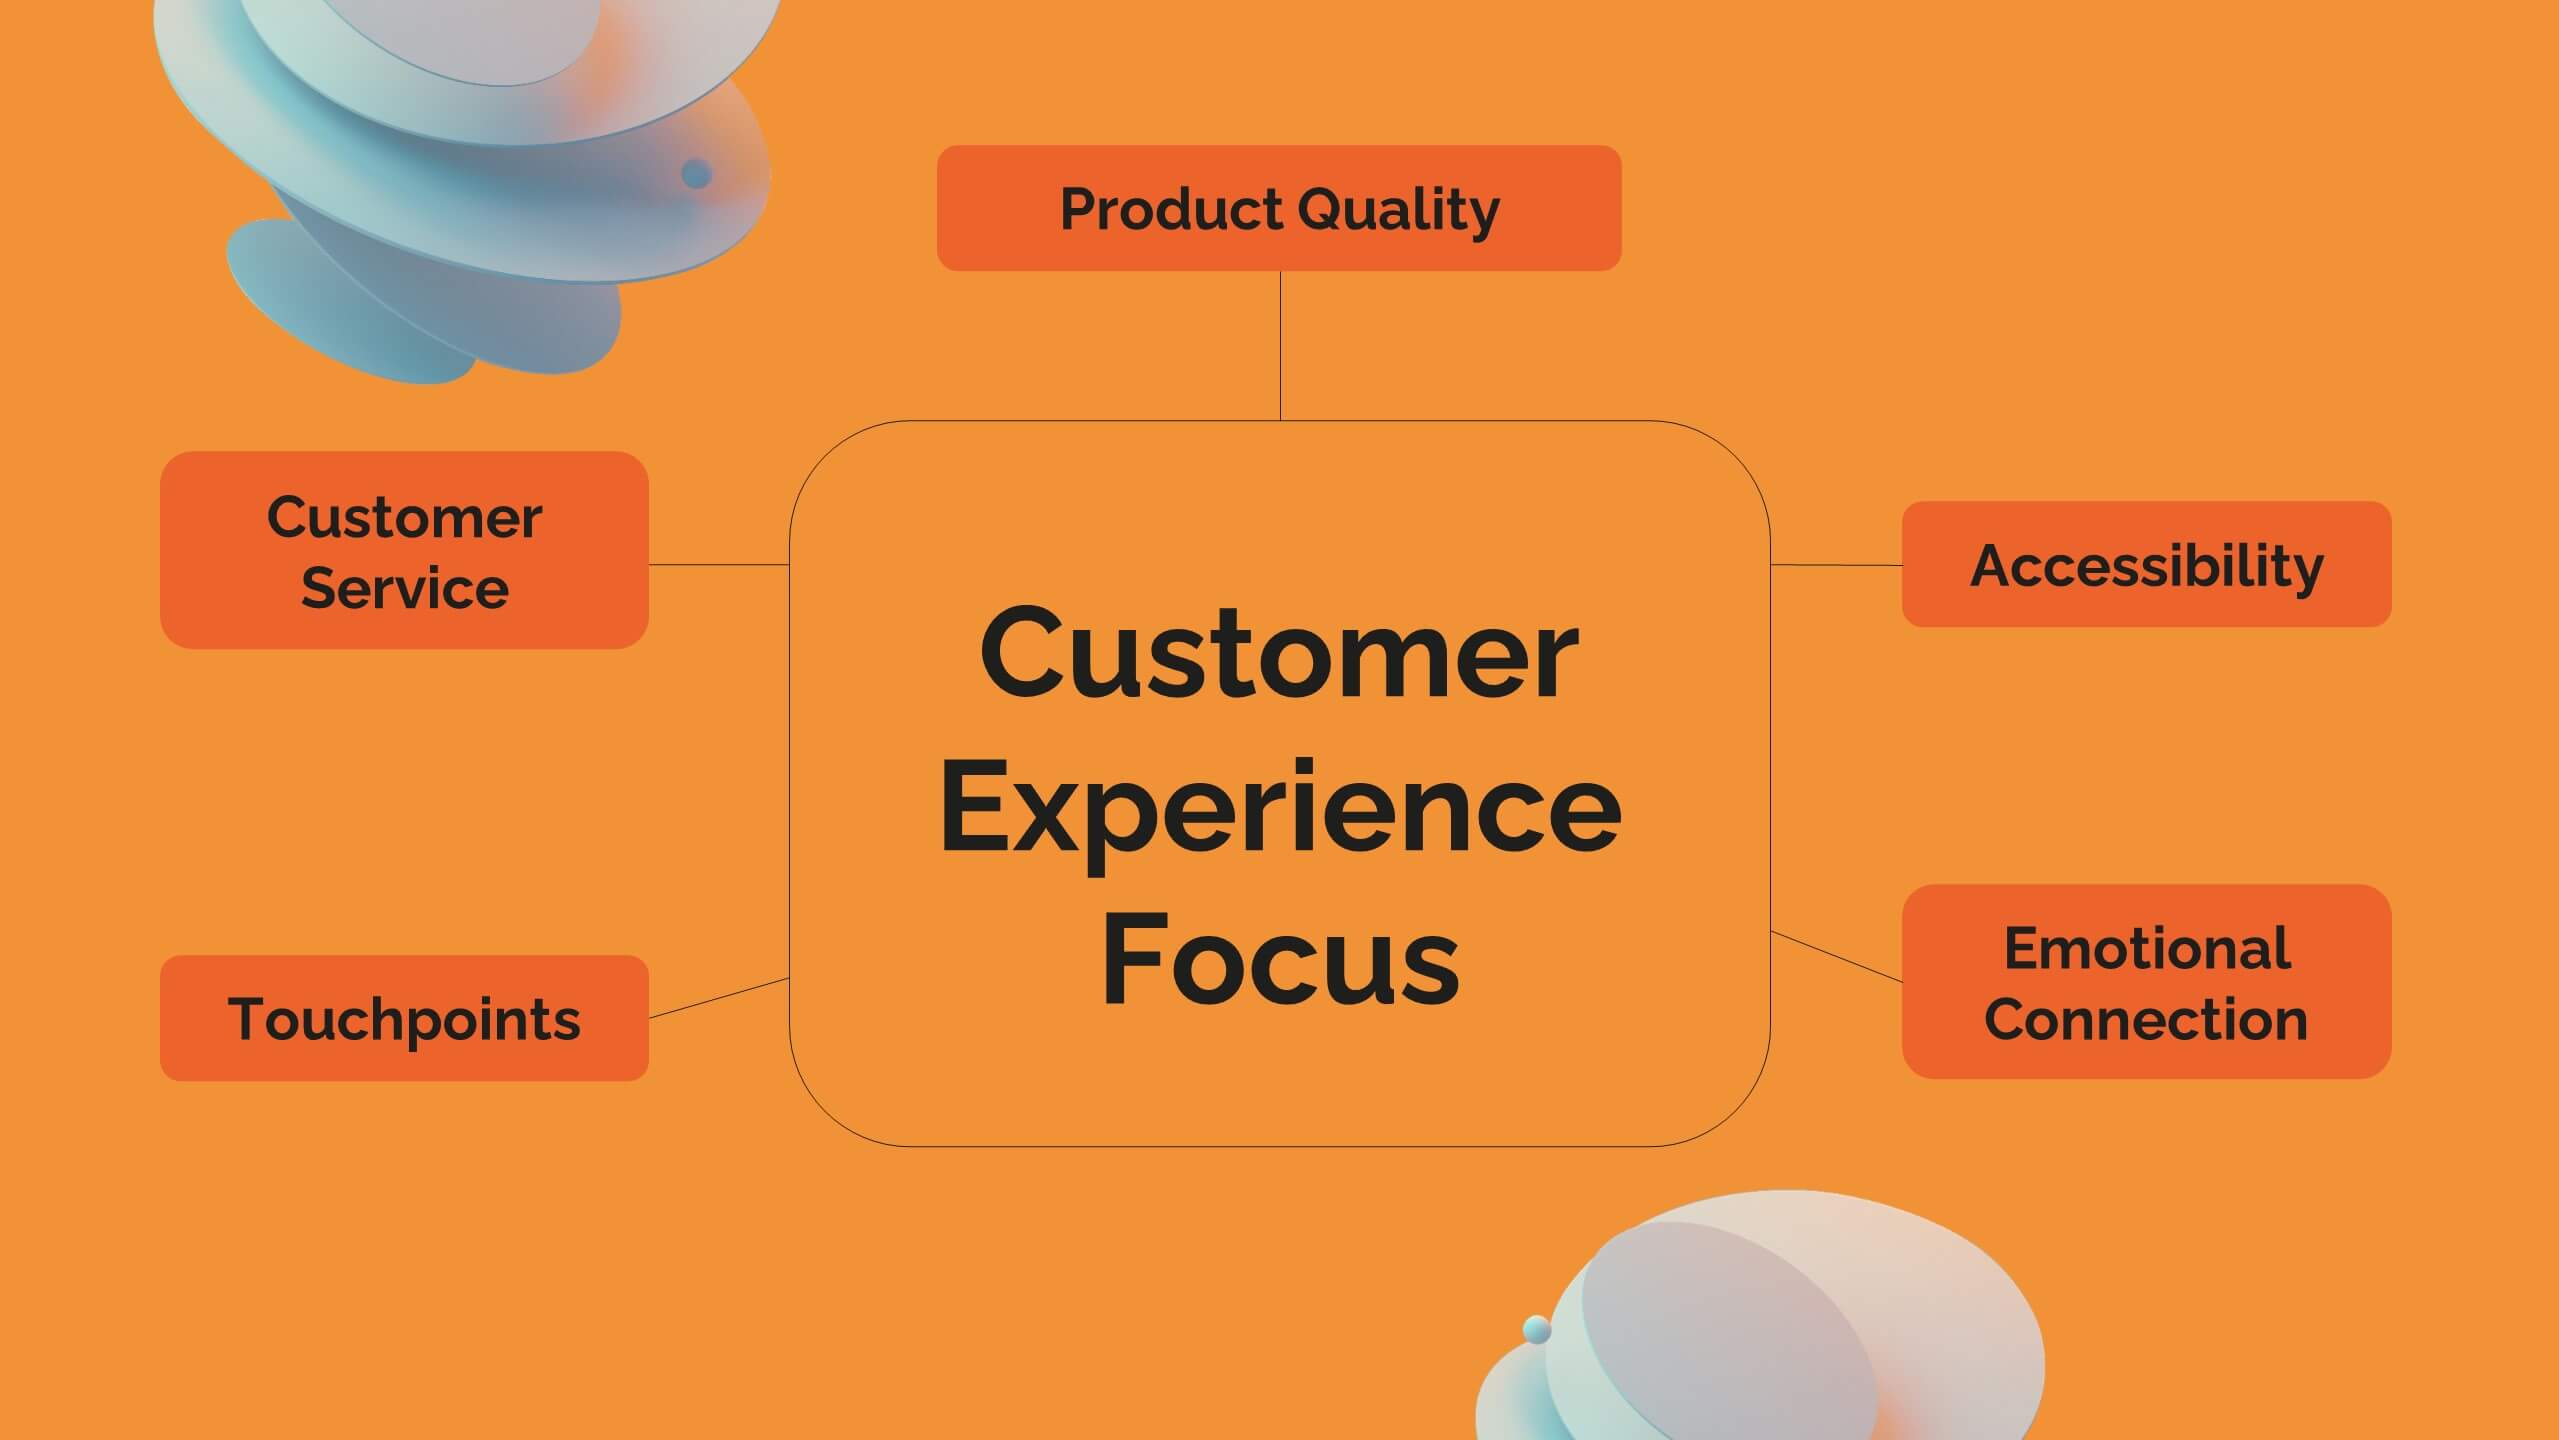
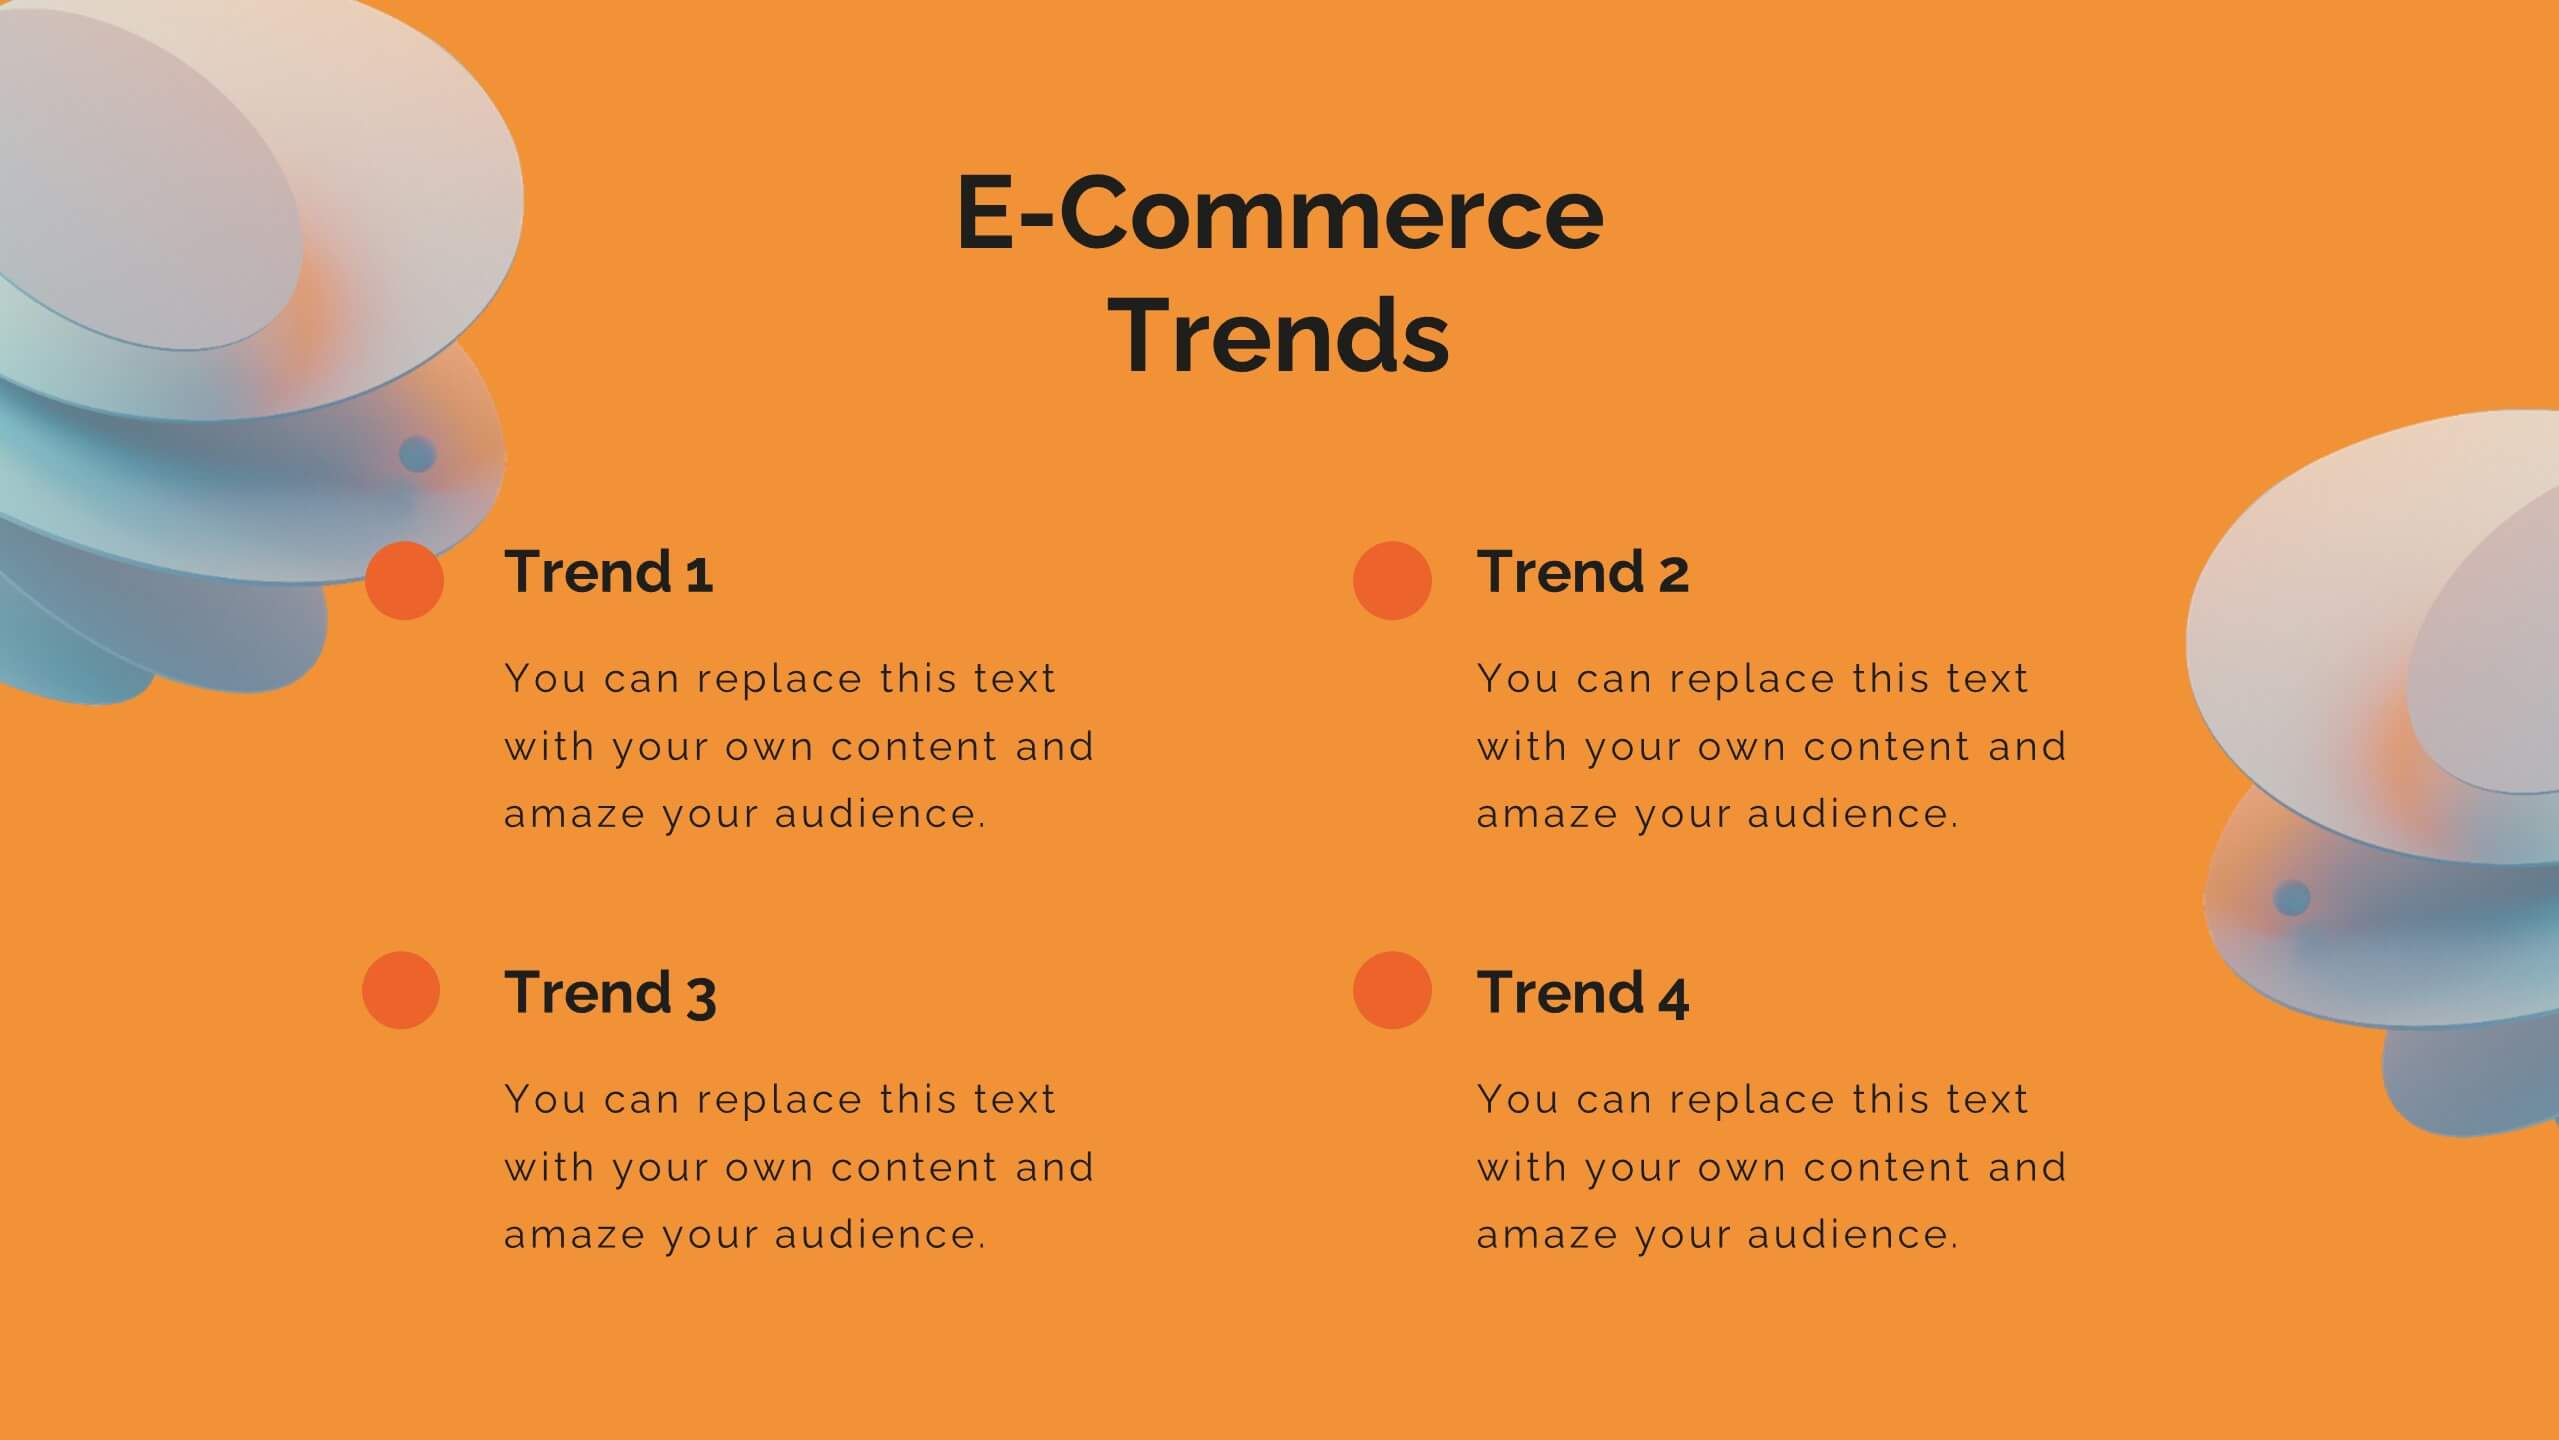
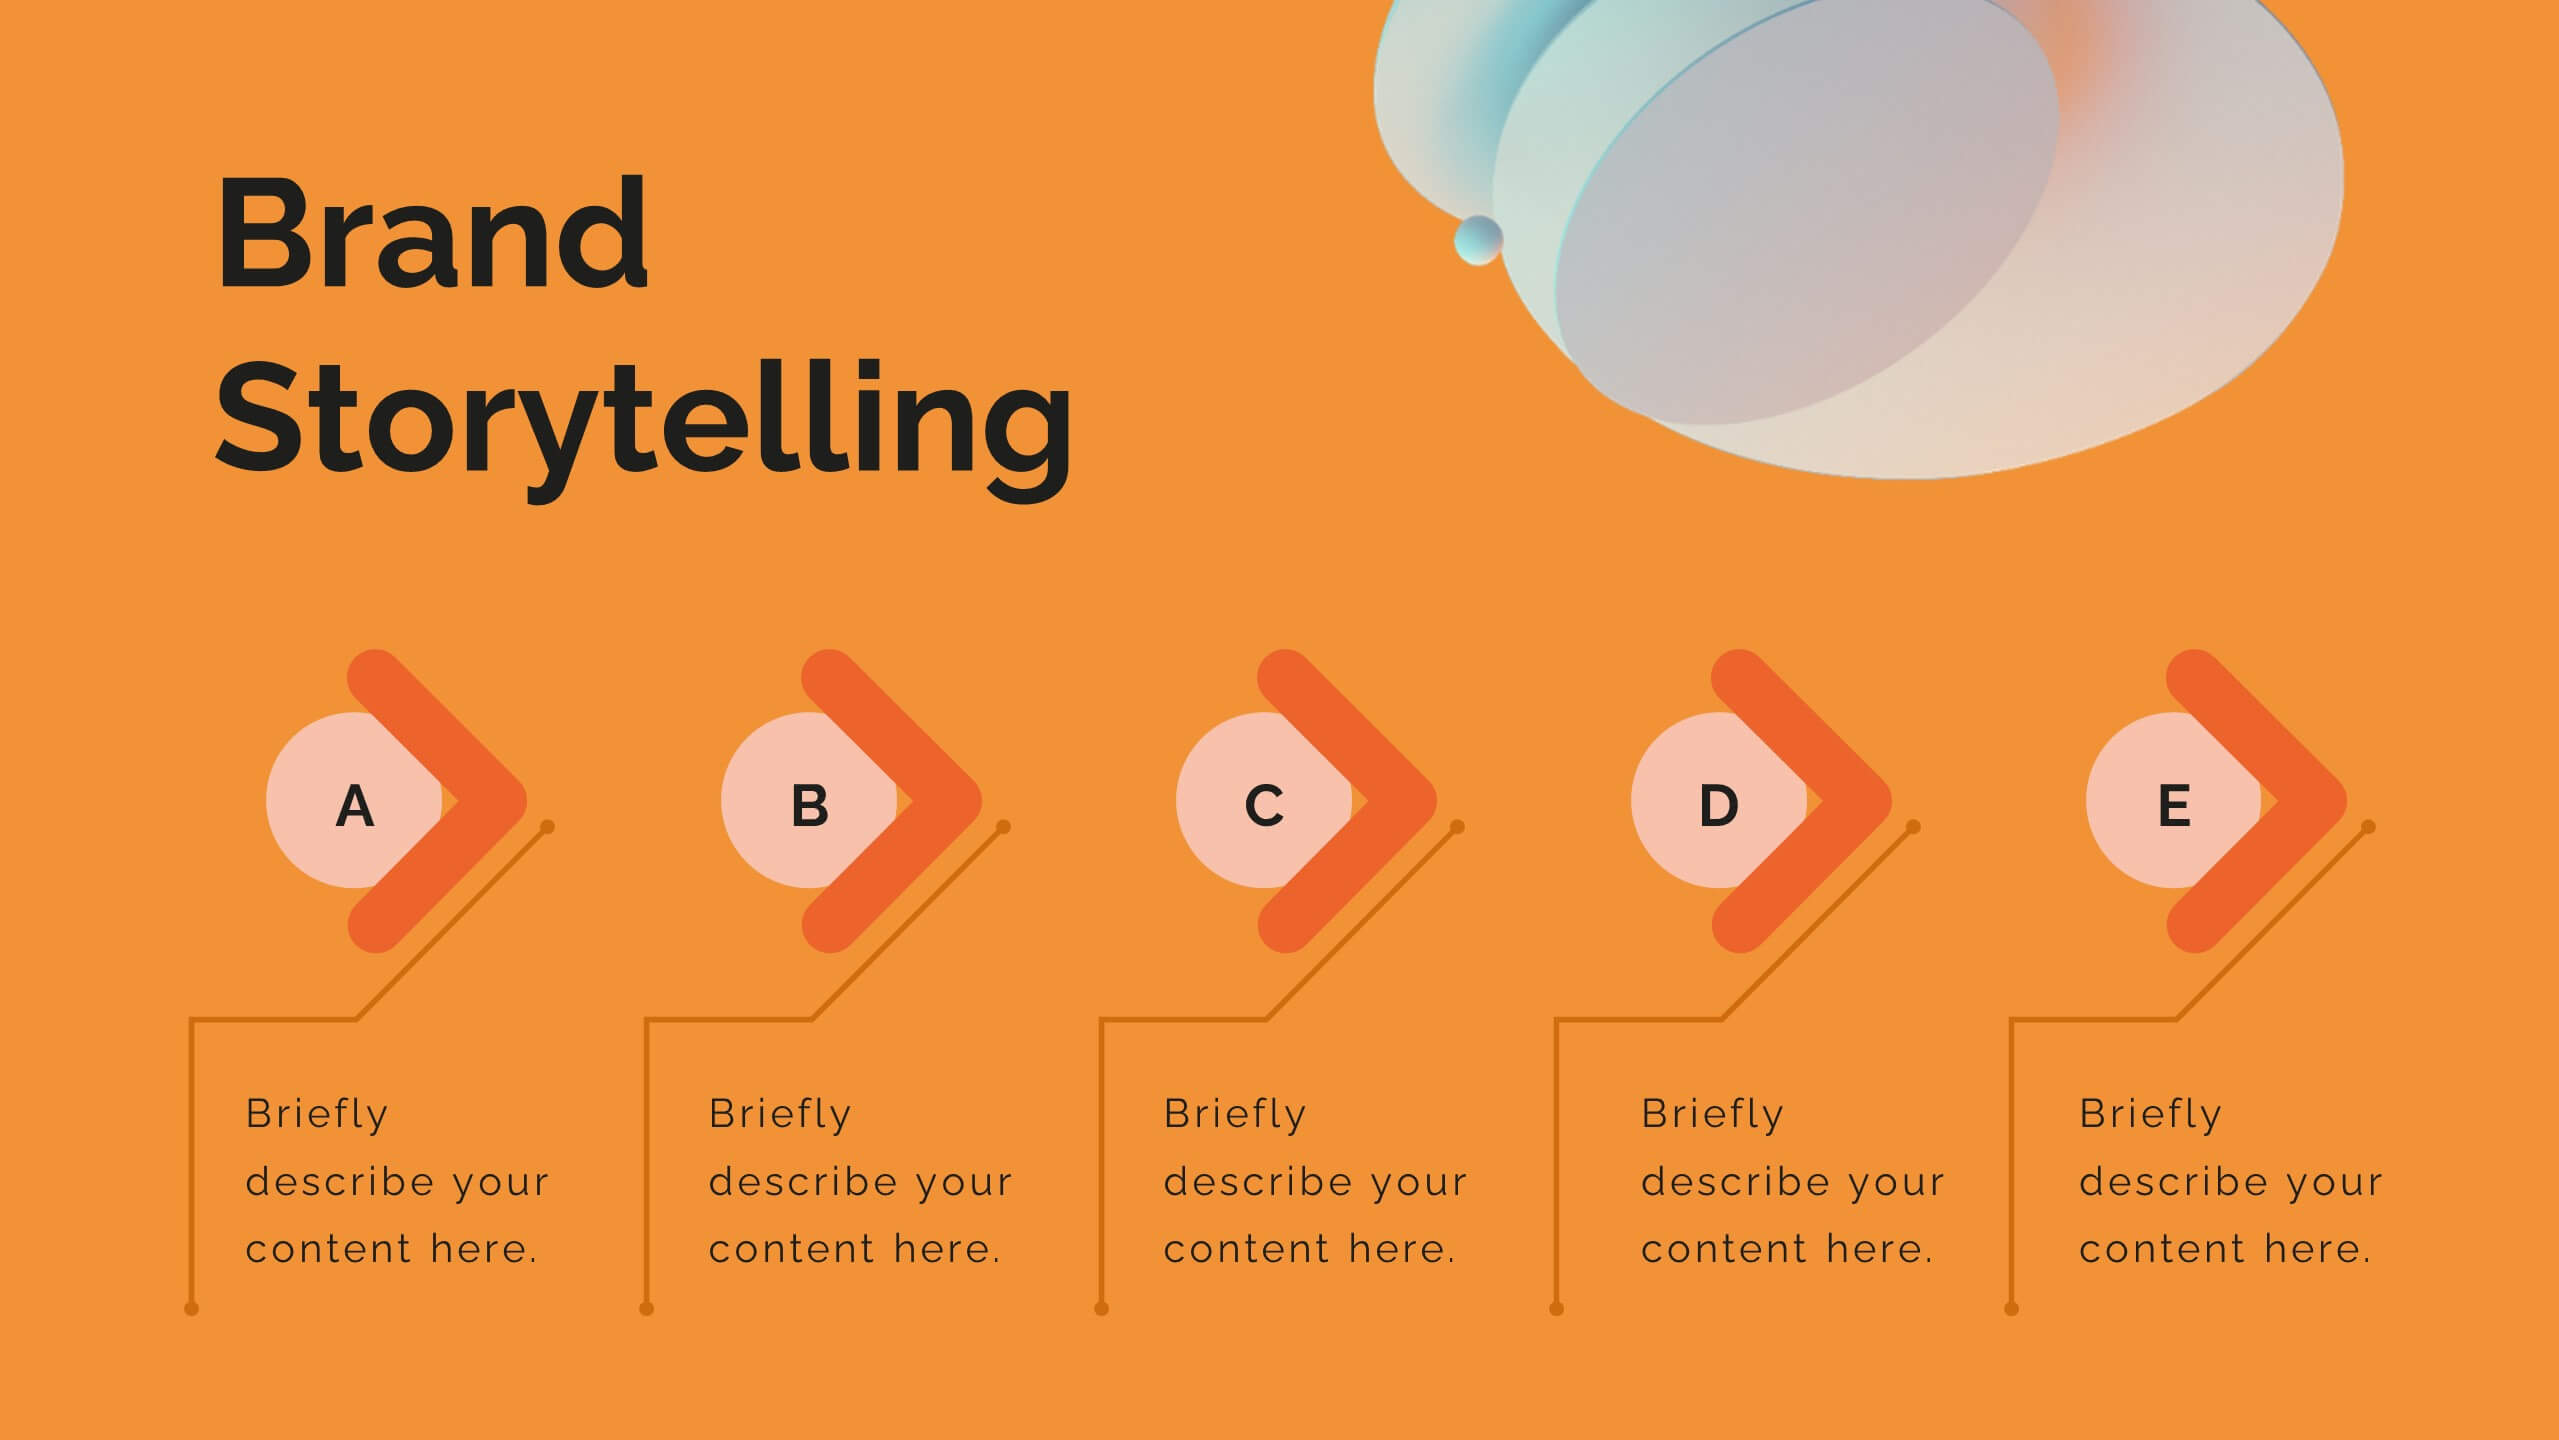
Breeze Content Marketing Pitch Deck Presentation
Elevate your content marketing strategy with this vibrant pitch deck! Perfect for outlining industry trends, consumer behavior, and innovative techniques. Ideal for marketers aiming to impress clients and stakeholders. Compatible with PowerPoint, Keynote, and Google Slides, this template ensures your pitch is engaging, persuasive, and professional. Achieve marketing success today!


6 slides
Results & Milestones Shown with Numbers
Track progress and showcase success with the Results & Milestones Shown with Numbers Presentation. This visual timeline highlights five key steps using numbered markers connected by a path—perfect for reporting achievements, product phases, or strategic milestones. Fully editable in PowerPoint, Keynote, and Google Slides.


6 slides
Discussion Starter and Inquiry Prompt Presentation
Kick off meaningful conversations with style and clarity. This discussion prompt slide uses a flowing layout and droplet-shaped icons to guide teams through key questions or ideas—ideal for brainstorming sessions, workshops, and meeting agendas. It’s a great way to visually organize dialogue. Fully compatible with PowerPoint, Keynote, and Google Slides.


7 slides
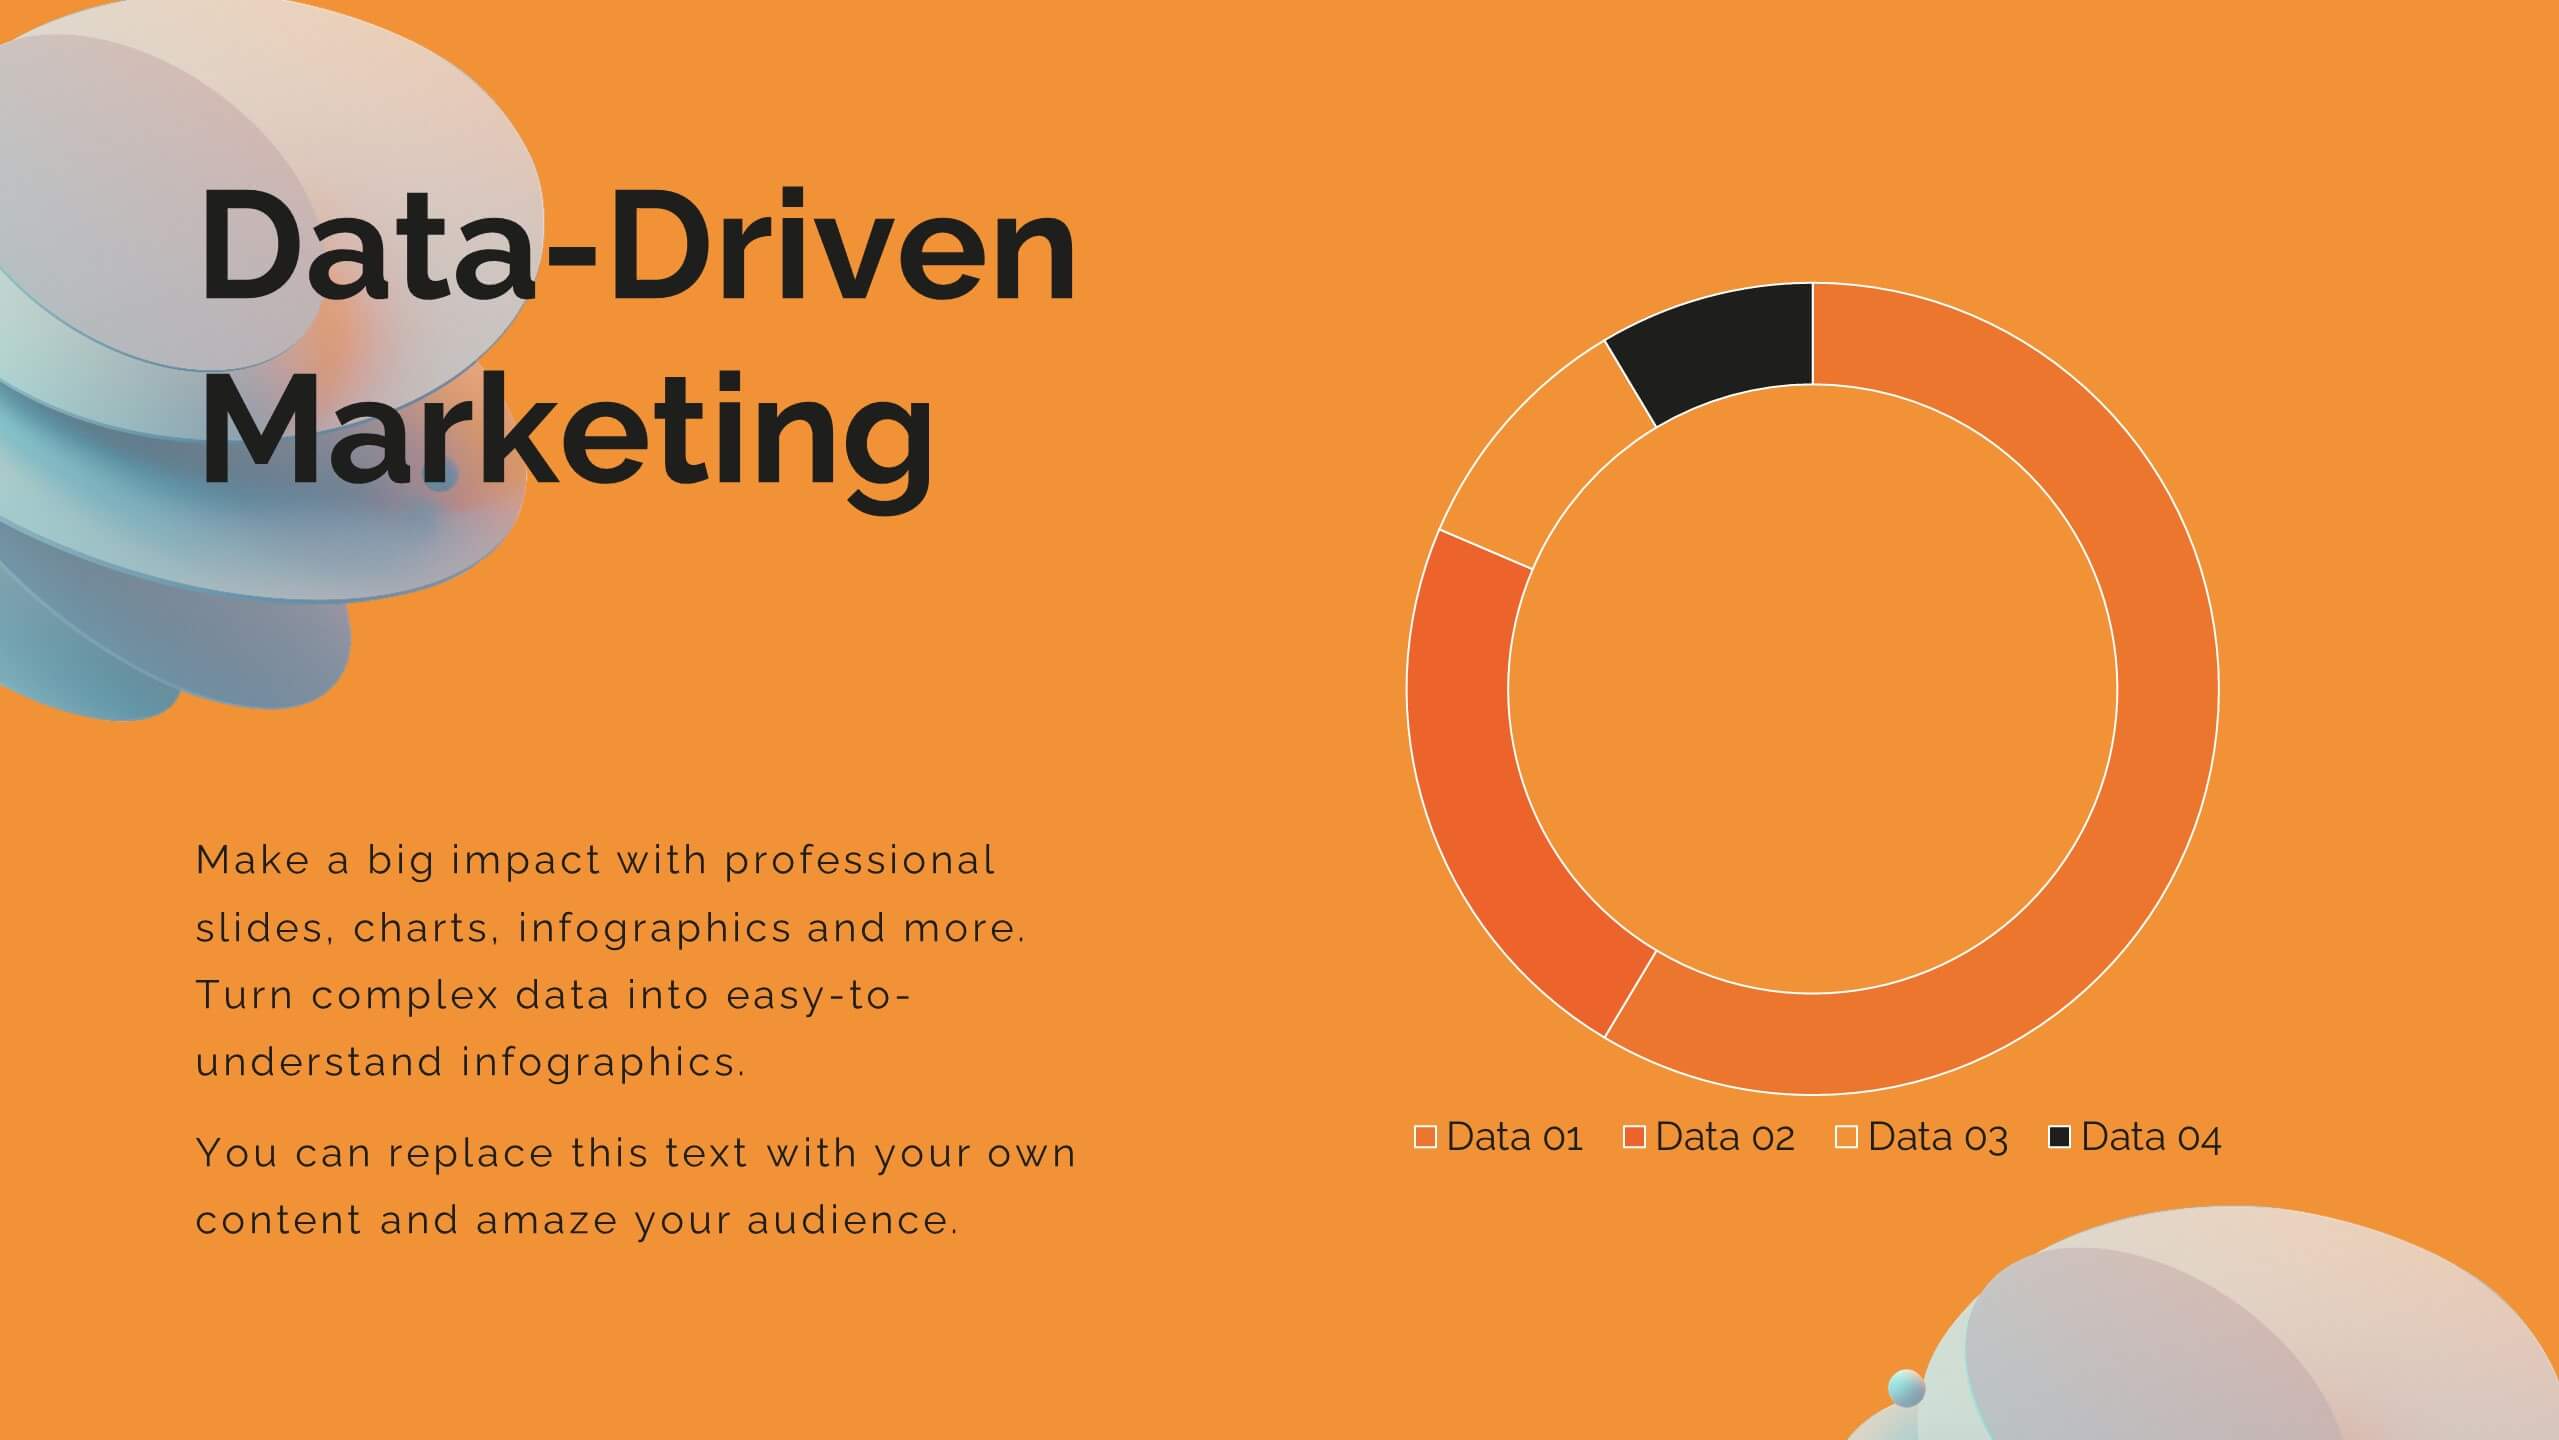
Data Analysis Research Infographic
A Data Analysis Research infographic is a visual representation of the key findings of a research study that used data analysis techniques. The purpose of this template is to provide a clear summary of the research study's most important results, making it easier for your viewers to understand and interpret the findings. This infographic include visualizations such as charts, graphs, icons, and tables that present key data points in a visually compelling way. This template is designed to highlight differences between groups or subgroups, or show how various factors are related to one another.