


Features
- 4 Unique slides
- Fully editable and easy to edit in Microsoft Powerpoint, Keynote and Google Slides
- 16:9 widescreen layout
- Clean and professional designs
- Export to JPG, PDF or send by email


Do you have any questions?
Recommend


7 slides
Budget Forecasting and Planning Infographic
The Budget Forecasting and Planning infographic template is designed to simplify financial planning and forecasting. It is compatible with PowerPoint, Google Slides, and Keynote. This set of slides offers a variety of charts, including bar graphs and dot matrices, to compare projected and actual budget figures over different periods. The template uses a color-coding system to differentiate between quarters or fiscal years, and it provides placeholders for detailed descriptions of budget items. It's an excellent tool for financial analysts, accountants, and business managers who need to present budget forecasts, variances, and financial strategies in a clear and visually engaging manner.


6 slides
Sales Associate Infographics
The "Sales Associate" infographic template is a vibrant and informative visual tool, meticulously crafted for PowerPoint, Keynote, and Google Slides. This template is an invaluable asset for retail managers, sales trainers, and marketing teams aiming to showcase the key responsibilities, skills, and performance metrics of a sales associate role. This template effectively highlights the diverse aspects of a sales associate's position, including customer service, product knowledge, sales techniques, and point-of-sale operations. It's designed to provide a comprehensive overview of the role, making it an essential tool for training new hires, setting performance standards, or enhancing sales strategies. The design is as engaging as the role itself, with a color scheme that is both lively and professional. This not only makes the presentation visually attractive but also resonates with the dynamic and customer-oriented nature of a sales associate's job. Whether used in a retail staff meeting, a training workshop, or a sales strategy session, this template ensures that the "Sales Associate" role is presented in a detailed, visually compelling, and easily understandable manner.


5 slides
Sub-Saharan Africa Region Presentation
Showcase regional insights with a sleek, professional map highlighting key areas across Africa’s southern nations. Ideal for presenting economic data, development initiatives, or regional comparisons, this layout balances clarity with visual impact. Fully compatible with PowerPoint, Keynote, and Google Slides for smooth editing and impactful presentations.


22 slides
Stormlight Qualitative Research Findings Presentation
This Qualitative Research Presentation Template is a dynamic and structured solution designed to present in-depth research findings, methodologies, and analysis. It covers key sections such as data collection, results interpretation, implications, and recommendations to deliver a comprehensive research overview. Perfect for academic, business, or market research purposes, and fully compatible with PowerPoint, Keynote, and Google Slides for easy customization.


4 slides
Innovative Business Solution Strategy
Present fresh, impactful ideas with this innovative business solution strategy slide. Featuring a creative lightbulb design, this template helps you showcase strategic solutions, key initiatives, or breakthrough concepts in a visually organized way. Perfect for startups, innovation workshops, and business growth meetings. Fully editable and compatible with PowerPoint, Keynote, and Google Slides.


23 slides
Pulse Project Status Report Presentation
This vibrant and sleek report template delivers a powerful visual impact while ensuring clear communication. Perfect for tracking progress, reviewing key metrics, and analyzing client feedback, it covers everything from project highlights to competitor insights. Compatible with PowerPoint, Keynote, and Google Slides, this template elevates every report presentation with professional flair!


6 slides
Meeting and Event Planning Schedule Presentation
Plan smarter and meet deadlines with the Meeting and Event Planning Schedule Presentation. This organized layout helps teams visualize phases, dates, and key activities at a glance—perfect for scheduling workshops, meetings, or launch events. Fully customizable in PowerPoint, Keynote, and Google Slides.


23 slides
Kale Market Research Presentation
Elevate your market research presentation with this sleek template! Includes sections for introduction, objectives, data collection, analysis, key findings, and recommendations. Perfect for presenting insights, implications, and future research directions. Compatible with PowerPoint, Keynote, and Google Slides, ensuring a visually appealing and professional look. Make your data shine!


4 slides
Athlete Training and Strategy Presentation
Present training performance and strategy benchmarks with this Athlete Training and Strategy slide. Featuring a sleek runner silhouette and gradient-colored progress bars, this layout lets you showcase four training pillars with accompanying metrics or KPIs. Ideal for coaching sessions, sports science reviews, or athlete development plans. Fully editable in PowerPoint, Keynote, and Google Slides.


5 slides
Pricing Strategy and Comparison Table Presentation
Present your pricing plans with clarity and impact using the Pricing Strategy and Comparison Table Presentation. This slide offers a structured layout to compare features, pricing tiers, and plan benefits side-by-side. Perfect for SaaS, services, or product pitches. Fully editable in Canva, PowerPoint, Google Slides, and Keynote.


7 slides
Goals Infographic Presentation Template
A goals infographic is a set of goals, objectives, or plans, often used for personal or organizational planning and development. This template allows you to include information about your specific goals, the steps required to achieve them, the timeline for completion, and any relevant metrics or targets. The purpose of our goals infographic is to help you provide a clear and concise overview of what is to be accomplished, and help you keep focus on achieving those goals. This well-designed infographic can help you prioritize and track progress, and can serve as a visual reminder.


4 slides
Insurance Services Overview Presentation
Present your offerings with clarity using this Insurance Services Overview slide. Ideal for explaining coverage tiers, policy types, or service options. The clean umbrella graphic adds a strong visual metaphor for protection. Fully customizable and compatible with PowerPoint, Keynote, and Google Slides for use across any insurance or finance presentation.


20 slides
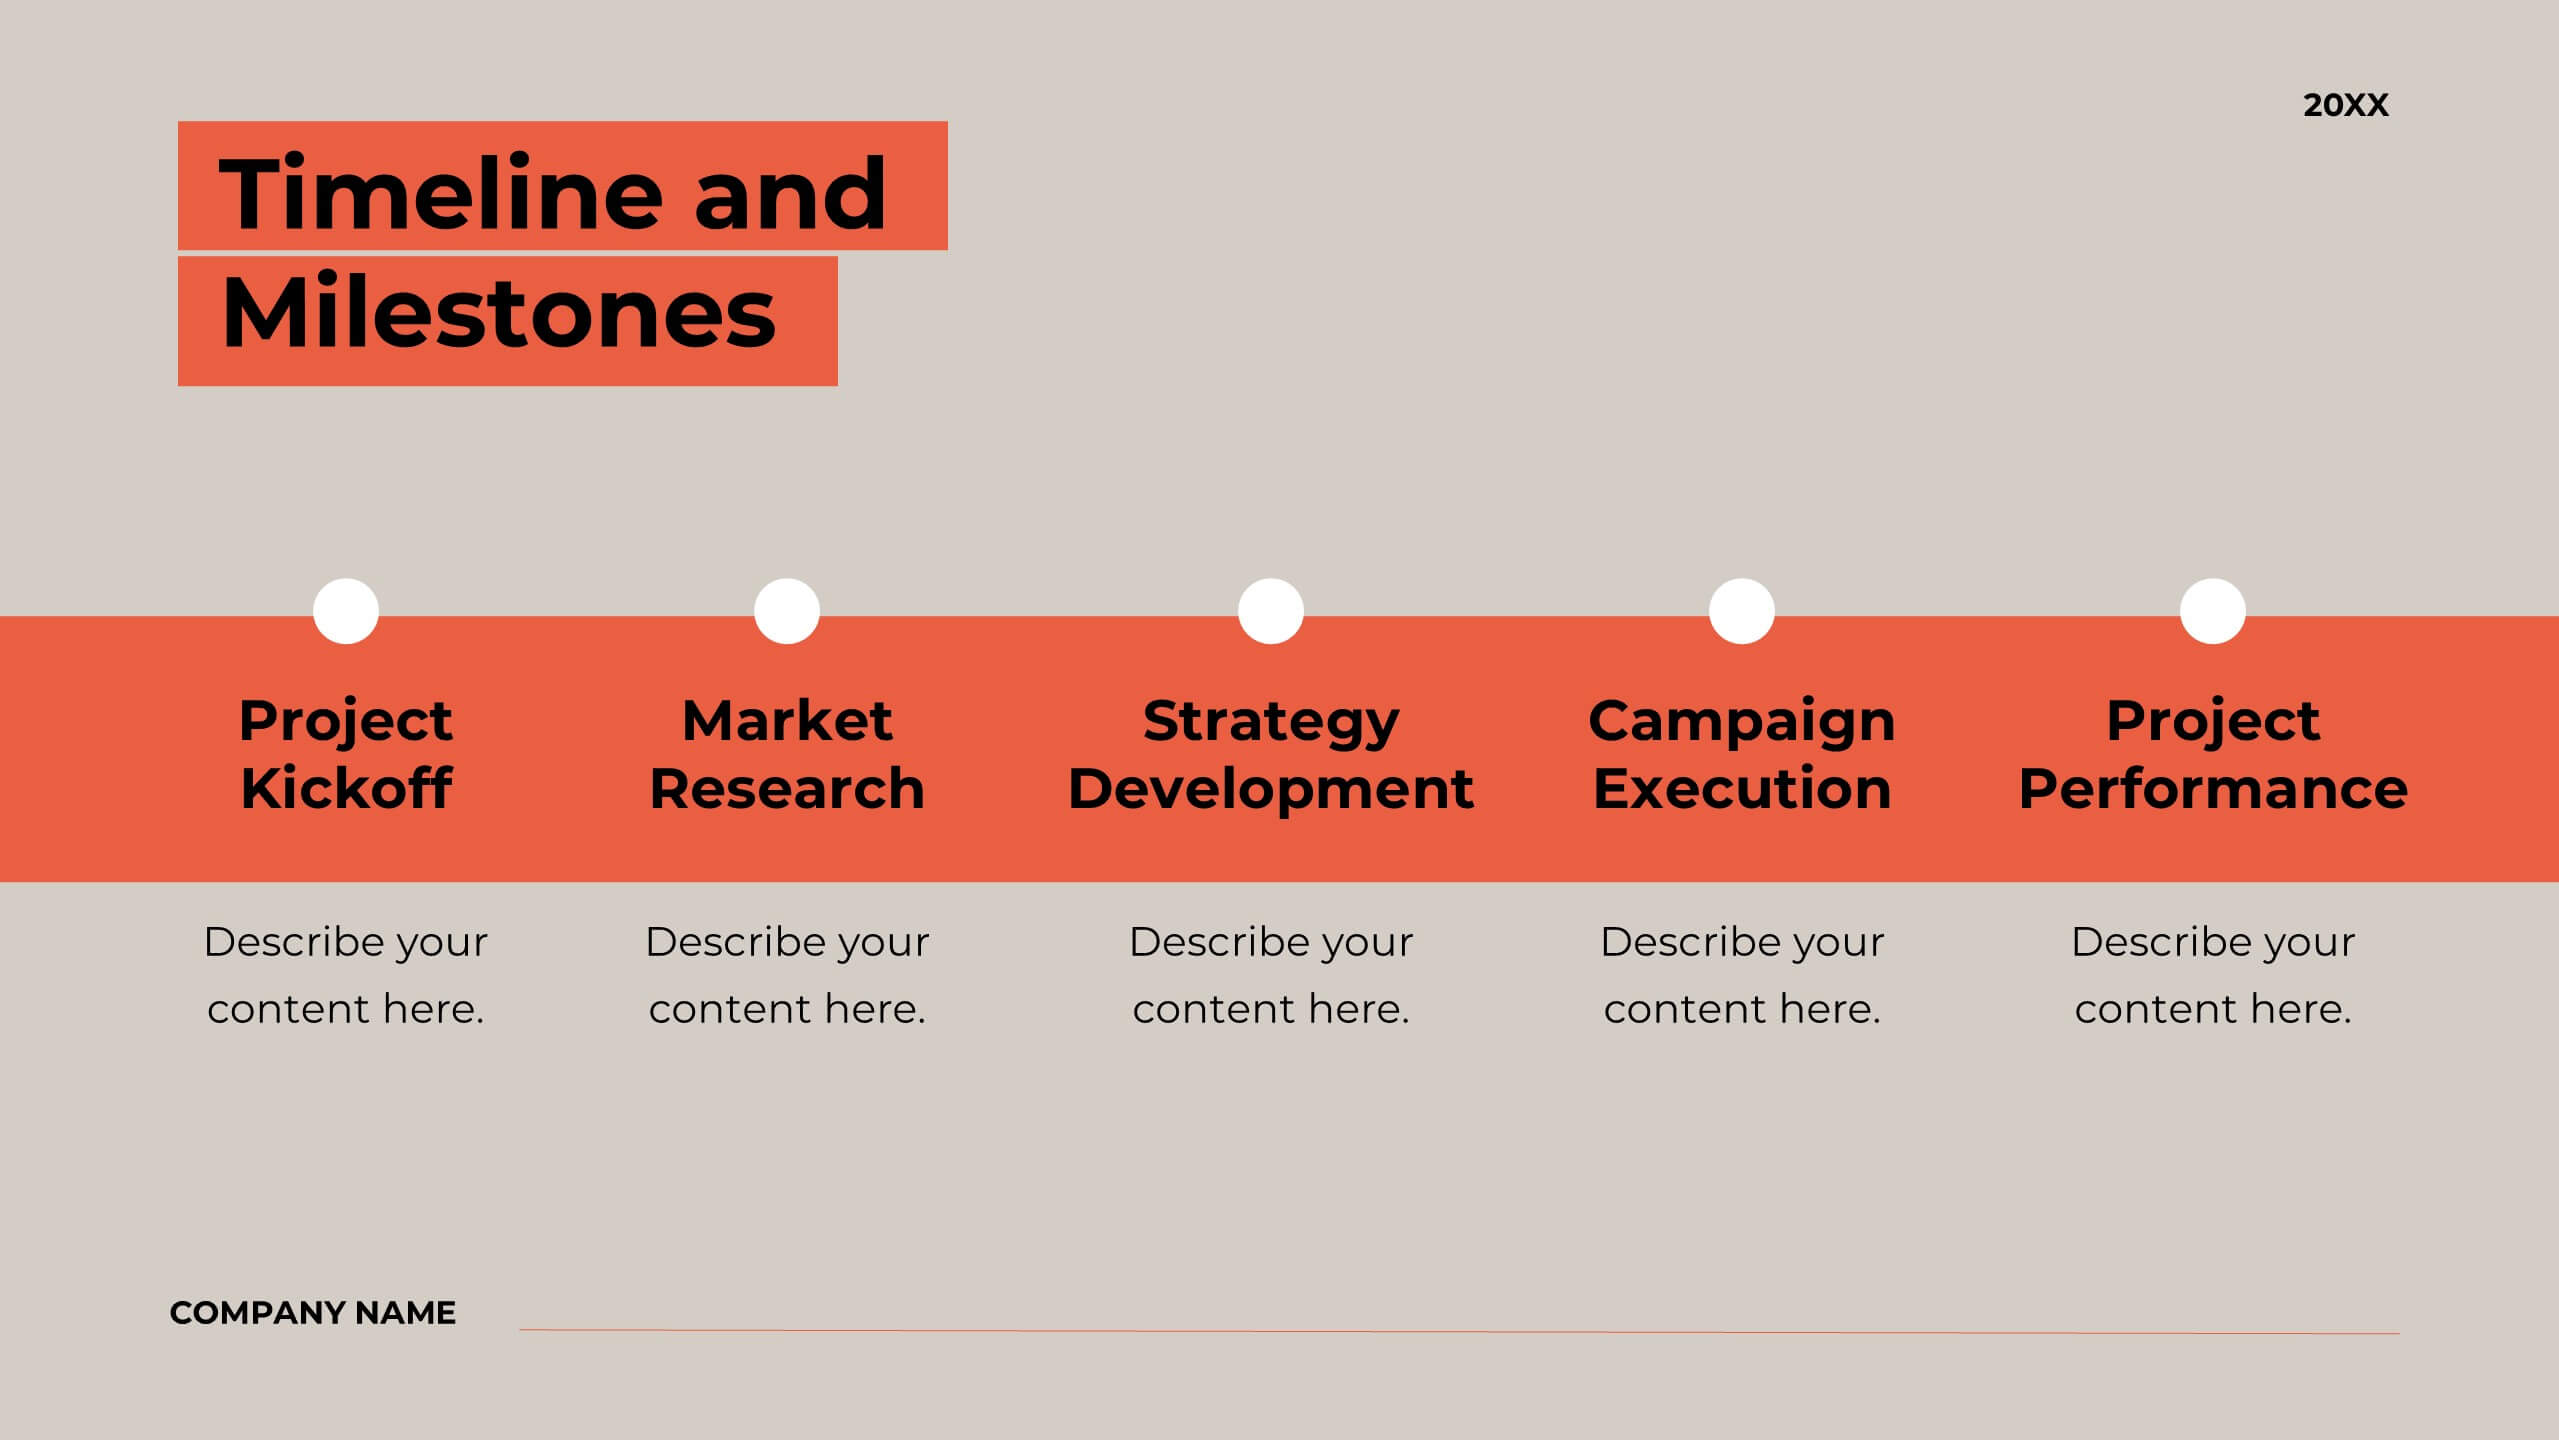
Bentom Marketing Proposal Presentation
This marketing proposal template is crafted to communicate your strategy with impact. With sections covering company overview, project summary, objectives, methodology, budget breakdown, and deliverables, it provides a professional layout for presenting key details to clients. Tailor it to fit your needs, and present confidently using PowerPoint, Keynote, or Google Slides.


4 slides
Personal Finance and Money Management Presentation
Effectively present Personal Finance and Money Management insights with this clean and professional slide template. Designed with a minimalist stopwatch infographic, this template helps visualize key financial principles like budgeting, saving, and investing. Fully customizable with editable text, colors, and icons, it’s perfect for business reports, financial workshops, or personal finance presentations. Compatible with PowerPoint, Keynote, and Google Slides for seamless editing.


21 slides
Dreameon Agency Portfolio Presentation
Showcase your agency's expertise with this sleek and modern portfolio presentation template. Designed to highlight your achievements, creative processes, and client success stories, this template offers a comprehensive layout that communicates professionalism and innovation. From introducing your team and services to detailing case studies and market analysis, each slide is meticulously crafted to leave a lasting impression. Display your strategy development, social media impact, and measurement analytics effectively, ensuring a cohesive narrative that resonates with your audience. Easily customizable and compatible with PowerPoint, Google Slides, and Keynote, this template is perfect for agencies looking to pitch their capabilities, attract new clients, or present project achievements with confidence.


4 slides
Professional Business Meeting Agenda Presentation
Efficiently structure your next corporate gathering with the "Professional Business Meeting Agenda" presentation template. Its geometrically appealing layout organizes discussion points in a visually captivating manner, encouraging effective communication and engagement. Perfect for strategizing sessions, this template ensures that every item on your agenda is highlighted with clarity. Compatible across PowerPoint, Keynote, and Google Slides, it’s designed to make every meeting more productive.


5 slides
Creative Watercolor Style Presentation
Splash your ideas onto the page with a layout that blends artistic watercolor accents and clean, modern structure. This presentation helps you showcase insights, steps, or concepts in a visually soothing format that feels both creative and professional. Ideal for storytelling or branding discussions. Fully compatible with PowerPoint, Keynote, and Google Slides.