


Features
- 5 Unique slides
- Fully editable and easy to edit in Microsoft Powerpoint, Keynote and Google Slides
- 16:9 widescreen layout
- Clean and professional designs
- Export to JPG, PDF or send by email


Do you have any questions?
Recommend


5 slides
Mind and Brain Creativity Concept Diagram Presentation
Ignite fresh thinking with the Mind and Brain Creativity Concept Diagram Presentation—a smart and visually engaging template that maps out five core concepts around a central brain icon. Each idea is linked with intuitive visuals and labeled A through E, ideal for creative strategy, innovation pitches, or mental model breakdowns. Fully customizable in PowerPoint, Keynote, and Google Slides.


6 slides
McKinsey 7S Model Articles Infographics
Explore the seven critical elements that make up the McKinsey 7S Model, including Strategy, Structure, Systems, Shared Values, Skills, Style, and Staff. Each of these components plays a vital role in shaping your company's success. This infographic is compatible with popular presentation tools like PowerPoint, Keynote, and Google Slides, making it effortless to incorporate into your next business presentation. Unlock the secrets of organizational effectiveness with this concise and visually appealing resource. Enhance your understanding of the McKinsey 7S Model and supercharge your company's performance today. Get ready to transform your business strategy with this user-friendly infographic.


20 slides
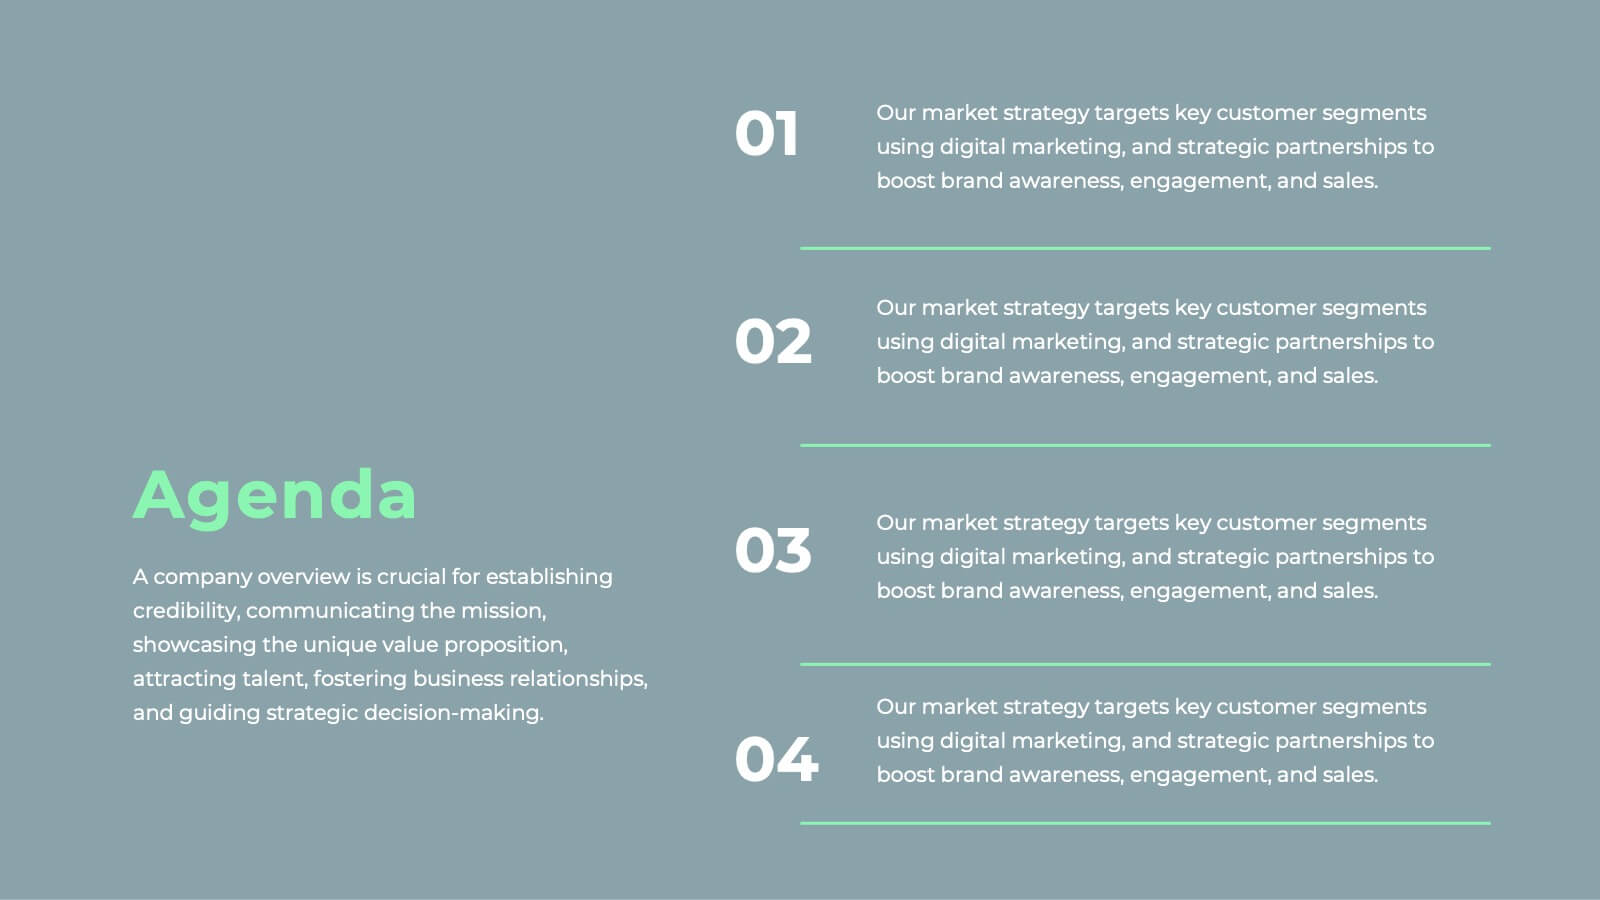
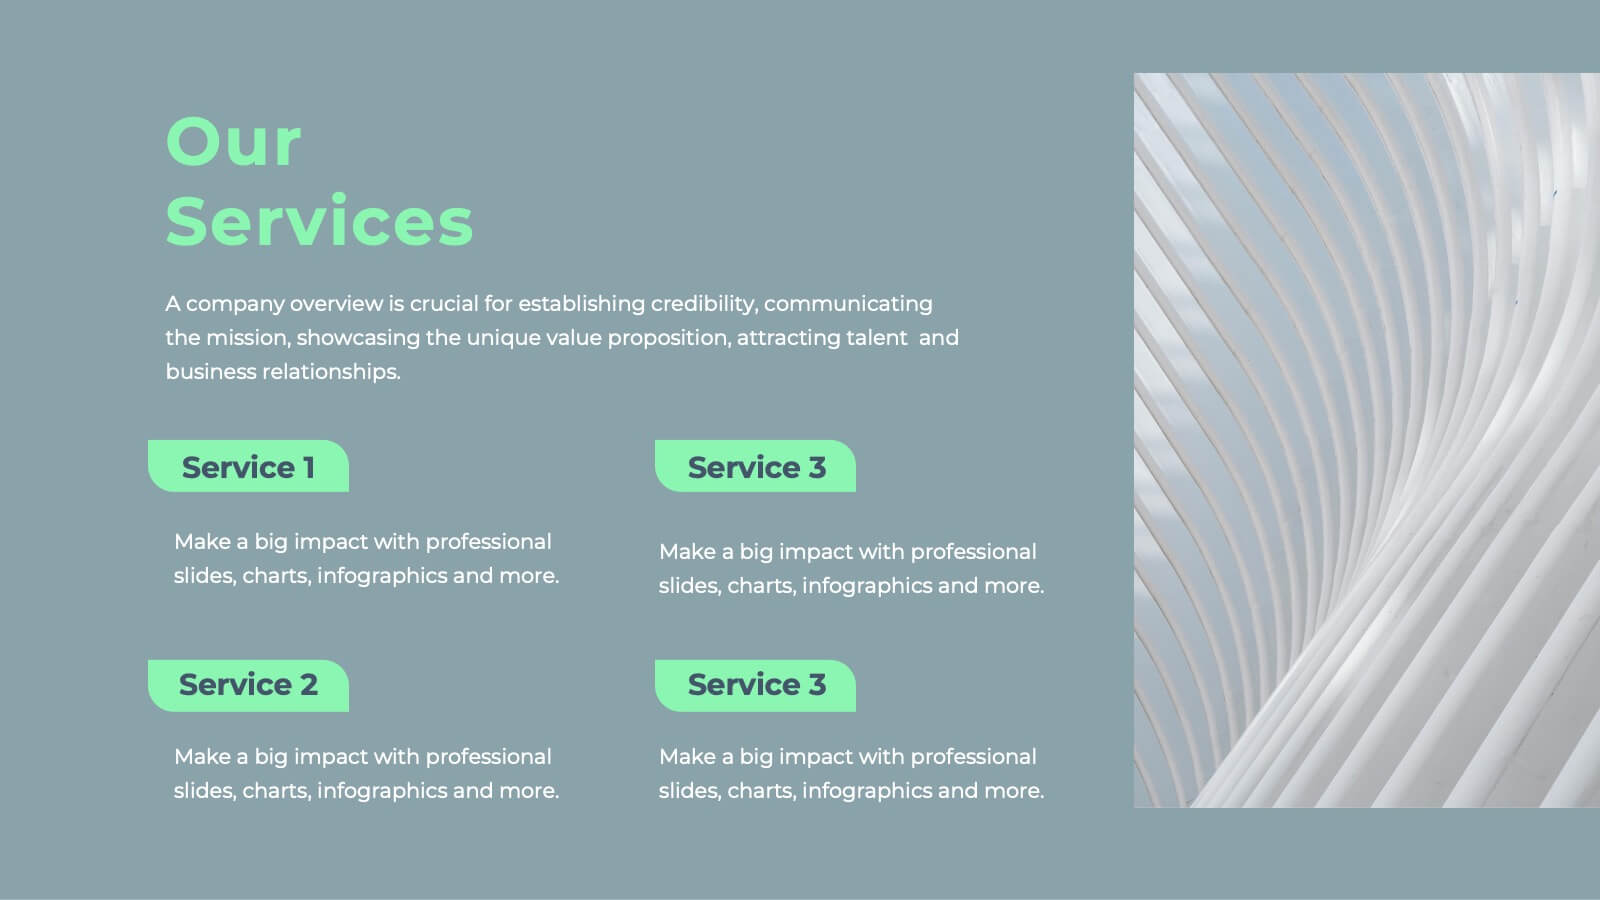
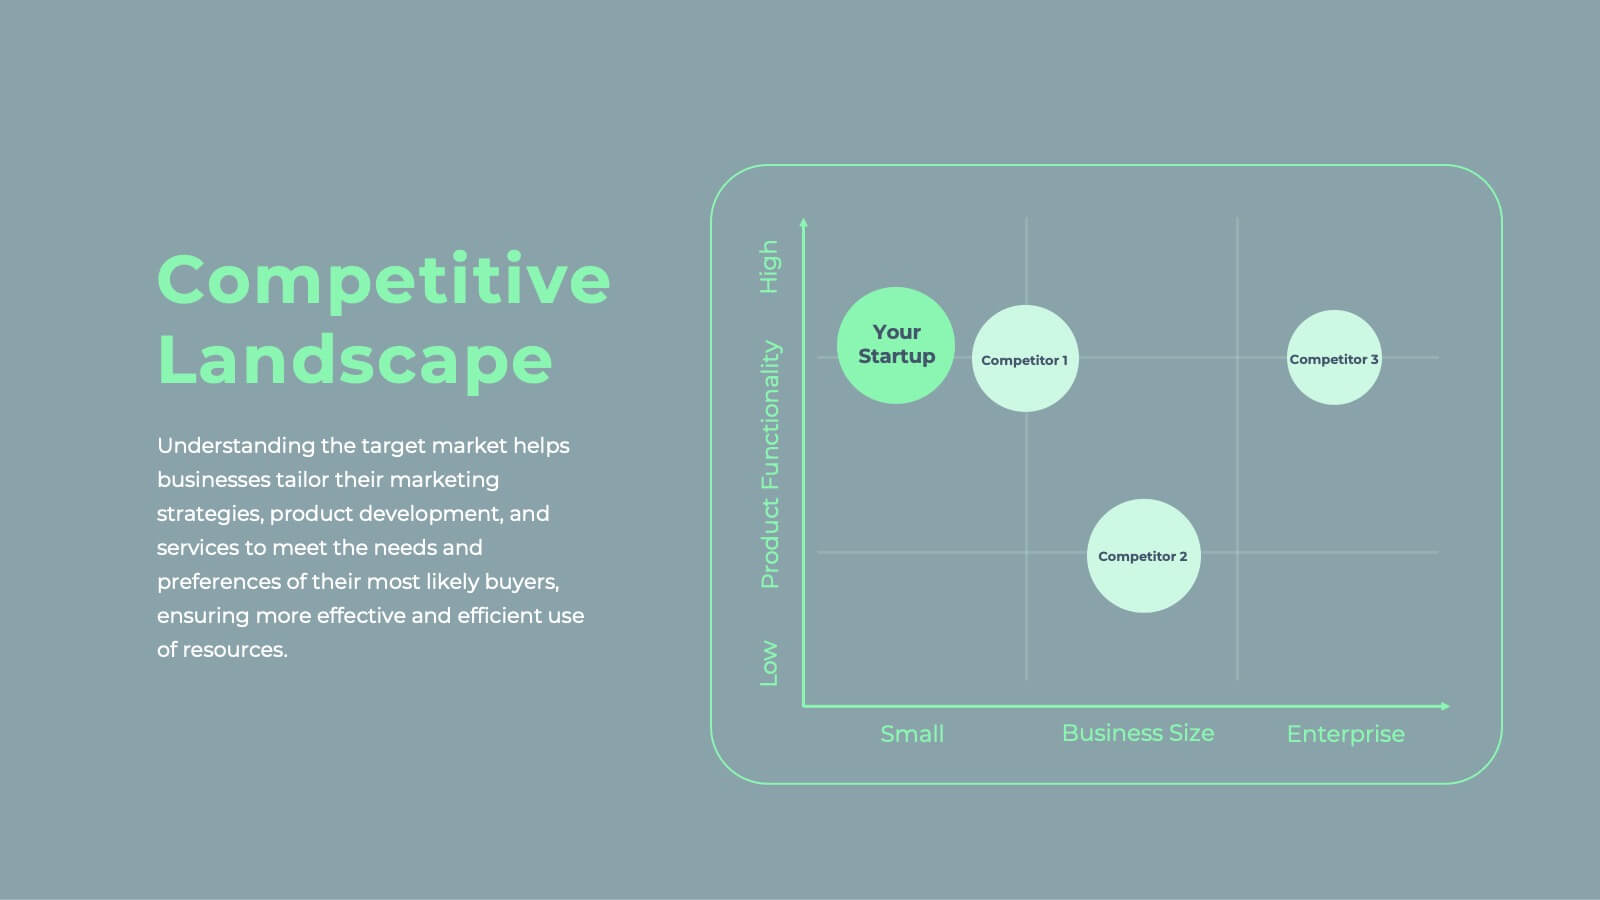
Javelin Sales Strategy Presentation
Boost your sales strategy with this sleek template! Perfect for outlining objectives, processes, performance metrics, and future opportunities. Tailored for impactful presentations to clients and teams. Fully customizable and compatible with PowerPoint, Keynote, and Google Slides.


22 slides
Stormlight Qualitative Research Findings Presentation
This Qualitative Research Presentation Template is a dynamic and structured solution designed to present in-depth research findings, methodologies, and analysis. It covers key sections such as data collection, results interpretation, implications, and recommendations to deliver a comprehensive research overview. Perfect for academic, business, or market research purposes, and fully compatible with PowerPoint, Keynote, and Google Slides for easy customization.


4 slides
HR Onboarding and Hiring Plan Deck Presentation
Streamline recruitment and training workflows with the HR Onboarding and Hiring Plan Deck. This presentation template helps visualize hiring stages, orientation paths, and employee milestones using structured flowcharts. Ideal for HR professionals and team leads. Fully editable in PowerPoint, Keynote, and Google Slides for easy customization and organizational branding.


6 slides
Monthly Agenda and Events Presentation
The "Monthly Agenda and Events" presentation template features a calendar format, segmented by months, for detailed planning and tracking of events. Each month is color-coded for easy reference and contains placeholders for listing specific tasks or events. This template is perfect for individuals and teams who need to organize and visualize monthly activities, providing a clear overview of upcoming commitments and timelines, ensuring that all events and tasks are completed efficiently throughout the year.


6 slides
High-Performance Team Building Presentation
Boost team efficiency with the High-Performance Team Building presentation template. Designed to visualize team development stages, leadership strategies, and collaboration efforts, this template is perfect for managers, HR teams, and trainers. The pyramid and rocket-themed design illustrates goal progression, making it easy to track growth. Fully customizable and compatible with PowerPoint, Keynote, and Google Slides.


4 slides
Project Responsibility Assignment Matrix Presentation
Visualize team roles and task accountability at a glance with this Project Responsibility Assignment Matrix. This structured layout categorizes assignments using the RACI model—Responsible, Accountable, Consulted, and Informed—organized by team and position. Ideal for project managers, team leads, and operations planners, it helps ensure clarity, reduce overlap, and promote accountability across departments. Easily editable in PowerPoint, Keynote, and Google Slides for seamless customization and cross-platform use.


7 slides
Subsistence Agriculture Infographic
Bring the essence of sustainability to your presentations with our Subsistence Agriculture infographic, designed for seamless integration with Powerpoint, Keynote, and Google Slides. This infographic is perfect for educators, agricultural professionals, and sustainability advocates who need to convey the importance of self-sufficient farming practices and their impact on local communities. Our Subsistence Agriculture infographic illustrates the fundamentals of agriculture that relies on the self-production of food by individuals and small communities. It highlights how this method supports sustainability, food security, and ecological balance. The visually engaging elements emphasize traditional farming techniques, crop diversity, and the role of agriculture in rural livelihoods. By incorporating this infographic into your presentations, you present a compelling narrative on the significance of subsistence farming in today's world. It not only educates your audience on the basics but also inspires discussions on the broader implications for global food systems. Use this infographic to effectively communicate the value of subsistence agriculture in maintaining community resilience and environmental stewardship.


5 slides
Movies & Film Market Infographics
Step into the spotlight with our movies & film market infographics, designed to orchestrate your data into a cinematic experience. In the enchanting hues of blue and purple, this template captures the essence of the big screen, offering a vertical layout that resonates with the the film industry. It's a tool for film marketers, and cinema analysts, providing a platform to depict trends, and reviews with a touch of Hollywood style. The set includes captivating graphics, themed icons, and adaptable image placeholders, all curated to help you direct your audience's attention to key insights in the ever-evolving realm of movies and entertainment.


26 slides
Hypnosia Brand Guidelines Proposal Presentation
This Brand Guidelines Proposal Template provides a sleek, professional layout to showcase key branding elements like vision, values, identity, and strategy. Perfect for businesses and agencies, it ensures brand consistency. Fully customizable and compatible with PowerPoint, Keynote, and Google Slides for seamless adaptation to your brand’s style.


6 slides
Lean Business Canvas Framework
Simplify your business strategy with the Lean Business Canvas Framework Presentation. This slide offers a structured layout to map out key elements like partners, activities, value propositions, customer segments, and revenue streams—all in one view. Ideal for startups, business plans, or internal strategy sessions. Fully editable in PowerPoint, Keynote, and Google Slides.


4 slides
Device Mockup Display Slide Presentation
Showcase your digital products with this device mockup slide. Ideal for highlighting landing pages, dashboards, or app interfaces, the layout includes clean typography and vibrant shapes for visual balance. Fully editable in PowerPoint, Keynote, and Google Slides—customize text, colors, and images to fit your tech brand or presentation style.


12 slides
Cloud-Based Digital Transformation Presentation
Illustrate your path to digital evolution with this multi-cloud infographic layout. Perfect for visualizing service integrations, SaaS environments, or migration strategies, this slide highlights five key areas of transformation using cloud-shaped icons and a central connectivity hub. Fully customizable in PowerPoint, Keynote, and Google Slides.


5 slides
Health Care Infographics
Taking care of your health is an investment in your future self and can lead to a happier and more fulfilling life. These vertical health care infographics are visual representations of information related to health care. They can cover a wide range of topics, such as disease prevention, medical treatments, and patient care. These are designed to be easily understandable and engaging for a general audience. They use colorful graphics and illustrations to convey complex information in an eye-catching manner. These also include graphs, diagrams text boxes, and other design elements to highlight key information.


3 slides
Triangle Diagram for Strategic Layers Presentation
Visualize interconnected processes or layered strategies with the Triangle Diagram for Strategic Layers Presentation. This slide features three dynamic triangle shapes arranged in a circular flow, perfect for representing cycles, frameworks, or pillars of a system. Each point includes space for a title, icon, and supporting text. Great for illustrating collaboration, dependencies, or strategic pillars. Compatible with PowerPoint, Keynote, and Google Slides.


8 slides
Business Data Analytics Dashboard
Monitor performance with clarity using this Business Data Analytics Dashboard. Featuring data bars, numeric highlights, and color-coded insights, this slide is perfect for quarterly updates, data reviews, or executive summaries. Clean and professional, it's fully editable in PowerPoint, Keynote, and Google Slides.